market and process analysis for the development of an
TRANSCRIPT

Market and process analysis for the development of an innovation process in a
software company
Master thesis of
Stefan Papst
University of Technology Graz Faculty of Mechanical Engineering and Economic Sciences
Institute of Business Economics and Industrial Sociology O.Univ.-Prof. Dipl.-Ing. Dr.techn. Ulrich Bauer
Graz, in May 2019


In cooperation with:
CodeFlügel GmbH

I
EIDESSTATTLICHE ERKLÄRUNG Ich erkläre an Eides statt, dass ich die vorliegende Arbeit selbstständig verfasst, andere als die angegebenen Quellen/Hilfsmittel nicht benutzt und die den benutzten Quellen wörtlich und inhaltlich entnommene Stellen als solche kenntlich gemacht habe. Graz, am …………………………… ……………………………………………….. (Unterschrift) STATUTORY DECLARATION I declare that I have authored this thesis independently, that I have not used other than the declared sources/resources, and that I have explicitly marked all material which has been quoted either literally or by content from the used sources. …………………………… ……………………………………………….. date (signature)

II
Kurzfassung Innovation ist heutzutage für Unternehmen oft ein Muss, um neue Kunden und Partner in ihr Unternehmen zu holen. Gerade im dynamischen und sich schnell verändernden Umfeld der Softwareentwicklung ist die ständige Verbesserung des Status quo durch die Entdeckung neuer Technologien, Frameworks und Nischen unerlässlich für die langfristige Wettbewerbsfähigkeit des Marktes. Die Umsetzung eines Innovationsprozesses ist daher entscheidend, um den Überblick über die aktuellen Produkte, Technologien und Branchen zu behalten und die richtigen Innovationen zur richtigen Zeit umzusetzen. In Zusammenarbeit mit dem Software-Dienstleister CodeFlügel GmbH wird in diesem Projekt ihr aktueller Technologie-Stack zur Umsetzung von Kundenprojekten bewertet. Zusätzlich wird der Markt für Trendforschungsberater im Hinblick auf eine Kooperation bewertet. Auf dieser Grundlage konzentriert sich das Dokument auf den Innovationsprozess, der auf das Umfeld eines kleinen Unternehmens zugeschnitten ist. Der Output eines Innovationsprozesses hängt stark von der Definition von Innovation und der Vision des Unternehmens selbst ab. So wird dieser Faktor detailliert skizziert und bei der Konstruktion berücksichtigt. Schließlich wird ein umsetzungsreifer Prozess definiert, der beschreibt, wie man mit unternehmensneuen Ideen - basierend auf internen und externen Ressourcen - umgeht und damit eine bessere Marktposition, eine Effizienzsteigerung und eine öffentliche Wahrnehmung als Innovationspartner verspricht.

III
Abstract
Nowadays, being innovative is often a must-have for companies in order to bring new customers and partners to their business. Especially in the dynamic and fast changing environment of software development, steadily improving the status quo by discovering new technologies, frameworks and niches is essential for long-term market competitiveness. Therefore, implementing an innovation process is crucial to keeping an overview of the current products, technologies, and industries and to constantly adopting the right innovations in the right moments. In cooperation with CodeFlügel GmbH, a software service provider, their current technology stack (TS) that is used to implement customer projects is assessed in this paper. Additionally, the trend research consultant market is evaluated for a cooperation. Based on this, the paper focuses on the innovation process customized for the environment of a small-sized enterprise. The output of an innovation process highly depends on the definition of innovation and the vision of the company itself. Thus, this factor is outlined in detail and considered in the design. Eventually, an implementation-ready process is defined, which describes how to handle ideas - based on internal and external resources - that are new to the company and thereby promise a better market position, an increased efficiency and an enhanced innovative reputation.

IV
Preface
Doing this thesis was a great opportunity to dive into the world of process management and management tasks in general. The special circumstances in the company CodeFlügel GmbH gave me the chance to research, construct and implement an entire innovation process that ensures market competitiveness in the long-term. I want to thank Claus Degendorfer for further crowding his already stressful schedule by giving me the frequent feedback I needed to achieve the defined goals in quality and time. Further, I want to thank Alisa Patterer for proof-reading the entire thesis and improving the overall reading experience. Lastly, I want to give thanks to my advisor Sigrid Weller for guiding me through the project, especially the important first steps, and limiting the scope to a realistic level. In truth, this thesis covers only the first part of a two-step project: defining and implementing a process. The intended focus lies on preparing and defining fact-based tasks, which afterwards are introduced to the team. I want to give a friendly warning to everybody who cooks up a masterplan in their head but does not consider the human factor that emerges while implementing the plan. I am very excited about changing a part of an organization grown over time and look forward to the real-life feedback and outcome. Even if it is not related to this work directly, it influenced my decisions to be here now doing it: thank you to my family, thank you to my friends, and especially thank you to my “ex-friends”. All of you together have formed my character, ignited my motivation and kept me running all this time and will hopefully continue to do so for a long time to come. I hope you enjoy your reading and discover some helpful ideas. Stefan Papst Graz, April 18, 2019

V
Table of contents
1 Introduction .......................................................................................................... 8
1.1 Motivation & Problem .................................................................................... 8
1.2 Goals ........................................................................................................... 12
1.2.1 Technology Stack Analysis ...................................................................... 12
1.2.2 Trend Research Partner Evaluation ......................................................... 12
1.2.3 Process Definition .................................................................................... 13
1.3 Derived Tasks .............................................................................................. 13
1.3.1 Technology Stack Analysis ...................................................................... 14
1.3.2 Trend Research Partner Evaluation ......................................................... 14
1.3.3 Process Definition .................................................................................... 14
1.4 Study Area ................................................................................................... 15
1.5 Approach ..................................................................................................... 15
2 Background ........................................................................................................ 16
2.1 Technology Stack ........................................................................................ 16
2.1.1 Stack Definition as Software Service Provider ......................................... 16
2.1.2 Impact of Technology Stack ..................................................................... 17
2.2 Life Cycle ..................................................................................................... 17
2.2.1 Technology Life Cycle .............................................................................. 18
2.2.2 Product Life Cycle .................................................................................... 23
2.2.3 Industry Life Cycle ................................................................................... 26
2.3 Hype Cycle .................................................................................................. 28
2.3.1 Phases of the Hype Cycle ........................................................................ 29
2.3.2 Lessons of the Hype Cycle ...................................................................... 32
2.4 Process Management .................................................................................. 32
2.4.1 Business Process .................................................................................... 33
2.4.2 Business Process Management .............................................................. 36
2.4.2.1 Key Capabilities ................................................................................ 37
2.4.2.2 Budgeting Techniques ...................................................................... 38
2.5 Change Management .................................................................................. 39

VI
2.5.1 Basics of Change ..................................................................................... 39
2.5.2 Change Communication .......................................................................... 42
2.5.3 Blueprint to Addressing Changes ............................................................ 45
2.6 Innovation Management .............................................................................. 47
2.6.1 Definition .................................................................................................. 48
2.6.2 Innovation Culture .................................................................................... 49
3 Practical Problem-solving ................................................................................ 50
3.1 Technology Stack Analysis .......................................................................... 50
3.1.1 Technology Stack Definition .................................................................... 50
3.1.2 Technology Stack Analysis ...................................................................... 54
3.2 Trend Research Partner Evaluation ............................................................ 58
3.2.1 Online Investigation ................................................................................. 59
3.2.2 Portfolios .................................................................................................. 60
3.2.3 Decision making ....................................................................................... 62
3.3 Process Definition ........................................................................................ 63
3.3.1 Definition of Tasks ................................................................................... 64
3.3.2 Input Handling .......................................................................................... 66
3.3.3 Innovation Team, Organization, and Decision-making ............................ 70
3.3.4 Cycle Definition ........................................................................................ 74
3.3.5 Budget Planning ....................................................................................... 81
4 Summary and Outlook ...................................................................................... 84
4.1 Input Preprocessing and Evaluation ............................................................ 85
4.2 Key Performance Indicator .......................................................................... 85
4.3 Internal Costs per Hour ............................................................................... 86
4.4 Process Controlling ..................................................................................... 86
4.5 Decision Partner and Further Research ...................................................... 87
Bibliography ............................................................................................................. 88
Online Sources ......................................................................................................... 92
List of figures ........................................................................................................... 93
List of tables ............................................................................................................. 94

VII
List of abbreviations ................................................................................................ 95

Introduction 8
1 Introduction
In this section, the topic of the thesis is introduced and the motivation for this project is explained. The introduction is divided into several sections: Motivation & Problem, Goals, Derived Tasks, Study Area and Methods. The first sections cover the motivation and initial situation in the company CodeFlügel GmbH, which is a software service provider in Graz, Austria. It includes a direct quote by DI Claus Degendorfer, CEO and Founder of CodeFlügel GmbH, about “being innovative” as a service provider and why an innovation process is crucial for long-term competitiveness especially in the software market. The second section gives an overview of all goals that were defined beforehand and which are worked on in this thesis. The third section is the concrete derivation of the goals that are defined in the previous section. The tasks are grouped into three goals. The section Study Area states the environment and constraints which are given by the company or other influences. The last section covers the procedure of when and in what way we are working on the task.
1.1 Motivation & Problem
The company CodeFlügel GmbH was founded in 2011 by DI Claus Degendorfer and DI Stefan Mooslechner and is located in Graz, Austria. In 2018, the team counts 20 employees. 14 out of 20 work as software developers, the other 6 handle marketing, sales, organization, and human resources. CodeFlügel GmbH is a leading Augmented Reality (AR) and Virtual Reality (VR) expert in the German-speaking area, but is also known for delivering individual software. As a result of the early technological stages of AR and VR, the fields of application were limited during the first few years of the company’s existence. In order to reach the planned revenue each year, the strategy had to be broader, meaning less specification in the selection of technologies. Figure 1 shows Gartner’s Hype Cycle for Emerging Technologies for the year 2018, which is explained in more detail in section 2.3. AR is located in the middle of the area Trough of Disillusionment which means that the technology is starting to climb up to the Plateau of Productivity. Once a technology is there, depending on the market it is entering, 20 to 30% of the potential audience have adopted the innovation. VR is already there and has therefore been removed from the Hype Cycle for Emerging Technologies in 2018. The application examples of AR have increased rapidly in the last few years and access fields such as marketing, sales, industry, construction, visualization, medicine or teaching. CodeFlügel GmbH has been offering AR solutions since 2011, which is one reason for their market leadership in terms of quality and experience. From an economic point of view, focusing on AR as a startup was too early. Too many emerging changes in the frameworks used and in the technology itself

Introduction 9
made it impossible to deliver the kind of high-performance quality that provides a benefit to the customers.
Figure 1: Hype Cycle for Emerging Technologies in 20181
In order to hold a competitive advantage in the market, an innovation process should be formed. This process keeps the company updated by analyzing the current technology stack – the technologies which are used in the company – and observing emerging technologies that could supersede currently used technologies. As a result of the lack of knowledge in this field, the actual company structure works without innovation management. If there is an interest in a new technology, the CEO forms a special team which works on prototypes and concrete projects. The findings are forwarded to marketing and sales. This process handles the actual implementation without any research on trends, hypes or market analysis. Thus, an innovation process is needed which covers trend research, technology (stack) analysis and technology changes to stay innovative as a company.
1 https://blogs.gartner.com/smarterwithgartner/files/2018/08/PR_490866_5_Trends_in_the_Emerging_Tech_Hype_Cycle_2018_Hype_Cycle.png (11.03.2019)

Introduction 10
Figure 2: Hype Cycle for Emerging Technologies in 20112
DI Claus Degendorfer gives an insight into what being innovative as a company means to him:
“Many customers approach us with the statement: "We are innovation leaders in our industry" or "we want to remain/become innovation leaders". But what exactly does that mean and how do you get there? Since we are a software company with core competence in the area of new technologies, we can often be of help here. Augmented Reality and Artificial Intelligence are technologies that we deal with intensively. But it is important to mention that you do not automatically become innovative just because you rely on new technologies. That's why we have started to work together with our customers in joint technology workshops to develop the solution that brings the greatest added value for the customer. Because one of the problems with being innovative is that it is easier to see from the outside in which areas an innovative solution would make sense. This is more difficult in your own company. [...] It is particularly important to organize the whole thing in a goal-oriented way. Otherwise, the innovation impulses fizzle out without effect.[...] "Innovation" is currently suffering a similar fate to "digital" - because everyone understands it to mean something different. In the case of CodeFlügel GmbH
2 https://gold-group.com/2013/10/22/qr-codes-beyond-hype-cycle/ (11.03.2019)

Introduction 11
as a technology-related innovation partner, the novelty, but also the maturity, of technology is essential in order to actively communicate it to the outside world. Customer benefit still comes first and therefore our own "being innovative" is also defined. An innovation process cannot even be created and then applied to all kinds of companies. A clear goal, a vision, the company structure, and the target group together define the desired output of such a process. Only then can a functional process optimally adapted to the company be created and later lived.”

Introduction 12
1.2 Goals
This section defines three goals: technology stack analysis, trend research partner evaluation and process definition. The guiding research question is concerned with the combination of a small-sized company and thus a limited budget and manpower and a long-term plan to stay competitive with existing knowledge on the market as a software service provider. This question is followed up by minor ones: are external technology consultant and trend research partners available that provide the decision-supporting input and are in a cost range that doesn’t exceed the available budget? Therefore an essential information we need to gather is which technologies are actually used in the company. The following described goals are deduced by the research questions into a clear form which lead to measurable result. Therefore, all three goals are defined by using the SMART acronym. This method improves the outcome3 by defining the goals in greater detail. SMART stands for specific, measurable, achievable, relevant and time-bound.
1.2.1 Technology Stack Analysis
The technology stack describes the currently used technologies and frameworks within the company. The goal of the analysis is that every technology results in a chart. The sum of all trend curves indicates innovativeness. This procedure will be added as a part of the innovation process. There is a clear separation between employee competencies and strategy. Thus, it is not the sum of the competencies forming the stack, moreover, the company strategy gives the direction. Competencies are not added to the stack if they are not in agreement with the strategy. The process definition is based on the analysis, which, therefore, must be done first. The reason for this sequence is that the analysis provides information on the effort and time span needed as well as on the prospective level of detail.
1.2.2 Trend Research Partner Evaluation
The goal is a decision for a partner in the area of trend research for the first cycle of the innovation process. It also gives an answer to the question of whether a partner is necessary for generating inputs and evaluating them or not. The stack analysis will further show, in which capacity an external partner is needed. Important factors to consider are effort, costs, knowledge and working experience as those are factors we compare the potential partners. The first step is an online desk research on potential partner for trend or technology consulting. This research phase which will result in a list of possible partners and tools. The requirement profile will be defined dynamically 3 CONZEMIUS, A.; O'NEILL, J. (2009)

Introduction 13
based on the results of the technology stack analysis. The search will be carried out online via Google Search4. The final list should include two or more partners and, ideally, each entry should show all services and costs. In case there is only one partner on the list, we decide whether the partner component should be omitted in the first cycle.
1.2.3 Process Definition
The innovation process should be dynamic and iterative, providing for maximum efficiency and flexibility in changing the process, if necessary. The output is declared and can be optimized after each cycle. The specific goal of the process definition is to answer the following questions:
• How long does one cycle last? • Which data is collected? • How high are the costs for any external partners? • What amount of manpower should be reserved?
The managing director desires a planned and structured procedure, which is measurable. Therefore, a high value is placed on the process definition. The sum of the answers to the questions above will form the process. We need to know how long one cycle should last, into which tasks it must be divided and how much effort everybody will need to put into it. We will start working on it after the technology stack analysis has been carried out and the decision about a partner for trend research has been made. The process will last until the end of the project.
1.3 Derived Tasks
In this section, the tasks derived from the above-defined goals are presented. The structure is the same as in 1.2, but the content contains tasks we can work on. After finishing all the tasks of a goal, the goal itself is finished. Tasks are grouped to sub-goals and each task lasts a maximum of one workweek to review and present the findings of every week.
4 www.google.at

Introduction 14
1.3.1 Technology Stack Analysis
The following tasks need to be finished in order to reach the goal “technology stack analysis”:
• Define technology stack o List currently used technologies o List employees’ competencies o Transfer company strategy onto technology stack o Apply strategy to currently used technologies and change stack if
necessary • Analyze technologies and depict trend curves for each technology by using data
from Google Trends5
1.3.2 Trend Research Partner Evaluation
The evaluation can be divided into the following sub goals:
• Online Investigation: list service providers for trend research, technology analysis, and innovation management.
• Portfolios: create one portfolio per provider. The portfolio should give an overview of services and costs.
• Decision Making: for the first cycle, a maximum of one partner is consulted, meaning that one partner must be selected. Another possible outcome is that consultant services are entirely omitted in the first cycle.
1.3.3 Process Definition
With regard to CodeFlügel GmbH's innovation process, it is first and foremost necessary to define what is implemented in a cycle. In addition, it must be clarified which data is required in order to be able to justify changes to the technology stack. Once the scope of the data collection has been defined, a cost and employee hour estimate can be drawn up. In the last step, the survey period (the time span of a cycle) is evaluated. In summary, the following tasks must be worked out:
• Definition of the scope of trend research/technology stack analysis • Creation of a time schedule, which spans 6 months • Preparation of a time schedule that spans 12 months
5 https://trends.google.com/trends (11.03.2019)

Introduction 15
• A decision between 6 and 12 months together with management • Estimation of the costs of the innovation process (costs of services and
resources required)
1.4 Study Area
The area of investigation is very strongly defined by the definition of the Graz-based company CodeFlügel GmbH and its strategy. CodeFlügel GmbH has global customers, but mostly serves German-speaking countries. The trend research should not only focus on local trends but also follow global technologies in order to find possible connections between areas like Europe and the USA. The company’s positioning as a software service provider thus also defines the industry within which the present study is situated. The high-quality standards defined by the mission and vision limit the technologies and frameworks that can be considered to produce a stable version. Stable means that the added value created is not compromised by the unreliability of the software used in the background. Although individual projects in the hardware area have also been implemented in the past, the management excludes further such projects.
1.5 Approach
As described in the previous sections, the thesis is divided into three goals. To ensure a fluent way of working, a rough schedule has to be defined. The third goal is dependent on the first two goals. One reason for that is the first goal, which targets information about the current technology stack and performs a light-weight analysis. With this information as a basis, the task definition of the innovation process becomes more practically relevant. Furthermore, the second goal of evaluating an external partner in order to generate inputs for the process is essential for budget planning. Budget planning is one of the last tasks in goal three. Having all of this information available leads to the following schedule: creating a list of the technologies used in the company and looking for trend researchers online will be started simultaneously. Once the technology stack is defined and the analysis is done, the set of activities for the process can be defined. Meanwhile, the search for a partner continues. Once the process is almost done and only the budget planning is left, the evaluation for a partner is due to be finished.

Background 16
2 Background
In this section, the theoretical information that comes along with the practical work is provided. Every tool, technique or framework that is applied in the practical problem-solving section is described in the following sections. As three main goals were targeted in this work, this section is structured as follows: the first sections give an overview of the importance of a technology stack, life cycles in general and more specifically describes the models of technology, product and industry life cycles. Therefore, the methodology itself is illustrated as well as the differences in the fields of application. As there is often confusion about Gartner’s Hype Cycle and how this model relates to the above-mentioned ones, section two covers this information. Those two sections are related to the first and second goal called technology stack analysis and trend research partner evaluation. The third, fourth and fifth section in this chapter are related to the third main goal, process definition. The terms process management, change management, and innovation management are described based on recent literature. Process management covers the topic around the purpose of processes and how they are managed. The theory behind innovation processes is covered in the last section, Innovation Management. Innovation management handles innovation processes and all byproducts that come with it. Hence, one important term that is often attached to innovation is change. To successfully implement innovations or an innovation process in a company, the basics of change management need to be understood. Those are outlined in between the Process Management and Innovation Management sections.
2.1 Technology Stack
Every product development uses a defined set of underlying technologies.6 In more details it describes which coding languages, framework and architectures are used to build the product from backend/server to frontend/client-side. A difference in the technology stack by swapping frameworks or architectures has impact on the performance, price and maintainability.
2.1.1 Stack Definition as Software Service Provider
In opposite to a product development in the project business the technology stack increases in its size. The reason behind this growth of the technologies is the variety of provided solutions as a software service provider. Usually for each project a project stack is defined. Therefore for different categories and branches a set of technologies,
6 https://blog.hubstaff.com/technology-stack/ (17.04.2019)

Background 17
frameworks and programming languages establishes. This overview is also called technology stack, even tough it combines multiple project setups. The structure of such a stack can differ. A highly used development architecture is the separation of server-side and client-side. On the server-sider the general and time-consuming business operations take place, whereas the frontend, the graphical user interface the client is interacting with, displays data. Therefore often used categories are backend/frontend or server-side/client-side.7
2.1.2 Impact of Technology Stack
Having a list of technologies and frameworks for different projects and parts of development architectures results in the following: having a public technology stack influences the attractiveness of a company for potential employees. The candidates know beforehand their fit into the technical part of the company. Besides that the internal impacts are mainly in terms of organizing teams of experts around certain categories. That influences the process of accepting or declining projects. Also in strategic decision-making a technology stack supports by giving an overview of the knowledge of the entire company.7
2.2 Life Cycle
Products, technologies or industries do not just appear in a mature and fully-developed stage. They start with an idea, a discovery or by accident and they need a lot of time, money and effort to develop and perhaps grow big, or fail in early phases. The timeline from the beginning, over the development of products, services or technologies, to the end is called life cycle. The life cycle ends when the organism dies. One part of this thesis is to gather information about the used technologies for projects in the software company CodeFlügel GmbH. Therefore, a list of industries the company serves, the technologies they are using and of used frameworks/products is created. This list should reflect the company's position in the market and the derived strategy. The following task is to analyze this list with respect to performance, innovativeness and development stage. Based on this information, the analysis is carried out. In order to understand the techniques and outcome of this evaluation, the different life cycles for technology, product and industry need to be clarified. We specify the different stages of each model, how they influence decisions and how they differ from each other. In general, the life cycle of branches can be illustrated as shown in Figure 3. This path can be seen in the following sections as well, but with slightly different stages.
7 https://svsg.co/how-to-choose-your-tech-stack/ (17.04.2019)

Background 18
The general graph is described in more detail in the following sections, starting with the technology life cycle (TLC).8
Figure 3: Life cycle model for branches8
2.2.1 Technology Life Cycle
Nowadays, technologies as well as the economic environment are changing rapidly.9 Therefore, being innovative and state-of-the-art needs a high amount of research and change capacity.10 The customer needs are changing more often and the product and marketing strategies need to be adapted accordingly. In order to satisfy the consumer by producing successful products, three components need to be balanced: technology, marketing, and user experience.11 The pushing key factor in this constellation is technology. Marketing and user experience use the technology strategy as a basis. Therefore, taking a closer look at the technologies which are used is crucial and rudimental for the success of the higher layers. Even if sales and marketing experts preach investing in marketing and promoting a product before its launch, the user feedback and experience are the decisive factors for further demand. On the one hand, going to market at an early stage of development of either product or technology itself is highly effective for market research and evaluation.12 The costs are low13, the
8 JOHNSON, G.; SCHOLES, K.; WHITTINGTON, R. (2008) 9 MULLINS, J.W.; SUTHERLAND, D.J. (1998) 10 CRÉPON, B.; DUGUET, E.; MAIRESSEC, J (1998), P. 115-158 11 NORMAN, D.A. (1998) 12 KHANNA, R.; GULER, I.; NERKAR, A. (2016), P. 436-459 13 HALL, D. (2007), P. 19-24

Background 19
product is not feature complete - so still open for changes - and the marketing strategy is not yet set. The early feedback can influence the direction of technology and marketing strategy and has high value for product development and, later, product success. This agile way of development ensures a result that is close to the users’ needs and expectations.14 On the other hand, technology might not be able to improve in the necessary direction and give a misleading opinion about constraints in terms of technology. This can cause negative impressions of and associations with a specific technology. Therefore, we can differentiate between multiple phases of maturity of technologies in terms of business gain, sales potential, and patent applications.15 Each of them results in a diagram with time on the ordinate. Those diagrams are called life cycles (LC). They are often referred to as S-curves16, as they often result in a significant S-form. Figure 4 shows a sample technology life cycle path referencing business gain over time. As shown below, the first phase called research and development (R&D) produces negative business gain. Business gain stands for an increase in profit, price or value of a certain product or technology. As a result of investing in research in technologies and products, the profit is negative. Only a certain amount of time, budget and effort improves a product, but without immediate earnings. This leads to a lack of profit and so a negative business gain. Not only the incomes are negative but also the prospects of failure are high. Making a decision to use a technology in the bleeding edge phase is highly risky and uncertain, but also has the most potential in terms of opening new markets or products as a leader. After reaching a certain amount of maturity and feature richness, the technology is starting to gain value. The curve turns upwards and the phase of ascent begins. In this phase, the majority of research has been done and the out-of-the-pocket costs have been covered. The term leading edge indicates a certain point A on the curve. From this time on, the technology starts gathering strength. This stage is described as the strongest one of the TLC. The technology is ready to gain and command a premium profit. The duration of this phase is driven by competing solutions and alternatives. After entering the point of Vital Life the ascending phase transitions into a mature phase. This flattens the curve and indicates the highest point of business value. If a technology is considered mature, it is also described as stable and remunerative. Even though lots of competition is faced in this stage, the technology manages to survive over the time frame of its Vital Life. Once it begins to lose to a competitor, the phase after point D starts. The earnings from the technology show a strong downstream. Some owners tend to license to another market at point L, where the demand is significantly higher than in the current one. The
14 DYBA, T.; DINGSOYR, T. (2009), P. 6-9 15 HAUPT, R.; KLOYER, M.; LANGE, M. (2007), P. 387-398 16 CHRISTENSEN, C.M. (1992), P. 334-357

Background 20
same technology can still be attractive to companies in different niches. If this is the case, the extended phase L’ takes place. All the above-mentioned stages are mainly forced by patents and hypes, which are both uncontrollable factors that cannot ensure either success or massive growth. It is difficult to predict business gain as you have to assess the technology hype and whether they are sheer hype or have justified true acclaim. In general forecasting, user behavior and responses on innovations are often linked to uncertainty. Therefore, the idea of a diffusion of innovations is modeled as the technology adaption curve.17 Figure 5 depicts the different adaption phases.
Figure 4: Technology Life Cycle concerning Business Gain18
17 ROGERS, E.M (2010) 18 BOLMAN, L.G.; DEAL, T.E. (2015), P. 35-40

Background 21
Figure 5: Diffusion of innovations modeled as Innovation Adoption Lifecycle19
The approach follows the questions of how, why and at what rate new ideas and technologies spread. The different rates represent different types of consumers. The first and most innovative people are declared as innovators. Those are the 2.5% of the market that adopt new ideas immediately, if there is any chance for study. Innovators are characterized as potential adopters that evaluate an innovation from different perspectives. The main influencing factors are the relative advantages according to perceived efficiencies and relative to alternatives, compatibility with current running systems, the degree of difficulty for learning, trialability or testability and potential for reinvention.20 Shortly after the innovators, the next 13.5% are called early adopters. The stability and feature completeness aren’t the driving factors here, but the fact that something new is in their hands counts. For example, if a new 8k TV is launched it will only be bought by a few people for a relatively high price at first. If the rate of the early majority follows the early adopters, the prices begin to decrease. At this stage, about 25 to 50% of the market share is open for innovation. At the point of transition from the early majority into the late majority, the peak of adoption is reached. The late majority isn’t driven by the emotion of being innovative but by the fact that the new product or
19 Based on ROGERS, E.M (2010) 20 KAMAL, M.M. (2006), P. 192-222

Background 22
technology delivers a high amount of benefits and fits the customers’ needs better than the existing system. Only the so-called laggards are left, who do not want to make the transition in the first place. Forcing reasons need to be given to persuade them. For example, laggards would be people who buy smartphones for only one reason: no basic phone is offered anymore. Once the laggards are convinced, the market share rises up to 100% and the market is fully saturated.
Figure 6: The S-curve concept of the Technology Life Cycle21
After covering the TLC regarding the business gain, another common model shows the performance in terms of patents over time.22 This model is the S-curve concept of the TLC (see Figure 6). New technology is deemed emerging if it might be capable of changing the current status quo. The technologies can be relatively old or completely new, like gene therapy, which dates back to 1990, or artificial intelligence. Characteristics of emerging technology are novelty, high pace in growth, coherence, prominent impact and uncertainty. The domain of technology does not play a role at all. The variety of technologies can be shown by the following examples: educational technology, information technology, nanotechnology, biotechnology, cognitive science, psychotechnology, robotics or the already mentioned artificial intelligence. The emerging phase is followed by a growth phase. When the patent applications increase, the technology seems to have more value and is thus called a pacing technology. After a certain point of performance, the pacing technology evolves into a key technology. The phase the technology is located in depends on the amount of
21https://www.researchgate.net/figure/The-S-curve-concept-of-technology-life-cycle_fig3_256859390 (11.03.2019) 22 GAO, L. et al. (2013), P. 398-407

Background 23
investigation and development, not the time the technology has been in research for. The time has no influence on performance or maturity. When a key technology highly performs in terms of patent applications, it reaches a level of maturity. It has the potential to penetrate the market for a long time and win the competition against competitors. Thus, the technology is not yet fully saturated. Once the research is at its peak in terms of patents, the key technology turns into a base technology. Base technologies are described as saturated and no further big changes are expected. This type of TLC gives no information about the market interest or share of a technology, but instead classifies its maturity level. Often, there are correlations to the sales perspectives of a product life cycle (PLC), but there is no guarantee. In terms of technology forecasting, the technology life cycle is often used as an orientation. The stages represent a different feature, as they focus on research progress or adoption rate. Although making decisions based on S-curves, is still risky. There is no guarantee that a key technology is going to merge into a base technology which beats other technologies and thus will be adopted by the vast majority. Different inputs from different perspectives come together to form a TLC. Therefore, the range of interpretation is wide and multiple deviations are legitimate. Even though, in terms of assessing innovations, the TLC is commonly used.23 When it comes to concrete usages of a technology, a more tailored S-curve concept represents a different stage of a product.
2.2.2 Product Life Cycle
The TLC describes the performance, maturity, and competitiveness of a technology over a certain time span. A product that uses this particular technology will run through a life cycle with similar stages: introduction, growth, maturity, decline. This life cycle is called the product life cycle and displays product sales on the Y-axis. Usually, a TLC combines multiple PLCs, as there is an almost infinite number of possible product ideas and market segments to serve. A typical PLC diagram is depicted in Figure 7.
23KIM, B. (2003), P. 371-381

Background 24
Figure 7: Product Life Cycle diagram for one product24
The four clearly defined stages of the PLC have individual characteristics. These characteristics influence businesses that try to manage their products differently. The first stage is commonly called introduction. In this phase, the sales and thus also the revenue are low. The profit is usually negative, as there are R&D costs to cover first. In some illustrations, the first stage is an R&D phase, but as there are no sales, it is omitted in most cases. In general, the launching phase is driven by forecasts, but also by uncertainties about the demand and market. The purpose of this stage is to “create” the need for the consumers. The further stages and the product itself benefit later. According to the Harvard Business Review, the main influencing factors are the product’s complexity, its degree of newness, its fit into consumer needs and the presence of competitive substitutes.25 Nowadays many companies are refusing the role of a pioneer and try to enter the market immediately after the R&D, in the middle of the introduction phase. Waiting for others to invest time, money and effort in creating a product from scratch is becoming more and more a strategy of executives. Depending on the success of a product, the sales numbers rise slightly - or rapidly - during the market development stage. Once the consumer demand increases, the next stage begins, which is growth. In this phase, the R&D-avoiding competitors are also entering the market and try to get the second, but equally big bite with the so-called “used apple policy”.26 The market will be full of similar products which are either unique and different or carbon-copies. Companies start to build brands for their product and so find their position in the market. The high amount of competition brings up an
24 MALAKOOTI, B. (2013) 25 LEVITT, T. (1965), P. 81-94 26 https://adscovery.com/2006/11/04/used-apple-policy-and-success/ (11.03.2019)

Background 25
unknown number of problems for the originator. The way the strategy for marketing and development is driven changes rapidly, as they need to focus on how their product is preferable in contrast to what is an adequate price or which additional feature will fit the consumers’ needs perfectly. Competitors constantly adapt their products as well and some just take the originator’s one and improve minor features. Therefore, the marketing strategy highly matters in the growth phase in order to be able to conquer in the growing market. This provides an advantageous position in the next phase, where the consumer acceptance increases and the risk of opening new retail stores decreases. This brings more competitors into the game and thus lowers the prices. Some companies benefit from the more advanced technology which has involved in the meantime and can serve products with either higher performance, more features or at a lower price. 25 All these changes lead to raising sales to a new level. This level is called maturity or stabilization. The first sign a product has entered this stage is a certain level of market saturation. Once the sales numbers are at their highest and the adoption rate is over 50%, the market can be seen as mature. The late majority adopts the product and older ones or competitors are declined. The products stay almost the same, only the cost of competition becomes more intense. Each company tries to make its consumer stay by presenting a more focused marketing strategy and consumer-oriented product. Small changes make the difference in keeping the sales count high. Back in the development stage, the originator trusted their retailer and distributor to manage the communication with the consumer, but in this intense phase of the competition, the values of the originator need be delivered as well. Therefore, direct communication is crucial in maintaining and strengthening the connection. The maturity stage can last for a long time, as it did for products such as beer or steel, but can also go by fast, as it did, for example, with 3D TV. 25 Even if the maturity phase seems to be infinite, after a certain point the next stage, the declining stage, will arrive, when the market adoption rate is over 75% and the vast majority of consumers already owns the product. The demand rapidly decreases and only the laggards are left, so the demand is shifted to another technology or alternatives. Early adopters might already be experiencing the next innovation by that time. Some companies forecast the declining phase early enough to react to it in terms of a repositioning within the market or a reduction in the production of products. A declining market always costs companies that do not respond to the market in a dynamic fashion. The result is that only a few producers are left, the competition relaxes and the prices become stagnant. Eventually, the consumer gets bored and no further support or improvements are expected. 25

Background 26
The PLC gives an overview of the number of sales over time. Marketing strategies are directly influenced by its significant four stages: introduction, growth, maturity, and decline. Those are also present in the illustration of the TLC, but the timespan of a product is much shorter. The PLC is a proven tool in the development of products and processes.27 Not just products or technologies experience the same kind of life cycle, but also industries do. The next section provides further information about this process.
2.2.3 Industry Life Cycle
Every product goes through the same stage, some faster, some more slowly. The technologies that are used for the products are also experiencing life cycles. Usually, the time span of a technology is longer than that of a product, as there are possible advancements which result in new, innovative products on the market. The same phenomenon takes place for whole industries. To this end, TLC curves are clustered and form an industry that has its own industry life cycle (ILC). Every industry passes the same stages, but in different intensities and time frames. The ILC shows the growth of sales in the industry. The four distinct and characterized stages of industry are the following: introduction/embryonic, growth, (shakeout), maturity, decline.28 These are the exact same stages as stated in the PLC. Nevertheless, the characteristics and decisions based on the current stages are different, as the time spans are longer and the consequences bigger. The overall concept is the same as for the PLC: in the beginning, the sales are low as there is no demand in the opinion of the consumer. The R&D phase brings innovation to the market and companies start working on specific solutions. Products/technologies are patented and the competition starts. The innovators and early adopters are the target group among customers in this phase. Even at that stage of development, companies try to find their market position. Niche markets are built, differentiation by superior experience or distribution is delivered and cost leadership by gathering capital in the earlier R&D phase is squared off. As this phase needs a lot of money, companies tend to cluster together to ensure a more beneficial market position. At a certain point, the introduction phase transitions into the growth phase. The market share rises and the adoption rate increases as well. The consumers give feedback and new niches or fields of application are discovered. In marketing jargon, products in a growing phase are often called Stars. Depending on the success of the products in a given industry, the
27 KARLSSON, C. (1988) 28 HILL, C.W.; JONES, G.R.; SCHILLING, M.A. (2014)

Background 27
industry itself stays in the growth stage shorter or longer. On the one hand, if the technology cannot catch up with the consumer needs, the industry often fails at this point. The sales go down and the industry is dead. On the other hand, if sales rapidly increase and the adoption rate is high, the industry experiences a hype and moves on to the next stage. Then the maturity stage is present. The transition from growth into maturity is often called shake-out, as in this phase the rivalry increases and some firms exit the market. In the middle of the maturity phase, the sales are at their peak and the vast majority of consumers is adopting. The Stars are turning into Cash Cows. The profits are positive and the majority of firms have already expanded. Typically, fewer and bigger companies take over in the maturity stage. After some time, the market becomes saturated and the sales numbers gradually decline. A practicable answer to the decline is to find new usages or expand. This might save sales and extend the life cycle of an industry. Once the world saturation is reached, the industry eventually dies and the next innovative industry takes over. However, the industry might continue to exist for some time with low sales, trying to compete with alternative industries, but in the end, it will be declined.29 Figure 8 shows the stages of an ILC with its characteristic shake-out and saturation points.
Figure 8: Stages in the Industry Life Cycle29
The phenomenon of hypes is in the nature of innovation, occurring as one of its byproducts. Hypes, in contrast to technology, product or industry life cycles are often misleading and do not function as a fundamental decision base. The next section gives an overview of hypes and enlightens the concept of Gartner’s Hype Cycle (HC). Eventually, the purpose and difference to the above-mentioned life cycles are clarified.
29 https://marketing-insider.eu/characteristics-of-the-product-life-cycle-stages/(11.03.2019)

Background 28
2.3 Hype Cycle
In the year 1995, Gartner Inc.30 introduced their HC and described it as follows: “Gartner's Hype Cycle [..] characterizes the typical progression of an emerging technology from overenthusiasm through a period of disillusionment to an eventual understanding of the technology's relevance and role in a market or domain”.31 The HC can be seen as a significant curve (see Figure 9).
Figure 9: Gartner’s Hype Curve32
According to Gartner Research31, the institution that came up with the correlation between the hype and maturity of technologies, the HC covers the early stages of technology development and adds another dimension to it, namely maturity. The maturity is split into five stages:
• Technology Trigger • Peak of Inflated Expectations • Trough of Disillusionment • Slope of Enlightenment • Plateau of Productivity
Those five stages underline the intention of the HC, which consists of three points31:
30 https://www.gartner.com/en 31 LINDEN, A.; FENN, J. (2003), P. 5-12 32 taken from LINDEN, A.; FENN, J. (2003), P. 5-12

Background 29
• Delivering the message of separation of a hype from real potential technologies • Positioning technologies with respect to maturity and visibility • Calling on strategic executives to keep in mind that enterprises should invest
effort into key technologies that align with the business’ vision and strategy, not react to positive hypes with inflated expectations or to negative ones by underestimating the potential.
Therefore, the differences between a hyped a technology and an evolving one need to be considered. The following figure shows a sample for the S-curve, adaption curve and HC overlay.
Figure 10: Technology Life Cycle Models overlay33
As Figure 10 shows, the HC (without extension) is much shorter than the TLC. The HC addresses only the early stages and the associated mismatched expectations which are produced by the press, public demonstrations or other events. Once the understanding of the technology and its features align, the technologies fall out of the basic curve. Gartner Research describes each stage from the same perspective: what is delivered to the consumer or user and what is the technology ready to deliver?34
2.3.1 Phases of the Hype Cycle
The HC is a curve which is described by six phases as well as an added one for the extension: Technology Trigger The technology trigger is the first impulse of innovation for the public eye. Some R&D results, such as approaches or papers, might already have been published in the past, but the press release might have been missing. After some delay, the technological
33 taken from LINDEN, A.; FENN, J. (2003), P. 5-12 34 LINDEN, A.; FENN, J. (2003), P. 5-12

Background 30
breakthrough generates industry interest and publicity. In this phase, no products are released yet, as the technology is too unstable or not researched enough. Even though some venture capitalists fund the first round for startups in this area.35 On the Rise In the on the rise phase, the mass media is going to push the technology. Expectations are high and not yet developed or discovered features are promised. Despite the fact that no working products are offered the technology is on the way to the peak of inflated expectations.35 At the Peak of Inflated Expectations The peak of inflated expectations often brings the first working products with it. Startups try to use the marketing benefits of the hype. The misleading expectations inflated by the press or other media lead to negative associations. The products bring less features, higher prices, and less customization that expected or matured alternative provide. All of this information together lets the hype pass and the interest decreases rapidly.35 Sliding Into the Trough of Disillusionment At this point, the public sees the technology as a fail. Innovative startups consolidate to overcome the negative profit. Even though the associations are negative, some type A companies adopt the first versions of the technology. Type A companies accept the high risk, but also see the opportunities. Types B and C are choose to wait for higher productivity of the technology in order to be sure that the change is beneficial. In this phase, the second/third rounds of venture capital funding are taking place. Equity is relatively inexpensive as the inflated expectations did not hold up. Products are still being developed and the first feedback by innovators and early adopters is implemented. Second-generation products and some first services are offered. This phase coincides with the chasm of the technology adoption curve, as the vendors need to address the early adopters until a certain level regarding the adoption rate is reached. From there the majority of people can be targeted.35 Climbing the Slope of Enlightenment Working products in enterprises that have already adopted help to understand the technology and its features. Real-world use cases push out of the trough and cause it to climb the slope of enlightenment. Type B companies start adopting products and services, as they now have a better understanding of the opportunities and the risk. This phase increases the adoption rate to 5%. Type C enterprises are the conservative 35 LINDEN, A.; FENN, J. (2003), P. 5-12

Background 31
ones and still remain wary. With time, iterations of the first-generation products are developed and launched. The adoption rate rises to approximately 30% until the plateau of productivity is reached.36 Entering the Plateau of Productivity The understanding of technology has reached a trustful level, even for type C companies. The expectations almost align with the possible performance of the products and the adoption rate is steadily increasing. New niches and use cases are evolving and the products improve with the gathered feedback. The height of the plateau depends on the actual acceptance level for the technology by the mainstream.36 Post-Plateau The standard HC usually ends before this phase. The post-plateau describes the decreasing visibility after the plateau. The mainstream has adopted the technology and the hype disappears. Even though millions of enterprises are using the technology, only a few specialist magazines are reporting on improvements or further optimizations.36 Figure 11 gives an overview of the Hype Cycle and its stages.
Figure 11: Phases of the Hype Cycle37
36 LINDEN, A.; FENN, J. (2003), P. 5-12 37 taken from LINDEN, A.; FENN, J. (2003), P. 5-12

Background 32
Each life cycle - product, technology, industry and hype cycle - provides information about their individual fields of concern. Based on this data, strategies can be derived. The HC is often misunderstood and, therefore, the next section covers the lessons that are intended by this model.
2.3.2 Lessons of the Hype Cycle
The model is often confused with the TLC or the performance S-curve. The model does not provide any information about the actual performance of the technology. The model is meant to strengthen arguments in a discussion of whether a technology should be adopted or not. It gives an overview of a technology’s relative maturity. Gartner Research outlines the following four lessons as the major ones38:
• The adoption rates of technologies should not be driven by peak or trough, they should align with the objectives and strategy
• Type A companies should also consider that pre-trough technologies are very uncertain and unknown. The decisions for such early adoption should be made advisedly
• The HC should help type B and C companies to find early adoption possibilities that fit their roadmap
• This model was developed to educate and increase the awareness of the relation between excitement and disillusionment in regard to technologies. Even though some theoretical inputs about entering an innovative market can be derived, more effective and practice-based tools should be used to this effect. These are, for example, technology radars or scorecards.
To sum up, the HC is a proven tool used to strengthen and explain recommendations of technology planning consultants. Decisions like refusing technologies on the peak or supporting ones in the trough can be based on this model.38
2.4 Process Management
In order to define or create an innovation process, the terms process management and the process itself need to be clarified. The understanding and goals of specific terms such as innovation process, innovation management, and process management are likely to be confused. This section gives an overview of process management and what it is supposed to achieve, defines the term process and all its features, provides commonly used tools and techniques in this area and describes influencing factors for
38 LINDEN, A.; FENN, J. (2003), P. 5-12

Background 33
the actual implementation. Process management can, of course, be split into the two separate terms ‘process’ and ‘management’. Therefore, before describing process management, a break-down of the term (business) process will be presented.
2.4.1 Business Process
A business process is a set of activities which takes a defined input and transforms it into a defined output. In small companies, these processes might be informal and not written down, but they are present on a regular basis. To provide an example, if the sales team creates a new lead for cold calling a campaign and enters the contact information into a customer relationship management(CRM) tool, they might later add some basic information about the call. The main purpose is to be able to more easily remember what the conversation was about after some time. Secondly, if the lead is passed to a colleague, they can take a look at this information. The process is clearly defined: after each call, a new customer is created in the CRM tool and basic information needs to be added. The input here is the new customer, the activity is the creation of a new item in the list and the output is the written form for further processing. In most cases, such small processes are informal and passed from employee to employee during their first weeks of training. This process is often called onboarding - another process that has a defined goal and is triggered by a defined input. The activities might slightly vary, but the set they are taken from is the same. Such a business process can be defined as the sum of the following features39:
• Consists of a logical sequence of activities • Needs an input and transforms it into an output • Needs resources • Oriented towards customer process • Is value-adding • Is subject to consistent process responsibility • Cross-process • Follows clearly defined process goals
While creating a process, the input, output, and activities need to be defined. The first step is to transform the external need into an internal process. Therefore, the process goal is equal to the customer need or the value that is targeted. This goal is broken down into outputs that are measurable. The so-called primary output signals the end of the process. The results can vary for each process, it is either a single output or
39 SCHMELZER, H.J.; SESSELMANN, W. (2008), P. 1-2

Background 34
multiple ones. The primary input is a trigger that signals the start of the process. The trigger can also be a single input or a combination of multiple ones. Everything that exists in the real-world is a valid input or output. The number of triggers usually depends on the potential of the whole process (see Figure 12). The potential is the external condition and the sum of potential inputs. Not every input leads to a trigger and starts the process. The higher the potential, the more often the process will run. On the one hand, high potential usually leads to more triggers, but on the other hand, the nature of the process is responsible for the execution and thus for the output. If the process is not performant or runs into a high number of issues, the potential will not be used. The same holds true for the opposite case: if the potential is low, the best process structure and process management cannot create more output. Therefore, every output presupposes a certain amount of potential. How this potential is used is part of the process management. The combination of high potential and highly functional processes leads to a core competence, meaning a competitive advantage that is hard to imitate, and the ability to use it for new products or markets.40 Eventually, creating such core competences is the overall goal and ensures success.
Figure 12: Potential as input for process40
As stated in the features of a process, resources are needed to execute the included set of activities. We classify resources either as use resources or consumption resources. A use resource is often present in a process for a long time, but is not part of the output. A consumption resource is used once and goes directly into the output. 40 taken from LINDEN, A.; FENN, J. (2003), P. 5-12

Background 35
Additionally, every process should have a key performance indicator (KPI) for the sake of comparison with other processes or simply for budgeting and valuation. Thus, the process resources and their associated costs are a common starting point for calculation and evaluation in the first cycles or runs. Another feature of a process concerns its responsibilities. In a functional approach, the different tasks are done by different experts. Those experts might not have the same supervisor or be in the same division. The interfaces between those divisions are a potential risk factor for information loss. Thus, delays, misunderstandings, and damage are the possible results. In order to avoid such a situation, a process generally benefits from being under unified supervision. The start and end of the process happen in the same division, as well as the arrangement and coordination of subtasks. The result is increased efficiency in decision making and workflows, as there are no long periods of uncertainty while waiting for decisions from other responsible areas.41 From a different point of view on a process, filtering from potential inputs to triggering ones and eventually transforming it to output is often referred as a funnel. This technique originates in the area of marketing and sales and thus is named ‘marketing funnel’.42 Figure 13 depicts such a marketing funnel.
41 taken from LINDEN, A.; FENN, J. (2003), P. 5-12 42 JOBBER, D. (1995)

Background 36
Figure 13: A typical marketing funnel from awareness over consideration to conversion of the product in perspective of a customer43
To summarize: a business process is a defined set of activities which transforms input to output. Every process draws from resources and thus needs a budget and a person responsible for it. As there is more than one process in a company, managers need to make sure that every process runs efficiently and that the sum of them covers the customers’ needs and results in a competitive advantage.
2.4.2 Business Process Management
Process management is an organizational discipline in a company. It manages processes, has a set of tools and frameworks to work with and follows defined goals. Gartner Research defines it as a coordination of the behavior of people, systems, information and other things producing business outcomes in support of a business strategy.44 Process management is often referred to as BPM, which stands for business process management.
43 https://www.semrush.com/blog/content-marketing-funnel-ecommerce-businesses-help-convert-customers/ (09.04.2019) 44 https://www.gartner.com/it- glossary/business-process-management-bpm (11.03.2019)

Background 37
The BPM is a systematic approach to optimizing business processes. Once the principals of BPM are fully implemented in a company, the full potential of the framework leads to solid financial management and transparency regarding the achievement of the business goals.45 Ultimately, the central goals of process management can be summed up in one term: competitive advantage. The way to reach this goal is to increase effectiveness and efficiency. Increasing the effectiveness targets customer value and satisfaction. In contrast, Day46 focuses on customer values as the key factor for success, no matter which strategy is chosen. Porter47 proposes similar thoughts in his work “competitive strategies”. In a study about customer satisfaction, market share and profitability for the Swedish nation, the authors show that customer satisfaction is crucial for economic return up to a certain level. However, strategies that exclusively focus on maximizing customer satisfaction might not be successful in any case. The cost of the provided quality should increase at the same rate as the customer satisfaction.48 Increasing the efficiency, on the other hand, addresses process quality, time and costs. Process quality covers failures and fulfilling the promised expectations. Process time means being able to deliver on time due to the fact that the activities in a process last as long as estimated. The last item, process costs, is the basis for most of the associated costs for the customer. Higher process costs lead to higher selling prices. Eventually, the customer has to pay for the process and, as mentioned above, the costs and quality must align in order to reach the optimal customer satisfaction.48 In order to reach the goals of efficiency and effectiveness, other aspects additional to optimizations need to be considered. The key capabilities of process management are covered in the next section.
2.4.2.1 Key Capabilities
Optimization of already existing processes is crucial for process management. The goal of gaining a competitive advantage is based on steady improvements. Taking full advantage of BPM optimization is only one part. Imagine a process which is designed to handle multiple outputs and neither of them is optimal. In this case, different opportunities are to be considered: optimizing the current process or creating another process from scratch which can fit the current needs perfectly. The current process, though, may have limits in its optimization and although creating and implementing
45 https://www.igrafx.com/de/resources/articles/why-business-process-management (11.03.2019) 46 DAY, G (1990) 47 PORTER, M. (1997), P. 12-17 48 ANDERSON, E.W.; FORNELL, C.; LEHMANN, D.R. (1994), P. 53-66

Background 38
new processes is accompanied by overhead in work and time, this approach has more potential to achieve superb outputs. Therefore, analyzing current workflows is another capability of BPM. Processes that once worked perfectly, might not be efficient anymore, as the environment nowadays is highly dynamic. User groups and their needs are changing, markets are growing and the company might evolve as well. In order to keep up with the competition, an iterative optimization and rethinking of the organization and its processes is essential. In that case, analysis plays a big role in understanding how things are done and whether the results align with the business expectations.49 If the evaluation results show that they do in fact align with the business expectations, the process can be further monitored and optimized. If on the other hand, the target group, for example, has changed over time and the process does not address this group anymore, a new process should be designed. Designing processes is a key capability of process management and focuses on achieving the company’s vision and strategy. While defining a process, different states are to be considered: which departments are involved, which goal is targeted and which activities are planned. The above-mentioned capability of monitoring checks on the KPIs of a process. This can be done for the entire process or for process segments.50 Usually, the KPIs are selected in the definition phase, but as is true for the process itself, the KPIs can also change over time. A common quantitative KPI are the costs spent on a process. In 2.4.2.2 we state different methods to come up with a budget.
2.4.2.2 Budgeting Techniques
According to Corporate Finance Institute (CFI)51 the mainly used types of budgeting methods are incremental, activity-based, value proposition and zero-based budgeting. The most common one is zero-based budgeting. This technique in opposite to an incremental approach focuses on efficiency and necessity. Usually the budgeting starts from scratch and covers only the essential expenses towards running the business or a process. No additional budget is planned in the first hand for extra outputs. That means all expenses are fully justified and needed and thus save their place in the budget. The standard approach is to begin with small positions and add them up until all necessary costs are covered. The benefit of this process is the well justified outcome, which aligns with the intended target of the business, business unit or process. Also starting without assumptions leads inevitable to examining expenditures that furthermore questions and improves the operating efficiency. Lastly in terms of cost reductions this approach helps to cut budget on the lower prioritized parts.
49 https://www.integrify.com/process-management/ (11.03.2019) 50 taken from LINDEN, A.; FENN, J. (2003), P. 5-12 51 https://corporatefinanceinstitute.com/resources/knowledge/accounting/types-of-budgets-budgeting-methods/ (11.04.2019)

Background 39
Contrary to those advantages zero-based budgeting increases the level of knowledge and time in order to deliver the expected outcome. There is also the chance of harming the company culture or brand image as tendentially the focus goes in direction of must-haves and not improvement projects for products or structures. Process management, in short, is a functional part of organizing a company. It works with processes that have a defined input, a set of associated tasks or activities and a defined output. In order to ensure that the processes are effective and efficient, the process management analyzes current workflows, defines new processes, monitors existing ones and optimizes parts of them iteratively. Optimizations, driven by the dynamic environment, often require new behaviors and technologies. For that reason, a critical component in making sure that the used frameworks perform as desired is change management.52
2.5 Change Management
Nowadays, the environment most companies are working in is highly dynamic. Hence, the companies should ideally adapt their strategies based on the market and customer needs at a speed that matches the changes in the environment. Change is an ever-present feature in a company’s lifetime and so is accompanied by strategic decisions.53,54,55 Many ideas and strategies, which always accompany change, are implemented top-down and the decisions are made with a theoretically working approach in mind. According to a 2013 survey of global senior leaders on culture and change management, the success rate of major changes is approximately 54%.56 Frequently, the change strategy has potential, but the employees refuse to work under these circumstances. Communication is the key to implementing change successfully. Thus, the following section focuses on all kinds of change and how employees might react to it. It gives an overview of the different stages that occur after a change message is received and discusses how supervisors should handle these situations.
2.5.1 Basics of Change
The term change might have positive as well as negative associations. Change can bring new opportunities in a relationship, at work or in many other aspects of life. The force that works against change is called inertia. In the medical context, recognizing a 52 taken from LINDEN, A.; FENN, J. (2003), P. 5-12 53 TODNEM BY, R (2005), P. 369-380 54 BURNES, B. (2004) 55 RIELEY, J.; CLARKSON, I. (2001), P. 160-172 56 https://www.forbes.com/sites/brentgleeson/2016/12/07/leading-change-6-reasons-change-management-strategies-fail/#4a18d4b5d9eb (11.03.2019)

Background 40
problem, but failing to act accordingly is called clinical inertia.57 In a strategic context, inertia is described as a situation where change is needed, but where the current structure is too comfortable for people to take initiative. Different emotions play a role as well and can make it hard or even impossible to implement change successfully. Therefore, three important questions should be asked and answered before the implementation to understand all perspectives involved: these three questions are why, what and who is affected by the change(pain)? (see Figure 14). The ‘why’ gives answer to the question of what the reason for the change is. According to Kotter’s change strategy,58 the first step is creating a sense of urgency. What is the story behind the decision? The more knowledgeable the base of the change, the fewer counter cultures will develop afterward. After covering the past and present, the future is the next key message of change. The ‘what’ is the actual change process and the target that is being headed towards. This is the vision and all information about what will be changed and what will be achieved.
Figure 14: Three questions of change59
Further, the structure, processes, and behaviors that are not going to be changed are defined. This ensures a feeling of safety and relief. Simultaneously, motivated people will try to push the idea and overcome their own inertia. However, almost every change produces some degree of ‘pain’. The question about pain provides answers to who is most affected by the change. Those are the people that need to be persuaded of the vision and the benefits. Once most of them are in, the change has good chances of being implemented successfully. The process of change is an iterative one and can be depicted as a loop (see Figure 15).
57 PHILLIPS, L.S. et al. (2001) P. 825-834 58 KOTTER, J.P (2012) 59 DOBLHOFER, S. 2019, based on FATZER in Hernsteiner (4/1997)

Background 41
Figure 15: The systemic loop of change management60
The so-called systemic loop starts with asking the three questions detailed above. The answers to these questions are passed on to the next step, where the current situation is hypothesized. In this stage, the status quo, the problems, and the circumstances are gathered to prepare for the next stage. In the third stage, the planning is done. The previously gathered data is used as a base for the change plan. The change plan combines where the goal is, how we get there, how to handle the pain and when to start. Once this phase is completed, the action plan is created. These four stages together are structured as a loop. The output of one loop is the input for the next one. While implementing the actions, the process is constantly improved to optimize the outcome.61 Once the planning phase is over and the change team wants to deliver the message of the change, some questions regarding four different issues need be discussed beforehand61:
• Issues of culture • Issues of power • Issues of incentives • Issues of fear
60 FATZER (1997), In: Hernsteiner 61 taken from LINDEN, A.; FENN, J. (2003), P. 5-12

Background 42
The discussion of these four issues adds up to a picture of detailing the company culture, the power holders within the company, the incentives of every employee and the fear of the affected people. One of the key factors of success in change management is choosing the right language and the right content, which is described in more detail in 2.5.2.
2.5.2 Change Communication
Communication is a skill that can deliver the same message in many different ways. On the one hand, negatively associated news can seem like new opportunities, but also, on the other hand, a change which leads to a better working condition could be interpreted as an unpleasant situation. Therefore, after thoroughly planning a change, the right words and the appropriate amount of information and repetition influence the result considerably.62 This section describes the two different levels of communication and provides a recommendation for change communication. Further, it discusses the emotional context of change for the affected people and how the communicator should react to it. In change processes, emotions influence the outcome heavily. Every person differs in their strength of reaction to change, but usually, all of them go through the same stages. Commonly, the entire process of change is accompanied by six stages, called the change curve: shock, denial, sobering, acceptance, trying-out and integration.63 The change curve has a similar path to the Kübler-Ross model, which is also referred to as ‘the five stages of grief’.64 The Kübler-Ross curve is an approach towards explaining the emotional stages a patient goes through after receiving a life-threatening diagnosis. Correlations can be observed to delivering the message of an imminent change. Figure 16 illustrates these six stages.
62 DOBLHOFER, S. 2019, based on FATZER in Hernsteiner (4/1997) 63 FATZER (1997), In: Hernsteiner 64 KUBLER, R. E. (1969)

Background 43
Figure 16: Change Curve from shock to integration65
The graph basically shows the energy of a person over time. Before the change, the energy is on a stable level. Immediately after getting the news, the energy crashes and the shock kicks in. The recommended reaction as a leader in this situation is firstly giving people time to realize what has happened and, secondly, creating clarity to make sure people understand why the change is being initiated. After a relatively short time, the phase of denial is paired with an increase in energy. At this stage, people might become aggressive or refuse to work. The leader should confront them with facts and address their inappropriate behavior. Phases 3 and 4, namely sobering and acceptance, can be developed by accompanying people through their sadness - if needed - and making sure the day-to-day business keeps running as usual. Employees ceasing work when they realize that they have to accept the change is the worst scenario. The change will not be successful, if the daily work is not performed by a majority of the team. Sooner or later, early adopters try out the new structure or process effected by the change. Those people need to be supported by providing them with opportunities for exploring. Leaders need to empower their team to join the new situation, but at the same time should not push too hard. The last step is integrating the early adopters, and later the majority, into the change activities.66 The change curve illustrates only the energy over time and does not necessitate the exact sequence as described above. It might happen that stage 4 has already been
65 DOBLHOFER, S. 2019, based on FATZER in Hernsteiner (4/1997) 66 taken from LINDEN, A.; FENN, J. (2003), P. 5-12

Background 44
reached, but suddenly additional information causes people to revert back to denying the change. Loops inside of the curve are frequently seen in practice. This model shows that communicative skill improves the change process tremendously.67 Depending on the situation and stage of the change, two levels of communication are distinguished. The first level describes direct communication to the affected - and non-affected - people. This level is referred to as ‘encounters’ in Figure 17.
Figure 17: Levels of the communication process67
At this level, the message should be clear and the announcer should be supportive and communicate appreciatively. If there are any questions, they need to be clarified quickly. In order to receive feedback and reduce possible mistrust - which is normal in the early phases - active listening is essential. At the second level, the level of the process, the communication is different, as it addresses the company in its entirety. In a change process, the amount of communication is usually higher than normal. Too little information can increase the mistrust and cause more, stronger counter cultures to evolve over time. The medium in this phase is verbal and written communication. The benefit of verbal communication is that more emotions are possible and the benefit
67 taken from LINDEN, A.; FENN, J. (2003), P. 5-12

Background 45
of the written form is that it is fact-based and omnipresent. Everybody that is addressed can revisit it as many times as needed. However, the information need not be complete, as even the change process might change over time. The direction is fixed over the entire process, but the way of getting there might be updated. Even though the information is incomplete, the content that is announced must be consistent. Otherwise, confusion will occur and people might start to question whether a clear picture of the future has even been defined. Lastly, the answers that are given need to be organized proactively so as to deliver a sense of safety. In conclusion, the change communication should be engaging and inspiring, but also realistic and down to earth.68
2.5.3 Blueprint to Addressing Changes
Nowadays our environment is very fast-paced and the market highly competitive. Therefore, many changes are performed in short time frames. To monitor the process in a more effective way, many companies use the blueprint proposed by Kotter when dealing with changes.69 The blueprint consists of eight steps and covers the entire process, beginning with establishing a feeling of urgency until the incorporation of changes into the company culture:
1. Establish a sense of urgency 2. Create a guiding coalition 3. Develop a vision 4. Communicate the vision 5. Empower employees to implement the change 6. Generate quick wins 7. Consolidate and build on the change 8. Anchor the change in the culture
The first four steps deal with building the base of the process. After establishing a sense of urgency, a group of people, called the guiding coalition, is formed to work on the vision. The vision needs to be thought through, as will become important for the fourth step, the communication to the team. Those four steps are the planning and communication phase. As in every project, the better the planning is done beforehand, the fewer surprises and detours from the proposed path are experienced. The time frame of the planning phase is not strict, as only a few people know about the change and those are all fully convinced of it. The next four steps are the culture and behavior
68 taken from LINDEN, A.; FENN, J. (2003), P. 5-12 69 KOTTER, J.P. (2012)
Background 46
forming ones and have the potential to make the change successful or a failure. After communicating the vision to the entire company, the employees need to take action. As described in the previous section, people might go through the change curve at a different pace and be more or less able to accept the change and try out new opportunities. Therefore, empowering employees to implement the change is crucial. In order to keep the motivation high over a long time period, quick wins are much-needed. Those quick wins also empower more employees to overcome their obstructing emotional stages and join the change team. The more people are in, the more the process is integrated in the daily business. The last step, anchoring the change in the culture, usually receives less attention than the other steps. Without anchoring the change in the culture, however, the trust in the leading team might decrease. This can result in problems for future changes. In the implementation phase - steps five to eight - the time and intensity influence the success of the actual and the motivation (and confidence) for further changes. The reason for that is the individual feedback an employee experiences through the change.70 Depending on the depth of the change, there are five ways of addressing it (see Figure 18).71 The intuitive way of reacting to an occurring problem is dealing with it directly. This can be assumed as level 0. In most cases, the issue remains unaffected. Often, a restructuring is required instead. If neither reacting nor restructuring addresses the change, a more fundamental part of the company should be redesigned. The reengineering touches the core processes and scrutinizes them. According to Strebel72, about 70% of all attempts at changing core processes fail. The reason for that is that most underlying mental models are not changed and thus the redesigned core processes remain unchanged as well. In that case, a reframing of those mental models is performed. On top of that, there is a fifth approach to coping with even more fundamental issues. What if action, structure, process and changing the mental model do not lead to the desired outcome? In such situations, a subtler set of contextual variables, namely purpose73, shared vision74 and common will75, should be addressed. This regeneration level retroactively allows for a higher flexibility in the previous levels.
70 taken from LINDEN, A.; FENN, J. (2003), P. 5-12 71 SCHARMER, C.O. (2000), P. 26 72 STREBEL, P (1996), P. 86ff 73 HOCK, D (1999) 74 SENGE, P.M. (1991), P. 37 75 SCHARMER, C.O. (2000)

Background 47
Figure 18: Five ways to address change76
Handling changes always affects hard and soft areas.77 So-called hard areas include project planning or implementing software. Soft areas cover decisions helping people to migrate changes. Therefore, communication, content, language, and timing heavily influence the result. Nowadays, changes are omnipresent as the markets are highly competitive and innovations are forced. Managing innovations and new processes requires skills in change management as much as technical expertise. In the next section, the terms innovation, innovation management, and innovation process are further described.
2.6 Innovation Management
According to the available literature on the topic, a competitive economy has innovation as a basis.78 The degree of competitive success aligns with the capabilities of managing innovations.79,80,81 Therefore, innovation management is crucial to remaining competitive in the market. This section covers the definition of the terms 76 SCHARMER, C.O. (2000) 77 PETRESCU, R. (2010), P. 197-202 78 PORTER, M.; KETELS, C. (2003) 79 BALACHANDRA, R.; FRIAR, J.H. (1997), P. 276-287 80 ERNST, H. (2002), P. 1-40 81 GRIFFIN, A. (1997), P. 429-458

Background 48
innovation, innovation process and innovation management according to the source literature and describes the importance of a well-established innovation culture.
2.6.1 Definition
The term innovation management combines the disciplines of management of innovation processes and change management. Change management and its occurrences in the innovation process are discussed in detail in the previous section. This section focuses on the term innovation management and, in particular, innovation. The term innovation lacks a single definition in literature. Therefore, the broadly used definition “the successful exploitation of new ideas”82 was chosen for the purposes of this paper, since it accommodates a wide range of innovation types, as Adams et al. (2006) reasoned.83 Examples for these types of innovation include product, service, process, administrative or technological. In general, there are three degrees of innovation84:
• Company-wide • Market- or industry-wide • Worldwide
Thus, innovation can be highly subjective, to the point where the same technology might be an innovation for a company, but an established technology within the market. Another frequently used classification of innovation is the classification into so-called push and pull innovations.85 A technology push innovation is driven by a technological breakthrough. The innovation is presented and innovators and early adopters are testing new products. A market pull innovation fits a customer need that already exists with established technologies. It is further necessary to distinguish between innovation management and research and development (R&D). Innovation management enforces competitiveness within the market by enabling innovations, while R&D is just one possible input for an innovation process. Various studies on the subject show that R&D is not an adequate proxy for the whole discipline of innovation management83. Hence, there is evidence that it may mask process inefficiency.86,87
82 TREASURY, H. (1998) 83 ADAMS, R.; BESSANT, J.; PHELPS, R. (2006), P. 21-47 84 https://www.lead-innovation.com/english-blog/types-of-innovation (11.03.2019) 85 OTTOSSON, S. (2004), P. 279-285 86 CEBON, P.; NEWTON, P.; NOBLE, P. (1999) 87 DOGSON, M.; HINZE, S. (2000), P. 101-114

Background 49
Innovation management is the discipline of defining, analyzing, monitoring and optimizing innovation processes. Therefore, an innovation process is a business process that follows the goal of innovating according to a fixed innovation strategy through a sequence of activities that are performed upon a defined input in order to generate a defined output. The process of input generation is highly creative and depends on the culture and organizational structure of a company.88
2.6.2 Innovation Culture
A key success factor in innovation management is taking care of the input. The output of the underlying process is limited by its input, as every process. This category is also called input management. A well-anchored innovation culture should constantly generate inputs, thoughts and ideas to maintain market competitiveness. Such an innovation culture consists of empowering employees to bring new, creative ideas. Trust and certainty that leaders are open to making changes, successfully or unsuccessfully, are required.89 Amabile90 concludes there is a general agreement in the literature on the importance of freedom in individual as well as in group work in order to implement a successful innovation process. In order to reach and maintain this culture, a strong innovation strategy must be developed and implemented top-down. This strategy should align with the strategic orientation88 and thus is more tangible than a rough normative vision for many people. In conclusion, innovation management is an organizational function in a company that targets innovation by managing innovation processes and making use of change management tools. A strong innovation culture enables creativity and constant inputs for the innovation process.
88 taken from LINDEN, A.; FENN, J. (2003), P. 5-12 89 ZIEN, K.A.; BUCKLER, S.A. (1997), P. 274-287 90 AMABILE, T.M. (1998)

Practical Problem-solving 50
3 Practical Problem-solving
This section describes the practical problem-solving of the three main goals in detail to find the answer of the leading scientific question as described in 1.2. Therefore, the techniques and methodologies outlined in the section Background (see 2) were applied. The main goal is the third one, defining an innovation process for CodeFlügel GmbH, which is based on goals number one and two. Goal one outlines the technology stack and basic analysis, based on the platform Google Trends and the four explained life cycles (HC, TLC, ILC, PLC). With this information, we have a rough picture of the services a partner company should offer. The search, evaluation and decision-making process is stated in goal two. Lastly, the section 3.3 takes the gathered information from the previous two goals and the literature on innovation management and change management and presents an implementation-ready innovation process.
3.1 Technology Stack Analysis
As described in 2.1 the technology stack (TS) of a company defines the used technologies and the underlying frameworks. In the first subsection, the process of collecting the data for creating the TS is described. In the second section, this TS is analyzed by using HC (see 2.3), TLC (see 2.2.1) and Google Trends. At the end of the section, the findings are critically discussed.
3.1.1 Technology Stack Definition
This subsection covers the process of the initial technology stack definition, states the business strategy and updates the TS accordingly. The TS is a dynamic list of technologies, frameworks, and tools. The content of this stack reflects the technical expertise of the employees. Some of the frameworks might not be in use at the moment but have been in the past or will be in the future. The content of this list is the sum of the knowledge of the employees tailored to the business direction. As in 2.1.2, defining a TS has among others two benefits: firstly, displaying technical know-how and defining a standard stack and secondly, having central documentation of the used tools and a list of the technologies a company has knowledge in, which improves the decision process for accepting projects. Commonly, an employee with the title Chief Technology Officer(CTO) has an overview of all technologies. Depending on the size of the team and the range of provided services, the number of frameworks and tools can increase fast. Therefore, in order to provide support in these situations, a TS is created. Other positions than the technical leader benefit from this system as well. For example, sales and marketing are areas where technical knowledge isn’t necessary, although the image of a salesperson understanding the basic technical background seems higher

Practical Problem-solving 51
in value. In the company’s experience, scattered instances of sales-supported activities could be prevented with a brief description of every list entry of the TS. The salesperson can focus on their work and feel more confident in communication. Additionally, to get a better understanding of the technical background of the company, the entire team recognizes changes much faster in this fashion. Workflows and processes regarding this topic are developed and optimized over time. The benefit of a standard stack emerges from practical experience in the company CodeFlügel GmbH. Over the last few years, the team has grown, but also fluctuated, a lot. Some projects were handled by one person and only that person had the project-specific know-how. If the technology used is also only known by this one person, this is called a high truck-factor. The truck-factor indicates the dependency on one person for the success of a project. If a person has a high truck-factor in a project and this person leaves the company, the project might fail or produce a lot of overhead. To keep this truck-factor as low as possible, a standard stack for certain technologies should be defined. This decision ensures objectivity in future project technology stack planning. The more projects use the same frameworks, the more experience and less truck-factor is gained. The first task gathers information about the used frameworks and tools. From there, the technologies and niches are clustered. Firstly, we consulted the CTO of CodeFlügel GmbH and then talked to the senior developers in each field. The result is displayed in Table 1. The categorization starts with the main approach of backend and frontend technologies ,which is discussed in 2.1.1, and increases the granularity on demand. Table 1: The Technology Stack after the Initial Survey
Web
Content Management System (CMS) WordPress
Webshop Magento 1 WooCommerce xt:Commerce WebApp AngularJS Parse Angular React Backend PHP Node.JS Firebase JavaEE WordPress Database (DB) MySQL

Practical Problem-solving 52
MsSQL Mongo DB Platform Linux Windows Hosting Hetzner AWS Google Cloud Platform Microsoft Azure
Mobile
Native iOS Android Cross-platform React Native Unity
AR
Framework Vuforia MaxST Wikitude ARCore ARKit ARToolKit Device HoloLens DAQRI ZED Camera
VR
Framework WebVR GearVR Device HTC Vive Oculus Rift DayDream Google Cardboard
Others
Others OpenCV WebGL 3D Engines (Unity/Unreal) 3D Modeling (Blender) Docker Swagger Git Qt IT-Security Agile Development/Scrum
After collecting all the information, the results were clustered into groups. In order to explain to customers what CodeFlügel GmbH offers, the technologies were separated into the following fields:

Practical Problem-solving 53
• Native mobile app development • Cross-platform app development • Website and landing page development • Webshop customization • Web app development • Extended Reality (XR) - AR + VR (+Mixed Reality (MR)) • Windows desktop app development
Afterward, an updated business strategy was applied to the TS. The strategy effected the following changes:
• Focus on XR o Target customers are industry and construction companies in the D-A-
CH area • Phase out web shop, website and landing page development • Reduce the range of services provided in order to achieve niche market
diversification • Increase brand awareness regarding the company’s image as a high-quality
individual software service provider • No more work-for-equity projects
Those changes affected the previously defined TS in the areas of web technologies and the fields of application as Table 2 shows. Table 2: The updated web part of the Technology Stack
Web
CMS WordPress WebApp AngularJS Angular React Backend PHP Node.JS Database MySQL MsSQL Platform Linux Hosting Hetzner AWS
The updated stack is cleaner and includes the following standard web development stack:

Practical Problem-solving 54
• LAMP (Linux/Apache/MySQL/PHP) for Backend • AngularJS for Frontend • Hetzner91 for Hosting
The standard stack is used for every customer project, except if there are explicit requests for one of the alternatives. If the request falls outside the TS, the project is declined. As already mentioned, the communicated branches and niches CodeFlügel GmbH offers have changed as well:
• Native and cross-platform mobile app development • Web app development • XR
The TS reflects the knowledge that exists in the company but need not necessarily reflect the offered services. In order to get an overview of how innovative the current TS is, an analysis was performed. The analysis is described in the next section.
3.1.2 Technology Stack Analysis
The basis of the analysis is the previously defined technology stack. The main challenge of this section is the evaluation of innovativeness. 2.2 and 2.3 discuss the different types of life cycles that might give an insight, but further in more detail the question of which parameters give significant information about the usage and the performance of frameworks and tools raises. Further, the data must somehow be clustered into the branches and main technologies CodeFlügel GmbH offers, which either strengthen or weaken the current strategy. The goal is to gain a sense of the current position in the market broken down to the technologies the company uses for projects. Firstly, an online desk research was applied on the entries of the TS. Therefore the web was screened for methods to forecast technical trends. The idea was to compare the TS with trendy technologies and then adjust the TS accordingly. As no dedicated tool to achieve this goal could be found, different life cycles were considered. The most important ones were Gartner’s hype cycle and the technology life cycle. The former gives an overview of the relative maturity of a technology. As it only covers clustered technologies such as artificial intelligence (AI) or mobile development, it helps in with the positioning of the company in the mid- to long-term, but does not give any information about exact frameworks. The advantage of consulting the hype cycle in
91 Hetzner is a webhosting provider since 1997, https://www.hetzner.com/

Practical Problem-solving 55
order to make decisions in the field of business strategy appears in the ability to distinguish a hyped from a matured technology. The HC recommends when to adopt a certain technology and when to wait. The founders of CodeFlügel GmbH started the company in 2011 with the vision of AR as a performant technology in several fields of business and consumer applications.
Figure 19: Shows the positioning of AR - and VR - on the hype cycle between 1995 and 201792
If we focus on AR, the hype cycle by Gartner says that in 2011, the peak of inflated expectations was just over. The technology had been hyped but could not fulfill the expectations. In such a case, Gartner Research recommends not investing in the technology. For CodeFlügel GmbH it was too early to adopt this technology back then and a lot of overhead work has emerged in the last years. In 2017, Gartner Research suggested having a closer look at the technology, even though the hype was over. At this point, the slope of enlightenment began and the technology eventually delivered the quality the consumers expected. Therefore, the hype cycle is a tool to strengthen decisions concerning the adoption of innovative technologies. Once the expectations and performance of a technology align, the hype cycle for that particular technology ends. Neither native/cross-platform app development nor web development was located on the hype cycle in 2018. Hence, the latter life cycle - the TLC - comes into consideration. The TLC reflects the performance in the market and the adoption rate of technologies. Additionally, the PLC and the ILC can be compared in order to gain a
92 https://twitter.com/lisacrost/status/903201670552748032 (11.03.2019)

Practical Problem-solving 56
better overview of the market/industry saturation. In the particular case of CodeFlügel GmbH, those tools cannot forecast trends or give any information about currently used frameworks. The first lesson learned in performing this analysis was that the given tools work on an abstract layer of technologies and are only helpful for mid- to long-term decisions. If the plan is to create a Picture of the Future these tools might be useful. Therefore, a custom approach was implemented in order to glean further insights about the TS. A possible indicator of quality and performance for technologies and frameworks are download numbers, search counts and community size. The more developers download certain frameworks, the more people are asking questions and search for these frameworks. As statistics do not exist for every kind of framework, the most generic approach is checking search counts. The present analysis focuses on Google as a search engine. Google provides a tool called Google Trends which makes it possible to request statistical data about search terms. The following filter settings are provided: region, time span (going back to 2004), category and search type. Additionally, the results are displayed as interest over time, which means the relative counts for the chosen time span, interest by sub-region, which means the relative count for the sub-regions, and related topics and queries. Here, the focus was on interest over time and worldwide was set as a region. Furthermore, a set of search terms per technology/niche was defined. The problem he analysis tried to address is that search terms might change in use over time and need not reflect the entire technology any longer. Therefore, the following search terms were defined per branch, based on the TS:
• Native mobile app development o Mobile app o Native mobile o Native mobile development
• Cross-platform app development o Cross-platform software o Unity o React native o React-native o React
• Web development o Web application
• XR o Extended reality o Virtual reality o Augmented reality

Practical Problem-solving 57
o Mixed reality o Google cardboard o Virtual reality headset
There are two different ways of obtaining data from the platform: via the website or via an unofficial API. The acronym API stands for application programming interface and is defined as a set of functions which allows building an application that uses data from an operating system, application or service. In that case, the service is the Google Trends platform. Google does not officially provide such an API for this platform. Thus, the only official way is to use the platform itself. For the sake of time reduction, an unofficial API was used which parses the response from the Google Trends server and provides it in a commonly used data file format called JSON, which stands for JavaScript Object Notation. The JSON data is depicted in the form of graphs. The results consisted of three graphs per search term showing the last 12, 36 and 48 months. The benefit of different timespans is the overview on the one hand and the degree of detail on the other hand. After exporting all graphs, the analysis phase was started with a manual comparison of the paths. The goal was to cluster the graphs per branch in order to achieve one of the following results: uptrend, downtrend, oscillating/consistent. Table 3 shows the results.
Table 3: Findings of search term analysis with Google Trends data
Technology/Branch Finding Description
Native mobile app development Uptrend Steady uptrend, similar to cross-
platform
Cross-platform app development
Uptrend Since 2014 strong uptrend; Search term “Unity” is steady though
Web development Downtrend The term “web application”
shows a strong downtrend
XR
Uptrend Multiple impressions, but overall uptrend; VR reached a peak in 2016, from then stagnating; AR shows uptrend; MR is oscillating, seems to be a buzzword
The results show that three out of the four services CodeFlügel GmbH offers show an uptrend. What does that mean for CodeFlügel GmbH and its TS? The set of keywords defined beforehand should represent one branch. Depending on the keywords that are chosen, the results might differ. Therefore, multiple keywords need to be found that

Practical Problem-solving 58
significantly represent a technology. In general, the findings show an uptrend in most of the technologies that are used at CodeFlügel GmbH. There is no radical change in the TS necessary at the moment. The market is interested in the same technologies and thus customers are looking for a service provider in these areas. The downtrend in web development can have multiple reasons. Firstly, there is only one keyword representing the technology. In order to improve the results, further search term evaluation is crucial. Secondly, web development includes several minor technologies like frontend or backend development. The problem is the assignment of technologies into branches. Frontend development also covers mobile frontend, which might fall into native or cross-platform app development. Backend development is needed for all kinds of data management. Whether it is a game, visualization or mobile app that is being produced, most of them need a backend that provides data. Thus, search terms are overlapping and hard to separate in a meaningful fashion. In this section, a TS was defined, which addresses the minor research question of which technologies are used at CodeFlügel GmbH, and an analysis was attempted. It became evident that the given tools like hype cycle, technology life cycle and search term counts give a rough overview of how mature and popular technologies are. The hype cycle seems like a tool to strengthen strategic decisions. Google Trends is a platform that provides a high amount of data which is generated by the users of the search engine. In order to profit from this freely available data, a certain amount of analysis must be added. Many correlations are given but are not resolved. The Gartner Hype Cycle (see 2.3) tries to resolve the confusion about trends which have potential with ones that are simply publicly hyped. Entire companies - like Gartner Inc. - focus on identifying trends and categorizing them. In order to generate a wide range of different inputs for the later defined innovation process, an external partner could provide a different point of view. In the next section, the evaluation of such a trend research partner is described.
3.2 Trend Research Partner Evaluation
An additional, different point of view in terms of input is that it increases the quality and diversification of the entire process. As described in 2.4.1, the input limits the output, as the process just transforms a defined input into a corresponding output. In this section, the focus is on finding and deciding on a trend research partner who can provide input from their point of view and offer decision-making support in the innovation process itself. Therefore, three main tasks are described: online investigation, portfolio preparation, and decision-making. The first section covers the

Practical Problem-solving 59
process of establishing contact with different companies and developing a sense of which kinds of services are provided. In the second section, the potential collaboration partners are selected from the pool of contacted companies. In the last section, the potential partners are further reviewed. A decision with respect to the needs of CodeFlügel GmbH will be provided at the end.
3.2.1 Online Investigation
In order to perform a desk research for the topic of trend research partners Google was selected as a search engine. To accomplish the second goal, which is the evaluation and eventual selection of a partner for trend research and technology consulting, the first step is contacting several appropriate companies. The selection criterion was defined as one or multiple companies offering services or tools which, on the one hand, offer support in upcoming decisions during the innovation process and, on the other hand, provide input from different points of view. The internally generated ideas are mostly based on a technical perspective. The majority of employees has a technical background and actually implements software solutions. Therefore, external partners should ideally balance the basis of inputs for the process. The actual search process for potential partners is begun by feeding the search engine with significant keywords. The policy was to only go after companies appearing on the first result page of Google. The following keywords93 were used for the initial search:
• Trendforscher • Trendforschung dienstleistung • Trendforschung tools • Trendresearcher • Trendresearch partner
After making contact with some of the companies, a decision was made to add the following keywords to the search:
• Technologieberatung • It technologieberatung
93 Some keywords are in German as the company’s language is German as well. The decision was made by the managing directors to prefer German-speaking partners over English-speaking ones, as the focus is on customers from German-speaking countries at this point. As the search would yield different results with translated keywords, German ones were selected.

Practical Problem-solving 60
Eventually, a list of about 30 companies that potentially offered the desired services was thus created. 15 out of 30 firms were contacted, but four of these potential partners never responded. Two of them were contacted through contact forms on their websites, as there was no phone number stated. The third one was based in New York City and thus English-speaking but became obsolete as they never responded either. The fourth one just never responded. Another eight candidates became irrelevant after the initial conversations, the reason being different interpretations of the keywords. All eight companies understood the services they offered in a different way. One of them was a speaker and consultant but not a trend analyst and another one specializes in social trends as opposed to technology or industry ones. The remaining candidates offer the service of interviewing a number of people from different social groups and customers can ask for research in a specific field. This approach was judged impractical for two reasons: on the one hand, keeping track of all technologies on the TS would quickly exceed the budget and on the other hand, the results would be delivered in the form of interview transcripts. Thus, the results would have to be interpreted by CodeFlügel GmbH. Ultimately, only three of the contacted companies were left, the offered services of whom are reviewed in the next section.
3.2.2 Portfolios
The three remaining candidates are referred to as partner one, partner two and partner three in the following sections. In contrast to the other two, partner one offers a tool which works with trends all over the world. Micro trends are published on their platform by a network of scouts who are situated in different positions and industries. The small impulses are tagged with keywords which in turn form larger macro trends. The more micro and macro trends are found in a certain area, the more influence these trends are judged to have on a mega trend. At the moment, 16 mega trends are identified on this platform. This tool can be purchased on a subscription basis. The costs per year per account are between X.XXX € and X.XXX €. This tool, however, only covers one of the services required by CodeFlügel GmbH: generating inputs for the innovation process. Even though partner one offers custom consulting in the area of trends and technologies, this service is not included in the base price. Therefore, a custom offer including the following positions was requested:
• Kick-Off & Research Phase XX.XXX € o Each additional interview XXX €
• Evaluation Workshop X.XXX €

Practical Problem-solving 61
The Kick-Off and research phase includes a pre-research done by partner one and a trend analysis based on their tool. Interviews with industry insiders, which are people actively working in industrial companies, are optional. The evaluation workshop has the following features: conception and preparation for the actual workshop, holding the workshop and postprocessing the feedback given by CodeFlügel GmbH. The offer calculation only includes one branch of the TS. Partner two would function as a middleman between CodeFlügel GmbH and partner one. Therefore, no separate offer exists. The benefit of this partner is that CodeFlügel GmbH is located in the same region, which means reduced travel costs. Partner three has t core competence in the methods of innovation management but does not have any content-based knowledge. Therefore, the company offers a special consulting which takes advantage of their network of over 14.000 partners. This means several interviews per technology are held until a trend becomes visible. The advantage this partner offers is a direct connection to companies which are potential clients for CodeFlügel GmbH. The offer is split into three parts:
• Starter Workshop X.XXX € • per technology X.XXX € • Report and Q&A X.XXX €
The first workshop covers topics similar to partner one’s offer: an introductory meeting including a definition of the requirements. The more time is spent on the goal definition the more closely the final result will match the customer’s expectations. Therefore, a meeting in person is preferred, which causes additional travel costs. The next section of the offer encompasses the actual research task. In the meeting, the technology, branch, niche or specific framework is more closely defined and later analyzed by partner three. The price of X.XXX € is charged per technology researched by them. Lastly, the findings and interpretations are shared with CodeFlügel GmbH in written form as a report. In order to cut costs, the second workshop would be replaced with a Q&A session that takes place afterward. This session should answer any open questions regarding the report and the findings. The duration of the session estimated at two hours. In summary, the three potential partners presented two offers. The overall cost per offering is similar. In the following section, partners one and two were merged, as they work together.

Practical Problem-solving 62
3.2.3 Decision making
Partner one and partner three are left for a decision. The CEO of CodeFlügel GmbH agreed on the following criteria for a healthy long-term partnership between an external partner and his company:
• Content/Value • Relationship • Price
The content part covers the results and findings, as well as the form they will be delivered in. The information must be well-structured and based on numbers and facts. Even though interpretations which are informed by opinions and feelings come from highly experienced people, CodeFlügel GmbH has many academia-based employees that are used to proven fact-based statements. The innovation process is as successful as the members of the team are supportive of the idea behind it. Therefore, a mixture of hard and soft facts is desired for the report. Regarding the report, a short summary of the findings and recommendations should be included. The decision is also based on the relationship between CodeFlügel GmbH and the potential partner. The intention of this collaboration is to generate mid- to long-term inputs and support in strategic decisions regarding innovations. Therefore, the right partner ought to understand the importance of tasks and time frames in order to be a good fit for CodeFlügel GmbH in that case. A healthy connection between two businesses saves money, time and energy, which are three resources that are better used to implement the actual innovation process. Lastly, the price has a say in the decision for the trend research partner as well. CodeFlügel GmbH reserves X.X% of the X.XXX.XXX € revenue per year for investments in the innovation process. The costs for the process itself are covered by another separate budget. In the first cycles, the budget for a partner is relatively low, but the innovation process implementation should not lead to financial bottlenecks since creativity is reduced when the stress level rises. Financial issues foster exactly this effect. Both companies offer similar services (see Table 4): definition phase, research phase and presentation phase (including a report). In terms of content, partner one might be the better choice, because example cases where delivered and that their core competence covers the needs of CodeFlügel GmbH. Additionally, the tool that is offered is taken into consideration for the content evaluation. Therefore, both desired services, inputs for the innovation process and custom consulting in the field of trends and technologies, are provided by partner one. In terms of relationship, both

Practical Problem-solving 63
companies seem to fit CodeFlügel GmbH, even though partner one is in a better position due to the good communication via partner two. The last deciding factor is the price, as listed above. The offered prices for the services are almost identical for partners one and three. Nevertheless, both exceed the budget for the first cycles, meaning a time span of six to eighteen months, depending on the implementation phase. Hence, the decision not to have a cooperation for at least the next two cycles was made.
Table 4: Comparison of the remaining two partners with the three decision-making criteria
Criteria Partner One Partner Three
Content/Value
Core competence in the field of trend research and technology consulting + additional tool for input generation
Big global network ; Consulting per technology with a report as a result
Relationship
Fast and direct communication to partner two, which reduces the travel time
No communication in person, but the main location is Austria
Price Exceeds the budget for the first cycles
Exceeds the budget for the first cycles
To summarize, the two remaining potential partners were discussed and the following three criteria were decided upon: content, relationship, and price. The first two criteria are satisfied by both companies, but both quotes exceed the current budget for external services. Thus, partners one and three are on hold for at least the next two cycles.
3.3 Process Definition
The focus of this study clearly is on the third goal, the innovation process. The innovation process is the tool for answering the guiding research question of staying competitive on the market as software service provider. Owing to this decision, the first two goals, technology stack analysis and finding a trend research partner, emerged simultaneously. Hence, in order to get another perspective, external partners for trend research and technology consulting were targeted. Therefore, the current technology stack of CodeFlügel GmbH had to be outlined and analyzed. Those two goals laid the groundwork for the third, main goal: defining an innovation process. The following sections, list and describe the tasks in detail, explain the different types of inputs for the process, state the necessary managerial positions and activities to complete the

Practical Problem-solving 64
construction and finally present a calculation of the costs for the first cycle. Further, different possible time spans for a cycle are discussed.
3.3.1 Definition of Tasks
In order to shape a defined input into a defined output, a set of activities or tasks are required, which is described in 2.4.1. The tasks vary in terms of effort needed to complete them and in terms of the frequency they should be performed in. Even the performing person might change over time. As this process is designed for CodeFlügel GmbH, a small company per definition, the innovation process and its tasks are hard to separate from other processes. The reason for that is the mixed job descriptions of many employees. In theory, the working scopes are clearly constrained and easy to describe. However, in smaller companies, the person that does the financial part might do the marketing as well. It highly depends on the skills of each person. So, the team that is working on the innovation process, namely innovation management, holds other positions in the company as well. Therefore, the tasks are performed by the entire team, not just by one manager. In the following, all tasks that were elaborated by us are listed and described in terms of their goal and the purpose they hold in the process:
• Monitor Technologies/Trends: There are two aspects to this task: on the one hand, the trends of the technologies that are already in use have to be observed. This is a good way for the team to react in time to changes in the technology life cycle and possibly add a new technology to the stack. On the other hand, there are technologies that are of general interest in the area of software services which might reach a stage that can bring benefits for current and future customers. These can be on the waiting list for the technology stack for some time before they are sorted out or implemented. This task must be prioritized as it is crucial for future competitiveness.
• Budget Planning for the Process: At the beginning, a sub goal is to define what the process (purely management) needs in terms of budget for one cycle. This also includes costs for external trend researchers and method experts. Furthermore, it must be calculated how many internal hours are scheduled for what number of tasks, so that resource planning can take this into account. This budget should be recalculated at the end of each cycle.
• Reserve for Implementation: The innovation process itself provides an overview of the company in terms of innovation and provides recommendations for action. If new technologies are implemented or even a new industry is added to the portfolio, additional estimates have to be made. Neither the costs for the training nor the estimation may be credited to the process. The process budget

Practical Problem-solving 65
will be used for methodology and information preparation. For this reason, a reserve must steadily be built up in order to be available for such cases.
• Central Documentation: The produced information must be written down and made available centrally. This ensures that the same information is not collected more than once and that the truck-factor is kept low. This documentation must be actively maintained and continuously updated.
• Optimizing Processes: After each run, there must be an analysis and preparation phase where new recommendations are derived and the process is evaluated. This step is similar to capturing a KPI. Budget and internal hours are compared with those of previous cycles and optimizations are derived.
• Collect Events/Ideas: Very often it happens that simple applications go viral in various areas. These ideas have to be prepared and evaluated by the innovation management. The findings can inform future internal projects or resource planning. Thus, companies can build up a relatively inexpensive online presence and be called innovative.
• Using Trends Data: The data is curated by Google Trends. It is separated into technologies/industries, which results in a list of keywords. These keywords have to be reconsidered in each cycle and adapted if necessary. New industries are also possible. This includes a rough assessment of the data with monotonic behavior (upward or downward trend or constant) and findings derived from this. For example, there is a peak for one technology every year. It is also necessary to find out whether any out of the ordinary events have occurred at this time. How can an upward trend be interpreted? What events caused the upward trend? Is another keyword more popular in exchange for another? All these questions must be considered and answered by the innovation management in order to derive recommendations for action.
• Pre-/Postprocess Information from Experts: If external partners are used, they will also provide information and make recommendations. These must be recorded and evaluated so that company-specific actions can be derived. The better the coordination with the experts in advance, the less effort will be required for the follow-up. After a few cycles with the same partner, there should be no more differences in content and form and the information can be transferred directly.
• Regular Meetings: Decision-makers must be regularly informed about the status of trends. This can be done for each task or only once per cycle. Ideally, as much data as possible is collected and interpreted before a meeting is scheduled. In a meeting, a decision should always be made on how to work in the future. This means that new insights are presented at the beginning, recommendations are made afterward, and finally, after a discussion phase,

Practical Problem-solving 66
one or more decisions are made together. Before a final decision is made, there may also be a decision for intermediate tasks, depending on the scope of the decision. The task is executed and the team then meets in equal numbers to make further decisions.
• Coordinate Competence Groups: Each new technology is tested in the form of a competence group. Before this special team starts working, innovation management must define a quota of hours and release a budget. This ensures that costs are on budget and resource planning remains accurate. Finally, an implementation period is set. At the end of this period, a meeting is held to present the findings and decide on further steps.
The sum of all the above-described tasks is the basis for creating a business process that approaches a long-term plan and which can be iteratively optimized. Further, high-quality input increases the changes of high-quality outcomes. This high quality level covers features like structure, standardization, accessibility, and content. However, every process comes with changes and those are part of the innovation management’s responsibilities. In order to empower the employees to accept and actively participate in the change and the implementation of this innovation process, clarity, confrontation, involvement, and support are necessary. The next section, covers the different types of inputs that can emerge, the form they should be presented in and who is responsible for further processing.
3.3.2 Input Handling
The innovation process (see 2.6) is involved in different stages of information gathering and processing. Firstly, different kinds of inputs, also called impulses, are generated inside and outside of the company. Every impulse needs a certain amount of preprocessing. The preprocessing includes the content/input itself, links or reference and keywords. Preprocessing immediately after coming up with the input has two advantages: on the one hand, the reason for the impulse is still fresh in mind and can be written down easily. On the other hand, in some cases answering basic questions provides a first overview of the quality of the input. In this case, quality means the maturity of the new technology or the complexity of the system. Assigning keywords to ideas, for example, forces the employee to think further in terms of company culture and vision and to consider whether it is in keeping with the company strategy. After gathering all impulses, the filtering phase begins. Some impulses might get clustered into one and impulses are assessed in terms of information quality, orientation, and maturity. The passing ones are analyzed and described in more detail by the innovation management. The next phase is called decision-making and requires the innovation

Practical Problem-solving 67
management and the managing directors. Once a decision is made, operational processes are initiated to implement the changes. As a common method to position customer in sales and marketing processes is the funnel technique (see 2.4.1). We took the idea of this technique and described the innovation process as an funnel of innovation based on the inputs that are generated. The process from discovering an input to implementing changes/outputs is depicted in Figure 20.
Figure 20: The funnel for innovation with different kinds of inputs
As the first phase covers the different types of impulses, it was decided to differentiate between the following three types:
• Technological impulse • Market-based impulse • External/other impulse
In the following sections, we describe the constraints, factors, and fields to collect these impulses:

Practical Problem-solving 68
Technological Impulse In a software service providing company, the majority of the employees have a technical background and by nature are interested in innovative news. Innovative news can be breaking changes in technology or industry as well as minor changes in a very specific framework. Therefore, one of the already available sources of technical impulses are the company’s own employees. To reap this input and make the developers part of the innovation process, a company-wide channel should be provided. This channel works as an intermediary between developers and innovation management. It can be verbal within weekly or monthly meetings or in written form. The form differs from company to company and mostly informed by the corporate culture. If employees are allowed to ask a critical questions about the strategy and current orientation of the company openly, new ideas can be discussed informally in company-wide channels. Otherwise, a short but informative proposal of change or innovation should be prepared and sent to the innovation management via email. In order to empower employees to share their information, positive feedback for the initiative is crucial. Every input needs to be assessed by the innovation management for its potential and alignment with the vision and strategy. Market-based Impulses As a service company, the majority of work comes from existing markets the company is trying to serve. In order to be innovative, scanning the markets and recognizing their needs is an omnipresent task and a basic way to ensure a competitive advantage. Therefore, every contact point with potential customers needs to be reflected and collected. In most of the cases, there is no extra position necessary to increase those contacts. In general, sales and marketing have most of the direct or indirect connections with the target group in the first place. Concrete examples are the company’s homepage or blog (if one exists). The most important point in this area is covered if user interactions are tracked by an analytics tool. The analysis is helpful in understanding the target group, what drives them to increase performance and hinders this process. Not only innovation management requires this information. The feedback influences different departments within a company, namely marketing, sales, strategic management, and innovation management. From the perspective of innovation management, the focus is on the question which technologies are asked for frequently and which products or solutions would reduce their pain the most. This should be taken as a basis and checked against the current competencies. If no matching competence has been developed so far, it should be determined whether the market is big enough to contemplate a technology stack change. Only mid- to long-term fitting niches and technologies are potential candidates for a technology stack change. If the current software market does not provide a practicable solution/framework to fulfill the

Practical Problem-solving 69
customers’ needs, the feasibility of product development needs to be checked. A further example is a situation of presenting content in front of potential customers at any kind of events. Cluster events, for example, often bring together companies of different areas and sizes. Those events make it possible to address the existing target group as well as similar groups. Discussions about issues and desired software solutions are very welcome and often done automatically. The feedback the innovation management benefits from the most consists of the reasons why people are not yet customers of a particular company. Sometimes, technological impulses which have already been tracked. could solve some of these problems. Although the way of gathering technical and market-based information differs, it plays into each other and makes it possible to derive new strategies in order to increase the competitive advantage and widen the target group. Depending on the market situation, brand awareness, marketing strategy, advertising, and sales promotion campaigns, a company receives a certain number of inquiries. Due to having received multiple impressions of the company, the customers decide to get in touch with a brand with the aim of solving a certain issue or lower a specific pain. The person who processes the inquiry should record it in written form according to a predefined structure. This transforms the mostly unprecise inquiry into a guided interview that gives the innovation management the necessary information to make decisions regarding technological changes or a repositioning on the market. The more data about the pain or problem is collected, the better the response will be tailored. External/Other Impulse Depending on the size of the company, the size of the innovation management also differs. The smaller the team, the more research and analysis on trends and markets is outsourced. Companies focusing on surveilling the markets and its demands as well as technologies and their life cycles often significantly lower their clients’ workload. Additionally, coherence between regions and similar markets should be provided by them and their networks. This kind of information, an agile organization and a little bit of luck can make the difference to placing a company one step ahead of the competition. Thus, external partners might give impulses that are not visible for employees inside the company. The advantages are the external perspective on the same issue, big networks consisting of international partners in several different areas or industries and the manpower to stay current in finding solutions and insights. However, an external partner is costly and the budget might not tolerate an analysis more than once a year. In order support the decision makers with further information, making use of free information and tools is part of the innovation process. As a first step, Google Trends was used to strengthen decisions regarding the technology stack. To enforce the steps of filtering, decision-making and implementation, this information

Practical Problem-solving 70
is deemed an impulse and thus passed over to the innovation management. Over there, this impulse is consolidated with all other impulses and then analyzed impartially. Before filtering and analyzing the generated impulses, the format in which they should be collected must be defined. For the first cycle, a rough standardization is defined and later refined with the help of feedback by the employees and the innovation management team. As mentioned above, inputs can be generated from different backgrounds. Therefore, different points of view in terms of importance are possible, which is why they must be delivered in a standardized structure and with a defined minimum of information, so that further processing can be successfully ensured. A valid impulse must answer the following questions/statements:
• Name the idea in max three sentences. • Give the idea keywords. • Where does the idea come from? Source? Link?
The person who comes up with an idea gives the information concerning these three points. The answers will be delivered to an innovation manager and reviewed. The manager assesses the idea and, if necessary, adds information through further research. As the process ranging from the generation of an idea until the making of a decision regarding impulses for implementation requires organizational effort, the next section covers the workflow of impulses and states the roles and responsibilities of the innovation process.
3.3.3 Innovation Team, Organization, and Decision-making
During the present research, feedback by CodeFlügel GmbH employees about existing processes was gathered (introductions). It became apparent that clear responsibilities as well a well-established innovation culture (see 2.6.2) influence the results severely. Therefore, this section outlines the innovation management team and their responsibilities and organizational tasks such as the regularity and agendas of various meetings. Further, the purpose of competence groups and the communication channels used are described. Innovation Management Team The innovation management is a team of existing employees. These employees cover various areas of competence. This has the advantage of ensuring different perspectives and types of reasoning in the analysis and decision-making. Ideally, the number of team members should be between 4 and 7. In the case of CodeFlügel

Practical Problem-solving 71
GmbH, the team consists of the C-level management (the CEO, CTO and CCO) as well as an organizer further called innovation manager (IM). This provides technical, market-based, and strategic input. Regular Meetings In order to make efficient and final decisions, all decision makers must meet. The reason for this is the need to take into consideration all company management processes when making decisions. Every meeting causes a certain amount of effort, which is included in the calculation of the budget for the entire process. Each non-billable hour can be converted into costs and thus counts towards the consumed budget. For this reason, every meeting must be justified. Reasons for justification would be time, impulses or process changes. The regular time span is set at one month. If it turns out that there is not enough content to discuss, the period is first increased to two months and then to 4 months. If meetings were continued in such a case, the overhead would outweigh the benefit. The reason of impulses refers to the contents of the input given into the process. If there is not enough time in a meeting to discuss all impulses sufficiently, a spontaneous appointment will be defined, which ideally will be scheduled before the next regular meeting. The content of this meeting is limited to the impulses that have not yet been discussed. If this is the case often, a shortening of the period should be voted on. If there are suggestions or announcements about process changes, these are presented or pronounced in the form of a regular meeting or a separately scheduled meeting. Agenda of Meetings The IM leads the agenda and chairs the meeting. Announcements and process changes are addressed first and any decisions are made directly. This is followed by the various impulses accumulated in the last period. Each impulse is presented and should, therefore, correspond to a certain format. An impulse ideally consists of a summary of the content including related advantages and (if applicable) disadvantages for the company. The points mentioned can cover improvement of finances, performance, quality or team atmosphere. Furthermore, the information source must be cited. If further information needs to be collected afterward, this is the starting point of the search. If possible, each impulse should be provided with one or more keywords. The advantage of this is noticeable in the preparation and analysis phase. Groupings are easier to create and misunderstandings are cleared up. If several impulses have the same keywords, this is another indicator that the direction represented by the attached keywords has potential. Many impulses pointing in one direction can also indicate a deficit. If all items on the agenda have been completed before the scheduled time has elapsed, either a brainstorming session on possible innovations can be held

Practical Problem-solving 72
or other company-related topics can be discussed. If competence groups are currently working on projects, there will be an update on the status of progress. The IM is always aware of this because they function as a product owner similar to this concept in SCRUM94. If there are no further open topics, the meeting is closed. Meeting Preparation In order to make the meeting as efficient and high quality as possible, some preparations have to be made. The role in the team defines the scope of the preparations. The IM leads the agenda and the meeting, which is why the agenda must be set before the meeting and is derived from the following questions:
• Are there any announcements to make? • Are there any changes or suggestions for changes in the process? • Are there new impulses? • Where are the competence groups?
Announcements are made by the IM, so the person who has something to announce approaches the IM beforehand and provides them with the information. Changes and suggestions for changes also go through the IM, as they are the method expert in the team. They should know about all the processes in detail. In this way, they can ask critical questions and thus strengthen or invalidate the proposal. Changes in the process design must be well-founded and thought through before they are presented to the whole team. The third question deals with new impulses. In the course of a given period, all impulses are collected and brought into a predefined format. The IM is responsible for ensuring that the person who discovered a new impulse describes it sufficiently and enriches it with sources and keywords. Only when the criteria are met the impulse is scheduled for the next meeting. The last item on the agenda is a competence group update. The project leader of the respective competence group must inform the IM about the progress of the project at regular intervals. Communication Channels Most of the communication at CodeFlügel GmbH takes place via email and Slack95. Slack is a real-time messenger and is often cited as a competitor of Skype96. In Slack, a channel can be created quickly and easily. A channel is a chat created for a specific reason. In this case, it would be an Innovation Impulse channel joined by all team members. Contents can be posted at any time and are usually directly critically
94 SCRUM is a framework that allows teams to work in an agile fashion. (see also https://www.scrum.org/) 95 www.slack.com 96 www.skype.com

Practical Problem-solving 73
evaluated. Active team members usually support or criticize the proposal very quickly and thus a healthy debate about new content arises. Another advantage of real-time messengers is their informal structure. Anyone can ask questions and get initial directions within a very short time. Frequently, questions will be along the lines of "Have we tried X already" or "Why do we do X like this and not like that? This ensures that the same ideas and projects are not implemented more than once. In such channels, the format is not decisive. Creativity should be encouraged and not interrupted. The more discussion and interest, the higher the probability of participation in the further processing of the impulse. If there is enough potential, the impulse is then prepared by the person who gave the impulse or, along with the necessary information, passed on to the IM who then prepares the impulse. After processing, the new input is stored in a Trello97 board. A Trello Board is an online Kanban board and is used as an agile project management tool to visualize work steps and to make the process as efficient as possible. This ensures that all new impulses are processed by innovation management. In the regular innovation management meetings , this board is maintained and, depending on the outcome of the decision, the input is pushed into the respective column. Feedback is then given to the team in the employee meeting. There will also be a short but clear explanation of the decision for impulses that are not followed up on. Every employee should become aware that every impulse is important. This aims at long-term motivation in the team. Consequently, two communication channels must be prepared or set up. On the one hand, a separate channel in Slack and, on the other hand, a Trello board . Both must be sufficiently described and provided with an introduction so that every employee knows about the benefits and use. Any ambiguities should be cleared up as quickly as possible so that the process is slightly but surely integrated into everyday life and ultimately anchored in the culture. Competence Group Each decision in one of the innovation management meetings is followed by an operative task that ensures the implementation of the decision. Internal projects are treated in the same way as customer projects and thus included in project controlling. Consequently, there is an implementation team, a project manager, a product owner/scrum master and a project implementation period. As in every project, the project team starts with an estimate of the hours needed. This is handed over to the product owner via the project manager in the form of an MS Excel sheet. The estimation then results in a budget, which must be approved by the innovation management. Subsequently, the project details go to the project controlling, which plans the necessary resources and defines a project start as well as a rough implementation period. Once the framework conditions have been defined, the budget 97 www.trello.com

Practical Problem-solving 74
has been approved and the resources have been planned, the pre-project process is complete. The implementation team, consisting of developers, project managers, and product owners, is also called the competence team/group. The goal is always to build competencies in a defined area, be it a new technology or a framework as an alternative to an existing one, and to generate value for the company. Competence groups differ from project to project and usually arise out of interest. If a large project, such as integrating new technology into the company, exists, it is divided into smaller sub-projects and worked on one after the other by the same competence team. This ensures that information is not lost and that implementation is not delayed by the need to train further employees. The project managers of the competence groups inform the product owner about the current project status just as they would in the case of customer projects. The format for this is flexible and can vary from project to project. After defining the inputs, activities and organizational tasks, the focus is on the budget and manpower calculation. The time span of a cycle must be defined beforehand. The next section discusses the two variants, six and twelve months, and concludes in a decision on any following estimations.
3.3.4 Cycle Definition
Even though the process of innovation is an infinite game, a timespan which gives an overview of the current state of the innovation process must be defined. This is important for evaluating the performance in order to check how many impulses were entered, how many of them were processed, how many were implemented, which results the competence teams came up with how the technology stack changed, how many meetings were held and whether there are any improvements to discuss. Therefore, two timespans are discussed in the following sections, 6 and 12 months. The comparison shows the benefits and drawbacks of each of the timespans and concludes in a decision for one of them for the first cycle. After every cycle, an evaluation phase is planned to optimize the process. One point to discuss there is the length between the start and end of one cycle. As we already mentioned, this innovation process is a dynamic set of tasks to achieve a specific output. Therefore, the tasks and the timespan be changed over time to improve performance. 12 Months Cycle Figure 21 depicts the iterations of a full cycle, which has a length of 12 months.

Practical Problem-solving 75
Figure 21: A sample 12 months cycle length over two years
As the legend states, M stands for meeting and P for project. Once a month, a meeting with the innovation management team is scheduled. In this meeting, which lasts for two hours, all the impulses of the last period are processed. There is a dedicated column for these impulses on the Trello board. After presenting an impulse, the innovation team discusses the case and how it could be used in the company. If there is not enough potential to put it in the technology stack or perform deeper research on it, the impulse is marked as processed or declined and is moved to the dedicated column on the Kanban board. The impulse is not deleted from the board at this point , so as to avoid processing impulses multiple times. After all, after some time, the number of employees might change and new members may have the same ideas. To handle this while preparing the impulses for the board, the IM checks the declined or implemented column for similar impulses. If there is a match, the team member is clarified about the older impulse and needs to either let the impulse go or reformulate it. In case the innovation management comes to the conclusion that an impulse is worth pursuing, further more detailed discussions about the future project are held. Before setting up a competence team to start implementing, the project needs to be defined and the constraints set. The following questions might be helpful to start with:

Practical Problem-solving 76
• What is the goal? • Why do we need this information/knowledge? • When do we need what information? • What influence has this project? What does it change? Pain? • When is the goal reached? • Does the project go along with the vision/strategy? • Is the goal achievable/realistic?
Only after answering these and other questions, the project has a clear goal, a specific timeframe and the consequences have been consciously considered. Now the project team can be formed, which is called competence team in the figure above. The process is the same as for customer projects : understand the needs, think of a concept, estimate hours for implementation, deliver the estimation to the customer and wait for the approval. The customer/product owner in those projects is always a member of the innovation team. In order to ensure customer happiness and a solution as close as possible to the customer’s expectation, agile project development is chosen. Therefore, regular sprint meetings are planned to adjust the overall goal and the individual tasks as well as to update the product owner regarding the project status. This status is later delivered to the next innovation management meeting . In order to gain an overview of all competence teams and their status, the projects are entered into a project planning tool and updated on the Trello board. This step is crucial towards a decision about newly incoming impulses. The available manpower and the reserves are highly influential factors for starting a new internal project. Too many internal projects delay the start or completion dates of customer projects. This could lead to a lack of cash flow and cause stress within the company. Stress is one of the most effective innovation killers in general and should be avoided at all costs. At the end of each cycle, an evaluation and planning phase takes place. The terms evaluation and planning combine multiple tasks:
• Process optimization • Process performance • Costs
The following sections explain these tasks in detail. Process Optimization The innovation process is a process that works with impulses as inputs, performs a number of tasks and, as a result, increases the innovativeness of a company. In order

Practical Problem-solving 77
to achieve this goal, some work effort and budget must be put into the process. The higher the amount of input, money and time, the more output can be generated. As most small- and medium-sized enterprises are limited in both resources, the optimization of the tasks in the process is a deciding factor. Therefore, at the end of a cycle, the innovation management takes a look at the individual tasks and workflows and evaluates how they are performing. If performance-related improvements are necessary, the changes are immediately implemented. In order to implement changes, the documentation needs to be updated and all members of the innovation management should be brought into the loop. In general, asking critical questions about currently running processes ensures that the iterative process of optimization and improvement remains continuous. The optimization process starts with asking those critical questions like “What workflows have been used?” or “Were the workflows performed until the end?”. The only way to answer these questions is to recap the last 12 months. Therefore, every process step needs to be recorded. This just underlines the importance of continuous written documentation with all available information. If there is enough evidence collected to effect a change to a part of the process, the changes are prepared and announced in the next meeting of the innovation manager. If employees are affected by the change, due to, for instance, having to prepare impulses in a different format, a company-wide announcement should be considered. In addition to the announcement, the documentation should be updated as soon as possible, so anyone absent at the time of the announcement can refer to it later. Process Performance What does the performance of a process mean? The performance can be defined individually but must be measurable and normed. The reason for that is the comparability of a cycle to a previous one. For example, a process runs for three or four cycles and the innovation management decides to change a fundamental part or task. On paper, the change seems to be beneficial and cost-saving or quality-increasing. In practice, there is no value, no performance indicator, that neither strengthens nor weakens this decision. Therefore, deriving one or multiple values from the tasks for evaluation is crucial. Below are some questions that might help to find performance indicators:
• How many impulses given as input? • How many impulses processed? • How many impulses implemented? • How many technology stack changes? • How many competence teams were formed?

Practical Problem-solving 78
• How many meetings took place? Not only the fact-based questions are important, also subjective and emotion-bound ones such as the following ones:
• How would you as an employee rate the process? • Are the tasks a pain to do and do they kill your motivation/creativity? • Has creativity increased in the last 12 months? • What would you rate the company on a scale from 1 to 10 regarding its
innovativeness? The goal of the process is to increase or maintain a certain level of innovativeness in the company. This implies employee satisfaction and freedom, which leads to more creativity and thus to more impulses for the process. Costs One of the most underestimated factors of bringing in a new process are the costs. The process itself – except implementation and projects that result from this process – produces a certain amount of overhead in the form of manpower and budget. Starting at the information gathering phase, the impulses need to be discussed, prepared and posted on a Kanban board. Assuming ten impulses per months are discussed in a chat and it turns out that six of them have the potential to be discussed in more detail and preparing each impulse takes about 15 to 30 minutes, the total preparation time comes down to about two to three hours. The fact that the IM must prepare those impulses and other information for the meeting adds another two hours to this estimate. The meeting takes place with 4 people and lasts for 2 hours. If no impulses are further followed up on, basic postprocessing of one hour is planned. This minimal case requires around 15 hours every month. If there is no position reserved for these activities in the resource planning tool , the process cannot deliver the expected output. The stress level increases, the quality of output decreases. After attaining an overview of the required hours across one year, again depending on the company, a concrete amount of expenses can be calculated by multiplying the hours needed with the costs of one internal hour. Another cost factor is consulting by experts in the fields of technology consulting, trend research and process management, a possibility which should be considered. Impulses from another perspective might increase the quality of the input. Those two positions summed up to give an estimation of the budget that is needed to run the planned innovation process. This budget does not include the implementation of any projects, because the scope of the individual projects cannot be predicted and thus cannot be planned or taken into consideration for this budget. For those cases, another
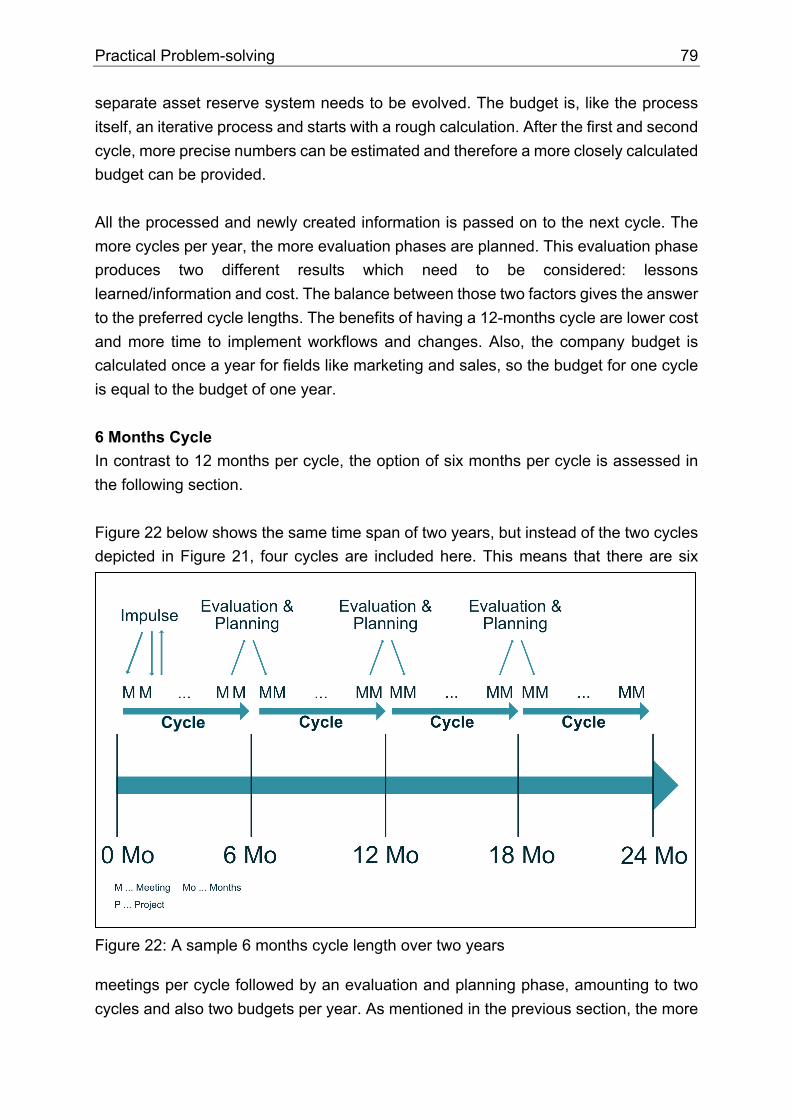
Practical Problem-solving 79
separate asset reserve system needs to be evolved. The budget is, like the process itself, an iterative process and starts with a rough calculation. After the first and second cycle, more precise numbers can be estimated and therefore a more closely calculated budget can be provided. All the processed and newly created information is passed on to the next cycle. The more cycles per year, the more evaluation phases are planned. This evaluation phase produces two different results which need to be considered: lessons learned/information and cost. The balance between those two factors gives the answer to the preferred cycle lengths. The benefits of having a 12-months cycle are lower cost and more time to implement workflows and changes. Also, the company budget is calculated once a year for fields like marketing and sales, so the budget for one cycle is equal to the budget of one year. 6 Months Cycle In contrast to 12 months per cycle, the option of six months per cycle is assessed in the following section. Figure 22 below shows the same time span of two years, but instead of the two cycles depicted in Figure 21, four cycles are included here. This means that there are six
meetings per cycle followed by an evaluation and planning phase, amounting to two cycles and also two budgets per year. As mentioned in the previous section, the more
Figure 22: A sample 6 months cycle length over two years

Practical Problem-solving 80
evaluation phases are held, the more information is gathered. On the one hand, in terms of performance and quality, analyzing the process more regularly is beneficial. On the other hand, increasing the number of cycles per year also increases the cost in the form of overhead by the factor of cycles per year. Operational delays might also occur, as more process evaluation, improvement generation and implementation will arise. The change process takes some time to show its effects, which might become visible within about six months. Nevertheless, the number of meetings over a whole year stays the same for the sake of comparison. The competence teams and their projects are separated as well. 6 vs 12 Months Cycle As stated in the two previous sections, the decision between a half-year and full-year cycle is made considering time, cost and information gathered. Table 5 shows six and twelve-month cycles side by side and provides information about the basis of decision-making. 6 Months Cycle 12 Months Cycle Time 6 months (twice a year) 12 months (once a year) Cost Increased cost for
organization and evaluation
Once a year, an evaluation phase needs to be considered
Information
Content is gathered outside and inside of regular meetings. If change requests for the process are announced, short-term solutions are introduced until the evaluation phase.
Same meeting cycles. Change requests need to be implemented with short-term solutions as the next evaluation phase might yet be some time away.
Flexibility High Medium Benefits Two iterations per year;
more flexibility Lower costs; more mid- to long-term decisions; more planning
Drawbacks Higher costs Less flexible
Table 5: Comparison between 6 and 12 months per cycle
The drawbacks of each cycle length are either higher costs or decreased flexibility. From the perspective of small- or medium-sized enterprises, the cost factor often has

Practical Problem-solving 81
a higher impact on decisions than the actual result. This means that in small companies and start-ups, lots of energy and motivation is available and ready to use, but the low budget and financial constraints hinder entrepreneurs and their employees in getting started with new processes. The innovation process is clearly a mixture of operational and strategic work, which means it is planned in time frames within the next year as well as three to five years into the future. Some decisions are do not immediately influence the financial sector but do have an immense impact on how the company will perform in the future. Therefore, taking more time for consideration and decision-making and using less money is often a good start. Furthermore, implementing the innovation culture takes a longer time for employees than for the managing level. This ultimately led CodeFlügel GmbH to the decision to prefer the 12 months cycle over the 6 months one initially and to evaluate this decision after the first cycle. To sum up, this section looked at the preferred cycle time span. Therefore, the basic workflow of input, which is assessed in the innovation management meetings that take place regularly, and possible outcomes were analyzed and depicted. One reasonable outcome is to start a side project, which is financed by the innovation reserves and owned by a member of the innovation management team, to go after a specifically defined and measurable goal. Further the advantages and disadvantages of each time span were discussed, with the decision to start with a cost-saving and stress avoiding time frame of 12 months for the first cycle. After the first phase, the cycle ends with an evaluation of the process, which includes the chosen time span. As a decision has been made for the 12 months cycle, the budget planning is detailed in the next section.
3.3.5 Budget Planning
As in 2.4.1 described a process is defined by its input, tasks, and output, but also runs in a defined environment in a specified time frame and produces costs. The input, activities and organizational tasks are covered in the previous sections. The remaining part addresses the calculation of the manpower spent on the process itself – not on the implementation of any output - and the planned budget for external resources. Therefore the zero-based budgeting approach is chosen (see 2.4.2.2). In this section, a calculation, which starts from scratch, that covers the total process costs is provided. In particular, the focus is on the defined tasks and on planning an entire cycle of the innovation process. Taking the decision in the previous section in consideration, there is one cycle planned in the first year. This factor and the number of projects and status meetings per cycle are stated in Table 6.

Practical Problem-solving 82
Table 6: Factors for the budget estimation for one cycle of the innovation process
Factors Value Cycle per Year 1 Projects per Cycle 0 Status Meetings per Cycle 10
One cycle per year results from the decision on 12 months as a time span. Projects per cycle refers to implementations by competence groups. The reason for the values zero in this field is based on the lack of records for internal projects. There is no dedicated KPI defined to derive a realistic number of projects in one cycle from. Therefore, for the first year, this field may stay empty and at the end of the first cycle, the numbers are filled in for future calculations. As already mentioned, the innovation process is dynamic in its features and is steadily optimized. Status meetings take place every month, except for December and one month during the summer break. Thus, the count is set to 10. Those factors influence the final estimation of the process. Table 7 shows a listing of the planned tasks for the first cycle.
Table 7: Estimation of the budget for the innovation process for the first cycle
Tasks Hours Input Handling 80 Monitor Technologies 20 Central Documentation 25 Process Information from Experts 0 Status Meetings 80 Coordinate Competence Groups 0 Process Optimization 8 Communication with External Partners 0 Budget Planning 8 Sum 221
Value for Internal Hour € XX.XX Budget External Partner € -
Budget Innovation Process € XXXXX.XX The tasks itself are described in previous sections (see 3.3.1 and 3.3.2). The 80 hours for status meetings result from the ten meetings per cycle at two hours with four people. In sum, approximately 221 hours per cycle are planned for the innovation process. The position for the budget for an external partner was removed for now (see 3.2.3). The
Practical Problem-solving 83
overall budget results from the sum of the external partner costs and the estimated number of hours times XX.XX €. The available budget for the process and the implementation of one project is 3% of the total revenue. Thus, the planned budget has to be below XX.XXX €. In this calculation there are XX.XXX € left for implementation, in particular, 288 hours. The value for an internal hour was calculated with the currently used cash flow system. The implemented cash flow system, roughly described, works as follows: the revenue of the entire company is divided into different positions before costs are paid. For example, 3% of the total income is reserved for the innovation process, 97% are left for other positions, 10% of which are reserved for marketing. Eventually, there are X% left to pay the salaries, rent and other expenses. The residual percentage is profit. This system ensures the 3% reserve for the innovation process grows constantly. If the output of a status meeting results in starting a 100-hour project with a newly formed competence group, then 100 times XX.XX € is booked - at the beginning or end of the project from this position as revenue. This system targets the goal of financial stability and easy controlling.

Summary and Outlook 84
4 Summary and Outlook
Nowadays, being innovative is often a must-have for companies in order to bring new customers and partners into their business. Especially in the dynamic and fast-changing environment of software development, steadily improving the status quo by discovering new technologies, frameworks and niches is essential for long-term market competitiveness. Therefore, implementing an innovation process is crucial to gain an overview of the current products, technologies, and industries, and to consistently adopt the right innovations at the right moments. Based on the business direction of CodeFlügel GmbH, a small software service provider based in Graz, Austria, which is ‘to have fun while creating solutions that help others’ as well as on their interest in new technologies, three coherent goals, which are derived from the guiding research question were defined: technology stack analysis, trend research partner evaluation and an innovation process definition. The goals build on each other, as for the budget planning, costs for an external partner are necessary and in order to describe the requirements to the partners, a knowledge of the currently used technologies is necessary. The result of the technology stack evaluation was a set of technologies and niches CodeFlügel GmbH is serving and a rough trend analysis of those based on the interest over the last 72 months. The platform of Google Trends provided the data. The technology stack consists of four main sections which were analyzed: native app development, cross-platform app development, web app development, and XR development. The first insight shows an overall uptrend for three of four technologies. Web app development shows a downtrend. Nevertheless, the technology remains in the stack, as the source only provides one point of view. The analysis supports the decision-makers but doesn’t necessarily force a change. This findings answer the starting research question of how is the knowledge of the employees distributed by the used technologies. These findings of the technology stack analysis also provided the base for the partner research in the area of trend research and technology consulting. The question asked for partners that conceivably support the decision-making process in the innovation process. Eventually, two potential partners presented custom offers for the needs of CodeFlügel GmbH. Currently, both partners are on hold as the costs exceed the targeted budget for the first cycle of the process. Once the reserves are filled, CodeFlügel GmbH will approach one of the two partners for a long-term working relationship.

Summary and Outlook 85
Finally the guiding research question, which was developing a concept that addresses long-term market competitiveness with the knowledge already existing in the company and support of consulting partners, is answered by a prototype of a customized innovation process. Broken down, a (business) process consists of three parts: input, set of activities and output. An innovation process defines the input that triggers a sequence of actions to generate an output. In this case, the output covers a wide topic of innovation. As innovation has multiple definitions in literature83 the definition that fits the goal of the process was selected: innovation means something new for the inside or outside of the company, no matter whether it is a product, service or process. Thus, the defined innovation process performs processing, filtering and an analysis of actions on new ideas, also called impulses, from different employees and customers. These structured and prepared impulses are discussed in regular meetings with a special team called innovation management. The work includes a detailed description of the activities and steps inside the process and a discussion of the preferred time span of one process cycle. The discussion leads to a 12-month cycle length. Eventually, an estimate of the budget for the process (only) per year is provided. During the work and while introducing the idea of the process to the innovation management at CodeFlügel GmbH, some questions and tasks necessitating further investigation arose and are described in the following.
4.1 Input Preprocessing and Evaluation
In section 3.3.2, the different types of input are described. For the sake of simplicity and structure, a defined form for submitting input is required. After preparing the impulses for the status meeting, the innovation management discusses and decides on future projects. In order to do that, a rating system is requested. The goal is to rate an impulse from a variety of perspectives. Does it affect the technology stack? Does it affect the marketing and sales strategy? Does it affect the business strategy? Does it go along with the vision? How much effort is required and what return on investment is expected? The rating system should cover these and many more essential aspects. Additionally, the rating can easily be compared and therefore should be designed based on product rating systems.
4.2 Key Performance Indicator
In order to evaluate the performance of a process or the overall performance of the company, defining, tracking and questioning KPIs is unavoidable. For now, there is no clear picture of what information could represent the entire innovation process. The

Summary and Outlook 86
process optimization phase at the end of the first cycle will evaluate the tracked information. Potential indicators are the following:
• Impulse count • Project count • Closing rate for sales • Initiative inquiry by customer • Return on investment for process
Those indicators will partially start to be tracked in the beginning and end of the cycle. Other KPIs might present after one or two cycles. The goal of collecting KPIs is to justify budget, manpower shift and overview the performance of processes.
4.3 Internal Costs per Hour
For the budget planning in section 3.3.5, the value in Euro of one hour of work put into the innovation process was discussed. The intention is to estimate the cost of a process and thus be able to compare it. The budget estimation is split into two parts, the hours of work and the costs for the external partner. Thereby, the total costs depend on the value of one internal working hour. The future goal here is to analyze the current numbers and come up with an exact calculation and differentiation of expenses and thus a more realistic value for an internally spent working hour.
4.4 Process Controlling
The focus after the present study is to implement the defined innovation process and empower the employees to live the innovation culture. According to Kotter's eight steps of change98, the last four steps, which introduce the change to the entire team and help them live it, are only successful long-term, if the change is anchored in the company culture. Therefore, communicating the motivation, structure and desired results should happen in written and verbal form, in multiple one-on-one meetings or group discussions. As a result of approaching the idea of creating and implementing an innovation process, processes in operation at CodeFlügel GmbH on a daily basis were discovered. A lack of process controlling as a result of informally communicated and partly unconsciously performed sequences of activities also became apparent. For the sake of accuracy, as many processes as possible should be put into a written format. The implementation of a process controlling system creates more stability in the financial aspects, as the planning is more efficient and from a human resources
98 KOTTER, J.P. (2012)

Summary and Outlook 87
perspective, as a fresh employee’s onboarding shortens in time and thus costs less money. The overhead produced by establishing such a system is usually covered by the savings of the results after a short time.
4.5 Decision Partner and Further Research
In section 3.2.3 the potential trend research partners for the first cycle of the innovation process functioning as external impulse givers and support for decisions were reviewed. As stated, due to budget constraints, no cooperation will take places until the second or third cycle. The two partners who were a good fit content and relationship-wise are currently on hold. The online search started with 30 companies which were narrowed down to seven who were actually contacted. Instead of just waiting for two or three cycles until the budget grows, frequent further online investigation is planned. This increases the chance of finding a different partner earlier and improves the goal definition on the side of CodeFlügel GmbH. The more potential partners question the needs of CodeFlügel GmbH relating to the cooperation, the better these needs and related circumstances will be described. This leads to less but more effective communication.

Bibliography 88
Bibliography
ADAMS, R.; BESSANT, J.; PHELPS, R.: Innovation management measurement: A review, 2006, International journal of management reviews, 8, 1, P. 21-47. AMABILE, T.M.: How to kill creativity, 87. edition, 1998, P. 81-87. ANDERSON, E.W.; FORNELL, C.; LEHMANN, D.R.: Customer satisfaction, market share, and profitability: Findings from Sweden, 1994, Journal of Marketing, 58, 3, P. 53-66. ANSOFF, H.I.; STEWART, J.M.: Strategies for a technology-based business, 1967, Harvard business review, 45, 6, P. 71-83. BALACHANDRA, R.; FRIAR, J.H.: Factors for success in R&D projects and new product innovation: a contextual framework, 1997, IEEE Transactions on Engineering Management, 44, 3, P. 276-287. BOLMAN, L.G.; DEAL, T.E.: Think—or sink: Leading in a VUCA world, 2015, Leader to Leader, 2015, 76, P. 35-40. BURNES, B.: Managing change: A strategic approach to organisational dynamics, 2004. CEBON, P.; NEWTON, P.; NOBLE, P.: Innovation in firms: towards a framework for indicator development, 1999, Melbourne Business School, Working Paper, 99-9. CHRISTENSEN, C.M.: Exploring the limits of the technology S-curve. Part I: component technologies, 1992, Production and operations management, 1, 4, P. 334-357. CONZEMIUS, A.; O'NEILL, J.: The power of SMART goals: Using goals to improve student learning, 2009. CRÉPON, B.; DUGUET, E.; MAIRESSEC, J.: Research, Innovation And Productivi [Ty: An Econometric Analysis At The Firm Level, 1998, Economics of Innovation and new Technology, 7, 2, P. 115-158. DAY, G.: Market Driven Strategy: Processes for Creating Value, 1990, New York, 296.

Bibliography 89
DOGSON, M.; HINZE, S.: Measuring innovation, 2000, Res.Evaluation, 8, 2000, P. 101-114. DYBA, T.; DINGSOYR, T.: What do we know about agile software development? 2009, IEEE Software, 26, 5, P. 6-9. ERNST, H.: Success factors of new product development: a review of the empirical literature, 2002, International journal of management reviews, 4, 1, P. 1-40. FATZER, G., in: Hernsteiner, 4/1997, P. 9. GAO, L.; PORTER, A.L.; WANG, J.; FANG, S.; ZHANG, X.; MA, T.; WANG, W.; HUANG, L.: Technology life cycle analysis method based on patent documents, 2013, Technological Forecasting and Social Change, 80, 3, P. 398-407. GRIFFIN, A.: PDMA research on new product development practices: updating trends and benchmarking best practices, 1997, Journal of Product Innovation Management: An International Publication of The Product Development & Management Association, 14, 6, P. 429-458. HALL, D.: Fail fast, fail cheap, 2007, Business week, 32, P. 19-24. HAUPT, R.; KLOYER, M.; LANGE, M.: Patent indicators for the technology life cycle development, 2007, Research Policy, 36, 3, P. 387-398. HILL, C.W.; JONES, G.R.; SCHILLING, M.A.: Strategic management: theory: an integrated approach, 2014. HOCK, D.: Birth of the chaordic age, 1999. JOBBER, D.: Principles and practice of marketing, 1995. JOHNSON, G.; SCHOLES, K.; WHITTINGTON, R.: Exploring Corporate Strategy. Text & Cases, VIII edition Essex, 2008. KAMAL, M.M.: IT innovation adoption in the government sector: identifying the critical success factors, 2006, Journal of Enterprise Information Management, 19, 2, P. 192-222.

Bibliography 90
KARLSSON, C.: 1988, Innovation adoption and the product life cycle. KHANNA, R.; GULER, I.; NERKAR, A.: Fail often, fail big, and fail fast? Learning from small failures and R&D performance in the pharmaceutical industry, 2016, Academy of Management Journal, 59, 2, P. 436-459. KIM, B.: Managing the transition of technology life cycle, 2003, Technovation, 23, 5, P. 371-381. KOTTER, J.P.: Leading change, 2012. KUBLER, R.: E., 1969., On death and dying. LEVITT, T.: Exploit the product life cycle, 1965, Harvard business review, 43, P. 81-94. LINDEN, A.; FENN, J.: Understanding Gartner’s hype cycles, 2003, Strategic Analysis Report Nº R-20-1971.Gartner, Inc, P. 5-12. MALAKOOTI, B.: Operations and production systems with multiple objectives, 2013. MULLINS, J.W.; SUTHERLAND, D.J.: New product development in rapidly changing markets: an exploratory study, 1998, Journal of Product Innovation Management: an international publication of the product development & management association, 15, 3, P. 224-236. OTTOSSON, S.: Dealing with innovation push and market need, 2004, Technovation, 24, 4, P. 279-285. PETRESCU, R.: Organizational Change Process-Steps to A Successful Change, 2010, Annals of the University of Craiova-Economic Sciences Series, 3, P. 197-202. PHILLIPS, L.S.; BRANCH, W.T.; COOK, C.B.; DOYLE, J.P.; EL-KEBBI, I.M.; GALLINA, D.L.; MILLER, C.D.; ZIEMER, D.C.; BARNES, C.S.: Clinical inertia, 2001, Annals of Internal Medicine, 135, 9, P. 825-834. PORTER, M.; KETELS, C.: UK Competitiveness: moving to the next stage. Business, 2003.

Bibliography 91
PORTER, M.E.: Competitive strategy, 1997, Measuring business excellence, 1, 2, P. 12-17. RIELEY, J.; CLARKSON, I.: The impact of change on performance, 2001, Journal of Change management, 2, 2, P. 160-172. ROGERS, E.M.: Diffusion of innovations, 2010. SCHARMER, C.O.: Organizing around not-yet-embodied knowledge, 2000. SCHARMER, C.O.: Presencing: Learning from the future as it emerges, 2000, 25, P. 26. SCHMELZER, H.J.; SESSELMANN, W.: Geschäftsprozessmanagement in der Praxis, 2008, Kunden zufrieden stellen-Produktivität steigern-Wert erhöhen, 6, P. 1-2. SENGE, P.M.: The fifth discipline, the art and practice of the learning organization, 1991, Performance Instruction, 30, 5, P. 37-37. STREBEL, P.: Why do employees resist change? 1996, Harvard business review, 74, 3, P. 86ff. TODNEM BY, R.: Organisational change management: A critical review, 2005, Journal of change management, 5, 4, P. 369-380. TREASURY, H.: Innovating for the Future: Investing in R&D, 1998. ZIEN, K.A.; BUCKLER, S.A.: From experience dreams to market: crafting a culture of innovation, 1997, Journal of Product Innovation Management: an international publication of the product development & management association, 14, 4, P. 274-287.

Online Sources 92
Online Sources
CFI: Types of budgets - The four common ways to creating a budget, https://corporatefinanceinstitute.com/resources/knowledge/accounting/types-of-budgets-budgeting-methods/, Accessed on 11.04.2019. FORBES: Leading Change: 6 Reasons Change Management Strategies Fail, https://www.forbes.com/sites/brentgleeson/2016/12/07/leading-change-6-reasons-change-management-strategies-fail/#4a18d4b5d9eb, Accessed on 11.02.2019. GARTNER RESEARCH: Business Process Management (BPM), https://www.gartner.com/it-glossary/business-process-management-bpm, Accessed on 10.02.2019. HUBSTAFF: What Is a Tech Stack and Why Do I Need One? https://blog.hubstaff.com/technology-stack/, Accessed on 17.04.2019. IGRAFIX: Why Business Process Management, https://www.igrafx.com/de/resources/articles/why-business-process-management, Accessed on 11.02.2019. INTEGRIFY: Process Management, https://www.integrify.com/process-management/, Accessed on 11.02.2019. LEAD INNOVATION: What types of innovation are there, https://www.lead-innovation.com/english-blog/types-of-innovation, Accessed on 13.02.2019. NORMAN, D.A.: The life cycle of a technology: Why it is so difficult for large companies to innovate?, https://jnd.org/the_life_cycle_of_a_technology_why_it_is_so_difficult_ for_large_companies_to_innovate/, Accessed on 11.04.2019 SVSG: How to choose your tech stack, https://svsg.co/how-to-choose-your-tech-stack/, Accessed on 17.04.2019.

List of figures 93
List of figures
Figure 1: Hype Cycle for Emerging Technologies in 2018 ........................................... 9
Figure 2: Hype Cycle for Emerging Technologies in 2011 ......................................... 10
Figure 3: Life cycle model for branches ..................................................................... 18
Figure 4: Technology Life Cycle concerning Business Gain ...................................... 20
Figure 5: Diffusion of innovations modeled as Innovation Adoption Lifecycle ........... 21
Figure 6: The S-curve concept of the Technology Life Cycle .................................... 22
Figure 7: Product Life Cycle diagram for one product ............................................... 24
Figure 8: Stages in the Industry Life Cycle ................................................................ 27
Figure 9: Gartner’s Hype Curve ................................................................................. 28
Figure 10: Technology Life Cycle Models overlay ..................................................... 29
Figure 11: Phases of the Hype Cycle ........................................................................ 31
Figure 12: Potential as input for process ................................................................... 34
Figure 13: A typical marketing funnel from awareness over consideration to conversion of the product in perspective of a customer ............................................................... 36
Figure 14: Three questions of change ....................................................................... 40
Figure 15: The systemic loop of change management .............................................. 41
Figure 16: Change Curve from shock to integration .................................................. 43
Figure 17: Levels of the communication process ....................................................... 44
Figure 18: Five ways to address change ................................................................... 47
Figure 19: Shows the positioning of AR - and VR - on the hype cycle between 1995 and 2017 .................................................................................................................... 55
Figure 20: The funnel for innovation with different kinds of inputs ............................. 67
Figure 21: A sample 12 months cycle length over two years ..................................... 75
Figure 22: A sample 6 months cycle length over two years ....................................... 79

List of tables 94
List of tables
Table 1: The Technology Stack after the Initial Survey ............................................. 51
Table 2: The updated web part of the Technology Stack .......................................... 53
Table 3: Findings of search term analysis with Google Trends data ......................... 57
Table 4: Comparison of the remaining two partners with the three decision-making criteria ........................................................................................................................ 63
Table 5: Comparison between 6 and 12 months per cycle ........................................ 80
Table 6: Factors for the budget estimation for one cycle of the innovation process .. 82
Table 7: Estimation of the budget for the innovation process for the first cycle ......... 82

List of abbreviations 95
List of abbreviations
AI Artificial Intelligence
API Application Programming Interface
AR Augmented Reality
BPM Business Process Management
CFI Corporate Finance Institute
CMS Content Management System
CRM Customer Relationship Management
CTO Chief Technical Officer / Chief Technology Officer
DACH Acronym for Deutschland (Germany), Austria and Confoederatio Helvetica (Switzerland)
DB Database
HC Hype Cycle
ILC Industry Life Cycle
IM Innovation Manager
JSON JavaScript Object Notation
KPI Key Performance Indicator
LC Life Cycle
MR Mixed Reality
PLC Product Life Cycle
R&D Research and Development
SMART Acronym for specific, measurable, accurate, realistic and time-bound
TLC Technology Life Cycle
TS Technology Stack
VR Virtual Reality
XR Extended Reality