market analysis and productivity of aquaponics in
TRANSCRIPT
Market Analysis and Productivity of Aquaponics in Minnesota
A THESIS SUBMITTED TO THE FACULTY OF THE UNIVERSITY OF
MINNESOTA BY
Marie Abbey
IN PARTIAL FULFILLMENT OF THE REQUIREMENTS
FOR THE DEGREE OF
MASTER OF SCIENCE, APPLIED PLANT SCIENCE
Dr. Neil O. Anderson, Co-Adviser
Dr. Chengyan Yue, Co-Adviser
September 2018

© Marie Abbey 2018

i
Acknowledgements
First and foremost I would like to thank my advisers, Dr. Neil O. Anderson and Dr.
Chengyan Yue for giving me this opportunity and providing the time, energy, and
resources needed to support me while I learned. Thank you for taking a chance on me. I
would like to thank my remaining committee member, Dr. Nick Phelps for his review and
comments on my thesis. I’d also like to thank Michele Schermann and Gianna Short for
their editing and support throughout the process of this thesis.
For the care and keeping of fish I’d like to thank Jessica Coburn, Naxo Riera Vila, Kaylie
Niedzwiecki, Talula Ponuti, and the rest of the Anderson lab. Thank you to Jay Maher for
building and troubleshooting the aquaponic systems. I’d like to acknowledge University
of Minnesota Global Food Ventures MNDrive for providing the funding for this project.
Finally, I’d like to thank my family and friends, especially my husband Darren, for
supporting me though this journey.
ii
Abstract
Aquaponics, the combination of hydroponics and aquaculture into one growing system,
continues to gain popularity on both a hobby and commercial scale. Many studies have
been conducted to improve production methods, but few have examined consumer
preferences for and attitudes toward aquaponics. The first chapter contributes knowledge
to this area with results from an experimental auction that explored consumer preferences
and identified potential market segments, with each segment having distinct preferences
for produce grown in aquaponics systems. Using latent class analysis, participants were
segmented into three classes. Two classes (totaling 70% of participants) were willing to
pay more for aquaponically-grown lettuce than for the potting soil-grown counterparts;
however, all bids were relatively low for a premium lettuce product. For all three
segments, consumers’ increased rating of lettuce appearance and flavor had a significant
positive impact on their bids. Consumers willing to pay the highest price premium
reported the highest environmental concerns and product quality. Typical horticulture
aquaponic production focuses on leafy greens and herbs with no known studies on the
production potential of strawberries (Fragaria ✕ananassa Duchesne) or any other
perennial crop. The second chapter compares day-neutral strawberry yield of ‘Albion’,
‘Evie 2’ and ‘Portola’ in aquaponic productions with different variables of strawberry
yield in greenhouse production using soilless medium. There was no addition of
supplemental nutrients or pollinators to the systems in order to evaluate the differences
between treatments. We found a significant difference among cultivars in number of fruit,
fresh fruit weight, and dry fruit weight with ‘Evie 2’ having
iii
the highest yield in all. There was no significant difference in the number of fruit
produced by strawberries grown in soilless medium and those grown aquaponically. We
did, however, find that aquaponic strawberries had a significantly higher fresh fruit
weight while strawberries grown in soilless medium had a significantly higher dry fruit
weight. This indicates that strawberries grown in soilless medium have a higher mass to
water ratio, although aquaponic-grown strawberries can have a higher fresh weight yield.

iiii
Table of Contents
Page
List of Tables…………………………………………………………………………....iiii
List of Figures…………………………………………………………………………....vi
CHAPTER 1: Market Segmentation Analysis of Consumer Preference for
Aquaponically Grown Produce (Lactuca sativa)
Introduction………………………………………………………………………..2
Materials and Methods…………………………………………………………….5
Results……………………………………………………………………………10
Discussion and Conclusion………………………………………………………14
Tables…………………………………………………………………………….18
CHAPTER 2: An Analysis of Strawberry (Fragaria X ananassa) Productivity in
Northern Latitudinal Aquaponic Growing Conditions
Introduction………………………………………………………………………26
Materials and Methods…………………………………………………………...31
Genotypes Tested……………………………………………………...…31
Experimental Setup………………………………………………………32
Environmental Conditions……………………………………………….33
v
Statistical Analyses………………………………………………………38
Results……………………………………………………………………………39
Discussion………………………………………………………………………..41
Tables…………………………………………………………………….............49
Figures…………………………………………………………………………....56
Literature Cited……………………………………………………………………...…58

vi
List of Tables
Page
Table 1-1: Summary statistics of participant demographics (age, gender, income,
education, employment status, marital status, household size) in the aquaponic
lettuce experiment (N=90)……………………………………………………….……...17
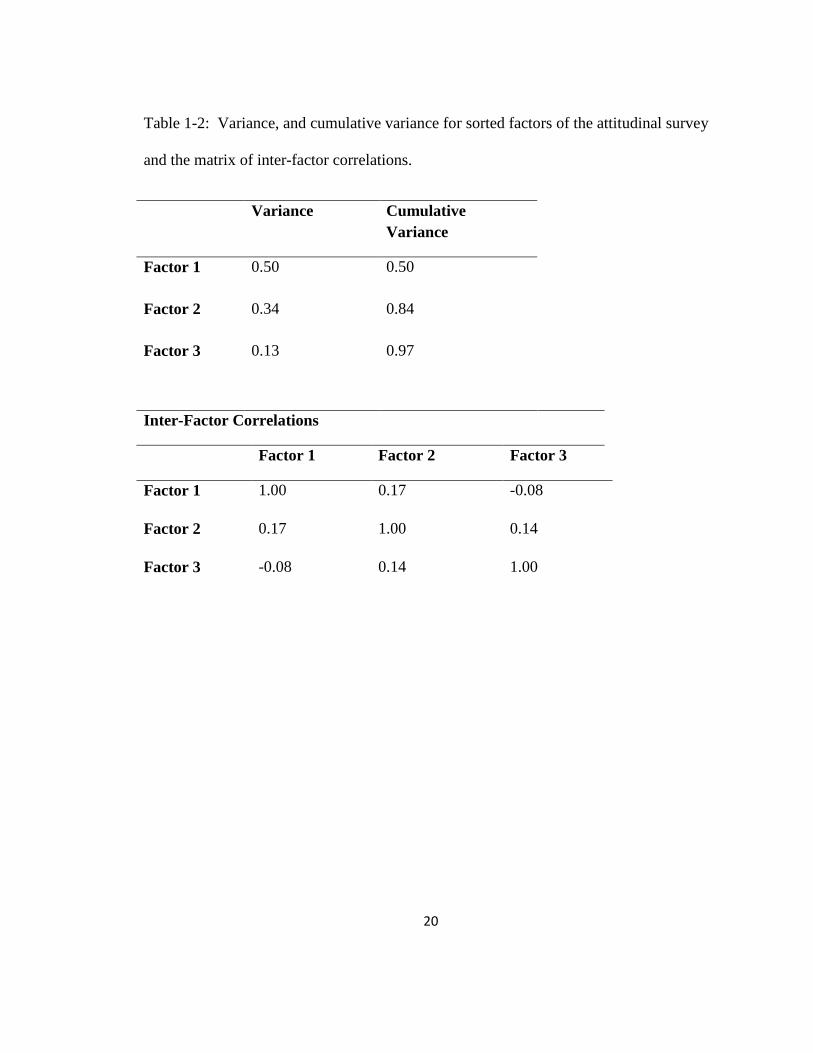
Table 1-2: Variance, and cumulative variance for sorted factors of the
attitudinal survey and the matrix of inter-factor correlations……………………………19
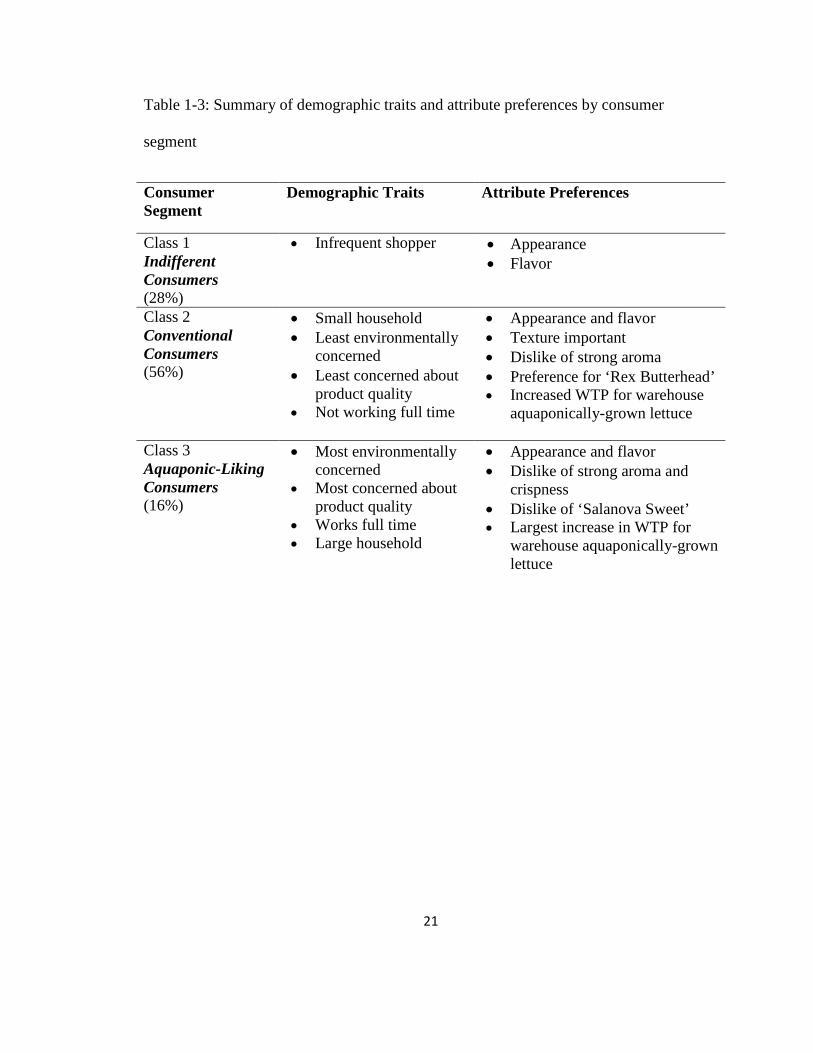
Table 1-3: Summary of demographic traits and attribute preferences by consumer
segment…………………………………………………………………………………..20
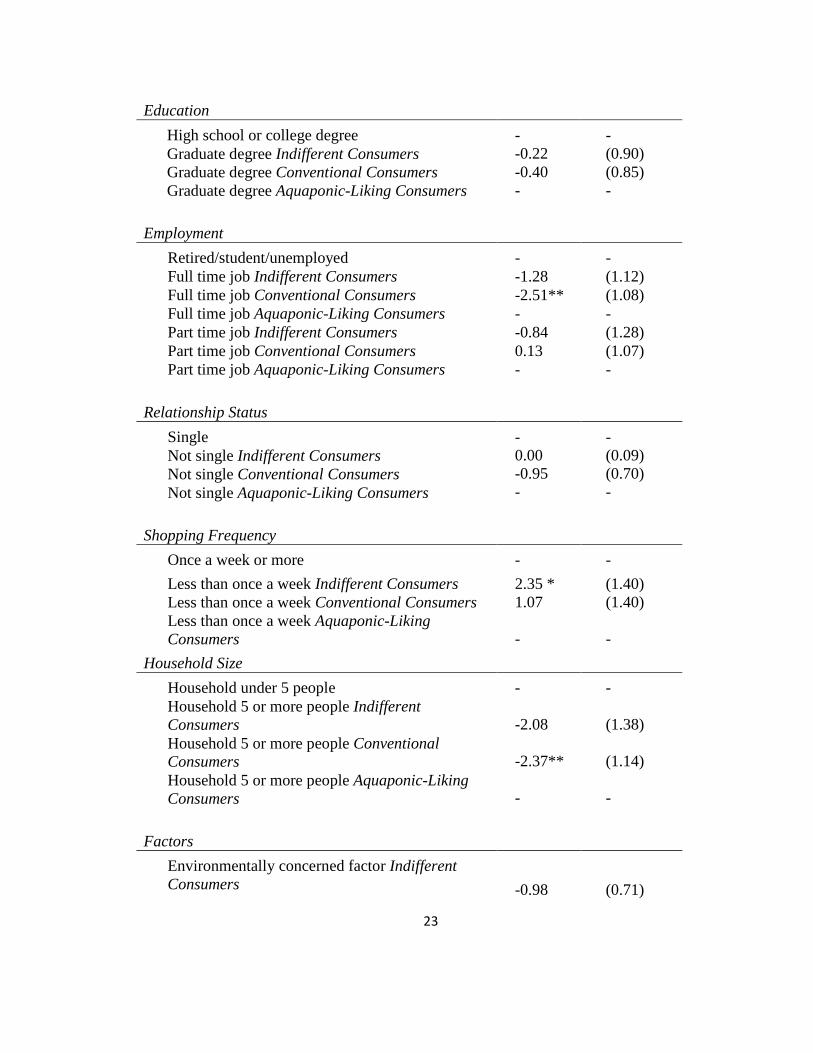
Table 1-4: Latent class analysis for the demographic estimates of participants in
this study……………………………………………………………………...................21
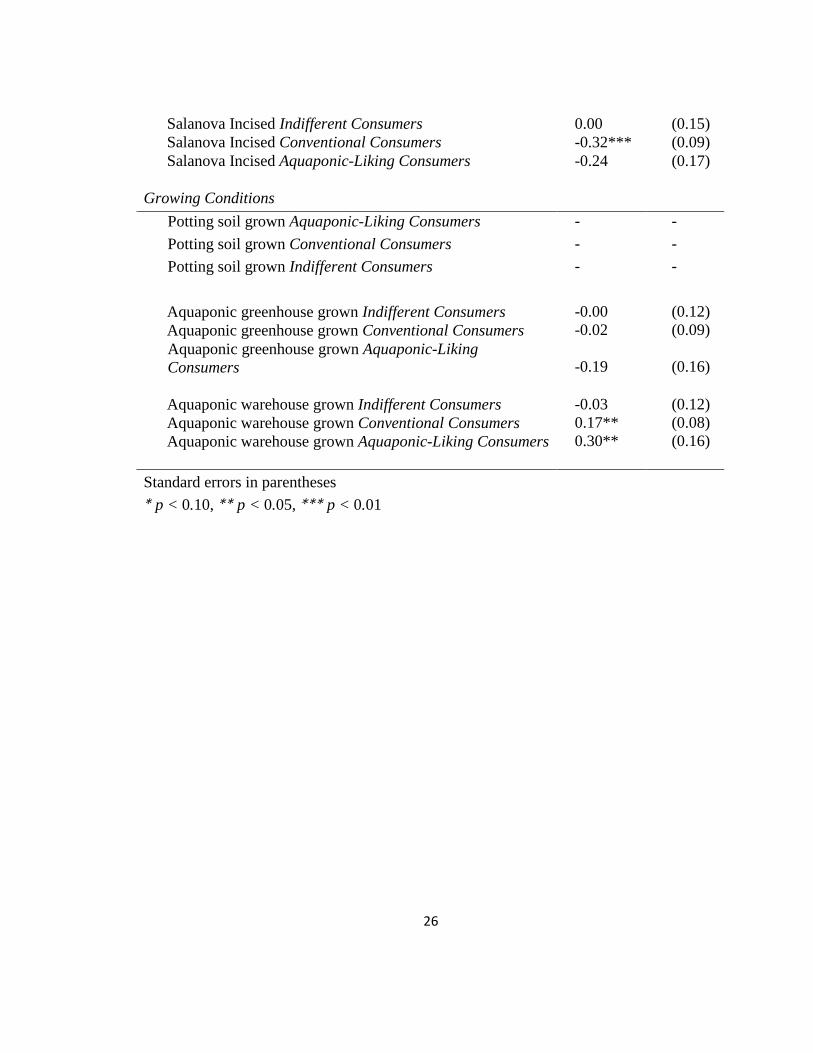
Table 1-5: Latent class analysis estimates in US dollars………………………………..24
Table 2-1: Significance levels of fruit count, fresh fruit weight (g) by plant, and
dry fruit weight (g) by plant of strawberries grown for treatment comparisons................49
Table 2-2: Mean and standard deviation of fruit count by plant per harvest,
fresh fruit weight, and dry fruit weight of day neutral strawberries grown in
soilless medium as well as aquaponic greenhouse and warehouse treatments

vii
and four fish types……………………………………………………………………......50
Table 2-3: Mean and standard deviation of fruit count by plant per harvest, fresh
fruit weight, and dry fruit weight of day neutral strawberry cultivars ‘Albion’,
‘Evie 2’, and ‘Portola’…………………………………………………………………....52
Table 2-4: Amount by month from April 2016 to February 2017 and total number
of fruit, fresh fruit weight (g), and individual fresh fruit weight (g) for all
aquaponic treatments and soilless medium treatment of the day neutral strawberry
cultivars ‘Albion’, ‘Evie 2’, and ‘Portola’……………………………………………….53
Table 2-5: Reported average berry size for the day neutral cultivars ‘Albion’,
‘Evie 2’, and ‘Portola’ using aquaponic (all treatments), hydroponic, low tunnel,
high tunnel, and field production methods……………………………………………...55
viii
List of Figures
Page
Figure 2-1: Diagram of the A-frame ebb and flow system showing the location of
supplemental lighting, biofilter, fish tank, and plant lines with arrows indicating
direction of water flow…………………………………………………………………...56
Figure 2-2: Diagram of the tray ebb and flow system showing the location of the
supplemental light sources, grow beds, biofilter, and fish tank. Arrows indicate the
direction of water flow. Figure modified from Gebhardt, et al. (2015)………………….57

1
CHAPTER 1:
Market Segmentation Analysis of Consumer Preference for Aquaponically Grown
Produce (Lactuca sativa)
Marie Abbey1, Chengyan Yue2, Neil O. Anderson3, Gianna Short4, Michele Schermann5,
Nicholas B. D. Phelps6, Paul Venturelli7, Zata Vickers8
1Department of Horticultural Science, University of Minnesota, 286 Alderman Hall,
1970 Folwell Avenue, St. Paul, MN 55108
2Department of Applied Economics and Department of Horticultural Science, University
of Minnesota, 458 Alderman Hall, 1970 Folwell Avenue, St. Paul, MN 55108
3Department of Horticultural Science, University of Minnesota, 286 Alderman Hall,
1970 Folwell Avenue, St. Paul, MN 55108
4Department of Applied Economics, University of Minnesota, 213 Ruttan Hall, 1994
Buford Avenue, St. Paul, MN 55108 5Department of Horticultural Science, University of Minnesota, 286 Alderman Hall, 1970
Folwell Avenue, St. Paul, MN 55108
6Department of Fisheries, Wildlife and Conservation Biology, University of Minnesota,
135 Skok Hall, 2003 Upper Buford Circle, Suite 135, St. Paul, MN 55108
7Department of Fisheries, Wildlife and Conservation Biology, University of Minnesota,
135 Skok Hall, 2003 Upper Buford Circle, Suite 135, St. Paul, MN 55108
8 Dept. of Food Science and Nutrition, Univ. of Minnesota, 1334 Eckles Ave, St. Paul,
MN, U.S.A

2
Introduction
Aquaponics is the integration of aquaculture (raising aquatic animals, primarily fish) and
hydroponics (the soilless growing of plants) that produces fish and plants together in one
closed loop system (Rakocy, Masser, and Losordo 2006). In general terms, the fish waste
provides a nutrient source for the growing plants, and the plants provide the elimination
of toxic ammonia build up for the water in which the fish live (Diver and Rinehart 2006).
There is no standard aquaponic set-up; systems vary greatly in terms of size, substrate,
water flows, crops, and many other factors. This makes them ideal, in terms of flexibility,
for urban farming since they can be modified to fit almost any space or need (Goddek et
al. 2015).
Aquaponic production has increased tremendously in popularity over the last
decade to capitalize on changing consumer preferences (Love et al. 2014). Industry
growth is expected to exceed 10% total by 2020 (“Aquaponic Farming: Global Market
Intelligence” 2016). Urbanization, population growth, environmental and health concerns
are a fraction of the many factors that are leading some consumers to demand more
locally-grown food (Hundley and Navarro 2013). As the trend of eating locally-produced
food has increased over the last decade (Ruth-McSwain 2012) so has the popularity of
urban farming. Urban farming is utilizing space in urban areas, such as rooftops, vacant
warehouses, or yards, that would not be suitable for traditional agriculture to grow food
(Hashim 2014). This can manifest in small ways such as a backyard garden or on a larger
scale such as an aquaponic warehouse facility. In cold climates, due to freezing winters,

3
year-round urban farming production is confined to indoor growing facilities, such as
greenhouses and warehouses.
Aquaponics has numerous other potential benefits beyond adaptability.
Implementing aquaponics in an urban farming landscape could use 90% less water than
conventional produce growing methods (Dalsgaard et al. 2013). In addition, since the
only water lost in aquaponics is due to evaporation and fish/plant respiration within the
closed-loop system, environmental contamination is not an issue. Urban aquaponics
could also increase shelf life of produce and reduce the risk of food borne illness (Sirsat
and Neal 2013;Shaalan et al. 2018). Overall carbon emissions could also be reduced
because of the shorter distances needed to transport the goods (Bernstein 2011). Some
aquaponic set-ups are also able to increase planting densities with an increase in both
harvest and space efficiency (Suhl et al. 2016).
The most limiting factor of aquaponic industry success is higher operational and
start-up costs as compared to traditional growing methods (Karimanzira et al. 2017).
Raising the price of produce is the most straightforward way to increase revenue and
cover costs, especially since economic success of aquaponic producers is most sensitive
to produce price (Tokunaga et al. 2015). The question then becomes, are consumers
willing to pay a premium for aquaponic produce and, if so, how much? Furthermore, are
there specific groups of consumers who are willing to purchase and pay price premiums
for aquaponics produce and if so, who are they?

4
There have been limited previous studies on consumer willingness to pay (WTP)
for aquaponic produce, especially in the United States. Studies specific to aquaponic
produce have been conducted across Europe (Milicic et al. 2017), Germany (Specht et al.
2016), Malaysia (Tamin et al. 2015), and Romania (Zugravu et al. 2016). Those that
have been conducted focused on consumer knowledge and attitude of aquaponics but do
not further identify consumer segments.
The European studies on consumer attitudes toward aquaponic produce found
similar results. Less than half of respondents had heard of aquaponics and their general
attitude towards aquaponics was neutral. The way in which aquaponics is introduced to
consumers seemed to play a key role in determining consumer preferences. For example,
Milicic et al. (2017) provided a positive definition of aquaponics to respondents and
received positive responses from respondents. Zugravu et al. (2016) found that positive
responses to aquaponics were more likely when respondents were asked to consider the
local and organic aspects of aquaponic systems. German consumers were willing to
purchase produce grown in urban farming systems as long as urban farming was similar
to traditional farming. Specht et al. (2016) found that over 50% of respondents were
willing to buy urban grown produce, but 65% of them also rejected multistory aquaponic
farms. The environmental benefits of aquaponics appealed to European consumers, but
the industrialization aspect did not. Malaysian consumers had a more positive view of
aquaponics in general but they considered “green products” and local production to be
the most important aspects of their purchase (Tamin et al. 2015).
5
A recent study based on the same experiment used in this analysis evaluated
consumers’ WTP for lettuce samples before and after they were told if the samples were
grown aquaponically (Short et al, 2018). The study found no significant differences in
average bids between aquaponic lettuce and the potting soil grown counterparts.
However, the study noted that bids for the aquaponic samples varied significantly
depending on the lettuce variety and whether they were grown in a greenhouse or
warehouse. While on average the aquaponic lettuce did not garner a premium price, one
specific lettuce variety grown in an aquaponic warehouse did. The current study picks up
where Short et al. (2018) left off and explores if market segmentation can shed more light
on preferences for aquaponic produce.
Materials and Methods
Participants were recruited by posting advertisements in 13 local newspapers that
ran across the urban and suburban areas of Minneapolis and Saint Paul, Minnesota. The
screening requirements for potential participants were self-reported regular buyers of
produce who were at least 18 years of age. The study took place over two weekends in
December 2016. Participants were placed in groups of 10-12 for the hour-long sessions.
In total, we had 91 participants grouped into eight sessions. One participant’s responses
were dropped due to incomplete information.
We ran Vickrey second-price auctions to elicit consumers’ WTP (Vickrey 1961).
Vickrey auctions are private auctions where participants do not know others’ bids before
they submit their bids. This method was chosen in order to reduce the possibility of over-

6
or under-bidding. It has been proven that Vickrey auctions are incentive compatible, that
is, people submit bids that sincerely reflect their true value for the goods (Yue, Hurley,
and Anderson 2011). For the second-price auction, the highest bidder wins the auction,
but only has to pay the second highest price. Those with winning bids took home the
head of lettuce they won after paying the bid from their compensation. Participants were
compensated $40 for those who did not win an auction and $40 minus the winning bid for
those who did win.
Participants bid on nine different 8-ounce (227g) heads of lettuce. Three different
cultivars of green lettuce were selected for this experiment, ‘Salanova® Green Sweet’,
‘Salanova® Green Incised’, and ‘Rex Butterhead’. Each were grown in three different
conditions (treatments): greenhouse potted soilless medium, Sunshine brand LC8 potting
mix (Sun Gro Horticulture, Agawam, MA), greenhouse aquaponics (Koi fish), or
warehouse aquaponics (Koi fish); 3 cultivars X 3 treatments = 9 samples. The main
difference between the aquaponic treatments was that warehouse aquaponic plants were
grown with entirely artificial light (low emitting diodes, LEDs, Agrivolution LLC,
http://www.agrivolution.co), whereas greenhouse aquaponic plants were grown with
natural sunlight. Samples of each lettuce (individual leaves) were given to participants so
they could examine and taste the lettuce more easily. Each sample had a corresponding
head of lettuce on display so that participants could closely examine its appearance.
After the auction procedure was explained, example questions related to the
auction mechanism were given to participants. Answers to these questions were
announced afterwards to help participants understand the mechanism. After participants

7
examined and tasted each sample, they rated six attributes (overall liking, appearance,
flavor, crispness, texture, and aroma) on a 7-point scale regarding the degree of how
much participants liked the attribute in each sample with a range from “Dislike very
much” to “Like very much.” A seventh attribute (bitterness/mildness) had a 7-point scale
that ranged from “Extremely mild” to “Extremely bitter”. They then placed a bid for each
sample. Participants were not informed of the growing conditions for the first round of
bidding.
After the first round of bidding, it was then explained what aquaponics was and
which samples had been grown under what conditions. The brief, neutral definition of
aquaponics was given to participants as follows: “Some of the lettuces are aquaponically-
grown. Aquaponics is the integration of aquaculture (raising fish) and hydroponics (the
soil-less growing of plants) that grows fish and plants together in one system. The fish
waste provides a food source for the growing plants and the plants provide a natural
filter for the water the fish live in.” Participants were then told to bid a second time on
each lettuce sample. The session then ended with a survey on participants’ demographics
and attitudes towards aquaponics.
The attitudinal survey had 50 questions total in three different sections using 7-
point rating scales1. The first section contained 15 statements and asked, “How much do
you agree with the following attitudinal statements about aquaponics” with the scale
ranging from “Strongly Disagree” to “Strongly Agree.” The second section asked, “How
important to you are the following statements about aquaponic production compared to 1 Full survey instruments can be made available by the authors upon request.
8
conventional soil production” where the scale ranged from “Very Unimportant” to “Very
Important.” This section contained 14 different statements. The third section contained 21
statements and posed the question, “When thinking about aquaponic agricultural system
and aquaponically grown produce, how much are you concerned with the following
aspects” with the scale ranging from “No concern at all” to “Extremely concerned”.
Factor analysis was applied to the attitudinal survey questions. Factor analysis is
used to consolidate multiple variables into new variables while still keeping as much
variation of the original data as possible (Jolliffe 1986). Questions were consolidated into
factors. Questions with standardized regression coefficients higher than .4 in more than
one factor were eliminated in order to determine distinctive factors without significant
overlap. Three factors were determined using the Scree test (Cattell 1966). Refined factor
scores were assigned to each participant and included as a variable in the following
segmentation analysis. Factor scores are composite variables which represent each
participant’s placement in each factor (Distefano and Mîndril 2009). Factor scores were
calculated using software SAS 9.4 (Cary, North Carolina).
Latent Class Analysis (LCA) was then used to separate participants into different
classes of consumer. LCA is used to measure indirect, or latent, variables using
observable indicator variables (Collins and Lanza 2009). LCA is used most in social
sciences and other fields to explore underlying consumer segments in terms of their
preferences for various products (Bartholomew 2011).
9
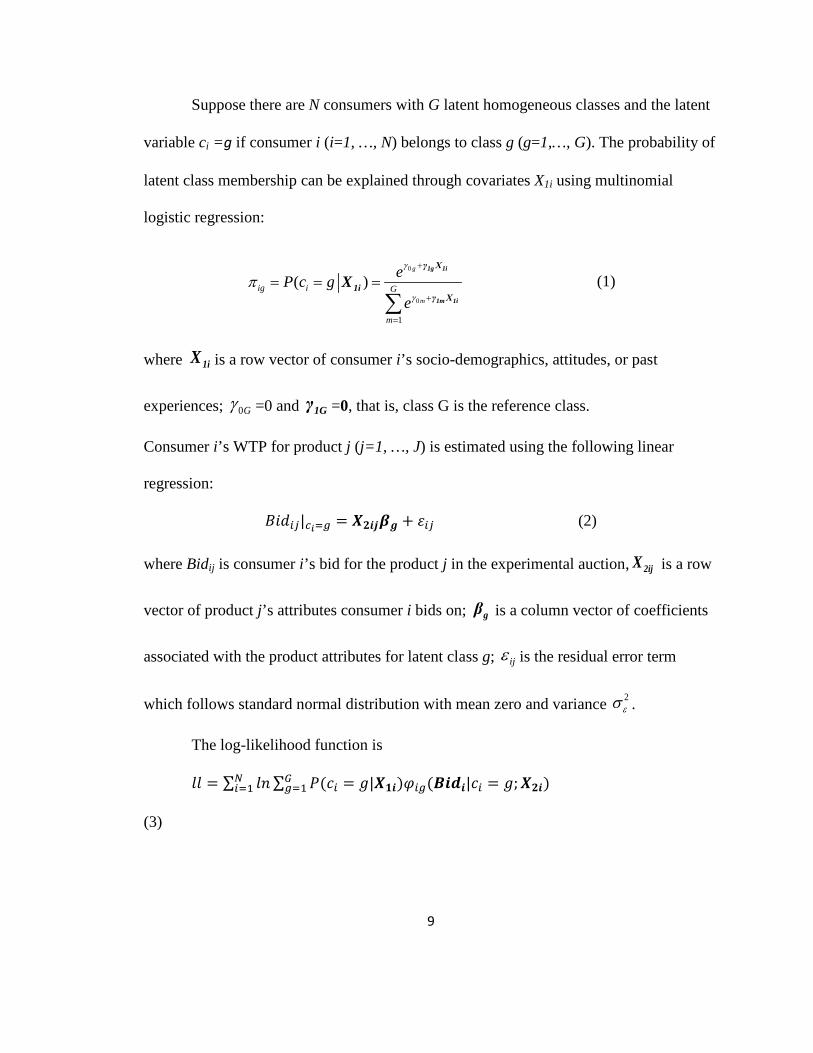
Suppose there are N consumers with G latent homogeneous classes and the latent
variable ci =g if consumer i (i=1, …, N) belongs to class g (g=1,…, G). The probability of
latent class membership can be explained through covariates X1i using multinomial
logistic regression:
(1)
where is a row vector of consumer i’s socio-demographics, attitudes, or past
experiences; =0 and =0, that is, class G is the reference class.
Consumer i’s WTP for product j (j=1, …, J) is estimated using the following linear
regression:
𝐵𝐵𝐵𝐵𝐵𝐵𝑖𝑖𝑖𝑖|𝑐𝑐𝑖𝑖=𝑔𝑔 = 𝑿𝑿𝟐𝟐𝟐𝟐𝟐𝟐𝜷𝜷𝒈𝒈 + 𝜀𝜀𝑖𝑖𝑖𝑖 (2)
where Bidij is consumer i’s bid for the product j in the experimental auction, is a row
vector of product j’s attributes consumer i bids on; is a column vector of coefficients
associated with the product attributes for latent class g; is the residual error term
which follows standard normal distribution with mean zero and variance .
The log-likelihood function is
𝑙𝑙𝑙𝑙 = ∑ 𝑙𝑙𝑙𝑙∑ 𝑃𝑃(𝑐𝑐𝑖𝑖 = 𝑔𝑔|𝑿𝑿𝟏𝟏𝟐𝟐)𝜑𝜑𝑖𝑖𝑔𝑔(𝑩𝑩𝟐𝟐𝑩𝑩𝟐𝟐|𝑐𝑐𝑖𝑖 = 𝑔𝑔;𝑿𝑿𝟐𝟐𝟐𝟐)𝐺𝐺𝑔𝑔=1
𝑁𝑁𝑖𝑖=1
(3)
0
0
1
( )g
m
ig i G
m
eP c ge
γ
γπ
+
+
=
= = =
∑
1g 1i
1m 1i
γ X
1iγ X
X
1iX
0Gγ 1Gγ
2ijX
gβ
ijε
2εσ

10
where and are matrices of J row vectors of and respectively; 𝜑𝜑𝑖𝑖𝑔𝑔is
the pdf of multivariate normal distribution with mean and variance matrix 𝜎𝜎𝜀𝜀2𝐼𝐼𝐽𝐽;
is a J X J identify matrix (Verbeke and Lesaffre 1996; Proust and Jacqmin-Gadda 2005).
The estimation was conducted using software R 2.13.2 (Boston, MA, USA).
Results
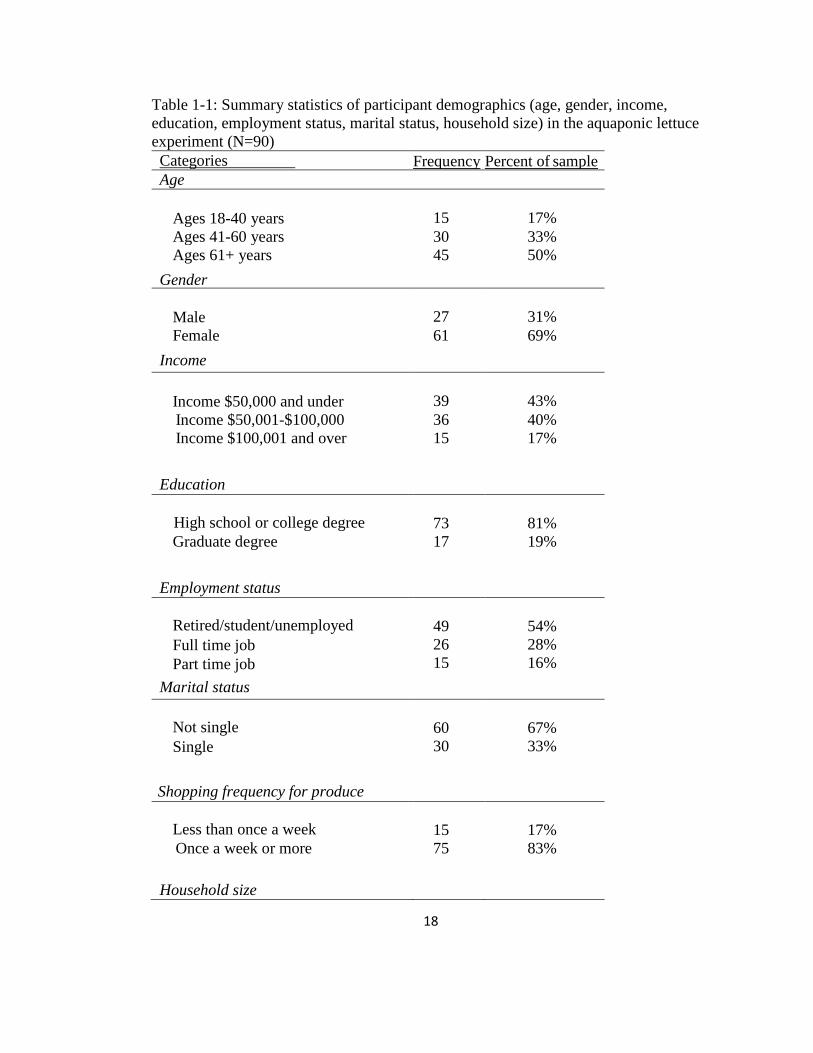
A summary of participant demographics can be found in Table 1. All participants
had a high school education or greater and 19% had a graduate degree. The majority of
participants, 69%, identified as female. The average age was within the range of 41-60
years old; 67% were either married or had a partner and the average household size was
2.33 people. Eighty-three percent of participants reported shopping for produce once a
week or more2.
We did not find a significant difference between bids of potting soil-grown and
aquaponically-grown lettuce (Short et al. 2018). The average bid for all potting soil-
grown samples was $1.48 while the average bid for all aquaponically-grown samples was
$1.47. This does not distinguish between samples grown in the aquaponic greenhouse and
those grown in the aquaponic warehouse. However, aquaponic treatments were
distinguished in the current analysis in order to determine if aquaponic treatments had an
effect on consumer WTP.
2 We used slightly different demographic categories than in Short et al. (2018) in order to capture the significant differences of consumer WTP across the different segments.
2iX iBid 2ijX ijBid
2i gX β JI
11
As seen in Table 2 three factors explained 97% of the variance in the attitudinal
survey, and inter-factor correlations were all less than 0.18. Factor 1, which accounted for
50% of the attitudinal survey answer variability within the analysis as seen in Table 2,
was characterized by participants who thought that it was very important for aquaponic
production to be more productive, energy efficient, and well suited to urban environments
compared with conventional production. Factor 1 was named ‘environmentally
concerned.’ Factor 2 explained 34% of the variance, and was characterized by the high
importance of appearance, freshness, and fewer blemishes on produce. Factor 2 was
named ‘product focused.’ Factor 3 accounted for 13% of the variance and was
characterized by high levels of concern for nutrition, chemical residue, and genetic
modification in aquaponic production. Factor 3 was named ‘health focused.’
Each participant was assigned a factor score, which was their relative probability
of choosing similar answers to other participants on the same questions. Participants with
a high score in factor 2 were unlikely to answer similarly to participants with a high score
in factors 1 or 3.
Results of the Latent Class Analysis are presented in three tables: summary
characteristics of the consumer classes (Table 3), class membership (Table 4) and product
attribute (Table 5). The class membership table (Table 4) presents coefficient results for
each segment’s demographic variables of. The coefficients represent the relative
likelihood of a participant with certain demographic characteristics being in each class
(with class 3 as the base for comparison). The product attribute table (Table 5) presents
coefficients for the lettuce attributes or lettuce attribute ratings.The second section
12
presents cultivar coefficients use ‘Rex Butterhead’ as the comparison and represent the
difference between ‘Rex Butterhead’ and the listed cultivar. In the third section, growing
condition coefficients use potting soil as the base for comparison and represent the
difference in bid between potting soil and the listed growing condition.
Using the significant results from the class membership classification and product
attribute tables (Tables 4 and 5), we classified participants into three latent market
segments. The summary characteristics of the consumers in the three segments are shown
in Table 3. Class 1 accounted for 28% of participants and was characterized by
consumers who infrequently purchased produce (more likely to purchase produce less
than once a week) (Table 4). Neither growing conditions, nor lettuce attributes beyond
appearance and flavor had an impact on this segment’s WTP (Table 5). Class 1 was
named Indifferent Consumers, to reflect these characteristics.
Class 2 accounted for 56% of participants. These consumers are less likely to
have a large household, full time job, or be product focused or environmentally
concerned (Table 4). Class 2 participants have increased WTP for aquaponically-grown
lettuce as long as it is the ‘Rex Butterhead’ cultivar (Table 4), which is the cultivar the
most closely resembles common ‘Iceberg’ lettuce. Class 2 was named Conventional
Consumers. Class 3 accounted for the remaining 16% of participants. Class 3 consumers
were not likely to be in any particular demographic but exhibited environmental concerns
and considered product quality as significantly (at .05 significance scale) more important
than Indifferent Consumers and Conventional Consumers. They had the highest WTP for

13
aquaponically-grown produce of the three classes and were named as Aquaponic-Liking
Consumers to reflect their increased WTP for aquaponically-grown lettuce.
Indifferent Consumers had the lowest average bid for all lettuces (both aquaponic
and potting soil grown), $1.35. Conventional Consumers had an average bid of $1.44.
Aquaponic-Liking Consumers had the highest average bid, $1.58. Table 4 presents the
coefficients of demographic characteristics for each class of consumers, using the
coefficients for Aquaponic-Liking Consumers as the base for comparison. As shown,
Conventional Consumers were significantly less likely (at the 95% significance level) to
have a full-time job than Aquaponic-Liking Consumers. They are also less likely (at the
95% significance level) to be living in a household with five or more people. Neither age,
income, gender, marital status, nor education level was significantly different between
consumer segments. Conventional Consumers were significantly less likely to be product
focused and environmentally concerned than Aquaponic-Liking Consumers.
As shown in Table 5 increased appearance and flavor ratings had a positive
impact on WTP (significant at 95% or higher) to all three types of consumers in
determining their bids. Likewise, increases in bitterness (which can be a negative
attribute) had a negative impact on participants’ bids. An increase in lettuce texture rating
significantly positively affected Conventional Consumers’ bids. The higher the aroma
rating (which means the stronger the aroma), the lower the bids for Conventional
Consumers and Aquaponic-Liking Consumers. It indicates participants in these two
segments did not like intense aroma in lettuces. Conventional Consumers also showed
stronger preferences for ‘Rex Butterhead’ lettuce as indicated by the significant (at the

14
99% significance) lower bids for the other cultivars. Indifferent Consumers had no
significant preferences for other lettuce attributes beyond an increase in WTP for
improved appearance and flavor, and a decrease in WTP for increased bitterness.
Aquaponic-Liking Consumers disliked ‘Salanova Sweet’ lettuce as compared to ‘Rex
Butterhead.’ Crispness also significantly positively impacted Aquaponic-Liking
Consumers’ bids. Conventional Consumers and Aquaponic-Liking Consumers bid
significantly higher for warehouse aquaponically-grown lettuce than potting soil-grown
lettuce.
Discussion and Conclusions
Aquaponic production has increased in popularity in recent years, yet few studies
have explored potential market segments for consumer preferences for produce grown in
aquaponics. Using experimental auctions and latent class segmentation analysis, this
study fills this knowledge gap and our results have important marketing implications. We
identified three consumer segments with distinct preferences for lettuce grown in
aquaponic production systems.
Based on the findings from the market segmentation analysis, some general
conclusions can be drawn about the types of consumers most likely to pay a higher price
for aquaponically grown lettuce. Aquaponic producers hoping to increase revenue using a
price premium need to focus their marketing on the environmental benefits of aquaponics
while maintaining a high-quality product.
15
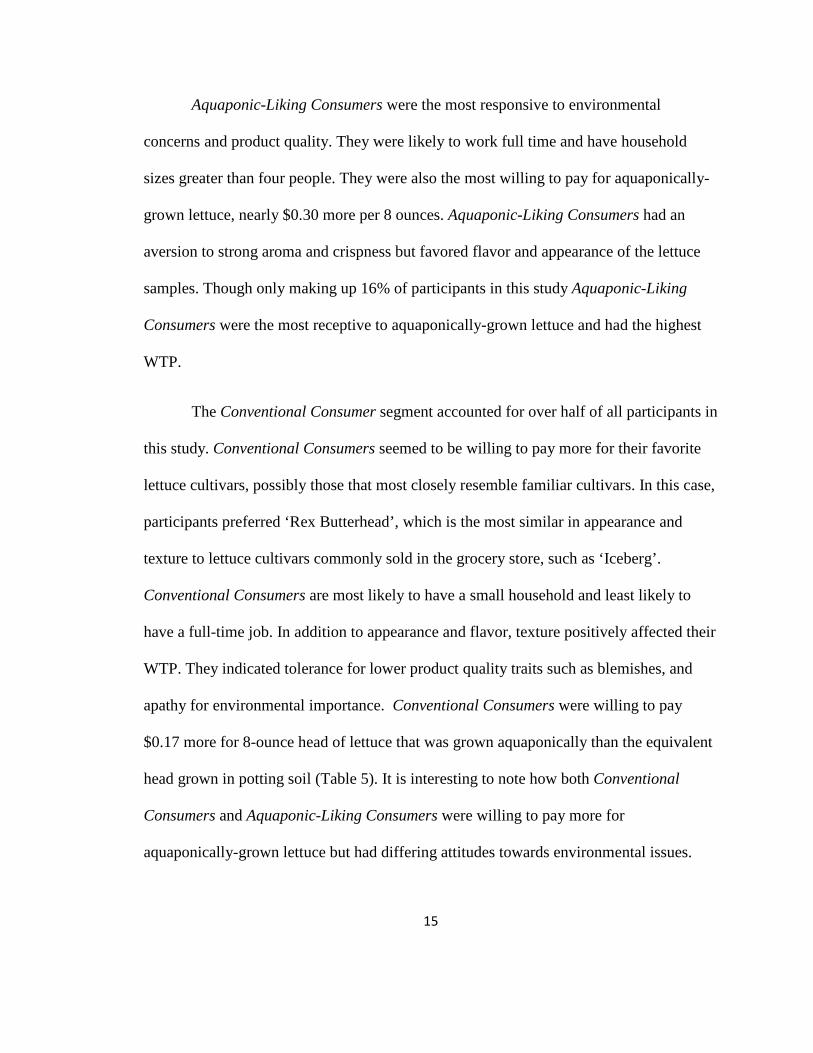
Aquaponic-Liking Consumers were the most responsive to environmental
concerns and product quality. They were likely to work full time and have household
sizes greater than four people. They were also the most willing to pay for aquaponically-
grown lettuce, nearly $0.30 more per 8 ounces. Aquaponic-Liking Consumers had an
aversion to strong aroma and crispness but favored flavor and appearance of the lettuce
samples. Though only making up 16% of participants in this study Aquaponic-Liking
Consumers were the most receptive to aquaponically-grown lettuce and had the highest
WTP.
The Conventional Consumer segment accounted for over half of all participants in
this study. Conventional Consumers seemed to be willing to pay more for their favorite
lettuce cultivars, possibly those that most closely resemble familiar cultivars. In this case,
participants preferred ‘Rex Butterhead’, which is the most similar in appearance and
texture to lettuce cultivars commonly sold in the grocery store, such as ‘Iceberg’.
Conventional Consumers are most likely to have a small household and least likely to
have a full-time job. In addition to appearance and flavor, texture positively affected their
WTP. They indicated tolerance for lower product quality traits such as blemishes, and
apathy for environmental importance. Conventional Consumers were willing to pay
$0.17 more for 8-ounce head of lettuce that was grown aquaponically than the equivalent
head grown in potting soil (Table 5). It is interesting to note how both Conventional
Consumers and Aquaponic-Liking Consumers were willing to pay more for
aquaponically-grown lettuce but had differing attitudes towards environmental issues.

16
This could be because the Conventional Consumers would prefer to buy lettuce most
closely resembling what they are familiar with regardless of how it was grown.
The Indifferent Consumer segment is made up of consumers who buy produce
less than once a week and have no specific preferences for their product beyond
appearance and flavor. These shoppers are easy to please but have the lowest average bid
among the three consumer segments. Indifferent consumers make purchases based on
looks and taste, not on attributes they cannot see, such as growing conditions.
In general, consumers have shown limited knowledge of aquaponics across many
studies. A survey conducted in Minnesota in 2016 by Short et al. found even fewer
consumers, one third of respondents, had heard of aquaponics (Short et al. 2017). Results
of a European consumer survey conducted in 2016 by Milicic et al. (2017) indicated that
more than half of all respondents did not know what aquaponics was and, of those who
did only 17% of them said they would be willing to pay more. In a 2015 German survey
only 27% of respondents approved of aquaponics (Specht et al. 2016). Educating
consumers about aquaponic benefits could increase their interest and enlarge the market
size. Determining which specific consumers would be most receptive to learning about
aquaponics would help in adopting target marketing strategies.
Previous surveys (Short et al. 2017; Milicic et al. 2017) have found price to be a
concern for consumers when considering aquaponic produce. A consumer survey on
hydroponic tomatoes ranked price as the third most important factor following place of
purchase and perceived quality (Padilla et al. 2007). This study estimated the price

17
premiums participants from different segments were willing to pay for aquaponically-
grown lettuces, which helps suppliers determine how much they should charge for their
products when they are targeting different consumer segments.
Participants in this study were not made aware of if the aquaponic lettuce samples
were grown in a greenhouse or a warehouse. They made their bids merely based on their
tasting and examination. The descriptive statistics in Short et al. (2018) reported
significantly higher WTP for warehouse-grown aquaponic lettuce compared to
greenhouse-grown aquaponics lettuce. The current study also found the preference for
aquaponic lettuce grown in a warehouse. Future studies should be conducted to
investigate the potential WTP change caused by the differences between the natural light
of the greenhouse and the fully artificial light of the warehouse and how to improve
product quality.
Short et al. (2018) found that being a member of an environmental group had a
significant negative impact on consumer WTP for aquaponic lettuce. This study validated
the result by finding increased environmental concerns in Conventional Consumers’
decreased their WTP. However, the environmental concern factor did not significantly
affect Aquaponic-liking Consumers’ WTP. This might be because of Conventional
Consumes’ lack of knowledge on aquaponic environmental benefits or because of their
association of aquaponics with industrialization as Specht et al. (2016) suggested.
18
Table 1-1: Summary statistics of participant demographics (age, gender, income, education, employment status, marital status, household size) in the aquaponic lettuce experiment (N=90) Categories Frequency Percent of sample Age
Ages 18-40 years
15
17%
Ages 41-60 years 30 33% Ages 61+ years 45 50%
Gender Male
27
31%
Female 61 69% Income
Income $50,000 and under
39
43%
Income $50,001-$100,000 36 40% Income $100,001 and over 15 17%
Education
High school or college degree
73
81% Graduate degree 17 19%
Employment status Retired/student/unemployed
49
54%
Full time job Part time job
26 15
28% 16%
Marital status Not single
60
67%
Single 30 33%
Shopping frequency for produce
Less than once a week
15
17%
Once a week or more 75 83% Household size

19
Less than 5
81
90%
5 or more 9 10%
20
Table 1-2: Variance, and cumulative variance for sorted factors of the attitudinal survey
and the matrix of inter-factor correlations.
Variance Cumulative Variance
Factor 1 0.50 0.50
Factor 2 0.34 0.84
Factor 3 0.13 0.97
Inter-Factor Correlations
Factor 1 Factor 2 Factor 3
Factor 1 1.00 0.17 -0.08
Factor 2 0.17 1.00 0.14
Factor 3 -0.08 0.14 1.00
21
Table 1-3: Summary of demographic traits and attribute preferences by consumer
segment
Consumer Segment
Demographic Traits Attribute Preferences
Class 1 Indifferent Consumers (28%)
• Infrequent shopper • Appearance • Flavor
Class 2 Conventional Consumers (56%)
• Small household • Least environmentally
concerned • Least concerned about
product quality • Not working full time
• Appearance and flavor • Texture important • Dislike of strong aroma • Preference for ‘Rex Butterhead’ • Increased WTP for warehouse
aquaponically-grown lettuce
Class 3 Aquaponic-Liking Consumers (16%)
• Most environmentally concerned
• Most concerned about product quality
• Works full time • Large household
• Appearance and flavor • Dislike of strong aroma and
crispness • Dislike of ‘Salanova Sweet’ • Largest increase in WTP for
warehouse aquaponically-grown lettuce

22
Table 1-4: Latent class analysis for the demographic estimates of participants in this study
Categories
Coefficient
Standard
Error Intercept Indifferent Consumers Intercept Conventional Consumers Intercept Aquaponic-Liking Consumers
1.05 3.24** -
(1.60) (1.48)
-
Age Ages 18-40 years Ages 41-60 years Indifferent Consumers
- -1.41
- (1.28)
Ages 41-60 years Conventional Consumers Ages 41-60 years Aquaponic-Liking Consumers
-0.33 -
(1.27) -
Ages 61+ years Indifferent Consumers Ages 61+ years Conventional Consumers Ages 61+ years Aquaponic-Liking Consumers
-0.77 -0.74 -
(1.43) (1.37) -
Gender
Male - -
Female Indifferent Consumers Female Conventional Consumers Female Aquaponic-Liking Consumers
1.30 0.73 -
(0.97) (0.90) -
Income $50,000 and under - - $50,001-$100,000 Indifferent Consumers -0.02 (1.23) $50,001-$100,000 Conventional Consumers $50,001-$100,000 Aquaponic-Liking Consumers
-0.46 -
(1.07) -
$100,001 and over Indifferent Consumers $100,001 and over Conventional Consumers $100,001 and over Aquaponic-Liking Consumers
1.99 1.85 -
(1.53) (1.44) -
23
Education High school or college degree - - Graduate degree Indifferent Consumers -0.22 (0.90) Graduate degree Conventional Consumers Graduate degree Aquaponic-Liking Consumers
-0.40 -
(0.85) -
Employment Retired/student/unemployed - - Full time job Indifferent Consumers Full time job Conventional Consumers Full time job Aquaponic-Liking Consumers Part time job Indifferent Consumers Part time job Conventional Consumers Part time job Aquaponic-Liking Consumers
-1.28 -2.51** - -0.84 0.13 -
(1.12) (1.08) - (1.28) (1.07) -
Relationship Status Single - - Not single Indifferent Consumers Not single Conventional Consumers Not single Aquaponic-Liking Consumers
0.00 -0.95 -
(0.09) (0.70) -
Shopping Frequency Once a week or more Less than once a week Indifferent Consumers
- 2.35 *
- (1.40)
Less than once a week Conventional Consumers Less than once a week Aquaponic-Liking Consumers
1.07 -
(1.40) -
Household Size Household under 5 people - - Household 5 or more people Indifferent Consumers Household 5 or more people Conventional Consumers Household 5 or more people Aquaponic-Liking Consumers
-2.08 -2.37** -
(1.38) (1.14) -
Factors Environmentally concerned factor Indifferent Consumers
-0.98
(0.71)

24
Environmentally concerned factor Conventional Consumers Environmentally concerned factor Aquaponic-Liking Consumers Health focused factor Indifferent Consumers Health focused factor Conventional Consumers Health focused factor Aquaponic-Liking Consumers Product focused factor Indifferent Consumers Product focused factor Conventional Consumers Product focused factor Aquaponic-Liking Consumers
-1.39** - -0.10 1.08 - 0.40 -1.20* -
(0.69) - (0.77) (0.77) - (0.77) (0.74) -
Standard errors in parentheses ∗ p < 0.10, ∗∗ p < 0.05, ∗∗∗ p < 0.01

25
Table 1-5: Latent class analysis estimates in US dollars
Category Coefficient Standard Error
Intercept Indifferent Consumers Intercept Conventional Consumers Intercept Aquaponic-Liking Consumers
NA 1.53*** 3.26***
NA (0.37) (0.58)
Lettuce Attributes Appearance rating Indifferent Consumers 0.07** (0.04) Appearance rating Conventional Consumers Appearance rating Aquaponic-Liking Consumers
0.09*** 0.34***
(0.03) (0.05)
Flavor rating Indifferent Consumers Flavor rating Conventional Consumers Flavor rating Aquaponic-Liking Consumers
0.24*** 0.30*** 0.42***
(0.04) (0.03) (0.06)
Crispness rating Indifferent Consumers Crispness rating Conventional Consumers Crispness rating Aquaponic-Liking Consumers
0.07 0.03 0.03*
(0.05) (0.03) (0.03)
Texture rating Indifferent Consumers 0.08 (0.05) Texture rating Conventional Consumers Texture rating Aquaponic-Liking Consumers
0.16*** 0.08
(0.03) (0.05)
Aroma rating Indifferent Consumers Aroma rating Conventional Consumers Aroma rating Aquaponic-Liking Consumers
-0.03 -0.13*** -0.23***
(0.04) (0.04) (0.06)
Bitterness rating Indifferent Consumers -0.06* (0.03) Bitterness rating Conventional Consumers Bitterness rating Aquaponic-Liking Consumers
-0.04* -0.09*
(0.02) (0.05)
Lettuce Cultivars Rex Indifferent Consumers - - Rex Conventional Consumers - - Rex Aquaponic-Liking Consumers - - Salanova Sweet Indifferent Consumers Salanova Sweet Conventional Consumers Salanova Sweet Aquaponic-Liking Consumers
-0.02 -0.30*** -0.74***
(0.12) (0.08) (0.16)
26
Salanova Incised Indifferent Consumers Salanova Incised Conventional Consumers Salanova Incised Aquaponic-Liking Consumers
0.00 -0.32*** -0.24
(0.15) (0.09) (0.17)
Growing Conditions Potting soil grown Aquaponic-Liking Consumers - - Potting soil grown Conventional Consumers - - Potting soil grown Indifferent Consumers - - Aquaponic greenhouse grown Indifferent Consumers Aquaponic greenhouse grown Conventional Consumers Aquaponic greenhouse grown Aquaponic-Liking Consumers
-0.00 -0.02 -0.19
(0.12) (0.09) (0.16)
Aquaponic warehouse grown Indifferent Consumers Aquaponic warehouse grown Conventional Consumers Aquaponic warehouse grown Aquaponic-Liking Consumers
-0.03 0.17** 0.30**
(0.12) (0.08) (0.16)
Standard errors in parentheses ∗ p < 0.10, ∗∗ p < 0.05, ∗∗∗ p < 0.01

27
CHAPTER 2:
An Analysis of Strawberry (Fragaria X ananassa) Productivity in Northern
Latitudinal Aquaponic Growing Conditions
Marie Abbey1, Neil O. Anderson2, Chengyan Yue3, Gianna Short4, Michele Schermann5,
Nicholas B.D. Phelps6, Paul Venturelli7, Zata Vickers8
1Department of Horticultural Science, University of Minnesota, 286 Alderman Hall,
1970 Folwell Avenue, St. Paul, MN 55108
2Department of Horticultural Science, University of Minnesota, 286 Alderman Hall,
1970 Folwell Avenue, St. Paul, MN 55108
3Department of Applied Economics and Department of Horticultural Science, University
of Minnesota, 458 Alderman Hall, 1970 Folwell Avenue, St. Paul, MN 55108
4Department of Applied Economics, University of Minnesota, 213 Ruttan Hall, 1994
Buford Avenue, St. Paul, MN 55108
5Department of Horticultural Science, University of Minnesota, 286 Alderman Hall, 1970
Folwell Avenue, St. Paul, MN 55108
6Department of Fisheries, Wildlife and Conservation Biology, University of Minnesota,
135 Skok Hall, 2003 Upper Buford Circle, Suite 135, St. Paul, MN 55108
7Department of Fisheries, Wildlife and Conservation Biology, University of Minnesota,
135 Skok Hall, 2003 Upper Buford Circle, Suite 135, St. Paul, MN 55108
8 Dept. of Food Science and Nutrition, Univ. of Minnesota, 1334 Eckles Ave, St. Paul,
MN, U.S.A

28
Introduction
Aquaponics is the integration of hydroponics (the soilless growing of plants) and
aquaculture (the raising of fish) into a closed-loop, recirculating system (Rakocy, et al.,
2006). The fish waste provides a nutrient source for the plants and the plants provide the
elimination of toxic ammonia build up for the water in which the fish live (Rakocy et al.,
2006). The only nutritional input (food or nutrients) into the system is fish food. Fish then
excrete waste which is converted into plant available nutrients (nitrates) by nitrifying
bacteria in a biofilter and taken up by the plants (Diver and Rinehart, 2006).
Aquaponics developed as a way to control waste water from recirculating
aquaculture systems (RAS) (Costa-Pierce et al., 1997). Though RAS has many benefits,
water conservation is not one of them and there was a demand to develop a cost effective
filtration system. Plants can be used as filters for RAS wastewater and also as a
secondary crop which led to the development of closed loop aquaponic systems (Rakocy
et al., 2006; Lewis, 1978). There was also a motivation from hydroponic growers to
develop more cost effective and environmentally friendly nutrient solution sources
(Rakocy et al., 2007).
Aquaponic production is the fastest growing sector of agriculture (Kloas et al.,
2015), in part, due to pressure from population growth, drought, and increased water
demand (Hundley and Navarro, 2013). Total aquaponic industry growth worldwide is
expected to exceed 10% by 2020 (Aquaponic Farming: Global Market Intelligence,

29
2016). Urban agriculture, including aquaponics, is continuing to grow with over 100
million growers estimated (Eigenbrod and Gruda, 2015).
Most aquaponic producers are considered small farms both in size and revenue
(Love et al., 2014). Aquaponic systems can vary dramatically in scale, system design,
plant crops, fish species and management procedures. The type of system ultimately
chosen is dependent on the location, production goals, market demand, and many other
factors although the vast majority are in controlled environments such as greenhouses
(Love et al., 2015); warehouses have also been used. The most common commercial
aquaponic system is called deep water culture (DWC), where the plants and fish are
physically separated and the plants grow on floating rafts with their roots suspended in
the nutrient-rich water (Taiz, 2010).
Commercial aquaponic growers also use ebb and flow systems in which the plant
roots are intermittently submerged in water, though it is less common than DWC. The
other types of systems, e.g. aeroponic and nutrient film techniques, are rarely used in
aquaponic production because of issues with solids clogging the system (Søberg, 2016).
Strawberries (F. ✕ananassa, Rosaceae) are an herbaceous, perennial crop that
grow relatively close to the ground (maximum 30cm tall) and spread both by seed and
vegetatively via stolons (Vincent et al., 1990). Flowers grow in clusters on individual
stocks to an even height or slightly above the foliage and bloom successively (Cold
Climate Strawberry Farming, 2014). The first bud to flower is called the ‘king flower’
and is significantly larger than subsequent flowers on the cluster; resultant fruit from this
30
are termed ‘king berries’. Subtending lateral fruits are smaller in size. Flowers have both
stamens and pistils and are able to self-pollinate although complete pollination and fruit
fill requires additional stimulation besides wind (Vincent et al., 1990). The fruit is an
aggregate accessory fruit and is formed from the receptacle, which holds the ovary; the
sum of these receptacles forms the strawberry fruit.
Strawberries are classified by their photoperiodic response into three categories.
June-bearing cultivars need short day lengths (<12 hr) in order to flower, ever-bearing
cultivars need long day lengths (>12 hr) in order to flower, and day-neutral cultivars are
not affected by day length. June-bearing strawberries produce only one large crop of fruit
in the spring and are currently the most popular choice for northern latitude farmers
because of their ability to overwinter (Cold Climate Strawberry Farming, 2014).
However, day-neutral cultivar popularity has been growing in northern latitudes with the
increase in season extension (high tunnels and low tunnels) and climate controlled
production (Petran et al., 2017). The day-neutral cultivars ‘Portola’ and ‘Albion’ are
recommended for outdoor production due to their high yields, large fruit size, and sweet
fruit (Petran et al., 2017) while ‘Evie 2’ has performed well in northern hydroponic trials
(Wortman et al., 2016).
The United States is the largest producer of strawberries in the world with the
largest production being warm weather states, such as California and Florida (Morgan,
2015). As consumer demand continues to grow so does the opportunity for controlled
climate strawberry production (ERS, 2016). It is estimated that increased offseason

31
production could expand the US strawberry industry by $520 M annually (Arnade and
Kuchler, 2015).
The majority of strawberries are field-grown, although recently high tunnels are
being used for production, particularly in coastal areas of California and to extend the
season in cooler climates (Poppe et al., 2016; Pritts and Mcdermott, 2017). Hydroponic
strawberry production has been found to have comparable yields to field production
(Wortman et al., 2016) and hydroponic strawberry runner production (production of bare-
root strawberry plants) has been proven as effective as field production (Takeda and
Hokanson, 2003). Using aquaponic systems to grow strawberries has not been
investigated to the best of our knowledge. There has been speculation that using
aquaponic growing methods could be used to produce strawberry runners (Mattner et al.,
2017) but no proof of concept has been attempted.
Adequate nutrient levels are critical for strawberry fruit maturation and achieving
market fruit sizes. The recommended liquid fertilizer for strawberry irrigation in
hydroponic nutrient solutions has a reduced nitrate concentration, less than half that of
recommended tomato nutrient solution. Increased nitrate levels leads to tip-burn in
strawberries and decreased production (Cold Climate Strawberry Farming, 2014). A
short-term experiment examining nutrient levels in aquaponic strawberry production
found that nutrient levels were adequate for growth but varied greatly depending on fish
species and density (Villarroel et al., 2011). When production between a fully synthetic
nutrient source, such as used in hydroponic systems and a bio-based liquid nutrient

32
source (similar to aquaponic systems) were compared, strawberries grown with the
synthetic nutrient source had 15% higher yield (Wortman et al., 2016).
Year-round aquaponic production studies have focused on the most popular
aquaponic crops, leafy greens and herbs (Love et al., 2014). There has been limited
research on year-round production of perennial crops, such as strawberries, in aquaponic
production particularly in northern latitudes. The objective of this study is to produce
day-neutral strawberries in year-round aquaponic production systems in northern
latitudes to create a baseline for potential yield. The hypotheses tested in this experiment
include: Ho: There is no difference in yield between strawberries produced aquaponically
and those grown in soilless medium. Furthermore, there is no difference in yield between
strawberries grown with different aquaponic treatments.
Materials and Methods
Genotypes Tested.
This experiment was conducted for a 13 month period (January 2016-February
2017). Three cultivars of day neutral strawberry plants were used for this experiment:
‘Portola’, ‘Albion’, and ‘Evie 2’, based on previous recommendations (Wortman et al.,
2016; Petran et al., 2017). Cultivars were chosen based on previous winter cultivation
studies (Paparozzi et al., 2010; Petran et al., 2017) and availability. Plants were acquired
as pre-chilled, bare root transplants from Nourse Farms (South Deerfield, MA) and were
received in week 55 (2015). The plants were held in a cooler at 3-5°C (darkness) until
planting in each system tested. Bare-root plants were planted into each system in week 4

33
(2016). The location for aquaponics research was in the Minneapolis – Saint Paul
Metropolitan area, State of Minnesota, U.S.A., specifically located at the St. Paul
Campus of the University of Minnesota (44°59’17.8” N, -93°10’51.6” W).
Fish species grown in the various aquaponic production facilities were: Perca
flavescens (yellow perch), Oreochromis spp. (tilapia), Cyprinus carpio (koi) and
Carassius auratus (goldfish). The goldfish were purchased at PetSmart (Roseville, MN)
in 2014. The tilapia were obtained as fingerlings from Arrowhead Fisheries, LLC (Canon
City, CO) in January, 2015. Yellow perch were obtained as fingerlings from Will Allen
Farms, Growing Power (Milwaukee, WI) in March 2015. Koi were obtained from
Tangletown Gardens (Plato, MN) in February 2016. All fish were acclimated to each
system’s environment, and then placed into each system as soon as biofilters were
functioning.
Experimental Setup.
Environmental systems (treatments) tested included: (a) soilless medium (control), (b)
floating raft deepwater culture (DWC), (c) A-frame ebb and flow, (d) tray ebb and flow,
and (e) warehouse. Treatments (a) through (d) were conducted in greenhouses while (e)
was in a warehouse. Treatments (c) and (e) used koi, treatment (b) used yellow perch, and
treatment (d) used both goldfish and tilapia. All treatments had an equal number of each
strawberry cultivars randomized throughout each system. All treatments except (c) used a
randomized block design. Treatment (c) was randomized by PVC pipe line of plants (see
Figure 1). The number of experimental units varied by treatment, the exact number

34
depending on the space available in each system. In the soilless medium treatment, 32
plants/cultivar were grown; the A-frame ebb and flow had 8 plants/tube for a total of 48
plants/A-frame; the tray ebb and flow had 9 plants/tub; the floating raft DWC systems
had 4 plants/tank whereas the warehouse had 30 plants/cultivar equally divided between
the two growing tubs. In all systems strawberry plants were grown alongside basil
(Ocimum basilicum) cultivars ‘Eleonora’, ‘Nufar’, and ‘Genovese’, and lettuce (Lactuca
sativa) cultivars ‘Rex Butterhead’, ‘Salanova Sweet’ and ‘Salanova Incised’. Lettuce and
basil production will be analyzed in a separate paper.
Environmental Conditions.
Soilless Medium (Control). The greenhouse environmental conditions for soilless
medium strawberry production were 24.4±3.0/18.3±1.5°C day/night daily integral and a
16 hr long day photoperiod (0600–2200 HR) lighting (400 w high pressure sodium high
intensity discharge lamps, HPS-HID) at a minimum of 150 μmol m-2 s-1. The greenhouse,
located in the St. Paul campus Plant Growth Facilities (University of Minnesota, St. Paul,
MN), was an A-frame even-span construction, sharing one inner wall with each adjacent
house. The roof, shared inner and interior walls adjoining the service walkway were
glazed with double-strength float glass whereas the exterior walls had chambered acrylic
(Exolite®; Cyro Industries, Mt. Arlington, NJ) glazing. Heating was delivered from the
University of Minnesota heating plant via hot water into the perimeter pipes of the
greenhouse with galvanized fins for enhanced heat exchange. All environmental settings
were controlled via an Argus Control Systems Ltd. computer (Surrey, British Columbia,
Canada).

35
Strawberries were transplanted into square 754 cm3 plastic pots (Landmark
Plastic, Akron, Ohio) filled with Sunshine LC8 soilless potting medium (Sun Gro
Horticulture, Agawam, MA). Plants were fertilized twice daily, between the hours of
0700-0800 and 1600-1700, using a constant liquid feed (CLF) of 125 ppm N from water-
soluble 20N–4.4P–16.6K (Scotts, Marysville, OH). Fungicide drenches of Banrot (Scotts,
Marysville, OH), Subdue (Syngenta, Basel, Switzerland), Medallion (Syngenta, Basel,
Switzerland), and Clearys 3336 (Nufarm, Melbourne, Australia) were applied in monthly
rotations.
Insect control consisted of bio control methods of using yellow sticky cards
(12.7 x 7.6 cm; Evergreen Growers Supply, Clackamas, OR) to catch flying insects.
Additionally, a variety of mites, Amblyseius andersoni, Amblyseius
cucumeris, Amblyseius swirskii, Neoseiulus fallacis, Galendromus occidentalis,
Neoseiulus californicus, Phytoseiulus persimilis (Beneficial Insectary, Redding, CA and
Rincon Vitova, Ventura, CA), were released rotationally for bio control in this and all
other greenhouses and warehouse over the course of the experiment in order to control
for spider-mites (Tetranychus urticae), white flies (Trialeuroides vaporariorum), and
thrips (Thysanoptera spp.). Cease fungicide (Bioworks Inc., Victor, NY) was applied
weekly during November 2016 in order to control for powdery mildew (Podosphaera
xanthii).
Floating Rafts. This aquaponic greenhouse had a 23.6+0.8°C daily integral; the
temperature set-point was 23.5°C. The same photoperiod (long day) and biocontrol
methods, as instituted in the soilless medium treatment were also used herein. Electric
36
generators served as the electrical power backup system for this and all other aquaponic
setups.
This system consisted of eight aluminum tanks (193x77.5x75 cm, l x w x h with
6.5 cm thick walls) for fish/plant production. Each tank had a floating raft system (2/tank;
60x60x5.5 cm, Owens Corning FOAMULAR 150, R-10 insulation sheathing; Owens
Corning Co., Toledo, OH); the water volume in each tank was ~550 L or 0.55 m3. Two
plastic, hemispherical tanks (68x47x26 cm) were connected to each fish tank and served
as the biofilters. Each biofilter was filled with 8-10 cm dia. gravel (D-Rock Center, New
Brighton, MN). In greenhouse 369-C2, ammonium chloride (1 g/biofilter; Hawkins
Chemical Co., Roseville, MN) was used to start the biological filter or biofilter in 8-10
cm dia. lava rock (D-Rock Center, New Brighton, MN) to produce ~1 mg/L ammonia
with an initial start of Carassius auratus (goldfish) whereas ammonium carbonate was
used in 369-C4. Two plastic, hemi cylindrical tanks (68x47x26 cm) were mounted above
one end of each fish tank and served as the biofilters. Each biofilter was filled with 2 cm
dia. granite gravel (Hedberg Aggregates, Stillwater, MN). A low density (approx. 25-30
fish / tank) of Carassius auratus was used to start the biological filter in the gravel; these
were later removed before the experiment commenced and replaced with Perca
flavescens (yellow perch). Water was lifted to the biofilter tanks by a Danner Supreme
700 GPH mag drive pump. The outflow was had valves and was split between the two
biofilter tanks and a third outlet which discharged directly to the fish tank for added
aeration and circulation. Each biofilter received approximately 4 l/min. An automatic bell
siphon in each of the biofilter tanks allowed the water level to rise in the gravel from a

37
low point of approximately 2 cm depth to a high of around 15 cm. At the high point the
siphon would start and the water would draw down (returning to the fish tank), creating
an ebb and flow in the gravel. Potential plant spacing on each raft could be a max. of 16
plants in a 4x4 grid, each plant could be grown in a 12cm dia. Net Cup (Hydrofarm
Central, Grand Prairie, TX) filled with Trock rockwool (medium grade, 4CF, 30/PL;
Therm-O-Rock East, Inc., New Eagle, PA).
Water quality was monitored daily (5/wk excluding weekends). Temperature
measurements averaged 22.3+0.9°C and closely approximated the air temperature set
point. The fish species grown in this house and used for the duration of the experiment
was Perca flavescens (yellow perch) at varying densities (from 20-30 fish), depending on
age (Sorensen et al., 2015). The same biocontrol methods for insect and arachnid pest
control were instituted in this and all other greenhouses, as delineated earlier.
A-frame ebb and flow. In this greenhouse, 21.7+0.4°C was the daily integral and
the temperature set-point was 21.5°C. Temperature measurements averaged 23.5+0.9°C
and approximated the air temperature set point. The same photoperiod (long days) and
bio control methods, as instituted in the soilless medium treatment, were also used herein.
Two tanks in this greenhouse each feed separate A-frame ebb and flow systems
(Figure 1). Fish species grown in this house were Cyprinus carpio (koi) at varying
densities, depending on fish age. Airlift pumps move the water from the fish tank to the
biofilter; a Danner Supreme 700 GPH mag drive pump lifts the water from the biofilter to
the A-frame lines, draining back to the fish tank. Four plastic, hemi cylindrical tanks

38
(68x47x26 cm) were mounted below each A-frame were filled with 3-4 cm dia. lava rock
(D-Rock Center, New Brighton, MN) and served as the biofilters.
Tray ebb and flow. In this greenhouse, 21.7+0.4°C was the daily integral and the
temperature set-point was 21.5°C. The same photoperiod (long days) and bio control
methods, as instituted in the soilless medium treatment, were used in this greenhouse.
One fish tank (aluminum; identical specifications as used in the floating raft and
A-frame ebb and flow systems) is used for each separate galvanized steel framed,
adjustable shelving rack system (Ebb and Flow systems). One fish tank contained
Oreochromis spp. (tilapia), which fed one shelving rack system, while Carassius auratus
(goldfish) were grown in the other tank. All fish were at varying densities, depending on
fish age.
Each system has two shelves/rack (Figure 2). Two tubs/shelf (123x94x18 cm;
Polytank Co., Litchfield, MN), each of which could hold six 50.8x25.4 cm (10”x20”)
trays into which separate plug trays (50s or 72s) were inserted to hold the plants. The top
shelf of each rack system is exposed to natural and supplemental lighting (high pressure
sodium HID lights) whereas the second shelf has supplemental light emitting diode
(LED) lighting supplied by either Sunshine Systems GrowPan (450-470, 630 nm; 300
Watt; Sunshine Systems, LLC, Wheeling, IL) or Green Power LED (450-470, 660 nm;
300 Watt; 152x12 cm; 110v strips; Royal Philips N.V., Andover, MA). One plastic,
rectangular tub (123x186x18 cm; Polytank Co., Litchfield, MN) serves as a biofilter for
39
each tank and is filled with 3-4 cm dia. lava rock (D-Rock Center, New Brighton, MN).
Each tub is located on the concrete floor.
Warehouse. The warehouse system is a retrofitted walk-in cooler (7.19m x 4.87m
x 2.74m), in the basement of the plant growth facilities head house, with galvanized
interior walls where a F5 (Fantastically Fun Fresh Food Factory) commercial type
systems from Nelson and Pade Company (http://aquaponics.com/; Montello, WI) is
installed. The F5 system consists of one 110-gallon fish tank with separate bio filters and
2—3’ x 5’ plastic tubs that will hold floating rafts. There are 15 - 2" net pots / raft and 2
rafts/tub for a total of 90 plants possible to be grown in this system. The LED lighting
system from Agrivolution LLC (http://www.agrivolution.co/; South Windsor, CT) is a
triple-band LED light (bar) above the plants, which can telescope vertically, depending
on the plant height. The LEDs have single-chip diodes emitting blue, green, and red light
with full photosynthetically active radiation (PAR=400 nm to 700 nm). Supplemental
cooling is supplied to maintain average growing temperatures of 20-21°C day/night.
Fruit was harvested as it became ripe (fully red); dates of harvest were recorded.
Berries were grouped by plant, counted, weighed (fresh weights, g), recorded, and then
placed in a high temperature oven (76.67°C) (Hotpack, Philadelphia, PA) for seven days.
Berries were then removed and weighed once more after drying was complete (dry
weights, g). Average fresh berry weights were calculated as (average total fresh berry
weight divided by the average berry number).
Statistical Analyses.
40
A Kruskal-Wallis test was used to analyze number of fruit per plant per harvest,
weight in grams of fresh fruit per plant per harvest, and dry weight in grams of fruit per
plant per harvest. The Kruskal Wallis test is an appropriate statistical analysis when the
purpose of research is to assess if a difference exist on one ordinal/continuous dependent
variable by an independent variable with two or more discrete groups. The dependent
variables in this analysis are number of fruit, fresh fruit weight, and dry fruit weight, and
the discrete groups are growing conditions and cultivars.
The Kruskal-Wallis test is a non-parametric variation of a one-way repeated
measures, unbalanced analysis of variance (ANOVA) and is used to determine if three or
more samples come from the same distribution (Ostertagová et al., 2014). A Kruskal-
Wallis test was conducted due to the large number of outliers in the data, which indicated
a non-normal error distribution. Normality and homogeneity of variance are not assumed
when conducting the Kruskal Wallis test. The Kruskal Wallis test can be done when the
data is ordinal-level or when it violates the assumptions of the ANOVA. Scores simply
must be independent of each other, and must be in one of the groups of the independent
variable. All tests were conducted using the software SAS v.9.4 (Cary, North Carolina).
Results
The number of fruits per plant per harvest, fresh fruit weight by plant, and dry
fruit weight by plant were all significant at P<0.01 or greater (Table 1) when compared
by greenhouse location (both ebb and flow systems resided in the same greenhouse).
When berries from all treatments, both aquaponic and soilless medium, were compared
41
by treatment there was a significant difference in fresh fruit weight and dry fruit weight
but not in number of fruit per plant (Table 1). Fish treatment only, excluding soilless
medium treatment data, had no significant difference across categories indicating the
significant difference was between aquaponically grown and soilless medium grown, not
the different aquaponic treatments. When cultivars were compared there was also a
significant (P<0.01 or greater) difference in the number of fruit per plant per harvest,
fresh fruit weight, and dry fruit weight (Table 1).
Table 2 shows the average and standard deviation of number of fruit per plant per
harvest, fresh fruit weight, and dry fruit weight subdivided by location and fish treatment,
including the soilless medium. There was a large amount of variation within all
treatments as evidenced by the large standard deviations (Table 2). The floating raft
DWC, which had perch as the fish treatment, had the highest average fresh fruit weight at
25.56 grams. The soilless medium treatment had the lowest fresh fruit weight with 18.11
grams. Though dry fruit average weight soilless medium treatment had the highest
average weight with 2.05 grams, while the tray ebb and flow goldfish treatment and the
ebb and flow A-frame treatment had the lowest average dry weight with 1.31 grams. This
indicates there was significantly more water content in aquaponically grown strawberries
than those which had the soilless medium treatment.
There was a significant difference among strawberry cultivars for all measured
factors. ‘Evie 2’ produced a significantly higher number of berries per plant per harvest
(P<0.01; Table 3), averaging 4.37 berries, than both ‘Albion’ and ‘Portola’ with averages
of 2.80 berries and 3.12 berries, respectively (Table 3). ‘Evie 2’ berries also had
42
significantly (P<0.01) higher fresh and dry weight than the other cultivars with an
average fresh berry weight of 6.30g. ‘Albion’ had the lowest average fresh berry weight,
5.43g, and ‘Portola’ had an average fresh berry weight of 5.82g. Since ‘Evie 2’ produced
the most berries and had the largest berries on average, it follows that it also had the
highest total fresh and dry fruit weight per harvest (Table 3). It is interesting to note,
however, that though ‘Albion’ had the lowest average fruit count and lowest average
fresh fruit weight, ‘Portola’ had the lowest dry fruit weight. This indicates that ‘Albion’
has a higher mass to water ratio.
Though plants were put into the system in January 2016, the first harvest did not
occur until April 2016 – the time required for leaf unfolding, flowering and fruit set.
Harvests varied by month and by cultivar (Table 4), as is typical of day neutral
strawberries (Rowley et al., 2011). The highest number of fruit for ‘Albion’ and ‘Evie 2’
was harvested in November 2016 (Table 4). However, the highest total fresh fruit weight
was harvested in June for ‘Evie 2’ and July for ‘Albion’, indicating that berries produced
in later months were smaller than those produced in the first large harvest. In general,
average individual berry size trended downwards over time for all cultivars (Table 4).
Discussion and Conclusion
The average berry weight of this study is half as much for ‘Albion’ and less than
half for ‘Evie 2’ than any other study examining strawberry production using alternative
production methods (Table 5). The hydroponic study of Paparozzi et al. (2010), reported

43
average berry sizes of 11.68g for ‘Albion’ and 16.31g for ‘Evie 2’, while the average
fresh weight per berry in this study was 5.43g and 5.82g, respectively (Table 2).
The soilless medium treatment had the lowest average fresh berry weight at 18.1g,
significantly less than the DWC floating raft treatment at 25.5g. However, it had the
highest average dry berry weight with 2.04g, which was significantly more than the tray
ebb and flow goldfish and the A-frame ebb and flow koi treatments at 1.30g. This
suggests that berries grown in soilless medium have a higher mass to water ratio, which
may impact taste and nutrition, though this study did not address those factors.
While ‘Albion’ had the lowest fresh berry weight and the lowest average number
of fruit ‘Portola’ had the lowest dry fruit weight, this suggests ‘Albion’ has a higher mass
to water ratio in the berries. This is consistent with previous research confirming ‘Albion’
has a higher Brix score (sugar content score) than other cultivars (Petran et al., 2017).
A study comparing differences between row covers in field strawberry production
found average fresh berry weight of plasticulture row covers, typical of field production,
to be 14.32g for ‘Albion’, 12.96g for ‘Evie 2’, and 14.78g for ‘Portola’ (Jordan, 2013).
The same experiment evaluated strawberry cultivar production in low tunnel production
systems and found average fresh fruit weight of ‘Albion’, ‘Evie 2’, ‘Portola’ to be
15.16g, 14.86g, and 18.61g, respectively (Jordan, 2013). A follow up study was
conducted in 2017 using the same plasticulture row covers with average fresh berry
weight of ‘Albion’ at 16.1g and ‘Portola’ at 18.1g (Jordan, 2017). A study measuring
high tunnel strawberry production found the average berry size of ‘Albion’ to be 13.7g
44
and ‘Evie 2’ to be 12.1g (Rowley et al., 2011). These results are consistent with other
studies of field and low tunnel production using the chosen cultivars (cf. Table 5, Petran
et al., 2017). All studies reported over double the average fresh berry weight found in this
study.
A marketable berry is considered to be over 10g, completely and evenly red, and
evenly filled without major deformities (Rowley et al., 2011). In terms of fresh weight we
did not reach an average berry weight above 10g in any cultivar for any month (Table 4).
Though we did not distinguish between marketable and unmarketable berries in this
study, it is important to keep marketability in mind when considering the issues of
strawberry production in aquaponic systems.
The reduced berry size in this study is not completely unexpected. Aquaponics
has several known intrinsic issues like iron deficiency (Graber and Junge, 2009) which
reduces photosynthesis and a lack of pollinators which directly affects fruit fill. All
strawberry cultivars in all aquaponic systems had severe iron deficiency symptoms, due
to insufficient levels of Fe in the aquaponic tanks. There are methods in development to
overcome these issues but they were excluded in order to understand the potential yield
of strawberry in aquaponic systems without supplemental inputs.
Iron deficiency has a significant negative impact on strawberry fruit production
(Roosta, 2014). Strawberry iron uptake fluctuates over the life cycle of the plant
increasing when vegetative growth occurs and decreasing during berry formation and
ripening (Chow et al., 1992). Iron is a micronutrient used in the production of chlorophyll

45
and in reproductive processes. It is the micronutrient needed in strawberries at highest
quantities (Kobayashi and Nishizawa, 2012). Lack of iron in plants causes interveinal
chlorosis or yellowing of the tissue in leaves. Symptoms continue to worsen until the leaf
becomes completely white, leading to stunting of the plant and eventual death.
Strawberries grown hydroponically are recommended to have 2.5g/L iron chelate
included in the nutrient solution for ideal growth (de Villiers, 2008) although how
effective plant uptake is depends on what kind of chelating agent is used and the pH of
the system (Lucena et al., 1990).
To correct for iron chlorosis in hydroponic or field settings either a solution of
chelated iron would be added directly to the roots or alkalinity would be lowered (pH
=6.5). Keeping the pH <6.5 makes iron more soluble and able to be taken up by the
plants. The other option, adding iron to the directly to the water of the aquaponic system,
may have negative consequences on the fish or nitrifying bacteria in the biofilter. Fish
tolerance of high iron levels is not known but probably varies by species (Kwong and
Niyogi, 2008). Iron absorption in fish has been shown to be very inefficient (Bury and
Grosell, 2003) which could indicate that addition of chelated iron to water in aquaponic
systems is possible. A study done by Ru, et al. (2017) added 2mg/L Fe-EDTA weekly
with positive effects to plant growth and no negative effects to the fish (Ru et al., 2017).
Modifying the fish feed to include more iron may also increase availability in the system.
Fish feeds range from 30 to 170mg iron Kg-1 (Watanabe et al., 1997).
Though strawberry roots can absorb iron more efficiently than any other part of
the plant, the difficulties in getting chelated iron to them has led to the development of

46
iron foliar sprays (Dordas, 2008). Iron foliar sprays can be effective in reversing chlorosis
on strawberry (Pestana et al., 2011). Iron can also be absorbed through stomatal openings
as it has been found that foliar applications to the underside of leaves are more effective
than those applied to the top side (Schlegel et al., 2006). Aquaponic growers operating in
greenhouses are suggested to apply iron foliar sprays in the morning in order to stimulate
photosynthesis and maximize uptake (Brüggemann et al., 1993). Growers with fully
artificial light are recommended to add a strong blue light to contribute to iron reduction
and stomatal opening (Brüggemann et al., 1993).
There is also the threat of pests and diseases, which did not spare this study.
Spider-mites (Tetranychus urticae) and powdery mildew (Podosphaera ✕anthii) were
issues for all cultivars, despite the bio control methods, especially in the greenhouse
housing the A-frame ebb and flow and the tray ebb and flow systems. No strawberry
cultivar showed any resistance to spider mites. Thus, there are multiple opportunities for
day neutral strawberry breeders for cultivar improvement before greenhouse or
warehouse aquaponic strawberry production can be viable.
Spider-mite infestation was an ongoing problem in greenhouse housing the A-
frame ebb and flow and the tray ebb and flow systems and affected all treatments therein.
Due to toxicity to the fish it was not possible to treat these with pesticides, as would be
standard practice in regular greenhouse cultivation. Bio controls in the form of various
species of mites, which are parasitic to spider mites, were regularly released. However,
this bio control method takes 2-3 weeks to reduce populations of spider-mites and has to

47
be continuously renewed (Pundt, 2014). Having a spider-mite infestation reduces day
neutral strawberry yield by an average 23% (Walsh et al., 2002).
Powdery mildew was recognized on strawberry plants in the greenhouse housing
the A-frame ebb and flow and the tray ebb and flow systems beginning in November
2016. It was treated using a biological fungicide spray once a week and was controlled
within a month. Extensive infection can cause yield loss of up to 60% in strawberry
(Asalf et al., 2012). Even when infection is not severe, powdery mildew can still cause
yield loss of 5% when observed infection is less than 20% (Carisse et al., 2013). During
the month of November 2016, total soilless media berry yield was 2324g while total
berry yield for the greenhouse housing the A-frame ebb and flow and tray ebb and flow
was 845g. This indicates there was substantial yield loss due to powdery mildew
infection.
Pollinators were not added to any of the tested production systems, which may
have had an impact on berry size. Berry fill in strawberries is determined by successful
pollination and fertilization of the ovule which stimulates fruit fill (Nitsch, 1950). We
relied on gravity and air movement to pollinate strawberry flowers which has been shown
to have a pollination success rate of up to 60% (Vincent et al., 1990). The addition of
pollinators to other greenhouse experiments has been shown to significantly increase
berry size and weight (Abrol et al., 2017). Lower pollination success most likely
contributed to smaller berry size throughout this experiment. Though we did not
distinguish between marketable and non-marketable berries, the lack of insect pollinators

48
has been shown to lead to uneven pollination and misshapen berries (Nye and Anderson,
1974).
If there had been sufficient plant accessible iron, adequate pollination, and had
there not been a spider mite infestation, it is possible average berry size could have been
over 10g. Iron foliar sprays to iron deficient plants have been shown to increase yield by
up to 56% (Zaiter et al., 1993). Spider mite infestation reduces strawberry yield an
average of 23% (Walsh et al., 2002). Finally, the lack of pollinators reduces fruit set and
total yield by up to 4 fold (Abrol et al., 2017). It is reasonable that average berry size
could have been comparable to field production methods if these essential strawberry
production needs had been met.
There was a significant difference in cultivars in this study, specifically ‘Evie 2’
producing more significantly heavier berries (fresh weight) than the other cultivars (Table
3). ‘Evie 2’ has consistently performed better in controlled environments (Petran et al.,
2017). It was among the highest yielding cultivars in hydroponic trials in the Midwest
(Wortman et al., 2016). ‘Evie 2’ was bred to improve upon day neutral cultivars in
northern climates with hot summers (“Evie 2 Plant Breeders Rights,” 2018). Its improved
tolerance to temperatures over 33oC and moderate resistance to powdery mildew make it
ideal for production in controlled environments. To further improve day neutral
strawberries for aquaponic production in both greenhouses and warehouses, plant
breeders should focus on increasing iron uptake or chlorosis resistance and resistance to
spider mites while maintaining or increasing high fresh fruit yield and quality.

49
Strawberry production using aquaponic systems has many different issues that
cannot be ignored if yield is to be equivalent to other systems. Though the number of
berries per plant across systems is equivalent without supplemental inputs to the system,
aquaponic strawberry fruit size is significantly lower than both field and hydroponic
cultivation methods. Adding iron and pollinators, as well as controlling for pests and
disease should increase aquaponic production. Choosing a cultivar such as ‘Evie 2’ that is
suited to indoor production will make a significant difference in yield, unlike choosing
between the different species of fish. Further research should focus on breeding of new
strawberry cultivars better suited to aquaponic growing conditions and standardization of
recommendations regarding inputs into aquaponic systems for supplemental iron
treatments.

50
Table 2-1: Significance levels of fruit count, fresh fruit weight (g) by plant, and dry fruit
weight (g) by plant of strawberries grown for treatment comparisons.
Treatment Comparisons Fruit Count
Fresh Fruit
Weight (g) by
Dry Fruit Weight
(g) by Plant
Aquaponic Locations by Greenhouse
0.0020**z 0.0067** <0.0001**
Fish, Soilless Medium Included 0.0990ns 0.0061** <0.0001**
Fish without Soilless Medium Included
0.1904ns 0.1832ns 0.0708ns
Cultivar <0.0001** <0.0001** <0.0001** z ns, ** indicates not significant and P<0.01, respectively.
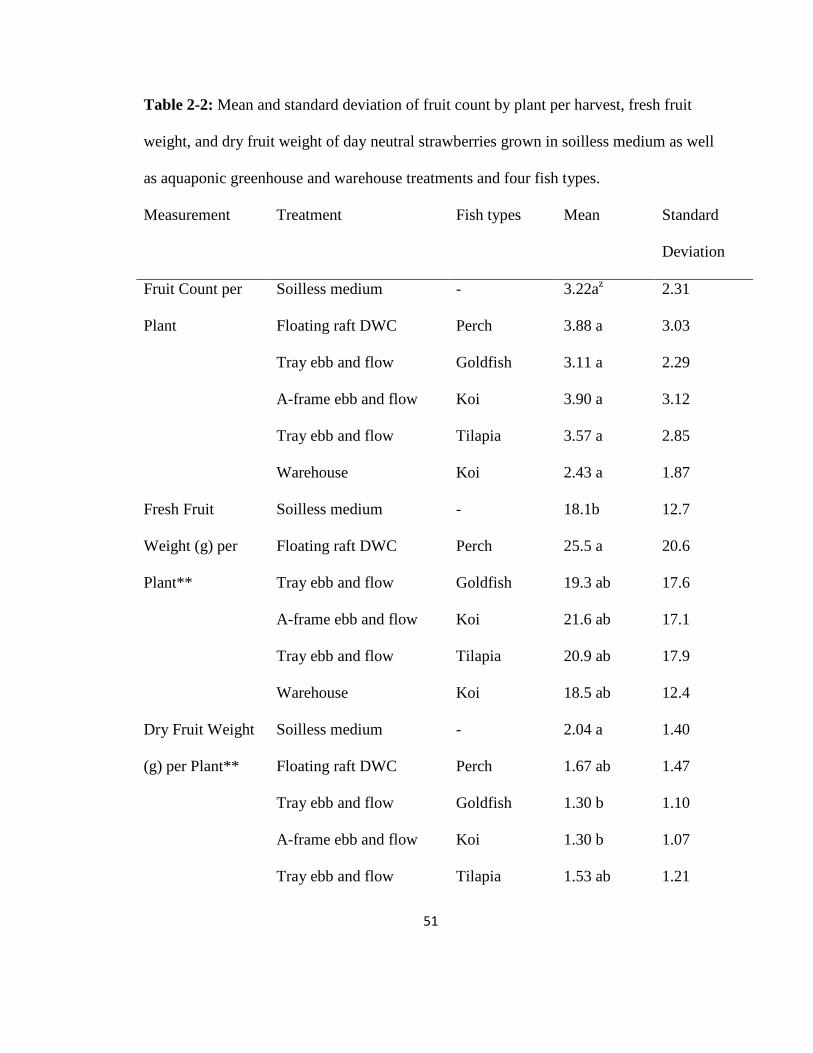
51
Table 2-2: Mean and standard deviation of fruit count by plant per harvest, fresh fruit
weight, and dry fruit weight of day neutral strawberries grown in soilless medium as well
as aquaponic greenhouse and warehouse treatments and four fish types.
Measurement Treatment Fish types Mean Standard
Deviation
Fruit Count per
Plant
Soilless medium - 3.22az 2.31
Floating raft DWC Perch 3.88 a 3.03
Tray ebb and flow Goldfish 3.11 a 2.29
A-frame ebb and flow Koi 3.90 a 3.12
Tray ebb and flow Tilapia 3.57 a 2.85
Warehouse Koi 2.43 a 1.87
Fresh Fruit
Weight (g) per
Plant**
Soilless medium - 18.1b 12.7
Floating raft DWC Perch 25.5 a 20.6
Tray ebb and flow Goldfish 19.3 ab 17.6
A-frame ebb and flow Koi 21.6 ab 17.1
Tray ebb and flow Tilapia 20.9 ab 17.9
Warehouse Koi 18.5 ab 12.4
Dry Fruit Weight
(g) per Plant**
Soilless medium - 2.04 a 1.40
Floating raft DWC Perch 1.67 ab 1.47
Tray ebb and flow Goldfish 1.30 b 1.10
A-frame ebb and flow Koi 1.30 b 1.07
Tray ebb and flow Tilapia 1.53 ab 1.21

52
Warehouse Koi 1.54 ab 1.18
zAny two means within a column not followed by the same letter are significantly
different at P≤0.001
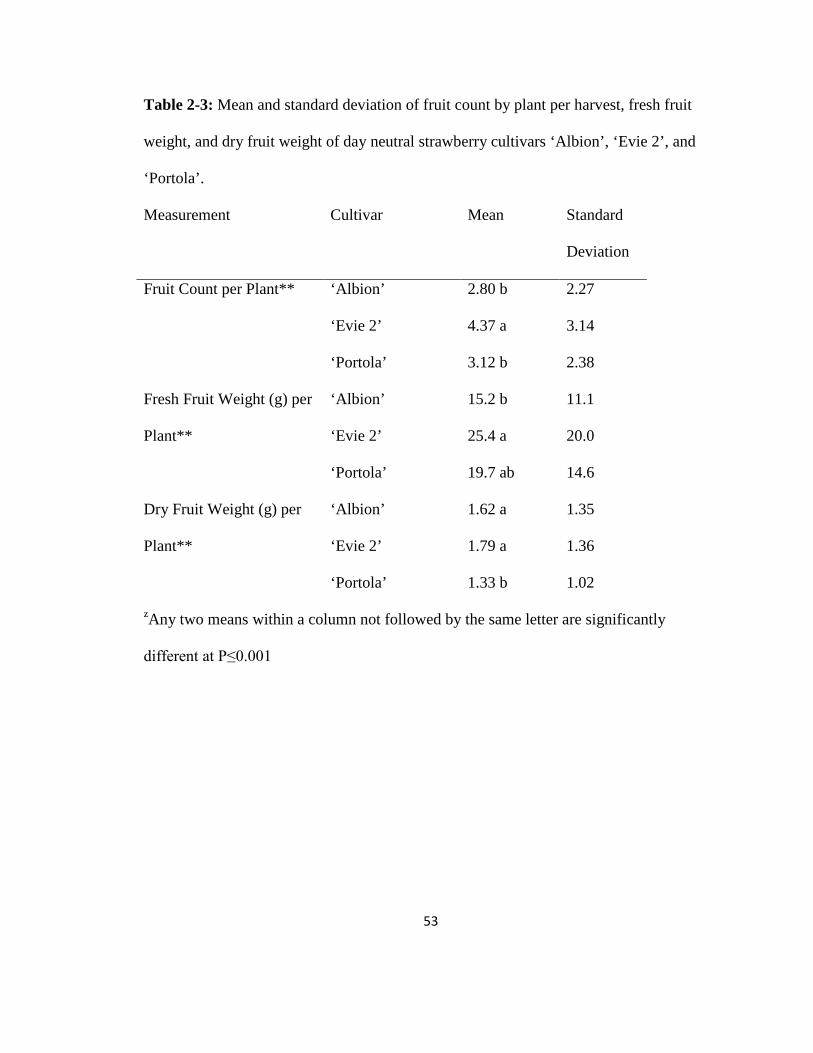
53
Table 2-3: Mean and standard deviation of fruit count by plant per harvest, fresh fruit
weight, and dry fruit weight of day neutral strawberry cultivars ‘Albion’, ‘Evie 2’, and
‘Portola’.
Measurement Cultivar Mean Standard
Deviation
Fruit Count per Plant** ‘Albion’ 2.80 b 2.27
‘Evie 2’ 4.37 a 3.14
‘Portola’ 3.12 b 2.38
Fresh Fruit Weight (g) per
Plant**
‘Albion’ 15.2 b 11.1
‘Evie 2’ 25.4 a 20.0
‘Portola’ 19.7 ab 14.6
Dry Fruit Weight (g) per
Plant**
‘Albion’ 1.62 a 1.35
‘Evie 2’ 1.79 a 1.36
‘Portola’ 1.33 b 1.02
zAny two means within a column not followed by the same letter are significantly
different at P≤0.001

54
Table 2-4: Amount by month from April 2016 to February 2017 and total number of
fruit, fresh fruit weight (g), and individual fresh fruit weight (g) for all aquaponic
treatments and soilless medium treatment of the day neutral strawberry cultivars
‘Albion’, ‘Evie 2’, and ‘Portola’.
Measurement Month ‘Albion’ ‘Evie 2’ ‘Portola’ Grand Total
Fruit Count April 2016 92.0 361.0 305.0 758.0
June 2016 70.0 452.0 139.0 661.0
July 2016 223.0 368.0 168.0 759.0
August 2016 128.0 341.0 105.0 574.0
October 2016 64.0 72.0 29.0 165.0
November 2016 320.0 631.0 229.0 1180.0
December 2016 107.0 109.0 61.0 277.0
January 2017 63.0 119.0 106.0 288.0
February 2017 5.0 4.0 8.0 17.0
Grand Total 1072.0 2457.0 1150.0 4679.0
Fresh Fruit
Weight (g)
April 2016 473.48 2567.63 1894.31 4935.42
June 2016 471.73 3067.68 903.29 4442.7
July 2016 1369.28 2234.99 1114.57 4718.84
August 2016 645.08 1323.59 620.47 2589.14
October 2016 378.76 438.56 252.93 1070.25

55
November 2016 1126.36 1768.94 910.9 3806.2
December 2016 550.7 610.8 489.2 1650.7
January 2017 37.53 168.85 288.43 494.81
February 2017 47.11 26.77 81.23 155.11
Grand Total 5100.03 12207.81 6555.33 23863.17
Average
Individual
Fresh Fruit
Weight (g) per
Month
April 2016 5.15 7.11 6.21
June 2016 6.74 6.79 6.50
July 2016 6.14 6.07 6.63
August 2016 5.04 3.88 5.91
October 2016 5.92 6.09 8.72
November 2016 3.52 2.80 3.98
December 2016 5.15 5.60 8.02
January 2017 0.60 1.42 2.72
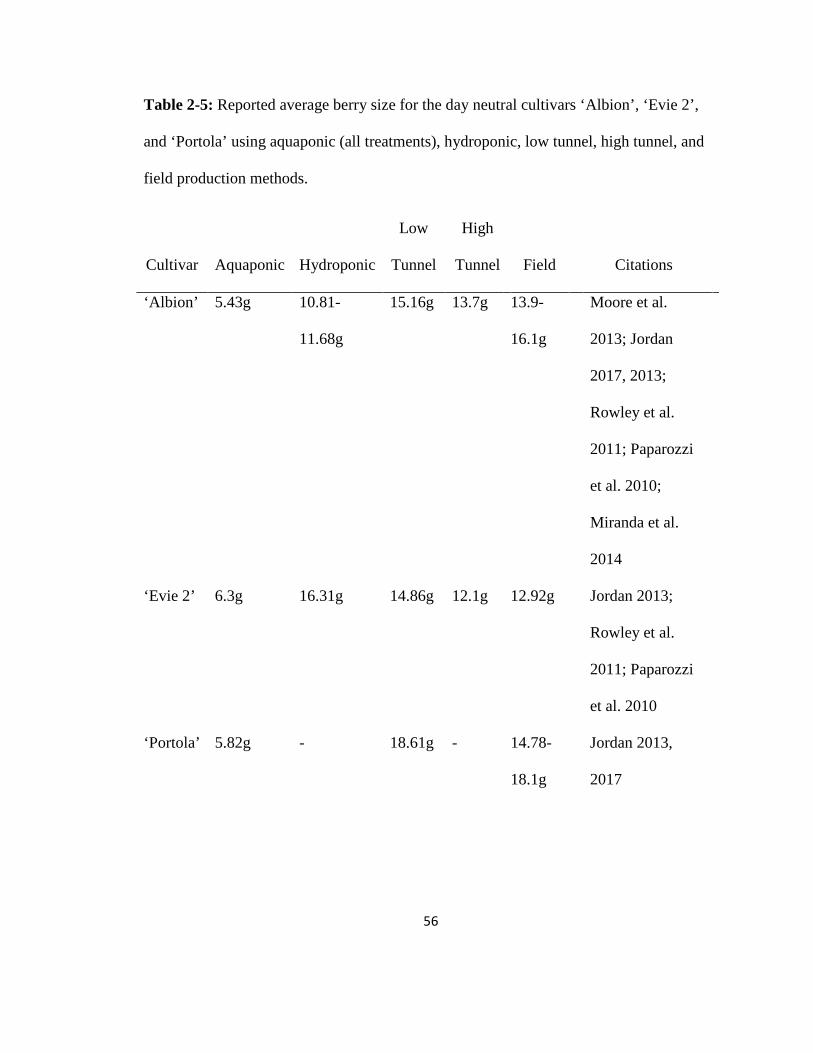
56
Table 2-5: Reported average berry size for the day neutral cultivars ‘Albion’, ‘Evie 2’,
and ‘Portola’ using aquaponic (all treatments), hydroponic, low tunnel, high tunnel, and
field production methods.
Cultivar Aquaponic Hydroponic
Low
Tunnel
High
Tunnel Field Citations
‘Albion’ 5.43g 10.81-
11.68g
15.16g 13.7g 13.9-
16.1g
Moore et al.
2013; Jordan
2017, 2013;
Rowley et al.
2011; Paparozzi
et al. 2010;
Miranda et al.
2014
‘Evie 2’ 6.3g 16.31g 14.86g 12.1g 12.92g Jordan 2013;
Rowley et al.
2011; Paparozzi
et al. 2010
‘Portola’ 5.82g - 18.61g - 14.78-
18.1g
Jordan 2013,
2017

57
Figure 2-1: Diagram of the A-frame ebb and flow system showing the location of
supplemental lighting, biofilter, fish tank, and plant lines with arrows indicating direction
of water flow.

58
Figure 2-2: Diagram of the tray ebb and flow system showing the location of the
supplemental light sources, grow beds, biofilter, and fish tank. Arrows indicate the
direction of water flow. Figure modified from Gebhardt, et al. (2015).
59
LITERATURE CITED
Abrol, D.P., A.K. Gorka, M.J. Ansari, A. Al-Ghamdi, and S. Al-Kahtani., 2017. Impact
of insect pollinators on yield and fruit quality of strawberry. Saudi J. Biol. Sci.
https://doi.org/https://doi.org/10.1016/j.sjbs.2017.08.003
Aquaponic Farming: Global Market Intelligence, 2016. . M2 Press. URL
https://www.prnewswire.com/news-releases/aquaponic-farming-global-market-
intelligence-2011-2020-300395192.html Accessed Feb.12.2018.
Arnade, C., and F. Kuchler., 2015. Measuring the Impacts of Off-Season Berry Imports.
USDA Econ. Res. Serv. 197.
Asalf, B., N. Trandem, A. Stensvand, V.W. Wekesa, G.J. de Moraes, and I. Klingen.,
2012. Influence of sulfur, powdery mildew, and the predatory mite Phytoseiulus
persimilis on two-spotted spider mite in strawberry. Biol. Control 61, 121–127.
https://doi.org/10.1016/j.biocontrol.2012.01.015
Bartholomew, D.J., 2011. Latent variable models and factor analysis : a unified approach.
3rd ed. /. ed. Hoboken, N.J. : Wiley, Hoboken, N.J.
Bernstein, S., 2011. Aquaponic gardening : a step-by-step guide to raising vegetables and
fish together . Gabriola, BC : New Society Publishers, Gabriola, BC.
Brüggemann, W., K. Maas-Kantel, and P.R. Moog., 1993. Iron uptake by leaf mesophyll
cells: The role of the plasma membrane-bound ferric-chelate reductase. Planta 190,
151–155. https://doi.org/10.1007/BF00196606

60
Bury, N.R., and M. Grosell., 2003. Waterborne iron acquisition by a freshwater teleost
fish, zebrafish Danio rerio. J. Exp. Biol. 206, 3529–3535.
Carisse, O., V. Morissette-Thomas, and H. Van Der Heyden., 2013. Lagged Association
Between Powdery Mildew Leaf Severity, Airborne Inoculum, Weather, and Crop
Losses in Strawberry. Phytopathology 103, 811–821.
https://doi.org/10.1094/PHYTO-11-12-0300-R
Cattell, R.B., 1966. The scree test for the number of factors. Multivariate Behav. Res. 1,
245–276.
Chow, K.K., T. V Price, and B.C. Hanger., 1992. Nutritional requirements for growth and
yield of strawberry in deep flow hydroponic systems 52, 95–104.
Cold Climate Strawberry Farming, 1st ed, 2014. . University of Minnesota Department of
Horticultural Science, Saint Paul, MN.
Collins, L.M., and S.T. Lanza., 2009. General Introduction, in: Latent Class and Latent
Transition Analysis. John Wiley & Sons, Inc., pp. 1–22.
https://doi.org/10.1002/9780470567333.ch1
Costa-Pierce, B.A., J. Rakocy, and W.A. Society., 1997. Tilapia aquaculture in the
Americas. Baton Rouge, La. : World Aquaculture Society ; American Tilapia
Association, Baton Rouge, La.
Dalsgaard, J., I. Lund, R. Thorarinsdottir, A. Drengstig, K. Arvonen, and P.B. Pedersen.,
2013. Farming different species in RAS in Nordic countries: Current status and

61
future perspectives. Aquac. Eng. 53, 2–13.
https://doi.org/https://doi.org/10.1016/j.aquaeng.2012.11.008
de Villiers, J.J., 2008. The influence of different production systems , planting densities
and levels ofshading on the yield , quality and growth potential of “ Chandler ”
strawberry plants ( Fragaria ananassa ) grown in coir. Stellenbosch University.
Distefano, C., and D. Mîndril., 2009. Understanding and Using Factor Scores :
Considerations for the Applied Researcher 14.
Diver, S., and L. Rinehart., 2006. Aquaponics — Integration of Hydroponics with
Aquaculture. ATTRA Natl. Sustain. Agric. Inf. Serv.
Dordas, C., 2008. Role of nutrients in controlling plant diseases in sustainable
agriculture. A review. Agron. Sustain. Dev. https://doi.org/10.1051/agro:2007051
Eigenbrod, C., and N. Gruda., 2015. Urban vegetable for food security in cities. A
review. Agron. Sustain. Dev. 35, 483–498. https://doi.org/10.1007/s13593-014-
0273-y
ERS., 2016. U.S. Strawberry Consumption Continues to Grow. USDA Econ. Res. Serv.
URL https://www.ers.usda.gov/data-products/chart-gallery/gallery/chart-
detail/?chartId=77884
Evie 2 Plant Breeders Rights, 2018. . Can. Food Insp. Agency. URL
http://www.inspection.gc.ca/english/plaveg/pbrpov/cropreport/str/app00006055e.sht
ml

62
Gebhardt, B., M. White, C. Montouri, and K. Vinzenz., 2015. Comparing Multiple Forms
of Light on Different Cultivars of Swiss Chard in an Ebb and Flow Bench
Aquaponics System. Univ. Minnesota.
Goddek, S., B. Delaide, U. Mankasingh, V.K. Ragnarsdottir, H. Jijakli, and R.
Thorarinsdottir., 2015. Challenges of Sustainable and Commercial Aquaponics.
Sustain. . https://doi.org/10.3390/su7044199
Graber, A., and R. Junge., 2009. Aquaponic Systems: Nutrient recycling from fish
wastewater by vegetable production. Desalination 246, 147–156.
https://doi.org/https://doi.org/10.1016/j.desal.2008.03.048
Hashim, N., 2014. Reversing food desertification: examining urban farming in Louisville,
Chicago and Detroit. Local Environ. 1–26.
https://doi.org/10.1080/13549839.2014.931364
Hundley, G.C., and R.D. Navarro., 2013. AQUAPONICS: INTEGRATION BETWEEN
AQUACULTURE AND HYDROPONICS. Rev. Bras. Agropecuária Sustentável 3.
https://doi.org/10.21206/rbas.v3i2.218
Jolliffe, I.T., 1986. Principal component analysis. Springer-Verlag, New York.
Jordan, E., 2017. 2017 Results. UMN Fruit Res. URL http://fruit.cfans.umn.edu/2017-
results/
Jordan, E., 2013. Individual berry weight for day-neutral strawberries. UMN Fruit Res.
URL http://fruit.cfans.umn.edu/individual-berry-weight-day-neutral-strawberries/

63
Karimanzira, D., K. Keesman, W. Kloas, D. Baganz, and T. Rauschenbach., 2017.
Efficient and economical way of operating a recirculation aquaculture system in an
aquaponics farm. Aquac. Econ. & Manag. 21, 470–486.
https://doi.org/10.1080/13657305.2016.1259368
Kloas, W., R. Groß, J. Graupner, H. Monsees, M. Tschirner, B. Wittstock, S. Wuertz, A.
Zikova, B. Rennert, D. Baganz, G. Staaks, J. Suhl, and U. Schmidt., 2015. A new
concept for aquaponic systems to improve sustainability, increase productivity, and
reduce environmental impacts. Aquac. Environ. Interact. 7, 179–192.
https://doi.org/10.3354/aei00146
Kobayashi, T., and N.K. Nishizawa., 2012. Iron Uptake, Translocation, and Regulation in
Higher Plants. Annu. Rev. Plant Biol. 63, 131–152. https://doi.org/10.1146/annurev-
arplant-042811-105522
Kwong, R.W.M., and S. Niyogi., 2008. An in vitro examination of intestinal iron
absorption in a freshwater teleost, rainbow trout (Oncorhynchus mykiss). J. Comp.
Physiol. B 178, 963–975. https://doi.org/10.1007/s00360-008-0279-3
Lewis, W.M., 1978. Use of Hydroponics to Maintain Quality of Recirculated Water in a
Fish Culture System. Trans. Am. Fish. Soc. 107, 92–99.
Love, D.C., J.P. Fry, L. Genello, E.S. Hill, J.A. Frederick, X. Li, and K. Semmens., 2014.
An International Survey of Aquaponics Practitioners. PLoS One 9, e102662.
Love, D.C., J.P. Fry, X. Li, E.S. Hill, L. Genello, K. Semmens, and R.E. Thompson.,

64
2015. Commercial aquaponics production and profitability: Findings from an
international survey. Aquaculture 435, 67–74.
https://doi.org/https://doi.org/10.1016/j.aquaculture.2014.09.023
Lucena, J.J., A. Garate, A.M. Ramon, and M. Manzanares., 1990. Iron nutrition of a
hydroponic strawberry culture ( Fragaria vesca L .) supplied with different Fe
chelates 15, 9–15.
Mattner, S.W., C.B. Horstra, M. Milinkovic, P.R. Merriman, and F.C. Greenhalgh., 2017.
Evaluation of soil-less systems for strawberry transplant production in Australia.
Acta Hortic. 1176. 53–64. https://doi.org/10.17660/ActaHortic.2017.1176.8
Milicic, V., R. Thorarinsdottir, M. Dos Santos, and M.T. Hancic., 2017. Commercial
Aquaponics Approaching the European Market: To Consumers’ Perceptions of
Aquaponics Products in Europe. Water 9, 80.
https://doi.org/http://dx.doi.org/10.3390/w9020080
Miranda, F.R. de, V.B. Da Silva, F.S.R. Dos Santos, A.G. Rossetti, and C. de F.B. Da
Silva., 2014. Production of strawberry cultivars in closed hydroponic systems and
coconut fibre substrate. Rev. Ciência Agronômica 45, 833–841.
https://doi.org/10.1590/S1806-66902014000400022
Moore, P., D. Collins, A. Bary, and C. Cogger., 2013. Evaluation of Day-Neutral
Production in Washington Cultivars for Organic Strawberry 167–174.
Morgan, K., 2015. Commodity Strawberry Profile. Agric. Mark. Resour. Cent. URL

65
https://www.agmrc.org/commodities-products/fruits/strawberries/
Nitsch, J.P., 1950. GROWTH AND MORPHOGENESIS OF THE STRAWBERRY AS
RELATED TO AUXIN. Am. J. Bot. 37, 211–215. https://doi.org/10.1002/j.1537-
2197.1950.tb12183.x
Nye, W.P., and J.L. Anderson., 1974. Insect Pollinators Frequenting Strawberry
Blossoms and the Effect of Honey Bees on Yeild and Fruit Quality 99, 40–44.
Ostertagová, E., O. Ostertag, and J. Kováč., 2014. Methodology and Application of the
Kruskal- Wallis Test. Appl. Mech. Mater.
https://doi.org/10.4028/www.scientific.net/AMM.611.115
Padilla, M., B. Oberti, V. Boileau, and N. El Jabri., 2007. Consumers and Hydroponic
Tomatoes : Perception and Market Place 37–46.
Paparozzi, E., S. Adams, G. Meyer, M.E. Conley, V. Schlegel, E. Blankenship, and P.
Read., 2010. Selecting Strawberry Cultivars for Winter Greenhouse Production.
Hortscience 45, S230–S230.
Pestana, M., I. Domingos, F. Gama, S. Dandlen, M. Miguel, J. Castro Pinto, A. de
Varennes, and P. Correia., 2011. Strawberry recovers from iron chlorosis after foliar
application of a grass-clipping extract. J. Plant Nutr. Soil Sci. 174, 473–479.
https://doi.org/10.1002/jpln.201000215
Petran, A., E. Hoover, L. Hayes, and S. Poppe., 2017. Yield and quality characteristics of
day-neutral strawberry in the United States Upper Midwest using organic practices.
66
Biol. Agric. & Hortic. 33, 73–88.
https://doi.org/10.1080/01448765.2016.1188152
Poppe, S., E. Hoover, A. Petran, and J. Tillman., 2016. University of Minnesota Day-
neutral Low Tunnel Strawberry Project. Univ. Minnesota. URL
http://fruit.cfans.umn.edu/files/2016/01/Low_Tunnel_MFVGA_2016_FINAL.pdf
Pritts, M., and L. Mcdermott., 2017. PROTECTED CULTURE FOR STRAWBERRIES
USING LOW TUNNELS 1–20.
Pundt, L., 2014. Biological Control of Two-Spotted Spider Mites. Integr. Pest Manag.
Progr. University.
Rakocy, J.E., D.S. Bailey, R.C. Shultz, and J.J. Danaher., 2007. PRELIMINARY
EVALUATION OF ORGANIC WASTE FROM TWO AQUACULTURE
SYSTEMS AS A SOURCE OF INORGANIC NUTRIENTS FOR
HYDROPONICS, in: Acta Horticulturae. International Society for Horticultural
Science (ISHS), Leuven, Belgium, pp. 201–207.
https://doi.org/10.17660/ActaHortic.2007.742.27
Rakocy, J.E., M.P. Masser, and T.M. Losordo., 2006. Recirculating aquaculture tank
production systems: Aquaponics- integrating fish and plant culture. SRAC Publ. -
South. Reg. Aquac. Cent. 16. https://doi.org/454
Roosta, H.R., 2014. Effect of Ammonium: Nitrate Ratios in the Response of Strawberry
to Alkalinity in Hydroponics. J. Plant Nutr.

67
https://doi.org/10.1080/01904167.2014.888749
Rowley, D., B.L. Black, D. Drost, and D. Feuz., 2011. Late-season strawberry production
using day-neutral cultivars in high-elevation high tunnels . HortScience 46, 1480–
1485.
Ru, D., J. Liu, Z. Hu, Y. Zou, L. Jiang, X. Cheng, and Z. Lv., 2017. Improvement of
aquaponic performance through micro- and macro-nutrient addition. Environ. Sci.
Pollut. Res. 24, 16328–16335. https://doi.org/10.1007/s11356-017-9273-1
Ruth-McSwain, A., 2012. Eating green: Coverage of the locavore movement. J. Ext. 50.
Schlegel, T.K., J. Schönherr, and L. Schreiber., 2006. Rates of foliar penetration of
chelated Fe(III): Role of light, stomata, species, and leaf age. J. Agric. Food Chem.
54, 6809–6813. https://doi.org/10.1021/jf061149i
Shaalan, M., M. El-Mahdy, M. Saleh, and M. El-Matbouli., 2018. Aquaculture in Egypt:
Insights on the Current Trends and Future Perspectives for Sustainable
Development. Rev. Fish. Sci. & Aquac.
https://doi.org/10.1080/23308249.2017.1358696
Short, G., C. Yue, N. Anderson, C. Russell, and N. Phelps., 2017. Consumer Perceptions
of Aquaponic Systems. Horttechnology 27, 358–366.
https://doi.org/10.21273/HORTTECH03606-16
Sirsat, S.A., and J.A. Neal., 2013. Microbial Profile of Soil-Free versus In-Soil Grown
Lettuce and Intervention Methodologies to Combat Pathogen Surrogates and

68
Spoilage Microorganisms on Lettuce. Foods 2, 488–498.
https://doi.org/10.3390/foods2040488
Søberg, E.-E., 2016. The growth and development of lettuce, coriander and swiss chard
in a cold water aquaponic system optimized for lettuce production. Norwegian
Unviersity of Life Sciences, Ås.
Sorensen, M., L. Robinson, and T. Roth-krosnoski., 2015. A Comparison of Rockwool ,
Lava Rock , Expanded Clay Aggregate , and Coconut Coir as Growing Substrate in
a Floating Raft Aquaponic System Examining Growth Rates of “ Improved
Amethyst ” Basil and “ Nancy ” Butterhead Lettuce. Univ. Minnesota.
Specht, K., T. Weith, K. Swoboda, and R. Siebert., 2016. Socially acceptable urban
agriculture businesses. Agron. Sustain. Dev. 36, 1–14.
Suhl, J., D. Dannehl, W. Kloas, D. Baganz, S. Jobs, G. Scheibe, and U. Schmidt., 2016.
Advanced aquaponics: Evaluation of intensive tomato production in aquaponics vs.
conventional hydroponics. Agric. Water Manag. 178, 335–344.
https://doi.org/10.1016/j.agwat.2016.10.013
Taiz, L., 2010. Plant physiology , 5th ed. . ed. Sunderland, MA : Sinauer Associates,
Sunderland, MA.
Takeda, F., and S.C. Hokanson., 2003. Strawberry fruit and plug plant production in the
greenhouse . Acta Hortic.
Tamin, M., A. Harun, A. Estim, S. Saufie, and S. Obong., 2015. Consumer Acceptance

69
towards Aquaponic Products, IOSR Journal of Business and Management (IOSR-
JBM). https://doi.org/10.9790/487X-17824964
Tokunaga, K., C. Tamaru, H. Ako, and P. Leung., 2015. Economics of Small-scale
Commercial Aquaponics in Hawai'i.(Report) 46, 20.
https://doi.org/10.1111/jwas.12173
Vickery, W., 1961. Counterspeculation, auctions, and competitive sealed bids. J. Financ.
16, 8–37.
Villarroel, M., J.M.R. Alvariño, and J.M. Duran., 2011. Aquaponics : integrating fish
feeding rates and ion waste production. Spanish J. Agric. Res. 9, 537–545.
Vincent, C., D.D. de Oliveira, and A. Bélanger., 1990. The management of insect
pollinators and pests in Quebec strawberry plantations. Monit. Integr. Manag.
arthropod pests small fruit Crop.
Walsh, D.B., F.G. Zalom, D. V Shaw, and K.D. Larson., 2002. Yield reduction caused by
twospotted spider mite feeding in an advanced-cycle strawberry breeding population
. J. Am. Soc. Hortic. Sci. 127, 230–237.
Watanabe, T., V. Kiron, and S. Satoh., 1997. Trace minerals in fish nutrition.
Aquaculture 151, 185–207. https://doi.org/https://doi.org/10.1016/S0044-
8486(96)01503-7
Wortman, S., M.S. Douglass, and J.D. Kindhart., 2016. Cultivar, Growing Media, and
Nutrient Source Influence Strawberry Yield in a Vertical, Hydroponic, High Tunnel
70
System. Horttechnology 26, 466–473.
Yue, C., T.M. Hurley, and N. Anderson., 2011. Do native and invasive labels affect
consumer willingness to pay for plants? Evidence from experimental auctions.
Agric. Econ. 42, 195–205. https://doi.org/10.1111/j.1574-0862.2010.00510.x
Zaiter, H.Z., I. Saad, and M. Nimah., 1993. Yield of iron‐sprayed and non‐sprayed
strawberry cultivars grown on high pH calcareous soil. J. Plant Nutr. 16, 281–296.
https://doi.org/10.1080/01904169309364531
Zugravu, A.G., M.M.T. Rahoveanu, A.T. Rahoveanu, M.S. Khalel, and M.A.R. Ibrahim.,
2016. The Perception of Aquaponics Products in Romania . Risk Contemp. Econ. 3,
525–530.