market action report rye city - nov2011
TRANSCRIPT

8/3/2019 Market Action Report Rye City - Nov2011
http://slidepdf.com/reader/full/market-action-report-rye-city-nov2011 1/2
November 2011
Price Range: All | Properties: Single Family
Market Profile & Trends Overview LM L3M PYM LY Prior YTD Prior Year
Median List Price of all Current Listings -2% 51%
Average List Price of all Current Listings 4% 20%
November Median Sales Price 34% 116% 284% 167% 19% 19%
November Average Sales Price 32% 47% 264% 99% 15% 15%
Total Properties Currently for Sale (Inventory) -14% 3%
November Number of Properties Sold -29% 150% -11%
November Average Days on Market (Solds) 130% 107% 359% 137% -15% -14%
Asking Price per Square Foot (based on New Listings) 8% 10% 48% 30% 5% 4%
November Sold Price per Square Foot 38% 31% 60% 46% 7% 8%
November Month's Supply of Inventory 20% 29% -59% 31% -15% -10%
November Sale Price vs List Price Ratio 1.3% .7% -.1% -2.4% -.5% -.5%
Property SalesNovember Property sales were 5, up 150.0% from 2 inNovember of 2010 and 28.6% lower than the 7 saleslast month. November 2011 sales were at a mid levelcompared to November of 2010 and 2009.November YTD sales of 125 are running 10.7%behind last year's year-to-date sales of 140.
12.0 8.392.9% 94.7%
* LM=Last Month / L3M=Last 3 Months / PYM=Same Month Prior Year / LY=Last Year (2010) / YTD = Year-to-date | Arrows indicate if Month / YTD values are higher (up), lower (down) or unchanged (flat)
Number of Properties Sold
280 102$696 $557$732 $541
$3,030,500 $1,750,01960
5 125
$1,797,000
$2,288,755$3,200,000 $1,430,000
MARKET ACTION REPORTMLS Area: Rye City
Trending versus*: Trending versus*:
Month YTD
4 2 35
2
1 0 1
1
2 1
1 1 1
2
1 0
7
1 2
5
9 9
1 4
1 3
2 7
2 2
1 8
8
1 3
2
1 1
7
9
7
1 1
9
1 8
2 6
1 4
1 2
7
0
5
10
15
20
2530
D08
J09
F M A M J J A S O N D J10
F M A M J J A S O N D J11
F M A M J J A S O N
3 Mo Avg
Michele C. Flood
Associate Broker
[email protected] cell
Prices
Inventory & MSIThe Total Inventory of Properties available for sale as of November was 60, down 14.3% from 70 last month andup 3.4% from 58 in November of last year. November2011 Inventory was at a mid level compared withNovember of 2010 and 2009.
Data is provided courtesy of Empire Access Multiple Listing Service, Inc. and may not reflect all relevant real estate activity.does not warrant or guarantee the accuracy of this information . It is the responsibility of any buyer or seller to verify any and all information relevant to such consumer’s real estate transaction
Median Sales Price and Average Sales Price
The Median Sales Price in November was$3,200,000, up 284.4% from $832,500 in Novemberof 2010 and up 33.6% from $2,395,000 last month.The Average Sales Price in November was$3,030,500, up 264.0% from $832,500 in Novemberof 2010 and up 31.8% from $2,299,821 last month.November 2011 ASP was at the highest levelcompared to November of 2010 and 2009.
Total Inventory & Month's Supply of Inventory (MSI)
A comparatively lower MSI is more beneficial for sellerswhile a higher MSI is better for buyers. The November2011 MSI of 12.0 months was at its lowest level comparedwith November of 2010 and 2009.
Copyright © | Price Range: All | Property Types: Single Family
4 2 35
2
1 0 1
1 1 1 1
2
1 0
7
1 2
5
9 9 8
2
1 1
7
9
7
1 1
9
1 2
7
0
5
D08
J09
F M A M J J A S O N D J10
F M A M J J A S O N D J11
F M A M J J A S O N
600
1,100
1,600
2,100
2,600
3,100
D08
J09
F M A M J J A S O N D J10
F M A M J J A S O N D J11
F M A M J J A S O N
Median means Middle (the same # of properties sold above and below the Median)
MSI is the # of month's needed to sell all of the Inventory at the monthly Sales Pace
7 6
8 7
1 0 3 1
1 3 1
2 4
1 1 9
1 1 8
1 1 8
1 1 8
1 0 9
1 0 0
9 1
7 3 7
6 7 6
8 5
1 0 3
1 1 7
1 0 4
9 1
8 4
8 1
7 2
5 8
3 9
5 7
7 0
8 1
9 6
1 1 0
9 7
9 3
7 9
7 1
7 0
6 0
0
20
40
60
80
100
120
140
D08
J09
F M A M J J A S O N D J10
F M A M J J A S O N D J11
F M A M J J A S O N
(000's) 3 Mo Avg
8/3/2019 Market Action Report Rye City - Nov2011
http://slidepdf.com/reader/full/market-action-report-rye-city-nov2011 2/2
November 2011
Price Range: All | Properties: Single Family
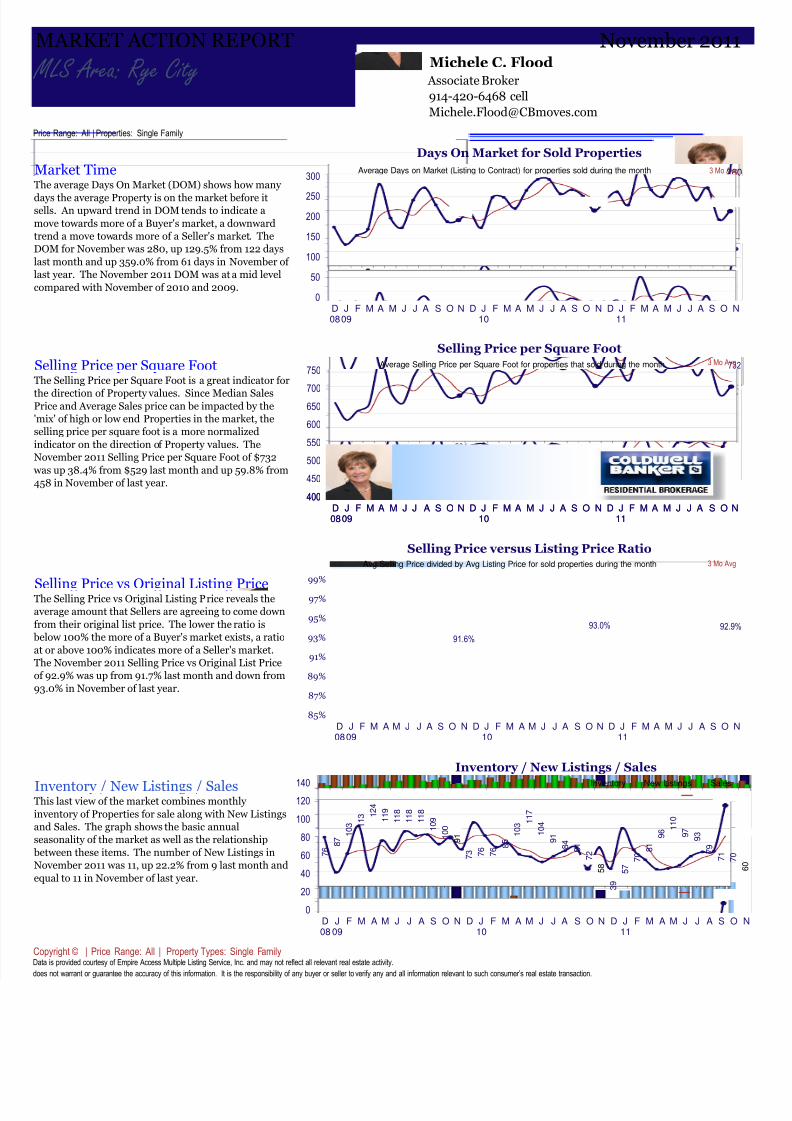
Market Time
Selling Price per Square FootThe Selling Price per Square Foot is a great indicator for
the direction of Property values. Since Median SalesPrice and Average Sales price can be impacted by the'mix' of high or low end Properties in the market, theselling price per square foot is a more normalizedindicator on the direction of Property values. TheNovember 2011 Selling Price per Square Foot of $732was up 38.4% from $529 last month and up 59.8% from458 in November of last year.
MARKET ACTION REPORT
MLS Area: Rye City
Days On Market for Sold Properties
The average Days On Market (DOM) shows how many days the average Property is on the market before itsells. An upward trend in DOM tends to indicate amove towards more of a Buyer's market, a downwardtrend a move towards more of a Seller's market. TheDOM for November was 280, up 129.5% from 122 dayslast month and up 359.0% from 61 days in November of last year. The November 2011 DOM was at a mid levelcompared with November of 2010 and 2009.
Selling Price per Square Foot
169
61
280
0
50
100
150
200
250
300
D08
J09
F M A M J J A S O N D J10
F M A M J J A S O N D J11
F M A M J J A S O N
Average Days on Market (Listing to Contract) for properties sold during the month
504
458
732
400
450
500
550
600
650700
750
D08
J09
F M A M J J A S O N D J10
F M A M J J A S O N D J11
F M A M J J A S O N
Average Selling Price per Square Foot for properties that sold during the month
3 Mo Avg
3 Mo Avg
Michele C. Flood
Associate Broker
[email protected] cell
Selling Price vs Original Listing Price
Inventory / New Listings / Sales
Data is provided courtesy of Empire Access Multiple Listing Service, Inc. and may not reflect all relevant real estate activity.does not warrant or guarantee the accuracy of this information. It is the responsibility of any buyer or seller to verify any and all information relevant to such consumer’s real estate transaction.
Selling Price versus Listing Price Ratio
The Selling Price vs Original Listing Price reveals theaverage amount that Sellers are agreeing to come downfrom their original list price. The lower the ratio isbelow 100% the more of a Buyer's market exists, a ratioat or above 100% indicates more of a Seller's market.The November 2011 Selling Price vs Original List Priceof 92.9% was up from 91.7% last month and down from93.0% in November of last year.
Inventory / New Listings / Sales
This last view of the market combines monthly inventory of Properties for sale along with New Listingsand Sales. The graph shows the basic annualseasonality of the market as well as the relationshipbetween these items. The number of New Listings inNovember 2011 was 11, up 22.2% from 9 last month andequal to 11 in November of last year.
Copyright © | Price Range: All | Property Types: Single Family
400D08
J09
F M A M J J A S O N D J10
F M A M J J A S O N D J11
F M A M J J A S O N
91.6%93.0% 92.9%
85%
87%
89%
91%
93%
95%
97%
99%
D08
J09
F M A M J J A S O N D J10
F M A M J J A S O N D J11
F M A M J J A S O N
Avg Selling Price divided by Avg Listing Price for sold properties during the month
7 6
8 7
1 0 3 1
1 3 1
2 4
1 1 9
1 1 8
1 1 8
1 1 8
1 0 9
1 0 0
9 1
7 3 7
6 7 6
8 5
1 0 3
1 1 7
1 0 4
9 1
8 4
8 1
7 2
5 8
3 9
5 7
7 0
8 1
9 6
1 1 0
9 7
9 3
7 9
7 1
7 0
0
20
40
60
80
100
120140
D08
J09
F M A M J J A S O N D J10
F M A M J J A S O N D J11
F M A M J J A S O N
Inventory New Listings Sales
3 Mo Avg