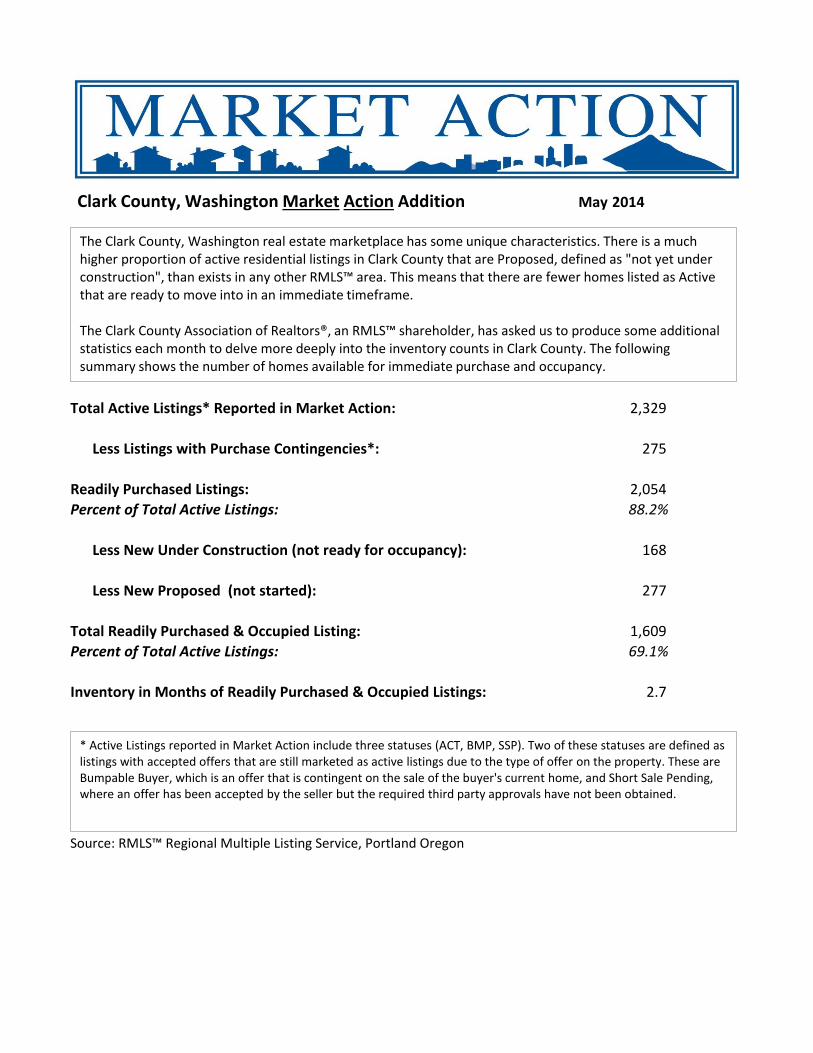
market action clark county wa may 2014
DESCRIPTION
Clark County (SW Washington) including: Vancouver, Camas, Ridgefield, Washougal, Battle Ground.TRANSCRIPT
HIDE THESE COLUMNS BEFORE PRINTING PAGE TO PDF
Active
Bumpable Buyer
Short Sale Pending
Total Active
ACT-Under Construction
BMP-UC
SSP-UC
ACT-Proposed
BMP-Prop
SSP-Prop
ACT-New
BMP-New
Total Active Listings* Reported in Market Action: 2,329
Less Listings with Purchase Contingencies*: 275
Readily Purchased Listings: 2,054
Percent of Total Active Listings: 88.2%
Less New Under Construction (not ready for occupancy): 168
Less New Proposed (not started): 277
Total Readily Purchased & Occupied Listing: 1,609
Percent of Total Active Listings: 69.1%
Inventory in Months of Readily Purchased & Occupied Listings: 2.7
Source: RMLS™ Regional Multiple Listing Service, Portland Oregon
Clark County, Washington Market Action Addition May 2014
The Clark County, Washington real estate marketplace has some unique characteristics. There is a much higher proportion of active residential listings in Clark County that are Proposed, defined as "not yet under construction", than exists in any other RMLS™ area. This means that there are fewer homes listed as Active that are ready to move into in an immediate timeframe. The Clark County Association of Realtors®, an RMLS™ shareholder, has asked us to produce some additional statistics each month to delve more deeply into the inventory counts in Clark County. The following summary shows the number of homes available for immediate purchase and occupancy.
* Active Listings reported in Market Action include three statuses (ACT, BMP, SSP). Two of these statuses are defined as listings with accepted offers that are still marketed as active listings due to the type of offer on the property. These are Bumpable Buyer, which is an offer that is contingent on the sale of the buyer's current home, and Short Sale Pending, where an offer has been accepted by the seller but the required third party approvals have not been obtained.

A Publication of RMLS™, The Source for Real Estate Statistics in Your Community
© Copyright RMLS™ 2014. All Rights Reserved.
Residential Review: Southwest Washington May 2014 Reporting Period
May Residential Highlights Activity was on the upswing
this May in Southwest Washington! New listings (1,115) rose 24.9% over April’s 893 but also represented an increase of 20.3% over the 927 new listings posted last May. This was the best May for new listings in Southwest Washington since 2008, when there were 1,312. The 600 closed sales increased 4.3% over last May (575), 14.9% from April (522), and also represent the best May for closings since 2006! Pending sales were also in the black: the 747 accepted offers increased 0.9% over the 740 posted last May and 6.6% over the 701 posted just last month.
Total market time fell again to 98 days in May. Inventory fell slightly to 3.9 months.
Average and Median Sale PricesThe average price over the
first five months of the year was $261,700, an increase of 7.4% from the same period in 2013 when the average price was $243,600. In the same comparison, the median rose 7.1% from $218,000 in the first five months of 2013 to $233,500 in the same period of 2014.
New Listings
Pending Sales
ClosedSales
AverageSale Price
MedianSale Price
Total Market
Time
May 1,115 747 600 263,100 236,300 98
April 893 701 522 265,500 234,900 104
year-to-date 4,170 3,031 2,413 261,700 233,500 108
May 927 740 575 252,200 225,000 108
year-to-date 3,891 2,953 2,348 243,600 218,000 116
May 20.3% 0.9% 4.3% 4.3% 5.0% -9.8%
Prev Mo 2014 24.9% 6.6% 14.9% -0.9% 0.6% -5.8%
year-to-date 7.2% 2.6% 2.8% 7.4% 7.1% -7.1%
2014
2013
Chan
ge
Clark County Residential highlights
*Inventory in Months is calculated by dividing the Active Residential Listings at the end of the month in question by the number of closed sales for that month.This number includes proposed and under construction homes.
Inventory in Months*2012 2013 2014
January 8.8 6.2 6.4February 7.7 5.6 5.7March 6.4 4.4 4.6April 6.7 4.0 4.1May 5.7 3.8 3.9June 5.4 3.7July 5.4 3.5August 5.1 3.9September 5.6 4.7october 4.7 4.7November 5.2 5.3December 5.1 4.5
Percent Change of 12-Month Sale Price Compared With The Previous 12 Months
Average Sale Price % Change: +9.4% ($257,000 v. $235,000)Median Sale Price % Change:+10.6% ($229,900 v. $207,800)
For further explanation of this measure, see the second footnote on page 3.
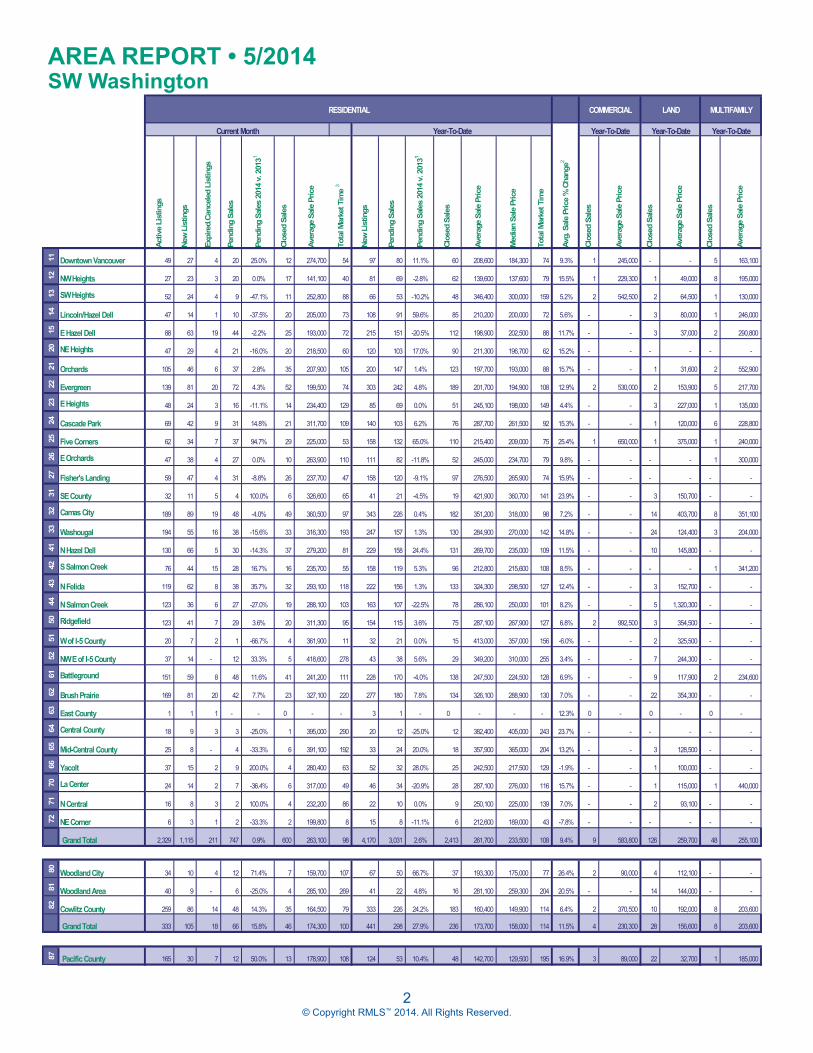
Due to significant differences between the counties in Southwest Washington, the Residential Review on pages 1, 3, 4, and 5 contain Clark County data only. For data on Cowlitz County, see the Area Report on page 2, or the graphs on page 6.
2© Copyright RMLS™ 2014. All Rights Reserved.
AREA REPORT • 5/2014 SW Washington
Activ
e Li
stin
gs
New
Lis
tings
Expi
red.
Canc
eled
Lis
tings
Pend
ing
Sale
s
Pend
ing
Sale
s 20
14 v
. 201
31
Clos
ed S
ales
Aver
age
Sale
Pric
e
Tota
l Mar
ket T
ime
3
New
Lis
tings
Pend
ing
Sale
s
Pend
ing
Sale
s 20
14 v
. 201
31
Clos
ed S
ales
Aver
age
Sale
Pric
e
Med
ian
Sale
Pric
e
Tota
l Mar
ket T
ime
Avg.
Sal
e Pr
ice
% C
hang
e2
Clos
ed S
ales
Aver
age
Sale
Pric
e
Clos
ed S
ales
Aver
age
Sale
Pric
e
Clos
ed S
ales
Aver
age
Sale
Pric
e
11 Downtown Vancouver 49 27 4 20 25.0% 12 274,700 54 97 80 11.1% 60 208,600 184,300 74 9.3% 1 245,000 - - 5 163,100
12 NW heights 27 23 3 20 0.0% 17 141,100 40 81 69 -2.8% 62 139,600 137,600 79 15.5% 1 229,300 1 49,000 8 195,000
13 SW heights 52 24 4 9 -47.1% 11 252,800 88 66 53 -10.2% 48 346,400 300,000 159 5.2% 2 542,500 2 64,500 1 130,000
14 Lincoln/Hazel Dell 47 14 1 10 -37.5% 20 205,000 73 108 91 59.6% 85 210,200 200,000 72 5.6% - - 3 80,000 1 246,000
15 E Hazel Dell 88 63 19 44 -2.2% 25 193,000 72 215 151 -20.5% 112 198,900 202,500 88 11.7% - - 3 37,000 2 290,800
20 NE heights 47 29 4 21 -16.0% 20 218,500 60 120 103 17.0% 90 211,300 196,700 62 15.2% - - - - - -
21 orchards 105 46 6 37 2.8% 35 207,900 105 200 147 1.4% 123 197,700 193,000 88 15.7% - - 1 31,600 2 552,900
22 Evergreen 139 81 20 72 4.3% 52 199,500 74 303 242 4.8% 189 201,700 194,900 108 12.9% 2 530,000 2 153,900 5 217,700
23 E heights 48 24 3 16 -11.1% 14 234,400 129 85 69 0.0% 51 245,100 198,000 149 4.4% - - 3 227,000 1 135,000
24 Cascade Park 69 42 9 31 14.8% 21 311,700 109 140 103 6.2% 76 287,700 261,500 92 15.3% - - 1 120,000 6 228,800
25 Five Corners 62 34 7 37 94.7% 29 225,000 53 158 132 65.0% 110 215,400 209,000 75 25.4% 1 650,000 1 375,000 1 240,000
26 E orchards 47 38 4 27 0.0% 10 263,900 110 111 82 -11.8% 52 245,000 234,700 79 9.8% - - - - 1 300,000
27 Fisher's Landing 59 47 4 31 -8.8% 26 237,700 47 158 120 -9.1% 97 276,500 265,900 74 15.9% - - - - - -
31 SE County 32 11 5 4 100.0% 6 326,600 65 41 21 -4.5% 19 421,900 360,700 141 23.9% - - 3 150,700 - -
32 Camas City 189 89 19 48 -4.0% 49 360,500 97 343 226 0.4% 182 351,200 318,000 98 7.2% - - 14 403,700 8 351,100
33 Washougal 194 55 16 38 -15.6% 33 316,300 193 247 157 1.3% 130 284,900 270,000 142 14.8% - - 24 124,400 3 204,000
41 N Hazel Dell 130 66 5 30 -14.3% 37 279,200 81 229 158 24.4% 131 269,700 235,000 109 11.5% - - 10 145,800 - -
42 S Salmon Creek 76 44 15 28 16.7% 16 235,700 55 158 119 5.3% 96 212,800 215,600 108 8.5% - - - - 1 341,200
43 N Felida 119 62 8 38 35.7% 32 293,100 118 222 156 1.3% 133 324,300 298,500 127 12.4% - - 3 152,700 - -
44 N Salmon Creek 123 36 6 27 -27.0% 19 288,100 103 163 107 -22.5% 78 286,100 250,000 101 8.2% - - 5 1,320,300 - -
50 Ridgefield 123 41 7 29 3.6% 20 311,300 95 154 115 3.6% 75 287,100 267,900 127 6.8% 2 992,500 3 354,500 - -
51 W of I-5 County 20 7 2 1 -66.7% 4 361,900 11 32 21 0.0% 15 413,000 357,000 156 -6.0% - - 2 325,500 - -
52 NW E of I-5 County 37 14 - 12 33.3% 5 418,600 278 43 38 5.6% 29 349,200 310,000 255 3.4% - - 7 244,300 - -
61 Battleground 151 59 8 48 11.6% 41 241,200 111 228 170 -4.0% 138 247,500 224,500 128 6.9% - - 9 117,900 2 234,600
62 Brush Prairie 169 81 20 42 7.7% 23 327,100 220 277 180 7.8% 134 326,100 288,900 130 7.0% - - 22 354,300 - -
63 East County 1 1 1 - - 0 - - 3 1 - 0 - - - 12.3% 0 - 0 - 0 -
64 Central County 18 9 3 3 -25.0% 1 395,000 290 20 12 -25.0% 12 382,400 405,000 243 23.7% - - - - - -
65 Mid-Central County 25 8 - 4 -33.3% 6 391,100 192 33 24 20.0% 18 357,900 365,000 204 13.2% - - 3 128,500 - -
66 yacolt 37 15 2 9 200.0% 4 280,400 63 52 32 28.0% 25 242,500 217,500 129 -1.9% - - 1 100,000 - -
70 La Center 24 14 2 7 -36.4% 6 317,000 49 46 34 -20.9% 28 287,100 276,000 116 15.7% - - 1 115,000 1 440,000
71 N Central 16 8 3 2 100.0% 4 232,200 86 22 10 0.0% 9 250,100 225,000 139 7.0% - - 2 93,100 - -
72 NE Corner 6 3 1 2 -33.3% 2 199,800 8 15 8 -11.1% 6 212,600 189,000 43 -7.8% - - - - - -
Grand Total 2,329 1,115 211 747 0.9% 600 263,100 98 4,170 3,031 2.6% 2,413 261,700 233,500 108 9.4% 9 583,800 126 259,700 48 255,100
80 Woodland City 34 10 4 12 71.4% 7 159,700 107 67 50 66.7% 37 193,300 175,000 77 26.4% 2 90,000 4 112,100 - -
81 Woodland Area 40 9 - 6 -25.0% 4 285,100 269 41 22 4.8% 16 281,100 259,300 204 20.5% - - 14 144,000 - -
82 Cowlitz County 259 86 14 48 14.3% 35 164,500 79 333 226 24.2% 183 160,400 149,900 114 6.4% 2 370,500 10 192,000 8 203,600
Grand Total 333 105 18 66 15.8% 46 174,300 100 441 298 27.9% 236 173,700 158,000 114 11.5% 4 230,300 28 156,600 8 203,600
87 Pacific County 165 30 7 12 50.0% 13 178,900 108 124 53 10.4% 48 142,700 129,500 195 16.9% 3 89,000 22 32,700 1 185,000
RESIDENTIAL
Current Month year-To-Date
LAND MuLTIFAMILy
year-To-Date year-To-Dateyear-To-Date
CoMMERCIAL

3© Copyright RMLS™ 2014. All Rights Reserved.
ACTIVE RESIDENTIAL
LISTINGSCLARk CouNTy, WA
This graph shows
the active residential
listings over the past
three calendar years
in Clark County,
Washington.JAN FEB MAR APR MAY JUN JUL AUG SEP OCT NOV DEC
2012 2,615 2,532 2,641 2,679 2,710 2,601 2,628 2,533 2,402 2,292 2,212 1,9962013 2,052 2,048 2,033 2,131 2,192 2,328 2,416 2,460 2,522 2,436 2,334 2,1272014 2,177 2,060 2,098 2,117 2,329
1,500
1,700
1,900
2,100
2,300
2,500
2,700
2,900
Active Residential Listings
NEW LISTINGS CLARk CouNTy, WAThis graph shows the
new residential listings
over the past three
calendar years in Clark
County, Washington.
0
200
400
600
800
1,000
1,200
New Listings
2012 2013 2014
1 Percent change in number of pending sales this year compared to last year. The Current Month section compares May 2014 with May 2013. The Year-To-Date section compares 2014 year-to-date statistics through May with 2013 year-to-date statistics through May.
2 % Change is based on a comparison of the rolling average sale price for the last 12 months (6/1/13-5/31/14) with 12 months before (6/1/12-5/31/13).3 Total Market Time is the number of days from when a property is listed to when an offer is accepted on that same property. If a property is re-listed within
31 days, Total Market Time continues to accrue; however, it does not include the time that it was off the market.

© Copyright RMLS™ 2014. All Rights Reserved.4
This graph represents
monthly accepted
offers in Clark County,
Washington over the past
three calendar years.
PENDING LISTINGS CLARk CouNTy, WA
This graph shows the
closed sales over the past
five calendar years in Clark
County, Washington.
CLoSED SALES CLARk CouNTy, WA
This graph shows the
average market time for
sales in Clark County,
Washington, over the past
three calendar years.
DAyS oN MARkET CLARk CouNTy, WA
200
300
400
500
600
700
800
Pending Sales
2012 2013 2014
0
100
200
300
400
500
600
700
Closed Sales
2010
2011
2012
2013
2014
020406080
100120140160180
Average Total Market Time
2012 TMT 2013 TMT 2014 TMT

© Copyright RMLS™ 2014. All Rights Reserved.5
This graph represents the average and median sale price for all homes sold in
Clark County, WashingtonSALE PRICE
CLARk CouNTy, WA
$150,000
$170,000
$190,000
$210,000
$230,000
$250,000
$270,000
$290,000
$310,000
$330,000
May
-04
Nov
-04
May
-05
Nov
-05
May
-06
Nov
-06
May
-07
Nov
-07
May
-08
Nov
-08
May
-09
Nov
-09
May
-10
Nov
-10
May
-11
Nov
-11
May
-12
Nov
-12
May
-13
Nov
-13
May
-14
Average and Median Sale Price
Average Sale Price Median Sale Price
This graph represents new
listings in Cowlitz County,
Washington over the past
three calendar years.
NEW LISTINGS CoWLITz CouNTy, WA
0
20
40
60
80
100
120
New Listings
2012 2013 2014

© Copyright RMLS™ 2014. All Rights Reserved.6
This graph represents monthly
accepted offers over the past
three calendar years in Cowlitz
County, Washington.
PENDING LISTINGS CoWLITz CouNTy, WA
This graph shows the closed
sales over the past five
calendar years in Cowlitz
County, Washington.
CLoSED SALES CoWLITz CouNTy, WA
01020304050607080
Pending Sales
2012 2013 2014
0
10
20
30
40
50
60
70
JAN FEB MAR APR MAY JUN JUL AUG SEP OCT NOV DEC
Closed Sales
2010
2011
2012
2013
2014
$100,000
$120,000
$140,000
$160,000
$180,000
$200,000
$220,000
$240,000
$260,000
Feb-
09
May
-09
Aug
-09
Nov
-09
Feb-
10
May
-10
Aug
-10
Nov
-10
Feb-
11
May
-11
Aug
-11
Nov
-11
Feb-
12
May
-12
Aug
-12
Nov
-12
Feb-
13
May
-13
Aug
-13
Nov
-13
Feb-
14
May
-14
Average Sale Price AVERAGE SALE PRICE
CoWLITz CouNTy, WAThis graph represents the
monthly average sale price
for all homes sold in Cowlitz
County, Washington.

$ 224,900
Yamhill County
$ 289,800N Portland
$ 329,500 NEPortland
$ 269,600 SEPortland
$ 229,900GreshamTroutdale
SandyCorbettFairview $ 244,900
Mt. Hood:Zigzag
WelchesRhododendron
WemmeBrightwood
Government Camp
$ 285,000Milwaukie/Gladstone/Boring/ClackamasEstacada
$ 275,000Oregon City
CanbyMolalla
Beavercreek
$ 472,500 Lake Oswego
West Linn
$ 380,000 West Portland
$ 375,000North Washington County
Sauvie Island
$ 263,000Beaverton
Aloha
$ 310,400 Tigard/Tualatin
SherwoodWilsonville
$ 235,000Hillsboro
Forest Grove
$ 210,200Columbia County
$219,000 Heights
$169,900Cent. Vancouver
$216,000Cascade Park
$211,7005 Corners
Orch.
$207,500HazelDell
Minnehaha
$255,000Felida
$282,000Salmon Creek
$298,700Camas/Washougal
$355,600
Brush Prairie
Hockinson
$303,700
Ridge�eld/La Center
$253,500
Battle Ground
$205,000
N/NE Clark County$241,900
Woodland
MEDIAN SALE PRICE May 2014
PoRTLANDMETRo
© Copyright RMLS™ 2014. All Rights Reserved.
SW WAShINGToN
MULTIPLE LISTING SERVICE
The statistics presented in Market Action are compiled monthly based on figures generated by RMLS™.
Market Action Reports are compiled for the following areas: Portland metropolitan area, Southwest Washington, Mid-Columbia, Columbia Basin, Baker County, Coos County, Curry County, Douglas County, Grant County, Lane County, North Coastal Counties, Polk & Marion Counties, Union County, and Wallowa County.
RMLS™ was formed by area Boards and Associations of REALTORS® in 1991.
E-mail subscriptions are available for $45 per year by contacting RMLS™, (503) 236-7657. Reproduction of any portion of this copyrighted material is prohibited without prior approval of RMLS™.
Brian Houston, Chairman of the BoardKurt von Wasmuth, President/CEOHeather Andrews, Editor
Lane County: FlorencePO Box 414
Florence, OR 97439(541) 902-2560
Fax: (541) 902-1341
Curry County16289 Hwy 101 S, Suite E
Brookings, OR 97415(541) 469-0219
Fax: (541) 469-9695
Lane County: Eugene2139 Centennial Plaza
Eugene, OR 97401(541) 686-2885
Fax: (541) 484-3854
Southwest Washington1514 Broadway, Suite 101
Vancouver, WA 98663(360) 696-0718
Fax: (360) 696-9342
Douglas County3510 NE EdenbowerRoseburg, OR 97470
(541) 673-3571Fax: (541) 673-6581
Corporate8338 NE Alderwood Rd, Suite 230
Portland, OR 97220(503) 236-7657
Fax: (503) 230-0689
Mid-ColumbiaPO Box 1088
Hood River, OR 97031(541) 436-2956
Fax: (541) 387-6657
Eastern OregonPO Box 751
Hermiston, OR 97838(541) 567-5186
Fax: (541) 289-7320
Coos County1946 Sherman Ave., Suite 101
North Bend, OR 97459(541) 751-1070
Fax: (541) 751-1083
Salem4035 12th Street Cutoff SE, Suite 110
Salem, OR 97302(503) 587-8810
Fax: (503) 585-3817