maritime industry study - durban · durban maritime industry a value-chain analysis ... 4.1 the...
TRANSCRIPT
DURBAN MARITIME INDUSTRY
A VALUE-CHAIN ANALYSIS
Prepared By:
Jon van CollerVANCOMETRICS
Prof. Gavin MaasdorpIMANI DEVELOPMENT
Khulile MavundlaFUTUREWORKS!
1

TABLE OF CONTENTS
1. INTRODUCTION................................................................................................................................ 5
1.1 Durban Port in the South African Context ....................................................................................... 5
1.2 The intentions of this study.............................................................................................................. 5
2. TERMS OF REFERENCE.................................................................................................................. 6
3. METHODOLOGY................................................................................................................................6
3.1 Scoping ............................................................................................................................................ 6
3.2 The Value Chain approach............................................................................................................. 8
3.3 Participative Value Chain..............................................................................................................10
4. DURBAN’S MARITIME INDUSTRY..................................................................................................10
4.1 THE PORT AND ITS SERVICES................................................................................................... 10
4.1.1 National Port Authority (NPA)...................................................................................................... 10
4.1.2. SA Port Operations and Cargo Terminals.................................................................................. 11
4.1.3 Terminal Status – Key Contributing Factors................................................................................12
4.2 THE SHIPPING SECTOR.............................................................................................................. 14
4.2.1 Shipping Movements .................................................................................................................. 14
4.2.2 Pattern Changes..........................................................................................................................15
4.2.3 Local Companies and Representation.........................................................................................15
4.2.4 Support Facilities......................................................................................................................... 16
4.3 THE CARGO / LOGISTICS SECTOR........................................................................................... 17
4.3.1 Cargo Movements and Pattern Changes................................................................................... 17
4.3.2. Terminal Interfaces..................................................................................................................... 20
4.3.3 Structure and State of the Cargo / Logistics Industry.................................................................22
5. ANALYSIS OF SHIPPING AND CARGO/LOGISTICS VALUE CHAINS......................................... 23
5.1 General Overview.......................................................................................................................... 23
5.2 Shipping Sector Interview Responses........................................................................................... 23
5.2.1 Shipping Sector V-C Primary Activities .......................................................................................24
5.2.2 Shipping Sector V_C Support Activities......................................................................................24
5.3 Cargo / Logistics Sector Interview Responses........................................................................... 26
5.3.1 Cargo/Logistics Sector V-C Primary Activities.............................................................................27
5.3.1.1 Inbound Logistics.....................................................................................................................27
5.3.1.3 Out-bound logistics................................................................................................................. 28
5.3.2 Cargo/Logistics Sector V-C Support Activities............................................................................ 30
5.3.2.1 Infrastructure ...........................................................................................................................30
6.0 ANALYSIS OF SMME OPPORTUNITIES...................................................................................... 35
6.1 SMME Opportunities in the Shipping Sector................................................................................. 35
6.2 SMME Opportunities in the Cargo/Logistics Sector...................................................................... 35
7.0 ASSESSMENT OF THE PORT AND MARITIME SECTORS........................................................ 36
2

7.1 Efficiency Indicators........................................................................................................................36
7.2 SWOTS Analysis of Shipping and Cargo/Logistics Sectors...........................................................42
7.2.1 Shipping Sector SWOTS............................................................................................................ 42
7.2.2 Cargo/Logistics Sector SWOTS................................................................................................ 42
7.3 Port Layout and Capacity............................................................................................................... 43
7.4 Other Strategic Issues.................................................................................................................... 44
7.4.3 Cargo Growth Projections..........................................................................................................44
7.5 Porter’s Diamond............................................................................................................................ 47
8. MUNICIPAL INTERVENTION OPPORTUNITIES............................................................................ 48
8.1 Urgently Required........................................................................................................................... 48
8.2 Further Opportunities......................................................................................................................50
8.3 Stakeholder Co-operation.............................................................................................................53
8.4 A Maritime Institute – will it add value ?........................................................................................54
8.5 Urban Upgrading and Planning..................................................................................................... 54
8.5.8 Point Waterfront.........................................................................................................................56
9. FUTURE OF THE PORT.................................................................................................................. 56
9.1 City Growth and Gateway Status..................................................................................................56
9.2 Role of the Port in South Africa’s Economy..................................................................................57
9.3 Co-operation and Communication Structures.............................................................................. 57
9.4 Port Planning and Capacity Expansion........................................................................................ 58
10. CONTRIBUTION TO THE ETHEKWINI ECONOMY..................................................................... 59
10.1 Shipping Sector.............................................................................................................................59
10.2 Cargo Sector Contribution .......................................................................................................... 61
11 SUMMARY AND CONCLUSION..................................................................................................... 62
TABLE OF FIGURES
Table 1. Cargo Handled and Vessel Arrivals, SA Ports (Jan-Dec 2006).............................................. 5
Table 2. Location of Shipping and Cargo / Logistics Firms within the EMA......................................... 7
Table 3. South Durban Basin – Maritime Firms ...................................................................................8
Diagram 1. Porter’s Value Chain......................................................................................................... 9
Table 4. Interview sample.................................................................................................................... 10
Diagram 2. The Port of Durban with Cargo Terminals....................................................................... 11
Table 5 VESSEL ARRIVALS – Durban Port (Fin. Yr. 2005/06)......................................................... 14
Table 6. Change Pattern of Shipping Arrivals — Durban Port (2003 to 2006)...................................15
Table 7. Average Gross Tonnage per vessel..................................................................................... 15
Diagram 3 Container TEUs Handled (1997 – 2007*)........................................................................ 17
Diagram 4. Empty TEUs Handled.......................................................................................................17
Table 8. Total Container TEUs handled (Imported and Shipped)....................................................... 18
Table 9. Break & Breakbulk Cargo handled through Durban Port ..................................................... 18
3

Table 10. Bulk Imports and Exports.................................................................................................... 19
Table 11. Breakbulk Imports and Exports........................................................................................... 19
Table 12. Cargo Movements – 2005/6 compared to 1996/7............................................................... 20
Diagram 5. Shipping Value-Chain Linkages........................................................................................ 24
Table 13. Shipping Sector Employment Estimate............................................................................... 25
Table 14. Port Terminals User Activity................................................................................................ 27
Table 15. Cargo Sector Activity Spread...............................................................................................28
Table 16. Transport and Logistics sub-sector spread......................................................................... 28
Table 17. Warehousing sub-sector spread......................................................................................... 28
Table 18. Areas of Operational Competitiveness ............................................................................... 28
Table 19. Cato Ridge as a Distribution Centre – views of the Cargo Sector.......................................29
Table 20. Types of building required to operate satisfactorily............................................................. 30
Table 21. Space availability................................................................................................................. 30
Table 22. Satisfaction with present location (5 = very satisfied, 1 = very dissatisfied)........................30
Table 23. Skills Requirements .......................................................................................................... 31
Table 24. Training and Development Sources.................................................................................... 33
Table 25. SMME Opportunities............................................................................................................35
Table 26. Container-handling Rates at Various Ports........................................................................ 37
Table 27. Three growth scenarios – Bulk & Breakbulk ..................................................................... 45
Table 28. Annual % Change – 4 year moving average....................................................................... 45
Diagram 6. Alternate Projections of Full TEUs handled...................................................................... 46
Diagram 7. Porter’s Diamond ........................................................................................................... 47
Table 29. Durban Maritime Industry Competitive Attributes (Porter’s Diamond Format).................... 48
Table 30. Rating of Utility Services (Scale: 5 = Very good, 1 = Very poor)........................................50
Table 31 Utility Importance Ranking (1 = Most important, 9 = Least important)................................. 51
ANNEXURE A – SHIPPING FLOWCHART......................................................................................... 64
ANNEXURE B – CARGO FLOWCHART ............................................................................................ 65
ANNEXURE C - KEY COMPONENTS OF THE MARITIME SECTOR VALUE-CHAIN......................65
4
MARITIME INDUSTRY VALUE-CHAIN ANALYSIS
1. INTRODUCTION
1.1 Durban Port in the South African Context
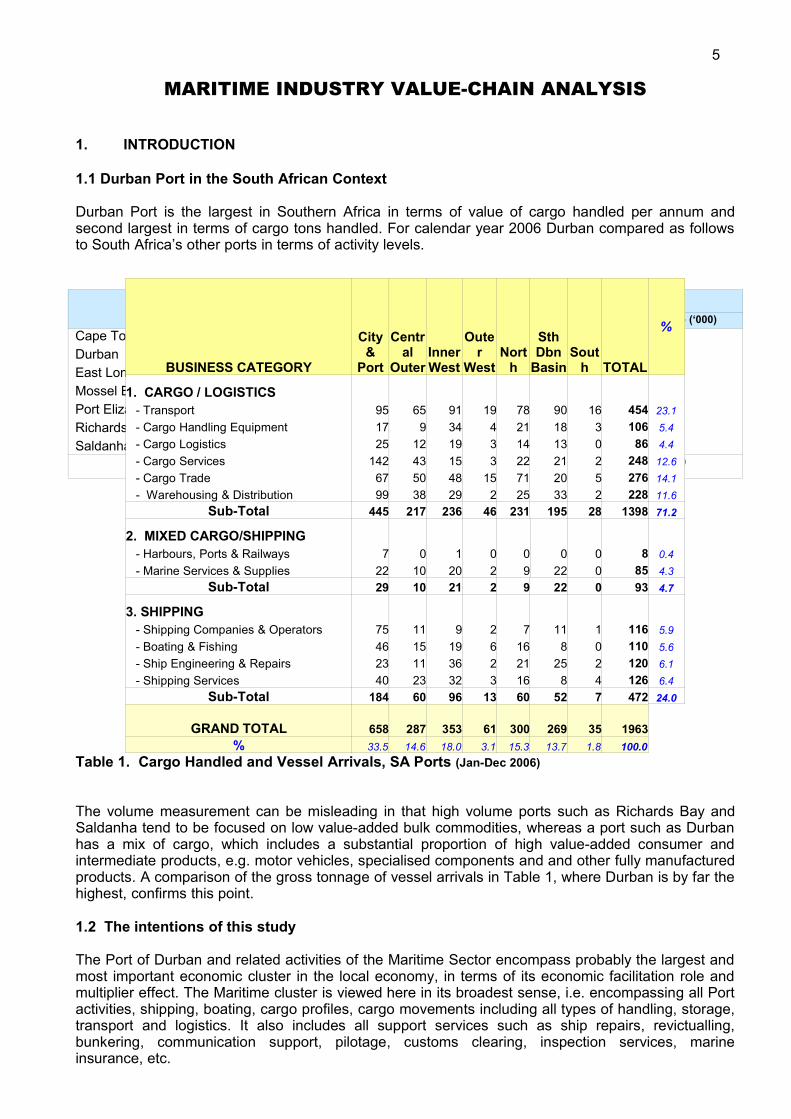
Durban Port is the largest in Southern Africa in terms of value of cargo handled per annum andsecond largest in terms of cargo tons handled. For calendar year 2006 Durban compared as followsto South Africa’s other ports in terms of activity levels.
Table 1. Cargo Handled and Vessel Arrivals, SA Ports (Jan-Dec 2006)
The volume measurement can be misleading in that high volume ports such as Richards Bay andSaldanha tend to be focused on low value-added bulk commodities, whereas a port such as Durbanhas a mix of cargo, which includes a substantial proportion of high value-added consumer andintermediate products, e.g. motor vehicles, specialised components and and other fully manufacturedproducts. A comparison of the gross tonnage of vessel arrivals in Table 1, where Durban is by far thehighest, confirms this point.
1.2 The intentions of this study
The Port of Durban and related activities of the Maritime Sector encompass probably the largest andmost important economic cluster in the local economy, in terms of its economic facilitation role andmultiplier effect. The Maritime cluster is viewed here in its broadest sense, i.e. encompassing all Portactivities, shipping, boating, cargo profiles, cargo movements including all types of handling, storage,transport and logistics. It also includes all support services such as ship repairs, revictualling,bunkering, communication support, pilotage, customs clearing, inspection services, marineinsurance, etc.
Port Cargo Handled Vessel Arrivals(‘000 M. Tons) % No. Gross Tonnage (‘000)
Cape TownDurbanEast LondonMossel BayPort ElizabethRichards BaySaldanha
4,13543,8611,5061,5194,871
86,31937,773
2.324.4 0.8 0.8 2.748.021.0
40444566 332254816341575 492
47,62596,660 8,154 2,88727,44657,08024,206
Total 179,984 100.0 14191 264,059
BUSINESS CATEGORY
City&
Port
Central
OuterInnerWest
Outer
WestNort
h
SthDbn
BasinSout
h TOTAL
%
1. CARGO / LOGISTICS - Transport 95 65 91 19 78 90 16 454 23.1 - Cargo Handling Equipment 17 9 34 4 21 18 3 106 5.4 - Cargo Logistics 25 12 19 3 14 13 0 86 4.4 - Cargo Services 142 43 15 3 22 21 2 248 12.6 - Cargo Trade 67 50 48 15 71 20 5 276 14.1 - Warehousing & Distribution 99 38 29 2 25 33 2 228 11.6
Sub-Total 445 217 236 46 231 195 28 1398 71.2
2. MIXED CARGO/SHIPPING - Harbours, Ports & Railways 7 0 1 0 0 0 0 8 0.4 - Marine Services & Supplies 22 10 20 2 9 22 0 85 4.3
Sub-Total 29 10 21 2 9 22 0 93 4.7
3. SHIPPING - Shipping Companies & Operators 75 11 9 2 7 11 1 116 5.9 - Boating & Fishing 46 15 19 6 16 8 0 110 5.6 - Ship Engineering & Repairs 23 11 36 2 21 25 2 120 6.1 - Shipping Services 40 23 32 3 16 8 4 126 6.4
Sub-Total 184 60 96 13 60 52 7 472 24.0
GRAND TOTAL 658 287 353 61 300 269 35 1963% 33.5 14.6 18.0 3.1 15.3 13.7 1.8 100.0
5

This study addresses a number of key aspects of the industry and its role in the eThekwini economy.It also aims to provide the City authorities with a better understanding of the workings of the sectorand its many linkages into the workings of the port and to inform them where to focus their supportrole. In this respect it identifies specific interventions that would enable the City to fulfil its roleeffectively. The study describes the industry and all its inter-linkages comprehensively and wherepossible, provides pointers towards an assessment of economic multiplier effects derived frommarine activity throughout the local economy. In the terms-of-reference it was specified that theanalysis of the sector be formulated around the well-established economic analytical techniqueknown as Value-Chain-Analysis.
It was furthermore a requirement that opportunities for SMMEs and where they could best integrateinto the various supply and service chains, be identified. The report highlights areas of opportunity forsub-contracting and other outsourcing and partnership arrangements, especially in the cargohandling and transport sub-sectors.
2. TERMS OF REFERENCE
The following issues should be covered by the research and analysed with the above objectives inmind.
Identify the key components of the Maritime Sector and describe their inter-relationshipsand linkage patterns. (See Sections 3.2, 3.3, 4.1, 4.2, 4.3, 0
Separate the primary activities from the support activities and illustrate the position of eachin the overall industry value-chain. (See Sections 5.2 and 5.3)
Analyse the value-chains of each of the sub-sectors to assess their inherent strengths andweaknesses. Ascertain the level of co-operation amongst the sub-sectors and the degreeto which it contributes to the overall competitiveness of the Port and Back-of-Port activitiesin terms of business efficiency. Identify areas where greater co-operation will furtherenhance the efficiency of the industry value-chains, with a view to improving overallcompetitive advantage. In particular the flows of information, goods and services should beassessed as well as systems for adjusting activities. (See Chapter 5, and Sections 8.3, 9.3)
Assess the quality of the current infrastructure and technology from a user point of view inenabling all users to carry out their functions effectively, efficiently and competitively. (See Sections 4.3.2 and 5.2.2)
Identify bottlenecks in the process of delivering cargoes of all types into and out of the portprecinct, including the ability of the Port and the City to respond to the needs of both theshipping fraternity and the cargo-logistics fraternity. ( See Sections 5.2.1, 5.3.1, 7.1)
Assess the human resource component of the support activities and general satisfactionwith the availability of skills and other HR aspects, which may impact on the overalleffectiveness of the system. (See Sections 5.2.2.2, 5.3.2.2)
Assess the role of local government in the value-chain of the sector and identify areaswhere a greater role would be beneficial or where particular interventions would enhancethe competitive advantage of the system. (See Chapter 8)
Identify areas of opportunity for SMMEs and where their greater involvement wouldenhance the overall efficiency and cost structure, through effective outsourcing, sub-contracting or service support. (See Chapter 6 and Section 8.6)
3. METHODOLOGY
3.1 Scoping
The analysis of the sector has been based on the use of the latest Braby’s database of Business andInstitutional organisations whose classifications fall within the sub-sectors of the Maritime Industry asoutlined in the two industry structure charts (see Annexures A & B). The Brabys Maritime Databasehas been made available to the Consultants via the City’s Economic Development Unit (EDU). Thishas provided the consultants with a comprehensive list of the businesses concerned and formed thebasis of the interview programme. Interviewing was divided between the Shipping andCargo/Logistics sectors and each was managed separately. The two sectors were also sub-dividedinto primary and support activities.
6
Braby’s database:
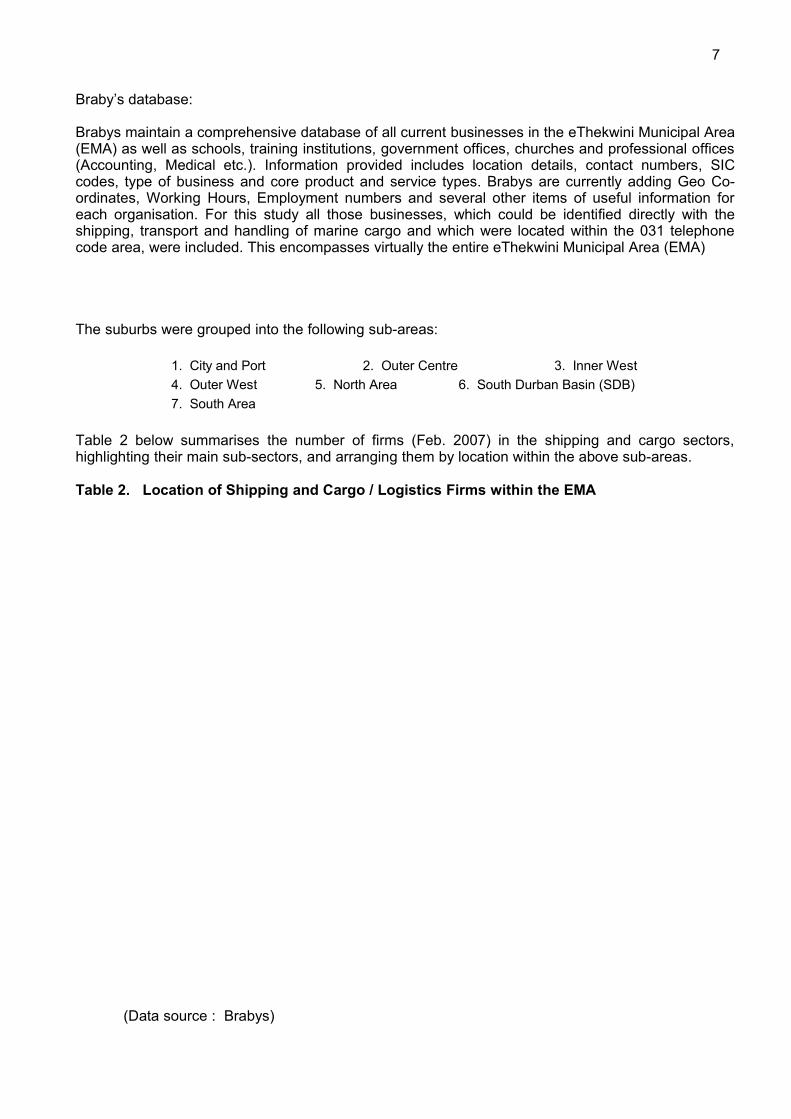
Brabys maintain a comprehensive database of all current businesses in the eThekwini Municipal Area(EMA) as well as schools, training institutions, government offices, churches and professional offices(Accounting, Medical etc.). Information provided includes location details, contact numbers, SICcodes, type of business and core product and service types. Brabys are currently adding Geo Co-ordinates, Working Hours, Employment numbers and several other items of useful information foreach organisation. For this study all those businesses, which could be identified directly with theshipping, transport and handling of marine cargo and which were located within the 031 telephonecode area, were included. This encompasses virtually the entire eThekwini Municipal Area (EMA)
The suburbs were grouped into the following sub-areas:
1. City and Port 2. Outer Centre 3. Inner West4. Outer West 5. North Area 6. South Durban Basin (SDB)7. South Area
Table 2 below summarises the number of firms (Feb. 2007) in the shipping and cargo sectors,highlighting their main sub-sectors, and arranging them by location within the above sub-areas.
Table 2. Location of Shipping and Cargo / Logistics Firms within the EMA
(Data source : Brabys)
7

Approximately one-third of Maritime related companies are located in the City and Port sub-area. Ifthe Outer Centre is added, the percentage moves up to 48%. Other closely related areas, each with asignificant number of firms, are the SDB and the Inner West. These two together bring thepercentage up to approximately 80%. The North area also has a significant number of such firms(15.3%), but the fact that they are widely spread throughout the sub-area with little sign of clusteringindicates that many of them are probably concerned more with local movement and warehousing ofgoods, with minimal linkages to the port. The same argument probably applies to some firms in theInner West, but to a lesser extent, i.e. their location in relation to the port is more favourable thanmost of those in the North and clustering is very strongly developed.
The Inner West suburbs of Pinetown/New Germany/ Westmead/Mahogany Ridge make up 60% ofthe sub-area’s Cargo/Logistics/Shipping firms. Altogether there are approximately 40 suburbs withinthe Inner West, which have such firms in their areas, but 60% of the firms are clustered in only four ofthem.
The SDB by virtue of its large manufacturing concentration, e.g. Automotive, Chemicals, Food,Beverages, etc., has very strong inward and outward logistics linkages to the port, and it is thereforeto be expected that the maritime logistics industry is well established in the area. The SDB forms anatural base for the growth of back-of-port logistics structures and this is clearly evident from theclusters of such firms already to be found in the Clairwood, Jacobs, Mobeni and Prospectontownships. Current numbers for these townships are as follows:
Table 3. South Durban Basin – Maritime Firms
Sub-Area Cargo Shipping Mixed Total
ClairwoodJacobsMobeniProspecton
37521629
125 2 4
111 1 7
39881940
Total 134 32 20 186
% of SDB = 69%
3.2 The Value Chain approach
Sub-Sector Firms Interviews
Line Functions:
Cargo Handling & Container ServicesCartage ContractorsCustoms Clearing & ForwardingExport & Import ServicesFreight Services & WarehousingStevedoresStorage & WarehousingTanker ServicesTransportation CompaniesWarehousing & Logistics
2154
14177865
324
1145
6687934183
Sub-Total 539 55
Service Functions:
Commercial & Industrial RefrigerationHarbours, Ports & RailwaysMarine Insurance AssessorsSecurity & Surveillance Consultants
5713
1311
Sub-Total 15 6TOTAL 554 61
8

Prof. Michael Porter of Harvard University first introduced the term Value Chain in his book“Competitive Advantage: Creating and Sustaining Superior Performance” published in 1985. Thesystem describes a firm and its activities and how it combines these activities to achieve acompetitive advantage over its competitors. Operating systems and the processing of goods or thedelivery of services are not mixed together in a random manner, but are arranged with the specificobjective of offering the customer something unique or special. The market generally determines theprice a customer is willing to pay, and the extent of differentiation of one firm’s offering compared toits competitors determines the extent of any price premium it is able to achieve. The efficiency withwhich it procures its supplies and converts these into product determines the extent of its profitmargin. Some aspects of its cost structure are determined outside its area of influence, e.g. utilityservices.
According to Porter in his book The Competitive Advantage of Nations, “Firms gain competitiveadvantage from conceiving of new ways to conduct activities, employing new procedures, newtechnologies, or different inputs.” “ A firm is more than the sum of its activities. A firm’s value-chain isan independent system or network of activities, connected by linkages. Linkages occur when the wayin which one activity is performed affects the cost or effectiveness of other activities. “ “Linkages alsorequire activities to be co-ordinated. On-time delivery requires that operations, outbound logistics,and service activities such as installation, should function smoothly together.”
Porter also distinguishes between primary and support activities (ref. Dagmar Recklies, 2001).Primary activities are directly concerned with creation or delivery of goods or services and can begrouped into five main areas, viz. inbound logistics, operations, outbound logistics, marketing andsales, and service. There are four main areas of support activities, viz. Procurement, technologydevelopment, human resource management, and infrastructure.
The basic model of Porter’s Value Chain is as follows:
Diagram 1. Porter’s Value Chain
Source: Dagmar Recklies, 2001
The word “MARGIN” means theprofit margin, which the firm is
able to realise by its management of all the linkages between all the activities of the value chain.
Infrastructure
Human Resource Development
Technology Development
ProcurementInboundLogistic
s
Operations
Outbound
Logistics
Marketing &Sales
Service
9
MARGIN
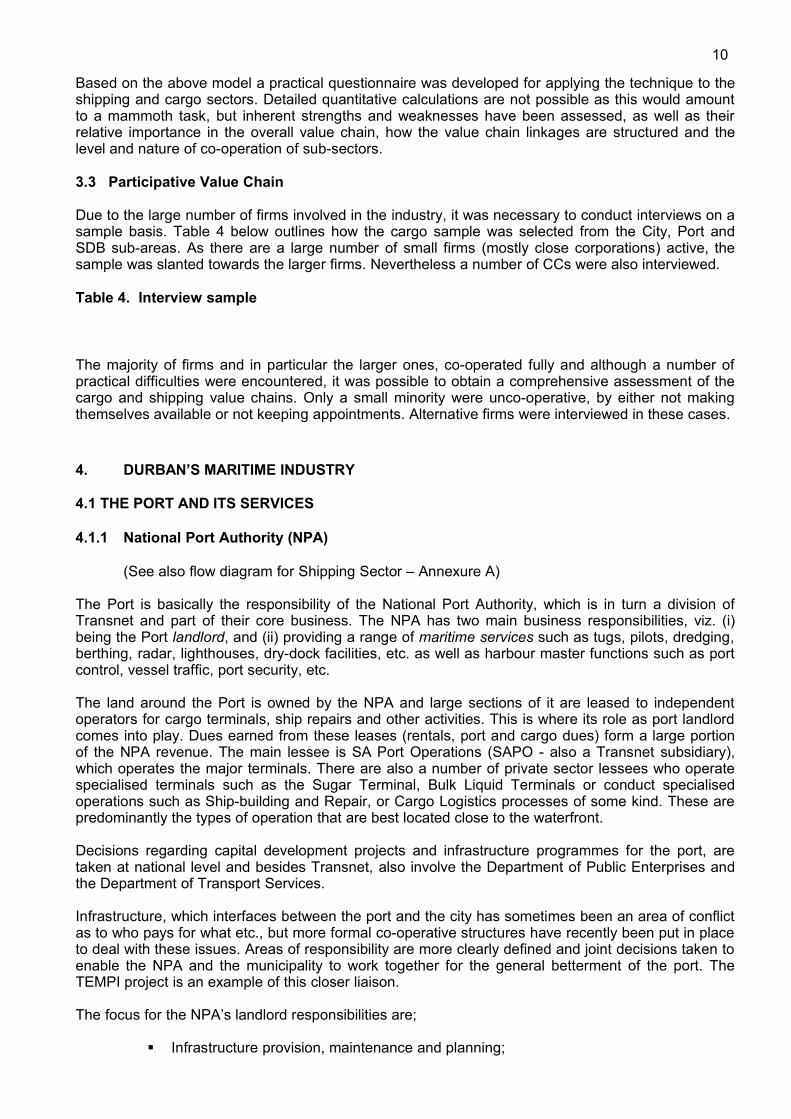
Based on the above model a practical questionnaire was developed for applying the technique to theshipping and cargo sectors. Detailed quantitative calculations are not possible as this would amountto a mammoth task, but inherent strengths and weaknesses have been assessed, as well as theirrelative importance in the overall value chain, how the value chain linkages are structured and thelevel and nature of co-operation of sub-sectors.
3.3 Participative Value Chain
Due to the large number of firms involved in the industry, it was necessary to conduct interviews on asample basis. Table 4 below outlines how the cargo sample was selected from the City, Port andSDB sub-areas. As there are a large number of small firms (mostly close corporations) active, thesample was slanted towards the larger firms. Nevertheless a number of CCs were also interviewed.
Table 4. Interview sample
The majority of firms and in particular the larger ones, co-operated fully and although a number ofpractical difficulties were encountered, it was possible to obtain a comprehensive assessment of thecargo and shipping value chains. Only a small minority were unco-operative, by either not makingthemselves available or not keeping appointments. Alternative firms were interviewed in these cases.
4. DURBAN’S MARITIME INDUSTRY
4.1 THE PORT AND ITS SERVICES
4.1.1 National Port Authority (NPA)
(See also flow diagram for Shipping Sector – Annexure A)
The Port is basically the responsibility of the National Port Authority, which is in turn a division ofTransnet and part of their core business. The NPA has two main business responsibilities, viz. (i)being the Port landlord, and (ii) providing a range of maritime services such as tugs, pilots, dredging,berthing, radar, lighthouses, dry-dock facilities, etc. as well as harbour master functions such as portcontrol, vessel traffic, port security, etc.
The land around the Port is owned by the NPA and large sections of it are leased to independentoperators for cargo terminals, ship repairs and other activities. This is where its role as port landlordcomes into play. Dues earned from these leases (rentals, port and cargo dues) form a large portionof the NPA revenue. The main lessee is SA Port Operations (SAPO - also a Transnet subsidiary),which operates the major terminals. There are also a number of private sector lessees who operatespecialised terminals such as the Sugar Terminal, Bulk Liquid Terminals or conduct specialisedoperations such as Ship-building and Repair, or Cargo Logistics processes of some kind. These arepredominantly the types of operation that are best located close to the waterfront.
Decisions regarding capital development projects and infrastructure programmes for the port, aretaken at national level and besides Transnet, also involve the Department of Public Enterprises andthe Department of Transport Services.
Infrastructure, which interfaces between the port and the city has sometimes been an area of conflictas to who pays for what etc., but more formal co-operative structures have recently been put in placeto deal with these issues. Areas of responsibility are more clearly defined and joint decisions taken toenable the NPA and the municipality to work together for the general betterment of the port. TheTEMPI project is an example of this closer liaison.
The focus for the NPA’s landlord responsibilities are;
Infrastructure provision, maintenance and planning;
10
Preparing and regularly updating the port development framework plan; Managing land-use including lease negotiations and administration within the port
precinct. (Source NPA)
4.1.2. SA Port Operations and Cargo Terminals
(See also flow diagram of Cargo/Logistics Sector – Annexure B)
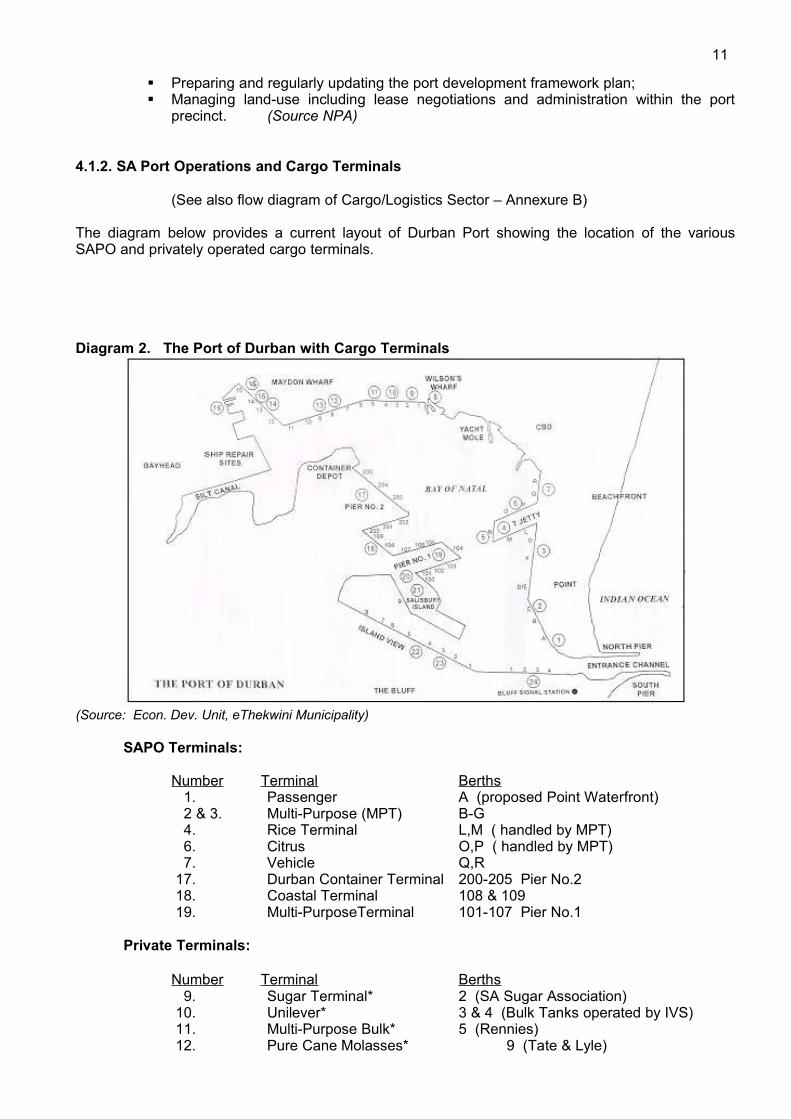
The diagram below provides a current layout of Durban Port showing the location of the variousSAPO and privately operated cargo terminals.
Diagram 2. The Port of Durban with Cargo Terminals
(Source: Econ. Dev. Unit, eThekwini Municipality)
SAPO Terminals:
Number Terminal Berths 1. Passenger A (proposed Point Waterfront) 2 & 3. Multi-Purpose (MPT) B-G
4. Rice Terminal L,M ( handled by MPT) 6. Citrus O,P ( handled by MPT) 7. Vehicle Q,R 17. Durban Container Terminal 200-205 Pier No.2 18. Coastal Terminal 108 & 109 19. Multi-PurposeTerminal 101-107 Pier No.1
Private Terminals:
Number Terminal Berths 9. Sugar Terminal* 2 (SA Sugar Association) 10. Unilever* 3 & 4 (Bulk Tanks operated by IVS) 11. Multi-Purpose Bulk* 5 (Rennies) 12. Pure Cane Molasses* 9 (Tate & Lyle)
11
13. Agriport Grain Terminal* Specialist Facility 14. Forest Products* 13 & 15 (Bidvest & Grindrod) 15. Bulk Soda Ash* 14 (Brunner Mond) 20. Bulk Malt 100 (SA Breweries) 22. Bulk Liquids** 4 & 5 (IVS & van Ommeren bulk liquids) 23. Bulk Handling Terminal** 3 (Durban Bulk Shipping) 24. Coal Terminal** 1-4 (Rennies for Bulk Connections)
* Maydon Wharf ** Island View
Other Port Facilities:Number Facility Berths 8. Wilson’s Wharf Entertainment & Shopping — Yacht Mole East of Wilson’s Wharf 16. Graving Dock Prince Edward Graving Dock & Ship Repair 21. Salisbury Island SA Navy — Ship Repair Sites West Embankment of Silt Canal
4.1.3 Terminal Status – Key Contributing Factors
As a company might offer a range of different products or services, so Durban Port offers Importers,Exporters and the Shipping Companies a range of different terminals, each structured to handle aparticular form or type of cargo. As to be expected, the mix of cargo volumes through these differentterminals is forever changing in line with the dynamics of international trade. Over the last decade orso Durban Port has found its capacity to handle several of its traditional cargo types comingincreasingly under pressure.
These pressures have been brought about by several factors. Domestically it has been largely due tothe constitutional change to a full democracy, which has seen the lifting of international sanctions, thelowering of import tariffs, a steadily increasing domestic economic growth rate, a significant increase
in the establishment of small businesses and substantial growth in consumer spending power.
Vessel Type 2003 2006No. % No. %
% Change2003 to 2006
Ocean Going:- General Cargo- Bulk, Dry- Bulk, Liquid- Container Vessels- Tankers- Passenger- Vehicle Carriers- Ro-Ro Vessels- Other (Livestock, etc.)
723692 81839534 44142129844
16.515.8 1.919.212.2 1.0 3.2 3.019.3
81169411
1551635612886842
17.815.2 0.234.013.9 1.3 6.3 1.5 0.9
+ 12.2+ 0.3- 86.4+ 84.9+ 18.9+ 38.6+102.8- 47.3- 95.0
Total Ocean Going 4028 92.2 4161 91.1 + 3.3Coastwise:- Coasters (Gen. Cargo)- Foreign Fishing- SA Trawlers- Miscellaneous
93149 28 72
2.1 3.4 0.6 1.6
1081745370
2.4 3.8 1.2 1.5
+ 16.1+ 16.7+ 89.2- 2.8
Total Coastwise 342 7.8 405 8.9 + 18.4
TOTAL 4370 100.0 4566 100.0 + 4.5
12

Internationally it has been a combination of changing market circumstances and changing cargologistics technology. Globalisation of trade and the greater participation of China, which has theworld’s largest population, and other developing countries, is the main causal factor for theacceleration in cargo volumes. As a result of this, competition between shipping as well as logisticscompanies has intensified and such factors as transport and logistics costs, speed and reliability ofdelivery, communications, ease of documentation and customs formalities, etc. have become allimportant.
The first major technical change in cargo logistics was the introduction of containers. As everyoneknows, this has revolutionised cargo handling methods and costs. Because of the rapid escalation involumes and market demands for seamless processes for transporting goods between two points,shipping companies have been steadily increasing the size of their ships and have also beenextending their area of influence in the transportation pipeline to the land end of the logisticsprocesses. The net result has been that the large shipping companies have wrested most of theinitiative from the individual ports and are able to dictate the infrastructure and service needs in theports as well as the pricing levels of most of the processes in the chain.
Ships don’t like to make frequent stops, especially large ships, and it is not uncommon nowadays forone leg of cargo transportation to be completed overland between two ports so that the ship does nothave to make two port calls. This is particularly the case where the quantity for the second call issmallish. Shipping lines, which have business extensions into the land-based operations, aregenerally able to offer a seamless service between points of origin and destination.
There have also been changes to international shipping legislation, which now allows more freedomfor varied contractual arrangements to be established between carriers and shippers. This hasenabled carriers to obtain better market advantage for their own expertise coupled with that ofselected shippers. On the contra side however, the new legislation has weakened the traditionalconference system between shipping lines. This has had the effect desired by the legislators ofincreasing competition and lowering shipping prices.
With the introduction of much larger ships (Panamax and Post-Panamax), it is natural that it is morecost efficient if these can sail longest possible distances between stops. This has fuelled the so-called “Hub and Spoke” thinking where large ships sail between East and West, only calling at thelarger so-called Hub ports. From there smaller vessels carry out distribution to the smaller ports alongthe particular continental coastline. This has also opened the transhipment market, which appears tobe growing rapidly. Another important logistics factor is the returning of empty containers to their portof origin. By controlling more of the shipping/logistics pipeline, container owners are able torationalise empty container movements more efficiently.
There is therefore some motivation for well-located ports such as Durban to become hub ports for atleast part of their cargo trade. However to achieve this status requires some major redesign ofinfrastructure, hence the current project to widen the port entrance and to dredge both the entranceand much of the internal port area to greater depths.
The changeover to containers for cargo transportation has altered the whole nature of cargo logistics,which has impacted on all areas of the chain, particularly on cargo handling technology, warehousedesign, transport carrier design and spatial planning in and around cities and ports. So-called back-of-port operations are becoming more extensive and more complex. The need for open spaces forcontainer terminals and parks and dedicated logistics townships is testing the ingenuity of urbanplanners. In many cases around the world the larger shipping conglomerates have found itadvantageous to set up container terminals out of the cities. In all cases the objective is to achieveseamless logistics systems for moving cargo types between origin and destination.
Thus Durban Port, which has for the past century been Southern Africa’s major port and tradegateway, is suddenly facing a whole range of challenges, all of which require substantial funding tobe able to meet their specifications. The answers are not straight forward and best options areseldom clear-cut. As always, time is of the essence and there is little spare for decision making.
From the cargo aspect, the highest growth has been in container numbers, motor vehicles, bulk liquidchemicals and bulk petroleum products. The growth rates in these products have been spectacular
13

over the past decade, with a sharp escalation since 2002. Thus at present the port finds itself underextreme pressure, particularly from shipping carriers, to provide substantial additional terminalcapacity for each of these product areas. The shipping companies are also insisting on maintainingfacilities for bulk and breakbulk cargo types traditionally handled through the port, as theirorganisations are structured around these cargo types and a move away would have majorramifications.
Building an additional vehicle terminal is the most urgent as SAPO, in spite of having a vehicleterminal completed as recently as 1998 with capacity for 90,000 vehicles per annum, is currentlyfaced with more than double that number. As a result there are vehicles parked in every spare squaremetre of space in the port. Container volumes are up at over 2 million TEUs per annum which meansDurban is in world-size class, and growing at between 8 and 10 percent per annum.
The difficulties are not only in the port. These rapidly rising volumes and changes in technology areplacing pressures on the city infrastructure as well as the transport corridor inland to Gauteng andother parts of the hinterland.
4.2 THE SHIPPING SECTOR
4.2.1 Shipping Movements
Of the 7 South African Ports, Durban had the most vessel arrivals during the 2005/06 financial year(April-March). Altogether 4,551 vessels entered Durban harbour, which is 31,7% of the total arrivalsof 14,335. Of these approximately 90% were ocean-going and 10% were coastal, fishing andmiscellaneous. Table 5 below shows the details.
Container vessels (26.6%) were the highest number by type of vessel and constituted the most bygross tonnage (33.7%). If bulk and liquid bulk vessels are added together, they would have beenhighest in number (29.9%), as well as in terms of gross tonnage (36.3%). Coastal, Fishing andMiscellaneous (Naval, Yachts, Barges, Tugs, etc.) arrivals were small in number (9.9%) and verysmall in gross tonnage (2.4%). Only 64 passenger vessels docked throughout the entire year. Therewere 239 vehicle carriers, which is virtually two every three days. This figure will also growsubstantially over the next three years with the Toyota export programme.
Durban is clearly a port, which has to cater for a wide variety of cargo types and is by no meanspredominantly a container port, although this may be the fastest growing sector.
Table 5 VESSEL ARRIVALS – Durban Port (Fin. Yr. 2005/06)
* Container =
Cellular + Non-Cellular
VESSEL TYPETOTAL
No. %Gross
Tonnage(‘000)
%
Ocean Going:General CargoBulk Liquid BulkContainer*PassengerCar/Vehicle CarriersOther
1088 762 6031,214 64 239 132
23.916.713.226.6 1.4 5.3 2.9
13,45516,76717,60731,817
1,009 9,602 2,024
14.217.718.633.7 1.110.2 2.1
Total Ocean Going 4,102 90.1 92,281 97.6
CoastwiseFishing/TrawlersMiscellaneous
196 176 77
4.3 3.9 1.7
1,869 95 298
2.0 0.1 0.3
TotalCoastal/Fishing/Misc.
449 9.9 2,262 2.4
TOTAL Arrivals 4,551 100.0
94,543 100.0
14
4.2.2 Pattern Changes
As can be expected from the foregoing, shipping patterns are changing fairly rapidly.Not only is there substantial growth in some product areas, but average tonnages per vesselare increasing, and there are noticeable changes in the cargo mix.
Table 6. Change Pattern of Shipping Arrivals — Durban Port (2003 to 2006)
The data of vessel arrivals in Table 6 confirm that there have been several significant changes in theship arrival mix during the four years from 2003 to 2006. The most notable of these are:
(i) The number of container vessels has increased by 84.9%,(ii) The number of vehicle carriers has more than doubled to 288,(iii) The number of Tankers has increased by 18.9%,(iv) General Cargo has increased by 12.2%,(v) There has been a healthy increase of 16.1% in Coastwise general cargo vessels,(vi) Overall Vessel Arrivals have increased by 4.5%.
There is a noticeable increase in Foreign Fishing Vessel arrivals and this suggests that the numberoperating off this coast has increased, which may be of concern to local environmentalists. There isalso a marked increase in SA Trawler activity. Non-Tanker vessels carrying bulk liquids havedeclined to a negligible number (11), which suggests a shift away from Tank-tainers and Drums tousing Tanker Vessels. This is in line with the general increase in bulk liquid cargo volumes. Ro-Rovessels appear to be on their way out as cargo carriers. Overall the ratio of ocean going to coastwiseof approximately 90% to 10% remains intact with a small shift of 1.1% in favour of coastwise.
From the above data it is clear why the Container Terminal as well as the Vehicle Terminal areexperiencing capacity problems and the Tank Farms at Island View are also feeling some pressure.
The average gross tonnage per vessel has also increased, particularly for container vessels.
Table 7. Average Gross Tonnage per vesselVessel Type 2003 2006 % Change
ContainerTankersVehicle CarriersOverall
17939254853879319910
24124272833899421170
+ 34.5+ 7.1+ 0.5+ 6.3
This basically indicates that vessel capacities are on average more fully utilised at present, but alsoindicates an increase in the average size of container ship calling.
4.2.3 Local Companies and Representation
Because of the extensive forward and backward integration, which is prevalent amongst companiesin the shipping pipeline, it is very difficult to separate shipping companies into clearcut categories.Brabys in their Maritime database for Durban, have placed shipping companies under three maincategories, viz.
Category No. of Companies
(i) Shipping Lines 71(ii) Shipping Companies 21
15

(iii) Ship Owners and Operators 17Total 109
To these must be added “Shipping Agents” and “Shipping Brokers”. The term “Shipping” is used in abroad sense and can include both the physical operation of ships as well as the logistics of shippingcargo between two points. One of the larger local companies, which operates a fleet of 100 ships,also has subsidiary companies in Seafreight Logistics, Landfreight Logistics, Ships Agencies,Shipping Services, Bulk Product Trading, Financial Services and Travel Agencies.
Another of the Shipping Companies interviewed described their structure as follows – “We are aprivately owned company with a turnover of between R100 and R250m per annum. We are agentsand brokers for ships and also occasionally charter ships. While we outsource a large number ofservices such as bunkering, chandlers and marine supplies, we do provide marine services, cargoservices and crew support services such as cash to masters, change of crew, and administration ofsalaries and wages for crew. Separate divisions handle bulk goods, logistics and warehousing,clearing and forwarding, and the provision of services as ship’s agents.” The company has terminalfacilities for breakbulk and bulk liquid, as well as facilities for maintenance, storage andrepairing/cleaning of containers.
Thus the larger ship owning companies, which are extensively integrated into all aspects of theshipping/cargo pipeline, dominate the structure of the shipping industry. The market is highlycompetitive, and demands seamless shipping/logistics/administrative processes, with most goodsbeing treated as time-sensitive to a greater or lesser extent. Goods, whether they be bulk rawmaterials or finely engineered finished products, must be loaded on a designated vessel on a specificday and arrive in time and in perfect condition. The customer does not want to be bothered withextensive paperwork or having to fetch and carry. Delays are unacceptable as they want the goodsas quickly as possible, and the cost of getting them transported from source must be as low aspossible.
There are of course a host of smaller more specialised companies filling in the gaps between themajors, and the system is very dynamic and undergoing constant change. Each companyendeavours to maximise opportunity around its strengths, and to create a niche or niches bycontrolling as much of the pipeline within which it operates as possible.
In the overall scheme of things customers, be they importers or exporters, have the greatestleverage, followed by the larger shipping companies who operate their own shipping fleets. Ports andthe independent transport and logistics companies tend to have the least leverage and are expectedto perform at high efficiency levels at all times. Thus when ships find themselves queuing up outsidea port they soon impose surcharges in order to offset loss of business due to loss of operating time.
Durban has several larger shipping/logistics companies, two of which are listed on the JSE. Both aresuccessful and both have wide participation and integration into the various cargo pipelines. The onehas its own fleet of cargo ships, whereas the other is oriented more towards freight handling andorganising shipping contracts on behalf of clients. There are both foreign and locally owned shippingcompanies with operations located in Durban. Sometimes it is the company’s own office andsometimes representation is via an appointed agent. The agent looks after all the ship’s needs whileit is in port as well as acting as negotiator for shipping contracts on behalf of the ship owner.
4.2.4 Support Facilities
The following categories can be grouped as the main support facilities for the shipping sector.However, there are other service sectors which from time to time are called on to provide a specificservice, although it may not be their main market. The catering sector is a typical example.
All Port Services provided by the NPA Marine EngineeringShip Chandlers Marine Engineering Components & SparesOil & Fuel Bunkering Marine Engines & Equipment Servicing, etcMarine Services Marine Servicing MaterialsMarine Consultants & Contractors Ship Repair
16
Marine Cargo Surveyors & Cost Adjusters Boat & Engine RepairMarine Insurance Assessors Control Instruments & SystemsSecurity & Surveillance Consultants Meteorological ServicesUnderwater Diving Services Fire Fighting Equipment & SuppliesSpecialist Services Fire Protection Engineers
- Air Conditioning- Refrigeration- Acoustics & Insulation- Ant- Corrosion Treatment- Cleaning
The above list is not necessarily complete, but is sufficient to show that ship operations require awide range of support services. The multiplier effect in terms of value added, jobs and local wealthcreation from providing a full range of services to over 4500 ship arrivals a year, is huge. Being asubstantial international-class port, the Port of Durban through these service linkages is in a positionto offer a very wide range of services. There is for instance a large and excellent pool of ship building,repair and servicing skills in Durban. Of particular interest is that some of these overlap with otherindustries such as engineering, metal working and even the automotive sector. Durban is strong inthis area and this competitive advantage should be maintained at a high level through skillsdevelopment and support systems as it constitutes one of the port’s main strengths.
The overall structure of the Shipping Sector together with its service linkages is encompassed inAnnexure A.
4.3 THE CARGO / LOGISTICS SECTOR
4.3.1 Cargo Movements and Pattern Changes
As has been shown under the shipping sector, substantial changes have been experienced in recentyears in terms of the types of cargo vessels calling at the port. As explained this signifies continualchange dynamics in global markets and brings with it changes in cargo mix as well as cargo handlingtechnology.
Diagram 3 Container TEUs Handled (1997 – 2007*)(* 2007 Estimated)
The above graph, which focuses on containers, includes all containers imported and shipped,excluding empties. The time periods are for financial years. The numbers have been rising steadilysince 1999 and there has been a sharp acceleration, particularly of imports, since 2002. The estimatefor the current financial year (2006/2007) is 1,65 million full containers handled, of whichapproximately 57% will be imported and 43% exported.
The graph below shows the rapid escalation in empty containers handled. Unfortunately allcontainers have an owner somewhere and have to be returned. This is often as an empty where no
return load is available. Container stocks tend to be balanced on an annual basis.
Diagram 4. Empty TEUs Handled
‘000 TEUs 1996/97 1999/2000 2005/06 2006/07 est.
TEUs (Full)TEUs (Empty)
842160
923204
1480476
1654669
TOTAL TEUs 1002 1127 1956 2323
Empty % 15.9% 18.1% 24.3% 28.8%
17

EMPTY TEUS HANDLED
0
100
200
300
400
500
600
700
800
1997 1998 1999 2000 2001 2002 2003 2004 2005 2006 2007
'000
TE
Us
Empty TEUs Landed Empty TEUs Shipped Empty TEUs handled
The very rapid escalation from 2003 relates directly to those empty containers shipped, whichcorrelates directly with imports a year earlier. There doesn’t appear to be an easy answer to thisphenomenon of having to ship empty containers until South Africa can add more value to its bulkexports in this country and then export more of the output as value-added products. However theforward integration of shipping lines into the cargo/logistics pipeline is helping to optimise this processto some extent. In the end though, it is an additional operating cost, which must be recovered in thecargo transportation charge. Thus there is a strong incentive to find ways to minimise this costthrough new logistics initiatives.
Table 8 below summarises the data for full and empty containers handled. Note the rising percentageof empties.
Table 8. Total Container TEUs handled (Imported and Shipped)
Bulk and Breakbulk Cargo — These cargo types form important components of the port’s cargohandling activity. Table 9 below summarises imports and exports of these two types through DurbanPort over the past ten years.
Table 9. Break & Breakbulk Cargo handled through Durban PortMillion Tons 1996/7 1999/0 2002/3 2005/6 Ave. Growth pa
1996/7 to 2005/6
IMPORTEDBulkBreakbulkTotal
21.42.8
24.2
22.51.7
24.2
19.72.0
21.7
26.63.7
30.3
3.5 %4.0 %3.7 %
18

EXPORTEDBulkBreakbulkTotal
9.46.0
15.4
9.15.1
14.2
7.34.1
11.4
8.43.9
12.3
-1.1 %-4.0 %-2.5 %
IMPTD + EXPTDBulkBreakbulkTotal
38.88.8
39.6
31.66.8
38.4
27.06.1
33.1
35.07.6
42.6
2.2 % -1.6 %
1.6 %
The main Bulk Products imported and exported are shown in Table 10 below.
Table 10. Bulk Imports and Exports
Imports % Exports %
Wheat & Products 3.75 Maize & Products 4.18Agric./Seaweed NES 1.65 Sugar 10.37Animal/Veg. Oils & Fats 2.44 Fluorspar 2.88Petroleum % Petroleum Gas 84 55 Petroleum % Petroleum Gas 45.28Fertilizer 1.55 Woodchips 3.99Chemicals 2.22 Chemicals 9.25
TOTAL 96.16 Ferro-Alloys 4.54Coal 16.80
TOTAL 97.29
Petroleum and Petroleum Gas dominate bulk imports and exports, with significant contributions onthe export side from Coal, Sugar and Chemicals. As shown in Table 9, bulk exports have declinedslightly over the past ten years. This has been mainly due to declining trends in coal, maize andsugar. Steel has behaved erratically and is also slightly down. Chemical exports have maintainedtheir levels and Petroleum and Ferro-alloys are both up.
Bulk imports are dominated by Petroleum Products and have been rising steadily. Overall the year2005/6 was 25% higher than the year 1996/7.
Table 11. Breakbulk Imports and Exports
Imports % Exports %
Rice 12.04 Citrus Fruit 11.37Woodpulp 1.39 Granite 2.48Timber Products 3.34 Chemicals 2.03Steel 8.53 Woodpulp 5.71Electrical Appliances 1.14 Vehicle FBUs* 19.74Gypsum 1.02 Steel 54.61Vehicle FBUs* 65.09 TOTAL 95.94
TOTAL 92.55* FBUs = Fully Built-up Units
Breakbulk exports have also shown a declining trend over the last ten years and this could be partlydue to more products being handled in containerised form. Declines have been recorded for thefollowing – coal, ferro-alloys, paper, woodpulp, granite, sugar and maize products. On the other hand,increases have been recorded for vehicles, timber products and citrus. Breakbulk export tonnages,which were around 4 million tons last year, are nevertheless substantial.
Breakbulk imports are mainly Vehicle FBUs (65%), Rice (12%) and Steel (8.5%). Altogetherbreakbulk imports have increased by 34% from 1996/7 to 2005/6, reaching 3,7 million tons.
Summary:
19

Comparing total cargo movements between the three main categories for 1996/7 and 2005/6, thereare some interesting changes as shown in Table 12 below
Table 12. Cargo Movements – 2005/6 compared to 1996/7Million Tons Landed Shipped Total % of Total
1996/7:ContainerisedBreakbulkBulkTotal%
8.82.8
21.433.0
58.4 %
8.16.09.423.5
41.6 %
16.98.830.856.5
100.0 %
29.9 %15.6 %54.5 %
100.0 %
2005/6:ContainerisedBreakbulkBulkTotal%
16.43.7
26.646.7
64.7 %
13.23.98.425.5
35.3 %
29.67.635.072.2
100.0 %
41.0 %10.5 %48.5 %
100.0 %
In terms of total tonnage handled, containerised cargo has increased from 29.9% of the total to 41%over the ten years, whereas breakbulk and bulk have declined from 15.6% and 54.5% respectively to10.5% and 48.5% respectively. It is clear that containerised cargo in tonnage terms is growing fasterthan either of the other forms. On the import side both breakbulk and bulk tonnages have increased,whereas on the export side both have declined. Containerised has increased substantially on bothsides.
During the 2005/6 financial year, Durban Port handled 62.9% of Container TEUs for all ports in SouthAfrica and 23.8% of total cargo tonnage. Richards Bay was highest in the tonnage category, handling49.7% of the total.
The above mix changes have serious implications for the mix and structure of the cargo handlingindustry in Durban. The overall logistics focus is shifting towards containers, and the balance in non-containerised is shifting in favour of imports. This import/export balance change is surprising as itdoes not reflect the effects of the weak Rand over the past ten years, which should have favouredexporters. Thus there must be other factors at play such as the increase in containerisation of formerbreakbulk goods and the shift of some bulk goods such as Granite, away from Durban Port. Thegeneral lowering of import tariffs since 1994 under South Africa’s membership of the World TradeOrganisation (WTO) has also lowered the landed price of imports, particularly consumer and highvalue-added goods, causing imports to increase. The sharp increase in imports of Chinese textiles isa good example.
4.3.2. Terminal Interfaces
It is well known and understood that certain of the terminals, chiefly the core terminals operated bySAPO, are coming under increasing pressure. SAPO has already spent substantial capital sums toaddress these capacity bottlenecks, and there is much more to follow. Part of the process involvesredesign and upgrading of berths and cargo handling areas. Briefly the state-of-play at each of themain terminals is as follows.
(i) Durban Container Terminal (DCT) – Total area of current DCT is approximately 102ha. As noted earlier in this report (see page 14), container volumes are growingrapidly, having averaged over 12% per annum for the 4 financial years to March 2006,with further acceleration expected in the current year. Projected volume for 2006/07 isapproximately 2.3m TEUs (full + empty).
The objective is to increase the capacity to in excess of 3.0m TEUs by end 2007. Themain focus of the programme is a R2bn redesign of Pier 1 into a modern container
20
terminal (currently in progress, to commence operating by May 2007) with a handlingcapacity of 0.72m TEUs per annum. The balance of the capacity improvement will beachieved by acquisition of new handling equipment for DCT.
A new IT system is also to be introduced and a SAPO delegation is already in the USundergoing training on the system, with a view to training operational planners on theirreturn. Efficiency at DCT is currently well below world benchmarks (See Section 7.1.3)and it is hoped that the acquisition of new container handling equipment will enable theterminal to operate at accepted international standards. Road access from BayheadRoad and Langeberg Road represent serious bottlenecks and is discussed in moredetail under Sections 5.3.1 and 8.1.
In terms of equipment, it is planned that by end August 2007 Pier 1 will have 3 berths, 5STS (Ship-to-Shore) cranes, and 6 RTGs (Rubber-Tyre-Gantries). An additional sixRTGs and one STS crane are to be delivered by end 2007. The terminal has alreadyreceived 33 Tractor Trailers, 2 Reach Stackers and 2 ECHs (Empty ContainerHaulers).Source: http://ports.co.za/sapo/article_2007_01_18_0415.html)
The above expansion should raise the overall hourly throughput as well as makingthree additional berths available and significant extra space for container handling andstacking. Assuming the targeted annual capacity is achieved, this will address SAPO’scontainer volume problem in the short term. However, at the current and projectedgrowth rates, further substantial capacity capability will have to be developed over thenext decade. (See also Section 7.4.3, Cargo Growth Projections). SAPO and the NPAhave already commenced planning for this additional capacity.
(ii) Multi-Purpose Terminal – Until very recently the port had two multi-purpose terminals(MPTs) handling breakbulk products, which include steel, ferro-alloys, forest products,fertilizer, fruit, salt and rice as well as some containers. Granite was also handled viathe one MPT but has since been moved to Richards Bay. The first MPT, Durban Multi-Purpose Terminal, operated with 14 berths located across Pier 1, the Point and on theT-Jetty and handled both imports and exports. Pier 1 was closed very recently toundergo alterations to a container terminal. A new City Terminal was constructed atthe Point with deeper berths (berths D to G) to accommodate the breakbulk from Pier1. However the rapid rise in vehicle volumes has caused an overflow of vehicles fromthe adjacent Car Terminal, with the result that a large section of the MPT is currentlybeing taken up by motor vehicles. Motor vehicles are also being parked on the T-Jetty.Other areas accommodating vehicles on a temporary basis are the Sugar Terminaland the ship repair area at Bayhead.
The second MPT is at Maydon Wharf operating principally from berths 8 to 13.Maydon Wharf handles a variety of commodities including semi-bulks such as fertilizerand salt, as well as scrap-metal, steel and forest products. Other private terminals alsooperate from Maydon Wharf (see Section 4.1.2). Maydon Wharf is an old terminalarea and logistics park designed largely around rail transport. Today it is in seriousneed of redesign to accommodate the heavier road transport, which requires extraturning and parking space.
SAPO have recently installed a hi-tech weighbridge facility at Maydon Wharf. This willimprove efficiency at this MPT and was installed with the objective of creating a 24-hour one-stop facility. Turnaround time is substantially improved and accurate weighingis guaranteed. The system is GCOS compliant and facilitates cargo tracking. Thus theterminal now offers a one-stop facility that includes weighing, storage, handling, andloading/offloading.Source: http://ports.co.za/sapo/article_2007_02_2_2635.html
(iii) Durban Car Terminal – Built in 1998, the car terminal has maintained a high level ofefficiency since its inception. It has been awarded ISO9001:2000 accreditation and in
21
2004 it achieved a NOSCAR occupational safety rating. This places it in world class asa well managed operation. Due to the high growth rate in vehicle imports and exports ithas been necessary to continue expanding its capacity, and it was recently able tooffload a ship carrying over 5000 vehicles in one load. This is the biggest singleshipment of vehicles ever to be offloaded at a South African Port.
However, as pointed out above, the terminal has run out of capacity and a newterminal phase is currently under consideration. At present the authorities haveearmarked the SA Navy area at Salisbury Island for a new terminal, but discussionsand negotiations are still in progress as there are more than one option to beconsidered.
(iv) The Private Terminals – There are a number of specialist private terminals locatedmostly at Maydon Wharf and Island View. Briefly the situation with these is as follows:
Sugar Terminal – Operated by the SA Sugar Association, it handlesapproximately 900 000 tpa of bulk sugar and 300 000 tpa of bagged sugar. It alsohandles some small miscellaneous shipments for other parties. The terminal isefficiently managed and handles an average of 120 trucks per day during themain delivery period. Approximately 70% of sugar arrives by road transport and30% by rail. Shipments are spread according to the state of the market, whereprice optimisation is a key factor. The terminal employs 125 people of which 40%are skilled and 60% are unskilled. Shift configurations vary from 1 to 4 dependingon the workload.
Unilever Terminal – This is a bulk liquid terminal for vegetable oils. Althoughserving the needs of the Unilever Group, the operation is totally outsourced toIsland View Storage. The system operates efficiently.
Rennies Bulk Terminal – This is a multi-product bulk handling facility dealing withagricultural and mineral products.
Agriport Grain – This terminal also operates at Maydon Wharf and is a smallspecialist facility.
Bulk Soda Ash – Another Maydon Wharf facility operated by Brunner Mond. Bulk Malt – Normally handled at berth 100 Salisbury Island, serves SA Breweries.
Bulk Chemicals – Located at Island View, the terminal serves Island View Storage(IVS) and van Ommeren. Both facilities are substantial and handle predominantlyBulk Chemicals, as well as Vegetable Oils and Molasses. Although some of thePetroleum companies have tank farms at Island View, most of their stocks comevia the pipelines from the Single Bouy Mooring (SBM) and the two Refineries.Both chemical tank farms operate efficiently but experience road transport delaysalong Bayhead Road. Apart from bulk storage of chemicals the two tank farmsundertake blending and drumming off of chemicals, and offer weighbridge andtanker cleaning facilities. Both undertake Customs clearing and forwarding onbehalf of importers, as well as shipping arrangements.
Along the wharfside from IVS towards the harbour mouth is Durban BulkShipping, which handles mostly grain and similar agricultural products. It has silofacilities for intermediate storage between rail and ship and vice versa. It also hasbagging facilities available. It has storage of 69,000mt and can transfer between5,000mt and 15,000mt per day, depending on the operation.
Near the harbour entrance is what was originally the Coal Terminal, which is nowoperated by Rennies Bulk Terminals (part of Bidfreight Group) as a general bulkterminal. The terminal targets difficult-to-handle bulk commodities including coal.Different types of material handling systems are available to accommodate theproperties of different products. Storage is approximately 100,000mt for exportand 20,000mt imported.
4.3.3 Structure and State of the Cargo / Logistics Industry
The cargo/logistics side of the local Maritime industry is well developed with a large pool of skills andexperience. A schematic outline of the industry is shown in Annexure B and a summary of the maincategories is shown in Table 2 on page 3. Altogether on the basis of the Braby’s categorisation, there
22

are approximately 1400 firms from 40 business categories directly involved in the cargo/logisticspipeline in the eThekwini Municipal Area. The majority of these have a direct product/servicerelationship with the Maritime Sector whilst others are predominantly involved with landfreight andlocal distribution. Many are concerned with both types of freight.
The industry is reasonably efficient in that member firms are very competitive with each other, exceptwhere matters are beyond their control such as traffic bottlenecks and delays at the port. They arehard working and have over a century of local experience behind them. However the industry isexpanding rapidly and there is a general shortage of land availability to meet their expansion needs.Traditional areas such as Maydon Wharf desperately need upgrading and redevelopment. There islittle organisation in terms of an industry structure as all of the bigger firms have diversified into othersub-sectors of the pipeline. The two majors, the Grindrod Group and the Bidvest Group tend todominate, but there are many other sizeable groups and individual companies operating at a highlevel in terms of turnover and throughput.
The switch from rail to road transport has brought a new set of challenges with it, particularly as theolder industrial townships such as Maydon Wharf, Bayhead and Jacobs were all designed for railcompatibility. Although there is strong clustering of the industry close to the port, there is no modernlogistics park to set the performance benchmarks. The industry is also somewhat traditional in thestyle of its industry associations. Communication with both the Port and the Municipality whilstimproving, is not at the level it needs to be and inter-association communication could also beimproved. There is clearly an opportunity through better teamwork between the port, the municipalityand the two industry sectors to raise the general efficiency and competitiveness of the whole pipeline.The process requires the establishment of stronger co-operative structures, as well as thestrengthening of formalised institutional co-operation within the two sectors, i.e. the Shipping Sectorand the Cargo/Logistics Sector.
These issues are dealt with in more detail in the later chapters of the report (See Sections 8.3, 8.4,9.3).
5. ANALYSIS OF SHIPPING AND CARGO/LOGISTICS VALUE CHAINS
5.1 General Overview
From the foregoing it is clear that the Port of Durban and its Maritime Sector are substantial byinternational standards in terms of the level of sophistication and the cargo volumes, both inward andoutward, which are handled annually. These cargo volumes are rising rapidly and the prognosis isthat this trend will continue for at least another decade or even more. Not only is the port’s capacityunder extreme pressure in a number of areas, but the whole maritime logistics system is feeling thestrain. The country of necessity is moving more and more into global trade and the need to be able tocompete has never been more pronounced.
Thus this study is attempting to highlight those elements of the logistics pipeline which are notcompetitive and to suggest strategies which will bring about a general lowering of costs and set theindustry up to remain competitive in the longer term. Sections 5.2 and 5.3 provide an analysis of thesector value chains through a series of interviews with a representative sample of well establishedfirms. The Shipping and Cargo/Logistics sectors are treated separately, although in practice it wasfound that there is a good deal of overlap and that a number of the same issues are of concern toboth.
5.2 Shipping Sector Interview Responses.
The value chain in the shipping sector is well illustrated in the diagram shown in Annexure A. Clearly,there are also linkages between the value chain of the shipping sector and the cargo sector.
Shipping lines, agents and brokers have linkages as shown in diagram 5 below.
23

Diagram 5. Shipping Value-Chain Linkages
5.2.1 Shipping Sector V-C Primary Activities
5.2.1.1 Inbound Logistics — Inbound logistics for shipping concerns the movement of cargo in all itsforms from the exporter to the ship. A ship having unloaded its cargo does not want to leave the portempty. Ships agents and brokers must ensure new cargo is added and arrives at the docksideterminal in the right form for shipping and in a timely manner. Many of the shipping firms havediversified their investments into on-shore logistics activities in order to have better cost control overthese activities so that their ships have full cargo loads by offering a comprehensive, competitive andseamless shipping service.
The main transport access required for these firms is a good road network, although some shippingcompanies mentioned the importance of a good rail service into the harbour area. Space problemsrelated mainly to the shortage of parking for staff vehicles in the CBD, and to inadequate truckparking facilities in the Bayhead area.
5.2.1.2 Operations — The shipping lines and agencies regarded themselves as able to operate at aninternationally competitive level, using state of the art technology, but serious problems arose withregard to port operations. These are covered in Chapter 7.
The current utilisation of equipment in the shipping sub-sectors was stated to be high, fluctuatingbetween 85-100%.
Among the shipping companies and agents labour costs typically amounted to between 65-70% ofoperating costs. This ratio fell to about 50% in the case of ship’s chandlers and about 45% for someof the other service sub-sectors.
5.2.1.3 Outbound Logistics — This section of the questionnaire was found to be not applicable tothe shipping sector.
5.2.2 Shipping Sector V_C Support Activities
5.2.2.1 Infrastructure — Most of the shipping companies occupied only office premises in Durban,but some also operated depots and warehouses. Service sub-sectors often undertook their work inspecialist mechanical workshops. Much of the logistics work is outsourced.
24
SHIPPING LINE
SHIPPING AGENTS
Operations/Procurement/HRIn-Port Maintenance:- Engineering, Ship Servicing &
Repairs- Engine Maintenance- Drydocking- Mooring Systems Checks- Cleaning & Painting- Diving Services- Fire & Safety EquipmentShip Supplies:- Bunkering- Chandlers- Other SuppliesCrew Services- Shore Allowances- Medical & Dental
SHIPPING BROKERS
Inbound LogisticsTrade:
- Importers & Exporters- Manufacturers- Traders- Trade Finance- Marine Insurance
Cargo:- Terminals- Stevedoring- Tally- Freight Companies- Marine Consultants- Marine Surveyors
OperationsPort Aspects:
- NPA liason- Docking- Tugs + Pilots- Berthing- Security

5.2.2.2 Human Resources — The Shipping Sector employs a significant number of people andthere are the long list of firms with partial linkages who regard shipping as one of the customergroups. Human resources is a key aspect of the sector as the skills requirement is often veryspecialised.
Number Employed - The total number of individuals employed in the shipping sector is difficult toestimate. A sample of firms was drawn from the sub-sectors listed by Brabys, but it was found duringfieldwork that a number of these sub-sectors were not applicable to the industry and that some firmshad either ceased to exist or had merged into larger entities. Some of the firms interviewed were partof larger groups that included activities, which would be listed under the cargo section of this study.
In most sub-sectors we were able to interview the largest company and, from employment figuresprovided by those companies, to attribute employment numbers to smaller companies. Totalemployment in the particular sub-sector was also discussed wherever possible with the firmsinterviewed.
Table 13. Shipping Sector Employment Estimate
Sub-Sector EmploymentPermanent
EmploymentCasual
ShippingPortStevedoringShipping Lines, Operators, AgentsMarine Engineering
10,600 3,500 1,250 3,000 425
3,2501,0001,000 01,250
TOTAL 18,775 6,500
Education - The proportion of staff who had received some tertiary education varied from 0-100%.For most of the shipping lines and agents the proportion of those with some tertiary education wasbetween 15-20%, although it fell to as low as 5%. A small marine consultancy firm reflected a 100%figure and a marine engineering firm 60%. In cases where shipping agents only had offices, theretended to be no unskilled employees, but this proportion rose to about 15% in firms employingpackers, sweepers and so on. Some firms stated that the only tertiary education required was foraccountants. Overall the total of the firms interviewed in the shipping sector produced the followingsplit in skills levels for their permanent employees:
Skilled (Tertiary Educ.) 24%Skilled (Non-Tert. Educ.) 60%Unskilled 16%
Whilst these figures do not represent a statistically representative sample, they nevertheless showthat skills are a prime requirement for employment in the sector. There is a high requirement fortechnical and IT skills, whereas the need for unskilled employees is relatively small.
Key Skills - In the case of shipping firms the skill requirements related mainly to maritime operations,trade, finance, accounting, management and IT. Communications with customers (through themedium of good English) was mentioned by some firms, as was a foreign language such as Frenchand German. Cargo superintendents required a Master’s Certificate. In the firms servicing theshipping companies, the key skills were engineering, computer literacy, diesel mechanics, weldingand stevedoring. Training and Development - Most shipping lines offered in-house, on-the-job training to staff. Most ofthese companies used the Institute of Chartered Ship Brokers, which provided training courses. Atleast two shipping firms ran their own training school, while one used an operating system on itsglobal website.
Skills Availability - The availability of skills is a major problem for many shipping companies. Theproblem is especially acute at the middle management and supervisory levels. Employees with sometype of qualification but with no experience were stated to be impatient for promotion. Artisan skills
25
are generally in short supply in the sub-sectors servicing the shipping lines. Some companies statedthat they did not encounter any skills problems, but these were firms in which employment wasalmost entirely of the office administration or unskilled variety
Recruiting - Most shipping companies operated a system of internal transfers within the group towhich they belonged. International recruiting was stated to be difficult because of problems with thegranting of work permits from the Department of Home Affairs. Whilst engineering skills can besourced from tertiary institutions, the ship repair sector struggle to find skilled staff, especially inareas where training courses can take 4-5 years. Other methods of recruiting are advertising, the useof employment agencies, tertiary institutions, and poaching from other firms in the particular sector.
Operating Shifts - Those companies operating at port terminals or with depots tended to operate on ashift basis − either with three 8-hour shifts or two 12-hour shifts per day. Whether two or three shiftswere worked in stevedoring depended on the cargo. Most offices worked on the basis of a five-dayweek but some also worked on Saturday mornings.
Local Transport - The mode of transport used by staff varied from own car (especially formanagement and senior and middle-level employees) to lift clubs (common among office staff) tometro rail and minibus taxies (commonly used by lower-level employees). Public transport for shiftworkers remains a problem.
Residential Areas - Information provided by the respondents showed that staff residences werewidely scattered throughout the eThekweni Municipality. Whereas senior management tended to livein suburbs such as Durban North, Mt. Edgecombe, Westville and Kloof, middle-level managementoften lived on the Berea, Glenwood or on the Bluff. Many office workers and employees in the servicefirms resided in suburbs such as Phoenix, Chatsworth, Tongaat, Umlazi and Kwa Mashu.
5.2.2.3 Technology — As mentioned above, many shipping firms are part of an internationalgroup. These firms are usually linked into a global IT system developed by the group for its particularcircumstances. IT is the most important area of technology required for operating these companiesefficiently. These in-house international IT systems were stated to be sophisticated and conforming tointernational best-practice standards, enabling the companies to be highly competitive. One companyhad created a special system for South Africa because customs procedures are different in SouthAfrica from the other countries in which the particular group operates. Most of these firms hadsubstantial IT departments.
IT systems are regarded as being extremely capital intensive both in the shipping and the logisticsand freight management sub-sectors. This is also the case with marine engineering. This kind oftechnology is usually imported rather than being created in South Africa.
In the support sectors, only basic IT systems are required in order to process orders, accounts andso on. Nonetheless, these companies felt that they were competitive and that their equipment met thehighest standards of technology.
5.2.2.4 Procurement of Materials and Services — The source of materials and services used bythe responding companies indicated that a high proportion are purchased in Durban or KwaZulu-Natal. This proportion appeared to be in the vicinity of about 80%, although some procurement isinternal within the particular international group.
The main services procured in Durban include materials, bunker fuels, transport, warehousing,distribution and office supplies. A tendency among shipping companies is to sub-contract transport tospecialist road hauliers, often owner-drivers. Logistics services are also outsourced. All theseservices are regarded as being readily available in Durban with the exception of haulage capacityduring peak seasons, and spares for boat engines.
5.3 Cargo / Logistics Sector Interview Responses
Company Profiles
26

The cargo sector is dominated by a few large organisations each with operations in several areas ofthe value chain. Then there are a number of medium sized operations and many small organisations,mostly close corporations. The interview sample yielded the following ownership breakdown.
Overseas owned 3.4%Public Companies 34.5%Private Companies 24.1%Close Corporations 37.9%
In questioning companies about there turnovers, it was emphasised that turnover should be for thatspecific operation for the Durban area. Where companies were part of a national or internationalgroup or of a public company listed on the Johannesburg Stock Exchange, it was important to focuspurely on the Durban operation of that specific operation. Interviews yielded the following results.
Turnover Group %
< R5m 31.0%R5m – R10m 20.7%R10m – R50m 17.2%R50m – R100m 10.3%R100m – R250m 3.4%> R250m 17.2%
As stated earlier, the sample was skewed in favour of the larger organisations and this can be seenby the percentage of companies who reported turnovers of over R250m. It is interesting to see thehigh percentage reporting less than R5m turnover, which indicates that this is an industry where smallentrepreneurs can find a niche. Many of them act as sub-contractors to larger firms for specificservices. In addition a number of the Transport companies sub-contract work to local cartagecontractors who have only one or two trucks. In one case the transport company outsourced all theirtrucking but assisted the SMME contractors with servicing of their trucks and driver training.
5.3.1 Cargo/Logistics Sector V-C Primary Activities
The Primary Activities in the C/L sector focus primarily on Operations, In- and Outbound Logistics,with some general questions. Variable costs are primarily in these areas and are key to overall costefficiency. Marketing, Sales and Service aspects, although part of the Primary Activities, were foundnot to encompass noticeable cost disadvantages and have therefore been omitted.
There are several key streams or pipelines of activity and these are linked to the different types ofcargo and their logistics linkages towards final delivery at a specific port terminal. The industry tendsto separate itself between Container cargo, Breakbulk cargo, Fresh Produce cargo, Bulk Liquidcargo, Fully Assembled Vehicle cargo, Bulk Metals and Minerals cargo and Bulk Grain cargo. Manyof the smaller specialist service firms tend to focus on niche relationships within this structure.
(See also Annexures C,D,E,F for Cargo Sub-Type flow diagrams)
5.3.1.1 Inbound Logistics
Companies were asked which of the port terminals they dealt with on a regular basis and thisproduced some interesting results. The answers are summarised below.
Table 14. Port Terminals User ActivityContainer Multi-
Purpose Bulk Vehicle Sugar Grain FreshProd.
BulkMetal/Min
Bulk Liquid/Petroleum Other
25.8% 15.7% 25.8% 10.1% 4.5% 3.4% 1.1% 7.9% 2.2% 3.4%
It is possible that the bulk liquid/petroleum terminal figure is understated because only two tankercompanies were interviewed. However the balance appear to be a fair reflection of the spread ofactivity.
27

The spread of activities amongst the companies showed that there are a number of companies whoare involved in more than one activity. On average companies were involved in up to three differentactivities. Table 15 below summarises the activity spread.
Table 15. Cargo Sector Activity SpreadContainer
Storage/Maint. Cargo Handling Warehousing Transport &Logistics Services Trade
4.6% 12.6% 35.4% 34.3% 5.1% 8.0%
Warehousing, Transport and Logistics tend to dominate, as would be expected. Nevertheless there isa range of support services that link into the mainstream of activity. Stevedoring, and Crane andEquipment Hire are included under cargo handling. “Services” includes mainly security, marineinsurance and marine surveys. Trade includes importers, exporters and import/export agents. Thereis also naturally because of forward integration, some overlap with the shipping sector.
Examining the warehousing, transport and logistics sub-sectors in more detail, further specialisationwas found. This gives an indication of the level to which the industry is already developed.
Table 16. Transport and Logistics sub-sector spread
CartageContractors
Bulk LiquidCarriers
Clearing &Forwarding
Transport Carriers(long distance)
CargoAgents
LogisticsServices
21.7% 3.3% 20.0% 16.7% 16.7% 21.7%
The warehousing sector, which tends to be spread around the city in a variety of old buildings, hasalso developed a wide spread of specialist focus.
Table 17. Warehousing sub-sector spread
General State Chemicals Furniture Steel Br/Bulk RefrigertdCloth,Fwr &Text.
BondStores
FreshProd Other
21.0% 1.6% 4.8% 1.6% 11.3% 17.7% 1.6% 4.8% 21.0% 1.6% 12.9%
The “Other” category included vehicles, kitchenware, rice, paper & pulp and freestore. Generallywarehouses are very dated in design, labour intensive and totally lacking in computerised conveyorsystems as are common in Europe. Transport access and parking is a problem. 5.3.1.2 Operations — Table 18 indicates sub-sector views of the particular areas where they mustmaintain operational competitiveness.
Table 18. Areas of Operational Competitiveness Sub-sector Operational Competitiveness
Cargo Handling & Container Services Price, service, availability, various types of vehicles, well trained drivers &conductors, knowledge of the industry, experienced staff.
Cartage Contractors Service, price, state of the art equipment, deep draft berths, experienced workforce.
Customs Clearing & ForwardingProfessionalism, knowledge, service, price, communication, availability (24hrs),speed of documentation processing, availability of logistics solutions, funding.
Export & Import Services Service, price, knowledge.
Freight Services & Warehousing Good rates, service, only company with CCA software, overnight service,delivery within 36hrs, expertise.
Storage & Warehousing Position, efficiency of rail operations, public transport efficiency, smooth trafficflows for large vehicles in the harbour area, service, size of warehouse, railfacility.
Transportation Companies Transport brokerage.
5.3.1.3 Out-bound logistics
28

• The majority of the companies indicated that their current utilization percentage oftheir plant or service capacity ranges from 70 – 100%, and their labour cost as apercentage of main operational direct cost ranges from 30 to 90%.
• Most of the companies having warehouses have up to 4000 square metres of floorspace, catering for bulk or palletised or both.
• There are no automated computerized materials handling or conveyor systems inoperation.
• Most have special access points to their premises, and use forklifts for truck loadingand unloading.
• They use both in-house trucking and outsourced carriers for distribution.
• The main transport types used for distribution are road and air.
• The main bottlenecks and cost inequities experienced in the Durban CargoHandling System are delays at the Port/Container Terminal as well as trafficcongestion.
• Some of the companies offer after-sales service in the form of courtesy calls to getfeedback from their customers. They feel this is important for maintaining soundcustomer relations and ensuring future business.
General Questions - Most companies indicated that Durban urgently needs more container parks.This will reduce congestion, improve traffic flows and enable a more efficient cargo-flow system.
The majority of the companies indicated that container parks should be located close to the port(Max. 5 Kms radius) and not be decentralized to more distant parts of the eThekwini Municipal Area.A second major distribution terminal is required.
Table 19 below shows findings of responses in support or otherwise of Cato Ridge as a major cargodistribution location.
Table 19. Cato Ridge as a Distribution Centre – views of the Cargo SectorSub-sector Cato Ridge for cargo distribution
Cargo Handling & Container Services No - out of route/cost factor
Cartage Contractors No – too costly due to distance
Customs Clearing & Forwarding No – cost, distance, security.Yes – will help avoid congestion
Export & Import Services No – too far, too costly
Freight Services & Warehousing Yes – avoid traffic congestion
Storage & Warehousing Yes – if it will address congestion
Transportation Companies Yes – avoid traffic congestion
Those companies dealing with cargo movements up to Gauteng and the Free State were generallypositive about Cato Ridge, also pointing out the need for a proper overnight fully serviced truck-stop.However there appeared to be little support for CR as a local distribution point.
29
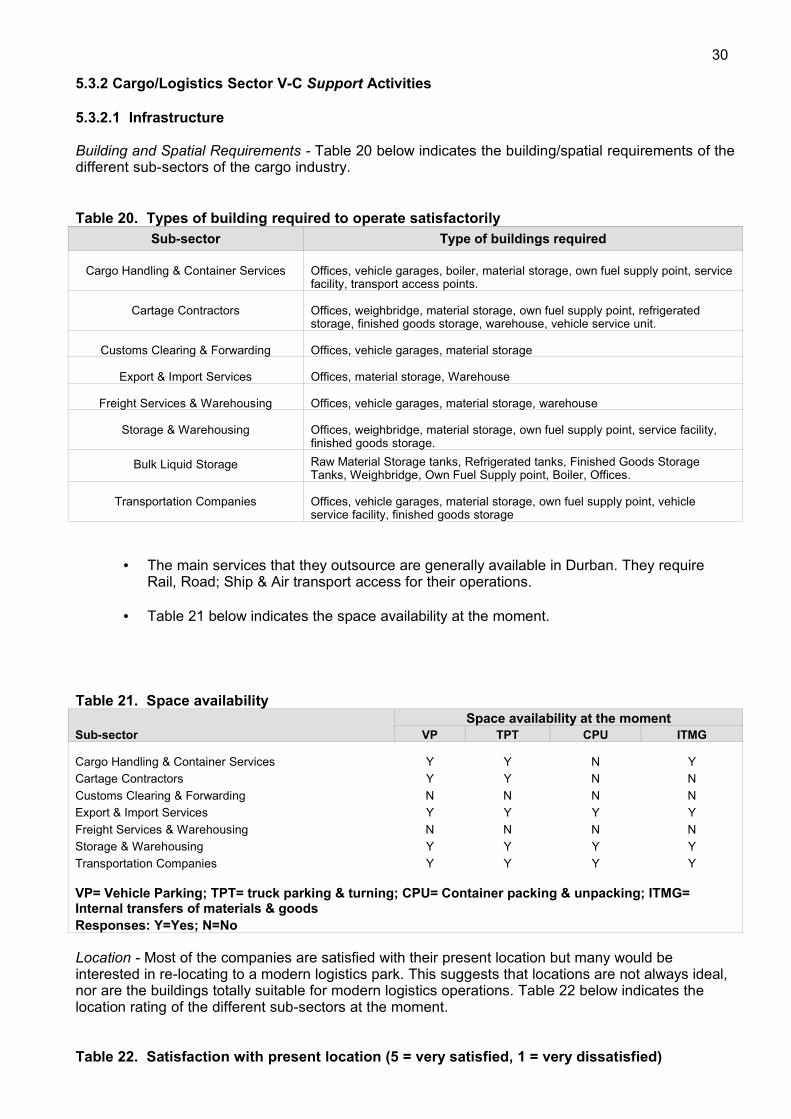
5.3.2 Cargo/Logistics Sector V-C Support Activities
5.3.2.1 Infrastructure
Building and Spatial Requirements - Table 20 below indicates the building/spatial requirements of thedifferent sub-sectors of the cargo industry.
Table 20. Types of building required to operate satisfactorilySub-sector Type of buildings required
Cargo Handling & Container Services Offices, vehicle garages, boiler, material storage, own fuel supply point, servicefacility, transport access points.
Cartage Contractors Offices, weighbridge, material storage, own fuel supply point, refrigeratedstorage, finished goods storage, warehouse, vehicle service unit.
Customs Clearing & Forwarding Offices, vehicle garages, material storage
Export & Import Services Offices, material storage, Warehouse
Freight Services & Warehousing Offices, vehicle garages, material storage, warehouse
Storage & Warehousing Offices, weighbridge, material storage, own fuel supply point, service facility,finished goods storage.
Bulk Liquid Storage Raw Material Storage tanks, Refrigerated tanks, Finished Goods StorageTanks, Weighbridge, Own Fuel Supply point, Boiler, Offices.
Transportation Companies Offices, vehicle garages, material storage, own fuel supply point, vehicleservice facility, finished goods storage
• The main services that they outsource are generally available in Durban. They requireRail, Road; Ship & Air transport access for their operations.
• Table 21 below indicates the space availability at the moment.
Table 21. Space availability
Sub-sectorSpace availability at the moment
VP TPT CPU ITMG
Cargo Handling & Container Services Y Y N YCartage Contractors Y Y N NCustoms Clearing & Forwarding N N N NExport & Import Services Y Y Y YFreight Services & Warehousing N N N NStorage & Warehousing Y Y Y YTransportation Companies Y Y Y Y
VP= Vehicle Parking; TPT= truck parking & turning; CPU= Container packing & unpacking; ITMG=Internal transfers of materials & goodsResponses: Y=Yes; N=No
Location - Most of the companies are satisfied with their present location but many would beinterested in re-locating to a modern logistics park. This suggests that locations are not always ideal,nor are the buildings totally suitable for modern logistics operations. Table 22 below indicates thelocation rating of the different sub-sectors at the moment.
Table 22. Satisfaction with present location (5 = very satisfied, 1 = very dissatisfied)
30
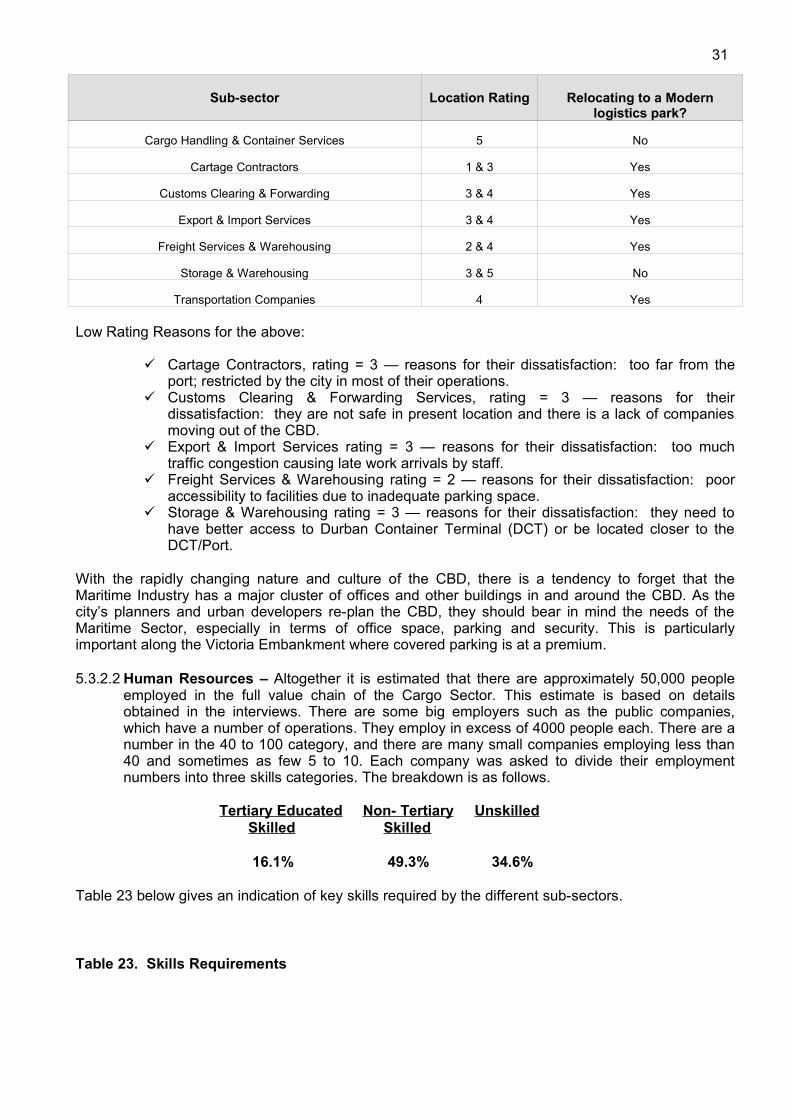
Sub-sector Location Rating Relocating to a Modernlogistics park?
Cargo Handling & Container Services 5 No
Cartage Contractors 1 & 3 Yes
Customs Clearing & Forwarding 3 & 4 Yes
Export & Import Services 3 & 4 Yes
Freight Services & Warehousing 2 & 4 Yes
Storage & Warehousing 3 & 5 No
Transportation Companies 4 Yes
Low Rating Reasons for the above:
Cartage Contractors, rating = 3 — reasons for their dissatisfaction: too far from theport; restricted by the city in most of their operations.
Customs Clearing & Forwarding Services, rating = 3 — reasons for theirdissatisfaction: they are not safe in present location and there is a lack of companiesmoving out of the CBD.
Export & Import Services rating = 3 — reasons for their dissatisfaction: too muchtraffic congestion causing late work arrivals by staff.
Freight Services & Warehousing rating = 2 — reasons for their dissatisfaction: pooraccessibility to facilities due to inadequate parking space.
Storage & Warehousing rating = 3 — reasons for their dissatisfaction: they need tohave better access to Durban Container Terminal (DCT) or be located closer to theDCT/Port.
With the rapidly changing nature and culture of the CBD, there is a tendency to forget that theMaritime Industry has a major cluster of offices and other buildings in and around the CBD. As thecity’s planners and urban developers re-plan the CBD, they should bear in mind the needs of theMaritime Sector, especially in terms of office space, parking and security. This is particularlyimportant along the Victoria Embankment where covered parking is at a premium.
5.3.2.2 Human Resources – Altogether it is estimated that there are approximately 50,000 peopleemployed in the full value chain of the Cargo Sector. This estimate is based on detailsobtained in the interviews. There are some big employers such as the public companies,which have a number of operations. They employ in excess of 4000 people each. There are anumber in the 40 to 100 category, and there are many small companies employing less than40 and sometimes as few 5 to 10. Each company was asked to divide their employmentnumbers into three skills categories. The breakdown is as follows.
Tertiary Educated Non- Tertiary Unskilled Skilled Skilled
16.1% 49.3% 34.6%
Table 23 below gives an indication of key skills required by the different sub-sectors.
Table 23. Skills Requirements
31

In general skills required are not highly technical, but need to be well developed, especially in thedriver, machine operator category. IT skills are an essential requisite and this aspect is growingrapidly in importance. The normal management, finance and administration skills are always required.
Sub-sector Key Skills
Cargo
Handling
&containerServices
• Admin• Gantry Driving • Driving• Engineering• Forklift operators• Information Technology• Managerial Skills• Computer Literacy• Systems Operation• Technical Skills• Welding
Cartage
contractor
s
• Advance Driving • Customs & Excise• Driving• Finance & Admin.• Auto Mechanics• Warehouse Management• Hazchem Driving• Pro Driving Tactics• Fatigue Management• Storemen
CustomsClearing&
Forwardin
g
• Customs & Excise Tariffs• Financial• Transportation• Import & Export• Business Management• Computer Literacy• Clearing & Forwarding• Shipment
Freight
Services &Warehousi
ng
• Computer Literacy• Geography• Overseas Trading• Driving• Transport Links• Commercial Business
Administration• Forklift & Machine Operation
Export&
ImportServic
es
• Computer literacy• Pastel 5 skills• Driving• Clearing & Forwarding• Customs Legislation• Warehousing• Shipping• Transport• Freight
Storage &Warehousi
ng
• Administration• Hyster Operation• Warehouse Operation• Forklift Operation• Supervising• Cargo Handling
Transportati
onCompanies
• Driving • Supervising• Forklift & Machine
Operation• Management• Asset management• Stock Management• Stevedoring
32

Skills availability was good in some areas but often difficult at the tertiary and artisan level. This isespecially noticeable in the IT area. Good drivers and machine operators are always fairly difficult torecruit and ongoing training is required in these areas. Companies generally use employmentconsultants/agencies to recruit but also advertise and use word-of-mouth or factory-gate applicants.The working hours (shifts, week-ends, etc.) are often a deterrent.
Training and Development - The following Table 24 provides a good summary of how firms go abouttheir training.
Table 24. Training and Development Sources
Sub-sector IndustrySupport
LocalGovt
SupportOther Govt
SupportTertiary
Institution In-House
Cargo Handling &container Services
SkillsDevelopment
None Support fromTransnet
Univ. Exams, Staffstudy support
Driving Welding Technical Supervisory Equipment
Operation ABET
Cartage contractors None None SETA (Limited) None Hazchem Driving Pro Driving
Techniques Fatigue
Management Advanced Driving
Customs Clearing& Forwarding
MaritimeShipping
Clearing &Forwarding
None None Maritime
Shipping Clearing &
Forwarding IDP
Programmes
Basic Training In-depth Training
on shipping matters AIDS awareness
Export & ImportServices
SkillsDevelopment
MaritimeInstitute
None None MaritimeCourses
Forklift First Aid
Computer Forklift
Freight Services &Warehousing
SkillsDevelopment
Transport
None Shipping Forwarding Customs
Procedures
M/C Operators Greystones
(accredited in-house)
Storage &Warehousing
None None None None Tally Clerks Supervising
TransportationCompanies
None None None None Forklift Loading &
unloadingcontainers
Many of the companies, especially the larger employers, make ongoing use of such institutes as the
The Institute of Chartered Shipbrokers, The Maritime School and Transport College School of Shipping.
The Grindrod Group provide an annual grant to the New Forest High School where they have amaritime subject in Grade 10. Greystones have their own accredited in-house training school.
The Institute of Chartered Shipbrokers is a UK based organisation, which has 23 branches in keymaritime centres worldwide. Durban is fortunate have one of these branches located in the City. Theirkey objective is to provide education and training in the shipping field so that people employed in theindustry, especially those who are shore based may achieve professional levels of competence.Through their head office in London they are able to award internationally recognised professional
33

qualifications in shipping. They also offer a foundation diploma, which is aimed principally at thosewho are new in the industry. Contact details: Tel.: (031) 266 1381, Website: www.icssa.co.za.
The Maritime School and Transport College was established in Durban in 1986 by a master marinerwho was a veteran trainer in the shipping industry. They offer an accredited certificate in InternationalTrade specialising either in Shipping Practice, Ports and Distribution, or Customs Clearing andForwarding. They also offer learnerships and skills programmes. Courses run throughout the year.(Contact Details: Tel.: (031) 205 7041, Website: www.samaritime.co.za)
The School of Shipping is Cape Town based but target prospective clientele throughout Africa. Theyprovide training for anyone who wishes to enter the world of shipping. They offer various courses andworkshops specifically aimed at land-based shipping functions. There is flexibility in their approach inthat they offer courses either tailor made to meet individual company requirements, or courses on afull-time or part-time basis. (Contact Details: Tel.: (021) 421 4649, Website:www.schoolofshipping.co.za)
New Forest High School offers a Grade 10 and 11 subject in “Maritime Economics” and works closelywith the industry and with the Institute of Chartered Shipbrokers (ICS) in this regard. They offer theaccredited ICS foundation course as a matric subject.(Contact Details: Tel.: (031) 462 6206 (Ms. Pat Brooker)).
Sithengile Secondary School in Claremont offers a subject Maritime Studies in its Matric Grades.
The University of KZN has a Unit for Maritime Studies, which falls under the Faculty of ManagementStudies and is associated with the School of Economics and Finance. It offers programmes atDiploma, MCom and PhD levels. Contact Details: Tel: (031) 260 2994, Website:http://fms.ukzn.ac.za. The Durban University of Technology (DIT) has a Department of Maritime Studies, which offers a 3-semester course leading to a National Diploma. The requirements for the diploma are the successfulcompletion of three semesters (Level I, II, III), studying six subjects per semester, plus twelve monthsworking as a trainee in industry. (Contact Details: Tel.: (031) 204 2111, Website: www.dut.ac.za.)
From the above it appears that training and education for land-based shipping activities is reasonablywell catered for in Durban. There is however, a large demand for training in the field of truck driving,machine operation and other technical/artisan skills. Most of this is done in-house, but there isprobably an opportunity for the industry to consolidate this under one or more accredited schemes.This appears to be a potential issue for discussion in the Port Liaison Committee, or within a ShippingInstitute should one be formed.
5.3.2.3 Cargo Sector Technology - Most companies indicated that they are fairly competitive interms of technology in their field when compared to international technology best-practice, with a fewindicating that they are not as competitive as they would like to be. The main difficulty in maintainingcompetitiveness being shortage of relevant skills, and costs. The general level of competition wasdeemed to be high.
A key issue is that operations are very time sensitive and it is therefore important to be well equippedin terms of skills and technology.
In terms of technology, 44% said that their sector is not unduly complex, 32% said it is fairly complexand 24% felt it is very complex. Those responding very complex tended to refer to computer and ITsystems, particularly when their company dealt in more than one stage of the value chain. In respectof capital intensity, 44% said very capital intensive and the balance fairly capital intensive, with twocompanies responding not capital intensive. Capital items are mostly in the transport sector, butcargo handling equipment such as cranes, forklifts and conveyor systems can be quite large capitalitems. Cranes, which are expensive are mostly leased or hired where required for short time periods.The main exception was the Export & Import Services sub-sector, which indicated that they find theirbusiness very capital intensive. The technology for most sub-sectors is available and obtained fromboth local and imported sources.
34

All materials sourced by all companies in the Durban Cargo Industry, are available and sourcedlocally in Durban, but are also available elsewhere in KwaZulu-Natal or South Africa.
Warehousing technology is generally outdated by international standards, but is compensated for interms of operating costs by using labour intensive methods. Computerised conveyor and handlingsystems are unknown in Durban and warehouse layout designs are generally inefficient. Whilst somewarehouses have drive-through loading and unloading procedures, many struggle with inadequateparking and turning space. This applies particularly to the large articulated trucks.
The Department of Customs were favourably viewed by all companies interviewed in terms ofsystems efficiency and co-operative attitudes by staff. The whole system of clearing and forwardingappears to be moving towards a fully electronic paperless system. Ideally companies would prefer thecustoms office to be located at Bayhead, but in view of the trend towards a paperless system, thatcould soon be irrelevant.
6.0 ANALYSIS OF SMME OPPORTUNITIES
6.1 SMME Opportunities in the Shipping Sector
Capital is the main barrier for entry for SMME operators. The shipping companies state that there aremany opportunities for SMMEs along the whole supply chain when capital is not the major issue.However, many SMMEs are impatient and tend to want quick results. The following suggestions wereput forward by some of the companies interviewed.
Opportunities for SMMEs appear to result mainly from sub-contracting by the shipping operatorsand agents. These companies typically have assisted owner-drivers to provide transport services,helping them by including them in the company’s insurance cover as it is a problem for them toobtain insurance cover at the right price on their own.
There is potential for SMMEs to be developed in the agency business, clearing and forwarding,and warehousing (providing services such as packing, unpacking, etc.).
Some firms outsource security operations to SMMEs. One company uses 150 owner-drivers with their own trucks but supplies them with trailers (600
trailers in all). The owner-driver scheme provides secure work for truck owners, the shippingcompany does all the administrative work, and such SMME initiatives are regarded as havingbeen very successful.
It should be added that many supporting firms to the shipping lines and agencies are themselvessmall operators with fewer than 10-20 employees.
6.2 SMME Opportunities in the Cargo/Logistics Sector
The majority of the companies use SMME sub-contractors to support their production. A smallminority indicated that they have SMME firms as their customers. Furthermore, many of the servicesupport companies are themselves SMMEs, many having less than 10 employees. Table 25 belowindicates areas of opportunity for SMMEs as recommended by different sub-sectors relating to theirindustry.
Table 25. SMME OpportunitiesSub-sector SMME Areas of opportunity
Cargo Handling & Container Services Assistance to avoid delays at the terminal
Cartage Contractors Unskilled labour, administration services, semi-skilled labour
Customs Clearing & Forwarding Transportation, courier services, warehousing, messenger services, clearing,forwarding, logistics services.
Export & Import Services Fumigation, manufacturing of special pallets, trade on imports & exports, security,transport, property maintenance.
35
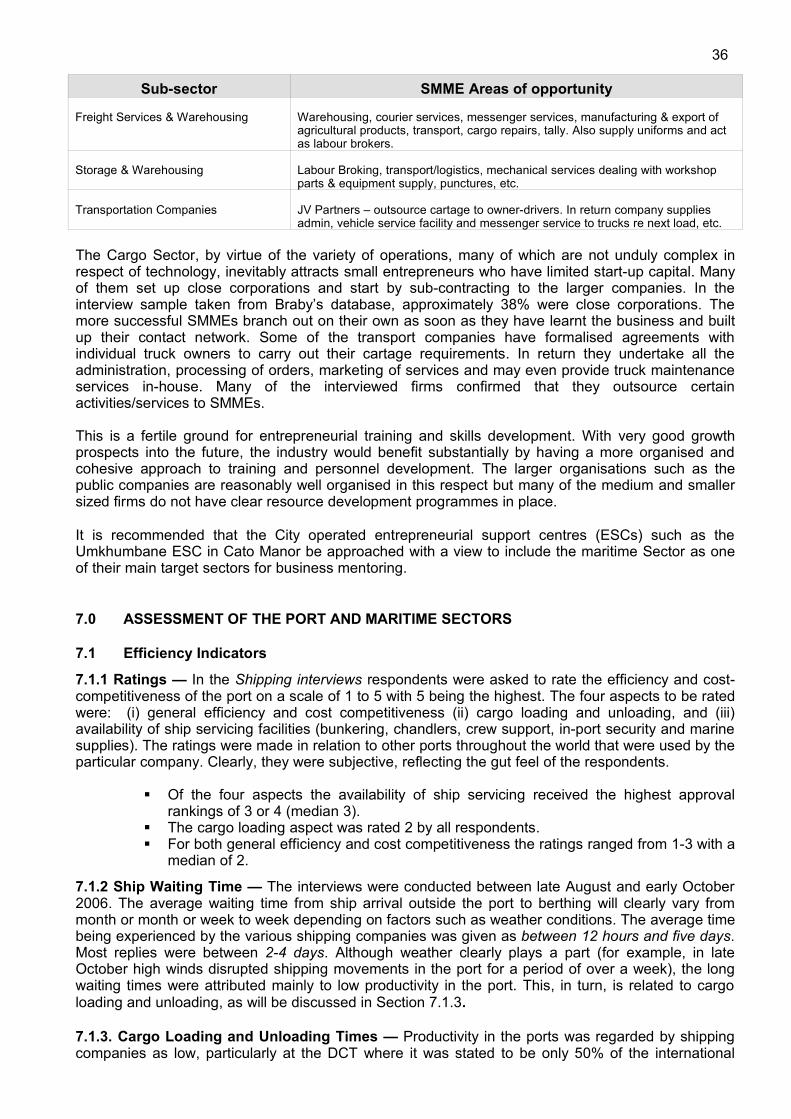
Sub-sector SMME Areas of opportunity
Freight Services & Warehousing Warehousing, courier services, messenger services, manufacturing & export ofagricultural products, transport, cargo repairs, tally. Also supply uniforms and actas labour brokers.
Storage & Warehousing Labour Broking, transport/logistics, mechanical services dealing with workshopparts & equipment supply, punctures, etc.
Transportation Companies JV Partners – outsource cartage to owner-drivers. In return company suppliesadmin, vehicle service facility and messenger service to trucks re next load, etc.
The Cargo Sector, by virtue of the variety of operations, many of which are not unduly complex inrespect of technology, inevitably attracts small entrepreneurs who have limited start-up capital. Manyof them set up close corporations and start by sub-contracting to the larger companies. In theinterview sample taken from Braby’s database, approximately 38% were close corporations. Themore successful SMMEs branch out on their own as soon as they have learnt the business and builtup their contact network. Some of the transport companies have formalised agreements withindividual truck owners to carry out their cartage requirements. In return they undertake all theadministration, processing of orders, marketing of services and may even provide truck maintenanceservices in-house. Many of the interviewed firms confirmed that they outsource certainactivities/services to SMMEs.
This is a fertile ground for entrepreneurial training and skills development. With very good growthprospects into the future, the industry would benefit substantially by having a more organised andcohesive approach to training and personnel development. The larger organisations such as thepublic companies are reasonably well organised in this respect but many of the medium and smallersized firms do not have clear resource development programmes in place.
It is recommended that the City operated entrepreneurial support centres (ESCs) such as theUmkhumbane ESC in Cato Manor be approached with a view to include the maritime Sector as oneof their main target sectors for business mentoring.
7.0 ASSESSMENT OF THE PORT AND MARITIME SECTORS
7.1 Efficiency Indicators
7.1.1 Ratings — In the Shipping interviews respondents were asked to rate the efficiency and cost-competitiveness of the port on a scale of 1 to 5 with 5 being the highest. The four aspects to be ratedwere: (i) general efficiency and cost competitiveness (ii) cargo loading and unloading, and (iii)availability of ship servicing facilities (bunkering, chandlers, crew support, in-port security and marinesupplies). The ratings were made in relation to other ports throughout the world that were used by theparticular company. Clearly, they were subjective, reflecting the gut feel of the respondents.
Of the four aspects the availability of ship servicing received the highest approval
rankings of 3 or 4 (median 3). The cargo loading aspect was rated 2 by all respondents. For both general efficiency and cost competitiveness the ratings ranged from 1-3 with a
median of 2.
7.1.2 Ship Waiting Time — The interviews were conducted between late August and early October2006. The average waiting time from ship arrival outside the port to berthing will clearly vary frommonth or month or week to week depending on factors such as weather conditions. The average timebeing experienced by the various shipping companies was given as between 12 hours and five days.Most replies were between 2-4 days. Although weather clearly plays a part (for example, in lateOctober high winds disrupted shipping movements in the port for a period of over a week), the longwaiting times were attributed mainly to low productivity in the port. This, in turn, is related to cargoloading and unloading, as will be discussed in Section 7.1.3.
7.1.3. Cargo Loading and Unloading Times — Productivity in the ports was regarded by shippingcompanies as low, particularly at the DCT where it was stated to be only 50% of the international
36

norm. This view appears to stem from figures relating to average number of TEUs moved per craneand per berth at a number of ports, as shown in Table 26. Table 26. Container-handling Rates at Various Ports
Country Port No. TEUs perannum
Av. cranemoves/hr.
Av. moves perberth/hr. Year
Colombia Cartagena n.a. 52.0 n.a.USA Virginia Terminals 1,980,000 40.0 69.5 2005Guatamala Santo Tomas 411,153 40.0 2004Japan Yokohama 2,873,288 38.0 78.1 2005USA Seagirt Terminal, Baltimore n.a. 35.0 n.a.China Yantion Container Port 7,600,000 35.0 2005Dominican Rep. Caucedo n.a. 35.0 n.a.Malaysia Westport 3,665,201 35.0 2006Taiwan Kaohsiung 9,774,670 35.0 2006Malaysia Tanjung Pelepas, K/Lampur 4,770,000 33.0 2007Sri Lanka Colombo 2,450.000 32.0 2005Oman Salalah 2,500,000 30.0 2005New Zealand Tauranga 423,138 30.0 2006Spain Algeciras 3,179,614 28.0 53.1 2005Australia Sydney 1,445,000 27.0 2005Djibouti Djibouti 241,122 25.0 2003Malta Malta Freeport 1,461,174 24.0 2004UK Southampton 1,380,000 22.0 60.6 2005USA Portland, Oregon 255,745 22.0 2002USA Conley Terminal, Boston 145,474 22.0. 2002Mauritius Port Louis Container Termnl 893,714 19.4 2001South Africa Durban 1,898,483 17.6 38.2 2005Jamaica Kingston n.a. 17.0 n.a.Gambia Banjul 34,752 15.0 2002
Source: The source of this information is a table provided by two shipping companies for Durbanfrom foreign ports, and various port websites. The companies were unable to provide a reference,and there appears to be no one central source of information on this aspect of port operations. Theoverseas head office of one line stated that there was no official publication containing comparativefigures, and felt that it was difficult to compare ports because of different vessel sizes, trafficvolumes, labour skills, work ethic, and port and terminal conditions. The point was also made that it istechnically more difficult to work ships at a way port such as Durban than at a genuine terminal portsuch as Rotterdam, and that, therefore, comparisons would be unfair.
These caveats notwithstanding, Durban does not appear to feature well by international comparisons.In addition to the ports listed in the table, a number of other comparisons were made by respondentswith reference to the average number of TEUs moved per crane per hour. The figures for Maputo,Walvis Bay and Dar es Salaam were given as 23, for the better West African ports such as Tema 22-24, for Rotterdam 35, and for Singapore and Hong Kong 45-50. An average of 30-35 was regardedas an internationally acceptable rate. It was acknowledged that productivity levels at the DCT haveimproved from 12 containers per crane per hour to 17-18 moves per hour, but it was felt that it couldreach 30 − a level it has achieved at times for short periods.
Berth productivity refers to number of moves for the vessel call, and could involve more than onecrane being used at the berth. Although Table 21 gives productivity at the DCT as 17.6 crane movesper hour, one major shipping line stated that its experience of current gross berth productivity wasbetween 17 moves per hour for the smaller vessels calling at berths 200-201 (where there were oldercranes with more frequent breakdowns) to 27 moves per hour for the larger vessels calling at berths202-204. This company believed that DCT berth productivity should be able to achieve 40-50 movesper hour. It appears that Durban port’s productivity with regard to cargo loading and discharging isindeed lower than that of many ports overseas and of some African ports, especially those in WestAfrica where the servicing of ships was stated to be more efficient than in Durban.
It is clear that the quantity and quality of cranes and other handling equipment have a major effect onport productivity. Some shipping lines believe that cargo-handling facilities are obsolete, and that thisfactor is responsible for bottlenecks that are occurring alongside in the port. RTGs and high-reachstackers are required in order to more efficiently utilise space in the port. In order to move 30-40TEUs per berth per hour, the DCT needs 3-5 gantry cranes per vessel. At present there are only two
37

per vessel and a berth moves 17-18 boxes per hour. The industry points out that Pier 1 in Durbandoes not have the correct equipment for a container port: it was handling only 6 TEUs per hour percrane. There were three cranes, making berth productivity 18 TEUs per hour. SAPO was criticised fornot spending more on landside cranes in order to load trains: rail cranes load 14 TEUs per hour andthere are only two such cranes.
Different equipment is also required to enable the DCT to increase the height of its stacks. Stackingheight depends on the type of operations employed. The straddle carrier operations at the DCT areinefficient, enabling containers to be stacked only 2-3 high in rows one container wide. Rubber-tyredgantries or RTGs (such as are used in Singapore) would enable stacks to be 5-6 containers high andup to four wide.
(See Section 4.3.2 for latest developments at Pier 1 and DCT)
Apart from inappropriate equipment there is also a lack of adequate staff at the DCT, especiallygantry crane drivers and experienced stevedores. SAPO has invested in new cranes and otherequipment but has not increased the number of gangs. Thus, instead of being able to use all 19cranes simultaneously, only 12 cranes can be worked each day because of shifts and absentees.Productivity is low whereas this is not a problem at overseas ports. Within the European and USmodels the port entity operates autonomously under the control of the City. Ports are profitable withhigher productivity than in South Africa, and port work is well paid and prestigious. In South Africa thesalary structure is the same as that of the old South African Railways and Harbours. Today a cranedriver’s job is a high-tech one and has changed considerably over the years without any adjustmentin the salary scale. Crane drivers and straddle carrier drivers determine the productivity of a gang,and should be paid top salaries as they are in Europe and the US.
Poor productivity means that ships have to stay longer in port, thus increasing costs. The averagetime to unload and clear cargo from ships mainly given as 24-28 hours, but one company stated thatthe turnaround time for a large vessel in the port was 4.5 days and for a small vessel 2.5 days,whereas it should not be more than eight hours. In the case of vessels docking at Island View thiswas attributed in part to the poor electricity infrastructure there, which slowed the loading of vessels.Another reason advanced for poor productivity was the fact that DCT is a parastatal monopoly, andtherefore did not have to operate in a competitive environment.
In summary, shipping companies believe that port productivity at the DCT is low by internationalcomparison, and that it can be improved only by considerable investment in capital equipment (adifferent type of train, i.e., RTGs, and high-reach stackers), and by fundamentally altering theinstitutional structure of the port to allow a port authority to operate autonomously alongUS/European lines, ending the parastal monopoly at the DCT and enabling the port authority tointroduce a modern salary structure and attract staff with greater skills. The infrastructure defect thatneeds to be remedied relates to the electricity supply at Island View. The municipality is responsiblefor this, and it could also push, together with port users, for the adoption of a port authority model asa partnership between the municipality and port users.
In response to the above criticisms from the shipping fraternity SAPO’s CEO said on 15 September2006, “Over the next three years, SAPO’s human resource development will be a key focus area,including the completion of refining the container strategy, business model and port-rail integration.Cost containment within SAPO and reducing the costs of doing business in the economy are thecornerstone of SAPO’s strategy. Our customers will benefit from the improved efficiency.”
(For more details see http://ports.co.za/sapo/article_2006_09_15_1850.html)
7.1.4 Offshore Services — Offshore services such as radar and radio communications in the mainwere regarded as being no problem, meeting acceptable standards and using modern equipment.
No particular issues were flagged as problems that needed to be addressed.
7.1.5 In-port Services — Most however, were critical of pilotage delays which were a particularproblem during shift changes and when the helicopter is being serviced as there is apparently noprovision for a rented replacement machine. Harbour pilots are reported to be increasingly inflexible
38
after hours. There was a shortage of pilots, and this leads to delays in the vessels entering port evenif a berth is available; the average pilotage delay was given by a number of companies as two hours.The poor quality of pilots was also regarded as a serious problem. Private tugs and pilots are notavailable, and this shortage can see stevedores on standby for up to 24 hours awaiting the berthingof a vessel.
Dredging was regarded as the main problem. The depth at the DCT at the lowest tide is normally12.2 metres but this has fallen over the last few years to 11.9 metres. Durban requires 12.5-13metres at low tide, but the draft restriction at present is 11.6 metres including safety margins. Bycomparison, the average draught of a ship is 12.5 metres.
Thus, two main issues were identified. These were the critical shortage of pilots, their poor quality,and the lack of adequate dredging. The municipality’s scope for direct action is limited, apart fromacting in concert with port users to put pressure on NPA to address these issues.
7.1.6 Port Costs — Durban was regarded by the shipping industry as a high-cost port. The SAPOtariff was on the high side by international comparison, equipment tariffs being 20-40% above thenorm, while stevedoring was becoming expensive. The NPA’s docking charges are 3-4 times theprevailing world rates, which makes docking costly and lowers the incentive for ships to berth atDurban. The exchange rate also has a significant effect on the industry as costs are incurred in randswhile invoices are submitted in dollars. The up and down movements of the Rand:$ exchange rate atany point in time impacts on costs and profit margins.
High costs were attributed by some companies to the existence of monopolies. Companies werecritical of the change in state policy on privatisation, and felt that government operation of the DCTwas an enormous disadvantage. They felt that it was critical to pursue privatisation as state-ownedenterprises do not run efficient operations. At the multi-purpose terminal all SAPO operations are runat a loss whereas the private sector operates at a profit. The DCT is a monopoly and makes a hugeprofit, but would not survive if the private sector were allowed to compete. The car terminal is anothermonopoly operating at a profit. SAPO’s profits in 2005 were mostly contributed by the DCT and thecar terminal. There is no connection between the provision of services by the SAPO and the chargeslevied. The iniquitous ad valorem wharfage charge has been changed to a cargo-due rate. Despitethe poor service and the lack of investment, the NPA makes substantial profits.
The slow loading and unloading times in the port mean higher costs. Demurrage is paid direct to theshipowners in foreign exchange, and affects the freight rate and unit price. Demurrage could be$10,000-30,000 for a small vessel per day, increasing to $50,000 for the larger vessels. The averagecost to the shipowner of a vessel is $30,000 per day, but ships carrying crude oil can cost as much as$60,000 per day. Ships stay in port for an average of two days. One company pays for fixed berthingwindows, but most do not and they suffer financially because of the time delays.
The key issues that need to be addressed in relation to port costs are very similar to thosesummarised at the end of Section 7.1.3, i.e., the removal of the parastatal monopoly of the DCT, theprivatisation of state-owned enterprises and, by implication, the establishment of an autonomous portauthority for Durban. Similarly, the role for the municipality is along the lines of that set out at the endof Section 7.1.3.
The above views were put forward quite forcibly by some of the larger shipping companies and arereported in a fairly verbatim manner here. These are major strategic issues and it is recommendedthat they be placed on the agenda of the Port Liason Committee so that consensus within theindustry can be judged more objectively and the question of private sector involvement in the DCT bemore intensely debated with the Port authorities. Clearly the industry is anxious to achieve greaterinvolvement in certain key cargo handling activities, believing that it can raise efficiency and lowercosts.
39
Note: It has since been announced that a major dredging programme will be undertaken inconjunction with the widening of the port entrance commencing later in 2007.
7.1.7 International Competitiveness — Mention has already been made of the fact that Durban isnot regarded as internationally competitive in terms of servicing of ships or of costs. Generally, theinternational competitiveness of the port was regarded as poor or no better than average, but mainlypoor. Durban is viewed as having deteriorated and, although it cannot be regarded as a second-classport, it could be turned into a first-class port, which it is not considered to be at present. It is notdeveloping facilities in time, the work organisation is inefficient and performance poor. This wasattributed to the fact that SAPO is a monopoly. In order to accommodate the rate of traffic growth,port operations need to be privatised. Transnet has been slow to understand the problem andorganise itself sufficiently to improve this situation. Individual comments were that Its humanresources are poor, a small number of lines are trying to reduce their operations in Durban, there istoo much pressure on the existing port, and one company is using Port Elizabeth not just as a port ofcall but as a turnaround port.
Although SAPO and the NPA are trying hard to address the problems, they are bureaucracies andmonopolies. Low productivity is an important contributory factor to the declining internationalcompetitiveness. To reach a rate of 35 boxes per crane per hour, political, organisational andstructural problems need to be overcome and middle management and skills at the terminalsimproved. The trade unions are considered a major problem, the DCT and the new Pier 1 havingdifferent unions with resulting problems. The work-to-rule approach of trade unions is a majorstumbling block, and it was felt that Durban could reach 30 boxes per hour in a short period if therewas a change attitudes at the terminal.
An increasing number of shipping agents, stevedoring companies and other port activities areopening offices in Maputo and Walvis Bay as the benefits of the Maputo Corridor and the Trans-Kalahari Corridor are becoming more attractive. A capital investment worth $70 million that had beenearmarked for Durban has now been initiated in Walvis Bay because of NPA apathy in addressingissues central to the potential investment. Substantial investments are being made in Walvis Bayinvolving large companies such as Grindrod and Maersk, in order to increase traffic through the portto Johannesburg via the Trans-Kalahari highway. The Namibian port operator, Namport, is aiming toguarantee a 72-hour turnaround on cargo from portside to Johannesburg. In addition, Walvis Bay issix sailing days closer to Europe than is Durban (a total of 12 days saving per round trip). Whilecapacity at Walvis Bay is currently limited to an estimated 150,000 containers per annum,investments in capacity could increase this figure significantly. There is also potential for furtherdiversion of trade from Durban to Maputo. The issues that need to be addressed in the context of international competitiveness are the same asthose highlighted in Section 7.1.3 and 7.1.6 above, save for the threat to Durban now emerging fromthe Walvis Bay Corridor and, to a lesser extent, Maputo. Competition between ports is obviouslyincreasing steadily. The municipality should possibly consider launching a marketing campaign tosafeguard Durban’s port traffic from being diverted to other regional corridors, by promoting itsvarious attributes through its website.
7.1.8 Port Authority — The prevalent view among shipping companies is that there should be anautonomous port authority in each port. The companies are in favour of inter-port and intra-portcompetition rather than the present policy of centralisation. Some companies believe that centrallyoperated ports cannot be successful. They point out that South Africa has good competition policyand legislation as well as good environmental legislation, and that there is no need for the stateoperation of ports. The business climate should determine what each port would do, and port, rail androad transport inefficiencies would be quickly shown up by the markets. A public-private partnershipalong the lines of the Port of New York Authority would be welcomed by the industry; this wouldinvolve the municipality and the maritime industry in the running of the port.
As pointed out in Section 7.1.3 above, the municipality could act with port users to influence thegovernment to establish an autonomous port authority for Durban.
7.1.9 Cargo/Logistics Sector Assessment of the Port — The companies in the cargo sector wereasked some specific questions relating to the port as it affects their operations. They were also askedfor their views on the general competitiveness of the port.
40
Question 1. “Where do you find the main bottlenecks in the Durban cargo handlingsystem to be?”
Maydon Wharf was singled out by those companies located there as having a dated township layout,which was originally designed for rail transport. Now that articulated trucks are the order of the day,severe traffic bottlenecks occur daily. There is insufficient truck parking and problems with lack ofturning space. The properties are not designed for easy truck entry and exit. When there is a trainshunting the entire road system seizes up causing lengthy delays. There are also serious problemswith stormwater drainage and environmental maintenance. Vagrants and petty theft are a problem.
Container Depots – There are insufficient depots and the existing ones are crowded with pooraccess. There is a strong preference for proximity to the port within a maximum radius of 5 Kms. Itwould be more efficient if the different categories of containers could be separated into broad groupssuch as the following:
• Full Containers for local delivery• Full Containers for inland delivery• Full Containers for shipping• Empty containers for each of the above destinations• Transhipment containers
An additional Container terminal was also recommended. Difficulties are experienced in balancing upoutbound and inbound container loads for the long distance hauliers. This is related to the imbalancein import and export cargo profiles, where the latter has a higher proportion of bulk cargo. There wassignificant support for a container depot at Cato Ridge amongst companies who do business withinland companies. The point was strongly made that it would make sense particularly when the railtransport service is upgraded.
Question 2 – “What is your experience of the average time(i) To gain access to Durban Container Terminal (DCT)?(ii) To unload and clear cargo from ships?”
Answers to Part (i) – Respondents said anywhere from 2 to 7 hrs, depending on the time of the day,with ± 4 hrs the norm. Trucks that arrive early are dealt with in less than half an hour but by mid-daythere is a queue of at least 4 hrs.
Answers to Part (ii) – There was substantial variation in the answers, with most respondents focusingon the delay from arrival of the ship in the bay. There were also differences between containerunloading and bulk and breakbulk. In general they said it takes about 2 days from the time the vesselarrives in the bay but bulk ships are often delayed for longer. Once berthed the unloading proceedsat about 17 containers an hour. For bulk liquid the situation is similar, with 2 days delay after vesselarrival and approximately 2 hrs to load or unload a tanker truck.
There were some severe criticisms about worker attitudes at DCT such as protracted delays atchange of shifts, work stoppages at tea time irrespective of the number of trucks waiting, and thatthere is much inefficiency in the operating system.
Of particular interest was the recommendation that SAPO consider introducing something similar tothe PierPass system used in California. This system differentiates charges for trucks entering thewharfside area according to the time of the day. Attractive incentives are offered for night-timeloading/unloading. Apparently California had serious congestion problems and the introduction of thePierPass system produced immediate improvements.
One operator provided the following estimates of typical costs to transport carriers:
“ DCT presently handles approx. 2500 road gate moves per day. At peak periods a delay of up to 2-3hrs extra can be incurred by road transport. This delay can affect approx. 600 trucks daily. At a costof R300 standing time per hour, 600 trucks equates to R360 000 per day, or R100 million over a 280-day working year. These costs have to be built into the base-price of the transport.”
Question 3 – “General comments on international competitiveness of Durban Port”
41
Whilst some of the respondents conceded that there have been improvements during the past twelvemonths, the general view of the efficiency and competitiveness of port operations are that they are atbest average. The following are some of the main viewpoints.
Several cargo companies were in favour of privatising DCT and other port operations. Continuity of terminal management is seen as important and it is felt that management
changes have been too frequent. Certain restrictions on the private sector tend to favour SAPO, i.e. the playing fields
are not level between SAPO and private operators. Security is generally poor and crime management is lacking, e.g. theft off rail cars and
parked trucks.
Customs Clearing – Very efficient but location of Customs offices not ideal for transport carriers. Assystem becomes more electronic this may solve problem.
Traffic – There are many serious bottleneck areas, e.g. Bayhead Road, Island View, Maydon Wharf,Esplanade, Point Road (heavy trucks, car terminal). The Bayhead congestion is a major issue andtwo improvements are seen as urgent priorities, viz. the construction of the Khangela Bridge fromBayhead Road to Sydney Road, and the construction of the link road from Langeberg Road to EdwinSwales Drive.
There are problems with truckers stopping in Edwin Swales Drive to purchase food, etc. Trucksregularly break traffic lights, stormwater drain covers, bollards and pavements. It is felt that thereshould be a permanent traffic police presence along Edwin Swales Drive, with pointsmen etc.
7.2 SWOTS Analysis of Shipping and Cargo/Logistics Sectors
7.2.1 Shipping Sector SWOTS
Strengths WeaknessesStrong International Representation Distance from Head OfficesStrong local shipping companies Port’s inability to handle very large vesselsOver a century of local experience High local costs Forward integration into cargo logistics Skills development structures Good pool of local skills
Opportunities ThreatsAccess for Post-Panamax vessels Port inefficiencyDurban’s potential as a hub port Port delaysSouthern African economic growth Too many port stops along SA coastNPA/SAPO Capex programmesMore privatisation of port cargo operationsA more effective model for port management Better Industry Institutional co-operation
7.2.2 Cargo/Logistics Sector SWOTS
Strengths WeaknessesHigh diversity of operations Dated warehousing designsOver a century of local experience Dated materials handling systemsGood pool of local skills Insufficient container parksDiversification of larger groups Lack of modern logistics parks
42
Lack of adequate truckstopsTransport bottlenecksWeak rail systemPort Delays
Opportunities ThreatsRedevelopment of Maydon Wharf Port Cargo handling inefficiencyRedevelopment of Clairwood & Jacobs Inefficient road structures
Transnet Rail Capex programme Competition from other ports (Walvis Bay,Better Industry Institutional co-operation Ngqura, Maputo, Richards Bay)
Skills development systems
7.3 Port Layout and Capacity
The shipping industry is very concerned about the ability of Durban to continue to be a majorcontainer, bulk and breakbulk port. With container traffic growing at about 10% per annum andgrowth of about 8% forecast over the medium term, how to accommodate new traffic is a majorissue. Some new traffic can be handled merely by efficiency gains but the provision of new berths isalso required.
The question of productivity was dealt with in Section 7.1.3 above. If the DCT were able to reach theacceptable international rates of crane and berth moves per hour mentioned in that discussion, itcould handle at least 40% more containers (and perhaps even double the number), and eradicate thecongestion problem for the next five years or more, thus coping with the growth in trade for thisperiod. One company pointed to the example of Hong Kong where there are six major terminals inclose proximity, one of which, no bigger than berths 204-206, handles twice the DCT volume. Adramatic increase in productivity would go a long way to solving Durban’s congestion problems, andthe port authorities tend to lose sight of the fact that the problem does not entirely revolve around ashortage of berths.
Nevertheless, this would not obviate the need to install additional berthing capacity by about 2012-2015.
As previously discussed, considerable work needs to be done in the port in order to accommodatethe increase in ship size. The next generation of ships due to come into operation in 2008 will carry5,500 TEUs. One shipping line calling at Durban is constructing post-Panamax vessels that are 40metres wide, 272 metres long and carry 5,552 TEUs (internationally they exceed 300 metres). Safetylimits in the entrance channel are currently inadequate for such vessels to be brought into the port ofDurban and the NPA are currently busy with a major capital programme aimed at both widening anddeepening of the entrance channel as well as deepening at berths. Deepening is generally regardedas the higher priority and has become very urgent.
In addition to access problems there are also environmental issues surrounding the expansion of thepresent port. Even if the number of berths is increased, the harbour deepened and the entrancewidened, this would not be sufficient to cater for traffic growth beyond another 20 years. In planningexpansion, however, it is regarded by the shipping industry as absolutely essential that it beconsulted at all stages. The industry believes that top international consultants with experience ofdevelopment of major ports elsewhere should be commissioned to assist in port planning. Theyargue that the planning processes employed at Rotterdam and Singapore should be benchmarks forDurban if costly mistakes such as the construction of the “slab” at the Point are to be averted, andthat it is imperative that both the NPA and the city understand what internationally competitive portswill look like in 20 or 30 years time.
The situation has been aggravated by the rapid escalation in motor vehicle cargo volumes, bothimport and export. Volumes are expected to continue growing over the next 10 years. Urgentdiscussions are in progress between the city and Transnet as to the optimal location for an additionalcar terminal. The decision is a complex one as in the longer term the question of a possible dig-outport expansion also comes into the equation.
43

One of the dangers is that the Automotive industry is a highly fashion conscious industry andtechnological change is rapid. Alternative energy sources to oil are being seriously considered. It isvirtually impossible to predict the global structure of the Auto industry beyond the next ten years.Durban might find itself in the pound seats, but our local plants may also find themselves technicallyout of step with new developments. Fashion can be a ruthless destroyer as General Motors haveexperienced in the US.
Dig-out Port Options – Talk about the siting of a dig-out port expansion is appropriate at present, butlack of consensus about the best format and location is creating a great deal of uncertainty amongsttown planners and property developers, let alone business investors. Instead of postponing thisdecision to the eleventh hour, it would be much more helpful, particularly to the City, if the decisioncould be brought forward as it has very wide implications for the direction of Durban’s economicdevelopment.
7.4 Other Strategic Issues
7.4.1 Richards Bay Factor — There is a lobby of opinion, which advocates moving most of thebreakbulk and bulk cargo to Richards Bay, and for Durban to focus on containers, bulk liquids andmotor vehicles, with only small quantities of other cargo types. This is the so-called “easy” route, butthe economic implications for Durban are very serious. As has been outlined in previous chapters, thecargo/logistics pipelines involve a large number of companies, which are collectively very substantialemployers. A quick decision to rationalise Durban’s cargo mix by moving large chunks to RichardsBay would destroy hundreds of local jobs and severely impact on the city’s economy. Ships also findit economically unattractive to carry split cargos to two closely located ports. Thus strategic moves ofthis nature should be treated very circumspectly and at the very least, first discussed and negotiatedwith the local industry to quantify the full economic implications before any formal decision is taken.
It is possible that some of the cargo destined for Gauteng could be effectively routed throughRichards Bay, but cargo for Durban, most of KwaZulu-Natal and the Free State is more costefficiently routed through Durban. It is also very important to maintain reasonable diversity in thecargo mix as it is less risky than having too many eggs in one basket and many of Durban’s shippingfirms are set up to handle cargo diversity.
7.4.2 Environment and Tourism — In addition to environmental issues regarding the expansionof the port and the provision of more berths, there are concerns regarding the polluting effects ofsome existing cargo handled. In particular, the handling of scrap steel at Maydon Wharf wasmentioned as an error. Scrap, together with old vessels, which should not be allowed into the port,pollutes the water in the harbour.
Tourism is a central economic activity in the metropolitan region, and the bay has an important role toplay in the further development of this sector. However, the international security aspects and theconsequent need for control must be borne in mind. The shipping industry would prefer the southside of the bay to be devoted to commercial freight activities with the Esplanade and Point areasbeing the focal points of recreation, tourism and passenger facilities. It was pointed out that a workingharbour such as Durban, sharing the bay with non-commercial activities, should be an added touristattraction for the city, but that it needed to be properly planned, developed and marketed.
The bay is underdeveloped so far as facilities for long-shipping activities are concerned, the resultbeing that it does not make the contribution to the city’s tourism sector of which it is capable. Themunicipality needs to accelerate upgrading of the Esplanade and Point areas, especially bycontrolling the volume of heavy-vehicle and hazardous goods traffic, and to invest in the improvementof facilities for sporting activities such as sailing and rowing.In this respect and in light of the good progress being made with the Point development, the siting ofa cruise-liner/passenger terminal linked closely with a waterfront entertainment and leisure area, isbecoming important. International cruise-liners, including the QE2 have docked regularly at Durban inthe past, and apart from the direct injection of spending, will generally enhance the local tourismimage.
7.4.3 Cargo Growth Projections
44

7.4.3.1 Bulk & Breakbulk — It is difficult to forecast future volumes of bulk and breakbulk cargoes,and the total cargo handled in these two categories has averaged growth of only 1.6% pa over thepast ten years. However there has been a great deal of uncertainty during that period due to thepolitical changes, during which import tariff protection has been substantially reduced. The industrialsector has undergone a major restructuring process and China has become a major importer of basicresource-type raw materials and a major exporter of budget priced consumer goods.
For the purposes of looking into the future, three growth scenarios have been used to help assessthe future needs of the port and especially the cargo/logistics sector of the City. The three growthrates selected are 2%, 3.5% and 5%, and the compounding effects of these three growth rates areshown in Table 27 below.
Table 27. Three growth scenarios – Bulk & Breakbulk (‘000 Tons) 2006 2010 2015 2020
3 Scenarios:2.0% pa3.5% pa5.0% pa
43,86143,86143,861
47,47750,33253313
52,41859,77868,043
57,87470,99886,841
Effective Growth %:2.0% pa3.5% pa5.0% pa
---
8.2%14.8%21.5%
19.5%36.3%55.1%
31.9%61.9%98.0%
Thus if a compound growth rate of 2% pa is achieved, by 2020 the tonnage handled will have grownby almost 32% to around 58 million tons, and if the most optimistic scenario of 5% pa is achieved,cargo volumes will have more than doubled. Given the rate at which the SA economy is improving itis reasonable to expect volumes to be up by around 20% by 2015 and 30 – 35% by 2020.
7.4.3.2 Container TEUs — During the current financial year it is expected that approximately 2,3million containers (full plus empty) will be handled through the port. Of these approximately 1,65million will be full. In Table 28 below a four-year-moving-average of the annual per cent change intotal TEUs handled has been calculated.
Table 28. Annual % Change – 4 year moving average
The growth rate has accelerated continuously from 1998 and over the four years to March 2007 isexpected to exceeded 14% pa on average. The question is at what rate will it increase over the next15 to 20 years?
The SA economy is being well managed at present and its position in world trade is growing moresecure each year. World Trade is on a long-term growth trend of around 5% pa at present and SA,because of the improving internal political situation and rapidly growing consumer spending power,can reasonably expect to exceed this figure by 3 or 4 %. Thus a growth rate of TEUs through the portaveraging around 8-9 % pa from now until 2020 seems to be a realistic expectation.
45
4.85.47.69.49.0
12.414.3
1998 – 20011999 – 20022000 – 20032001 – 20042002 – 20052003 – 20062004 – 2007 est.
% Change4 Year Period

The impact on containers handled from a starting point of 2,3 million TEUs in 2006/07, of fourdifferent growth rates is shown in the graph below.
Diagram 6. Alternate Projections of Full TEUs handled
Full TEUs handled ('000s)
0.0
1000.0
2000.0
3000.0
4000.0
5000.0
6000.0
7000.0
8000.0
9000.0
TEU
s
Growth rate 5 % Growth rate 10 % Growth rate 7,5 % Growth rate 2,5 %
From the projections shown above, it can be seen that by 2013 the 7.5% pa yellow line is at around3.5 million TEUs and by 2020 it has reached 6 million TEUs. Present plans to increase containercapacity in the port include the conversion of Pier 1 into a container terminal with a throughput ofaround 700 000 TEUs pa plus further productivity improvements to the existing Durban ContainerTerminal. That should take the port’s capacity to between 3 and 4 million TEUs pa. which shouldcope with its needs until around 2014. Additional capacity will need to become available by then totake the port through to 2020 and possibly beyond.
If that additional capacity should be created by means of a dig-out port on the present airport land,then a major rearrangement of the cargo logistics sector will be triggered off. Not only will the sectorhave to expand its capacity to handle the additional volumes, but traffic flows will change substantiallyand the pressure to reduce costs and become efficient will escalate. Even if extra capacity is createdwithin the port e.g. by expanding the port into the Bayhead area, the above restructuring of the City’slogistics network will have to undergo substantial change and upgrading.
7.4.4 The Ship Building and Repair Sector — There has been much debate over the future roleof this sub-sector. One of the key issues is that it is clustered in the Bayhead Marine Industrial Parkbetween the Drydock and the Silt Canal. This area could be subject to major reconstruction shouldthe Bayhead be dug out to provide additional container berths and handling areas.
The Industrial Park was funded through a development loan from the KZN Provincial Governmentand was aimed at creating a cluster of marine businesses, which, if the need arose, could co-operateand collectively complete a shipbuilding contract. There are a total of 42 companies now locatedwithin the Park, each specialising on a specific aspect of ship building, maintenance or repair.
In a port the size of Durban, it is critical to have a competent and versatile ship repair sector. This isalso a natural source of income and employment. To the sector’s credit its members have a strongpool of marine engineering skills and enjoy a good reputation for the quality of their service. It isessential that this sector is encouraged and supported to ensure that they not only remain in place,but that they are able to grow with the rest of the maritime industry.
46
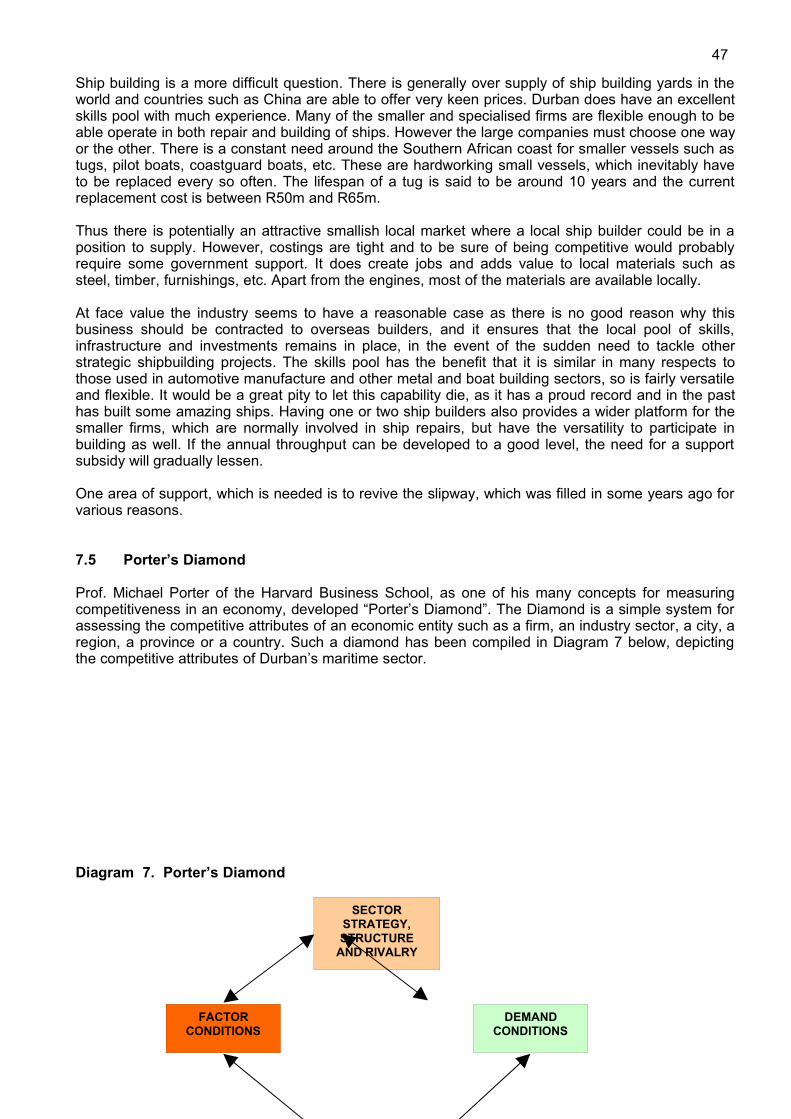
Ship building is a more difficult question. There is generally over supply of ship building yards in theworld and countries such as China are able to offer very keen prices. Durban does have an excellentskills pool with much experience. Many of the smaller and specialised firms are flexible enough to beable operate in both repair and building of ships. However the large companies must choose one wayor the other. There is a constant need around the Southern African coast for smaller vessels such astugs, pilot boats, coastguard boats, etc. These are hardworking small vessels, which inevitably haveto be replaced every so often. The lifespan of a tug is said to be around 10 years and the currentreplacement cost is between R50m and R65m.
Thus there is potentially an attractive smallish local market where a local ship builder could be in aposition to supply. However, costings are tight and to be sure of being competitive would probablyrequire some government support. It does create jobs and adds value to local materials such assteel, timber, furnishings, etc. Apart from the engines, most of the materials are available locally.
At face value the industry seems to have a reasonable case as there is no good reason why thisbusiness should be contracted to overseas builders, and it ensures that the local pool of skills,infrastructure and investments remains in place, in the event of the sudden need to tackle otherstrategic shipbuilding projects. The skills pool has the benefit that it is similar in many respects tothose used in automotive manufacture and other metal and boat building sectors, so is fairly versatileand flexible. It would be a great pity to let this capability die, as it has a proud record and in the pasthas built some amazing ships. Having one or two ship builders also provides a wider platform for thesmaller firms, which are normally involved in ship repairs, but have the versatility to participate inbuilding as well. If the annual throughput can be developed to a good level, the need for a supportsubsidy will gradually lessen.
One area of support, which is needed is to revive the slipway, which was filled in some years ago forvarious reasons.
7.5 Porter’s Diamond
Prof. Michael Porter of the Harvard Business School, as one of his many concepts for measuringcompetitiveness in an economy, developed “Porter’s Diamond”. The Diamond is a simple system forassessing the competitive attributes of an economic entity such as a firm, an industry sector, a city, aregion, a province or a country. Such a diamond has been compiled in Diagram 7 below, depictingthe competitive attributes of Durban’s maritime sector.
Diagram 7. Porter’s Diamond
47
SECTORSTRATEGY,STRUCTURE
AND RIVALRY
DEMANDCONDITIONS
FACTORCONDITIONS

Table 29. Durban Maritime Industry Competitive Attributes (Porter’s Diamond Format)
Sector Structure, Strategy and Rivalry : + Core of large scale investments + Well diversified, all services well covered + High levels of competition + Good forward integration of large firms + Mix of local and international firms + Competent Shipping Agents pool + Weak inter-port rivalry + Competent ship building & repair cluster - Dated warehouse technology - Dated logistics parks (Maydon Wharf) - Port capacity limitations - Port inefficiency - Port vessel size limitations - Strong inter-company competition - Weak organised Industry institutions
MODERATE / WEAK
Factor Conditions : + Strong clustering around port + Large pool of skills experience + Service and material requirements available locally + Wide mix of state and private cargo terminals in port - Weak skills development structures - High profile on labour issues - Lack of container parks - Lack of Truckstop - Serious transport bottlenecks (road system)
MODERATE
Related & Supporting Industries : + Toyota Factory & components sector + Steele and Engineering Industry + Local Timber & Wood Products industry and sectors + Sasol and other Chemical exportersGovernment Support : + NPA and SAPO capex programmes + MIDP automotive support programme - Weak rail service - Protracted decision making
GOOD
Demand Conditions : + Buoyant international trade + Strong domestic economic growth + Strong containerised cargo, automotive, bulk chemicalsgrowth + Steady bulk & breakbulk demand + Increasing containerised exports + Increasing bulk & breakbulk exports (China, et al) - Increasing competition from other ports
GOOD
From the above it can be seen that although market demand conditions are good, the industry hasseveral notable weaknesses. These are mainly in terms of its structure and lack of a comprehensivestrategy, as well as certain of the factor conditions such as transport bottlenecks, dated logisticsfacilities, lack of a comprehensive approach to providing skills, and a weakly developed industryinstitutional structure. Port capacity limitations and low efficiencies are also negative competitiveattributes.
8. MUNICIPAL INTERVENTION OPPORTUNITIES
8.1 Urgently Required
8.1.1 Roads and Traffic Congestion — There are serious problems with road access in and outof the port area, particularly to the Durban Container Terminal (DCT). The queue of heavy vehiclesoften stretches from the DCT to the dry dock and transport companies reported average waitingtimes during the day averaging around 4 hours. The main access problem is Langeberg Road at theBayhead, and there is no provision for truck parking. Langeberg and Bayhead Roads are severelycongested, causing problems with regard to deliveries to the DCT, while Maydon Road has alsobecome clogged with heavy vehicles passing through en route to Bayhead Road. These vehiclespark in Maydon Road because there are no vehicle parking facilities at the Bayhead, and there is a
48
RELATED ANDSUPPORTINGINDUSTRIES
strong view that Maydon Road should not be a through route. By contrast, it was pointed out that thefruit industry had developed its own truck stop at Springfield Park from which fruit cargo is deliveredto the port.
There are two urgent projects which have been on the drawing board for some time, which whenimplemented will have an immediate positive effect. These are
– Construction of the Khangela Bridge to Sydney Rd., which has become a priority;– Construction of a link road connecting Langeberg Road to Edwin Swales Drive.
Neither of these projects is straightforward, as there are some substantial impediments which mustbe dealt with. The link road to Edwin Swales Road for instance must deal with a spider’s web ofrailway lines running in and out of the old marshalling yards. Nevertheless these are seen by theindustry as key short-term projects. There is also a certain amount of open land between BayheadRoad and the marshalling yards which could possibly be turned into a holding area for trucks insteadof having them blocking Bayhead Road while they wait to gain access to the DCT. This could beviewed as a temporary solution while the optimal re-planning of the Bayhead area is underconsideration.
Investigate PierPass System – The PierPass System was developed in California where theyexperienced serious truck congestion into the Los Angeles and Longbeach Ports. PierPass was anindustry solution, which was structured around incentives for cargo carriers to enter the port at non-peak times on a 24 hour basis. The system was immediately successful. It needs a specialmanagement and funding structure, which can be handled by the industry. The system could possiblybe advantageously adapted to Durban’s situation. There is knowledge of the system amongst certainmembers of the local industry, who are interested in taking the matter further.
“ DCT presently handles approx. 2500 road gate moves per day. At peak periods a delay of upto 2-3hrs extra can be incurred by road transport. This delay can affect approx. 600 trucks daily. At a costof R300 standing time per hour, 600 trucks equates to R360 000 per day, or R100 million over a 280-day working year. These costs have to be built into the base-price of the transport.”
Maydon Wharf – This logistics park is very dated in design and where it used to be a useful short cutto the Bayhead area, it now frequently becomes congested during the day. The main problem is thelayout, which was designed around rail transport. With the major transfer to heavy road carriers thelarge trucks have no parking space and struggle with turning and access to the various warehousesand dockside terminals. When there is a train shunting rail trucks into the various sidings, the roadtraffic comes to a complete standstill. A new management system for traffic is required, and through-traffic probably needs to be curtailed during peak periods. Construction of the Khangela Bridge wouldfacilitate re-routing of through-traffic into the Bayhead and Edwin Swales areas.
Victoria Embankment and Point Road – There is also congestion caused by heavy trucks up anddown the Victoria Embankment and Point Road. This is caused by the need to access the Carterminal, the City Multi-Purpose Terminal and T-Jetty berths. The solution to this lies in therationalisation of the cargo mix and the transfer over time of most of the bulk and breakbulk to thesouthern side of the port. Dedicated access roads through the lower end of the city centre may alsocontribute to a solution. Ultimately the objective should be to eliminate all truck traffic in Point Road.
For Victoria Embankment there is a need to increase the percentage of cargo transported by train,especially vehicles to and from the Car terminal. This will especially apply if the capacity of the carterminal is further increased. It is a matter that needs attention. Victoria Embankment is becomingone of the main cluster areas for shipping companies. Business parking and pedestrian security havebeen raised as problem areas. The payment method for the parking meters is considered impracticalbecause people coming for meetings seldom carry sufficient high denomination coins to cover the“no-change” charges, hence the low utilisation, especially on the port side..
8.1.2 Electricity — The electricity infrastructure at Island View was reported as being inadequate totake the load required for the pumping of liquids, and thus the volumes pumped are restricted andthis affects logistical and port efficiency. Another complaint was that voltage variations arising from
49

peaks and troughs in the electricity supply damage equipment at Bayhead companies. Themunicipality should investigate the problems at Island View and take remedial steps.
8.1.3 Security — Security services are not provided by the municipality, but they were rated as amajor problem by almost all respondents, and this is an area in which it was felt that the municipalitycould and should intervene with the responsible authority. Some companies in the CBD feel obligedto pay for off-street parking for staff as a security precaution. Some firms state that staff do notventure out of the office during the lunch hour for fear of being mugged in the streets.
Staff also feel insecure in the harbour area, and reference was made to a successful municipalprogramme in Barcelona where a dodgy area similar to the Point was cleaned up in 2-3 years.Women are reported to be loath to use boating facilities on the Bay because of insecurity. Muggingon the Esplanade deters customers from frequenting Bayside restaurant and club facilities, andvisiting yachtsmen have suffered at the hands of criminals, thus leading to a perception that Durbanis not a safe city for the yachting fraternity and to a consequent loss of custom to Cape Town.Parking is regarded as a problem for the yacht mole, pleasure cruise and restaurant areas.
It is clear that the security situation in the environs of the port leaves much to be desired, and theDurban economy as well as the welfare of people could gain from the overcoming of this problem.The municipality should convene a security task group to work with SAPS on this issue.
8.2 Further Opportunities
8.2.1 Rating of Utilities — In the interviews with respondents, they were asked to rate theefficiency of the municipality in respect of nine aspects of utilities on a scale of 1 to 5 with 5 beingvery good. The nine aspects were: dealing with environmental, waste and effluent issues; keepingindustrial townships clean; maintaining roads, verges, walkways, green areas; maintaining efficienttraffic flows; providing adequate turning space/areas for large trucks; providing adequate taxi and busranks for employees; providing adequate public transport for factory shift workers; providing electricityinfrastructure; and providing water infrastructure.
The shipping sector exhibits considerable diversity, and it became apparent during the interviews thatall these aspects did not apply to all respondents, but they were frequently not considered to be ofparticular significance, and that the few who attempted to rate were doing little more than hazarding aguess. Thus, there was no point in pursing the ratings scale.
These nine aspects were then grouped into three major problem areas, namely, roads and traffic,public transport, and environmental issues. These are dealt with elsewhere in this chapter (seebelow) In addition, two aspects not listed and not necessarily provided by the municipality emergedas major problems. These were security and telecommunications.
Cargo/Logistics Sector – Tables 30 and 31 indicate the results from interviewed cargo/logisticscompanies as they rate and rank the municipality utilities services/infrastructure.
Table 30. Rating of Utility Services (Scale: 5 = Very good, 1 = Very poor)
UtilitiesUtility Rating
CH&CS CC CC&F E&IS FS & W
1. Dealing with environmental, waste andeffluent issues 3.2 3.6 2.8 3.3 2.82. Keeping your industrial township clean 1.2 2.4 2.8 2.7 2.93. Maintaining roads, verges, walkways, greenareas 2.2 2.6 2.8 2.3 2.14. Maintaining efficient traffic flows 1.6 2.5 2.0 2.0 2.35. Providing adequate turning space/areas forlarge trucks 2.4 2.0 2.6 0.7 1.96. Providing adequate taxi ranks, bus ranks foremployees 1.0 3.0 3.0 1.0 2.07. Providing adequate public transport forfactory shift workers 1.4 2.8 3.2 2.7 1.8
50

8. Providing electricity infrastructure 4.0 4.1 4.0 3.3 3.89. Providing water infrastructure 4.0 4.1 4.0 3.7 3.9CH&CS= Cargo Handling & Container Services; CC=Cartage & Transport Carriers;CC&F=Customs Clearing & Forwarding Services; E&IS=Export & Import Services;FS&W=Freight Services, Storage & Warehousing.
(See also Annexure G)
Apart from Electricity and Water infrastructure, which were both consistently rated above average(Average = 2.5), most of the scores were around average with some notable problem areas. Belowaverage ratings were common throughout for (i) Maintaining efficient traffic flows, (ii) Providingadequate turning space/areas for large trucks, (iii) Providing adequate taxi and bus ranks foremployees. Environmental waste and effluent issues scored above average, whilst cleaning ofindustrial townships and road/verge maintenance were approximately average. It is notable that thecompanies which are most sensitive to traffic movement scored those aspects lowest.
Ideally one would like to see scores in all areas reaching between 3 and 4 with some scoring over 4.The majority of the companies indicated that the only problems they have with the Municipality utilitiesservices/infrastructure are road maintenance, maintaining efficient traffic flows and providingadequate turning space/areas for large trucks. They believe the municipality can intervene and makea difference in the above needs/problem areas.
Table 31 Utility Importance Ranking (1 = Most important, 9 = Least important)
UtilitiesAve. Utility Importance Ranking
CH&CS CC CC&F E&IS FS & W1. Dealing with environmental, waste andeffluent issues 5.6 6.1 5.4 7.5 4.12. Keeping your industrial township clean 6.6 5.9 6.6 8.3 6.13. Maintaining roads, verges, walkways,green areas 5.2 3.1 5.6 4.0 5.74. Maintaining efficient traffic flows 4.2 2.1 4.2 3.0 3.05. Providing adequate turningspace/areas for large trucks 4.6 2.3 7.4 4.3 5.06. Providing adequate taxi ranks, busranks for employees 3.0 5.7 5.2 2.5 6.07. Providing adequate public transport forfactory shift workers 3.2 5.3 6.0 3.8 4.98. Providing electricity infrastructure 5.0 6.6 1.6 5.0 4.39. Providing water infrastructure 6.6 7.7 3.0 6.8 5.7CH&CS = Cargo Handling & Container Services; CC= Cartage & Transport Carriers;CC&F = Customs & Clearing Services; E&IS = Export & Import Services;FS&W = Freight Services & Warehousing;
(See also Annexure H)
The ranking exercise did not produce clear-cut preferences. The lowest scores (most important) weremostly around traffic and public transport issues. The Customs Clearing and Forwarding groupplaced much emphasis on electricity and water. This is because their operations have a heavy officeworker bias and operating of computers is of paramount importance. On reflection, all of the nineitems listed are important, hence the reluctance of the interviewees to score any of them negatively.
8.2.2 Public Transport — The poor public transport system in Durban was a major problem forcompanies because of the long commuting times and other difficulties experienced by staff in gettingto and from work. Staff used a variety of transport arrangements ranging from private (own vehiclesand lift clubs) to public (Metrorail, buses and taxis). It is mainly the lower echelons of the office staffas well as the unskilled and semi-skilled workers who use public transport. These individuals tend tolive in areas such as KwaMashu, Phoenix, Chatsworth and Umlazi which are some distance from theCBD and the port areas. Their trips thus involve relatively long distances and travel times.
51
It is widely acknowledged, even by the government, that South Africa’s public transport system ispoor, and Durban is not alone in this regard. One company stated that if Durban had a “half-decent”public transport system, it would not still have its offices in the CBD. Overseas shipping lines drewunfavourable comparisons between Durban and foreign cities in terms of public transport. Theproblem is particularly acute for shift workers; thus, for example, a stevedoring company collects itslabourers at Dalbridge Station as there is no public transport direct to Bayhead.
As the exceptionally poor state of South Africa’s public transport system has been fully acknowledgedwithin government, Durban and other major municipalities should press the central government onthe adoption and implementation of a new public transport policy. This would necessitate massiveinvestments in rapid, mass people-movers that are reliable, cheap and safe, and that offer acomprehensive grid of services across the metropolitan area. It is hoped that initiatives aimed atproviding interim remedies in time for the 2010 Soccer World Cup will trigger off proper longer termsolutions to this critical problem.
The municipality has indeed mooted a number of innovative systems for areas such as thebeachfront to cater for tourists, but the real problem for those in employment is the trip from home towork. Within the municipal area this can involve trips of up to 50km or more, and clearly the presentreliance on mini bus taxis satisfies none of the attributes mentioned above.
8.2.3 Telecommunications — A small number of respondents complained of thetelecommunications system operated by Telkom. The speed in Durban is regarded as being slowerthan in East London or Port Elizabeth, and it was reported that it frequently takes more than 24 hoursto respond when computers are down. Similar problems are not experienced in other ports, and thereis a serious capacity problem in Durban. It was felt that lack of competition in the telecommunicationssector exacerbated the problem. Because this problem was disadvantageous to Durban in thecontext of the South African port system, it was felt that some intervention from the municipality mighthelp.
The municipality should request the Chamber of Commerce Infrastructure Committee to discussthese allegations with Telkom.
8.2.4 Container Parks and Logistics Parks — The interviews contained questions relating tocompany attitudes to container parks, the best location for such facilities, and the notion of CatoRidge as a major cargo redistribution centre.
There are insufficient Container Parks and the existing ones are crowded with poor access.
(See page 38).
Some firms were satisfied with their existing warehousing and logistics facilities, and had no interestin container parks. Proximity to the port was a major consideration for most firms. Some were infavour of a logistics park somewhere between Bayhead and the present airport in order to replacewhat they had lost in the agency building at the DCT. The park should not be too far from the portofftake area, and should be close to business as proximity to clients is important for some operations.One company quoted the case of Australia where logistics parks operate as one-stop shops close toa port or airport.
Because of physical constraints to the expansion of the port, there was agreement that off-dockcontainer-handling facilities were important. A logistics park could provide depot space, parking andmotorway access, but most companies would retain their office space at their present locations.
An additional Container terminal was also recommended. (See page 38).
Decentralising container parks was opposed by some because road haulers charge according to adistance radius measurement, and their charges would rise by 15-20% for each additional 5 kmradius. An alternative cargo redistribution point at Cato Ridge would be assured of support only if itdid not generate extra costs or delays for users. However, all containers moving through Cato Ridgeor any other decentralised container park would be subject to double handling and therefore to highercharges. One firm believed that, for Cato Ridge to succeed, a dedicated railway line would have to bebuilt, but double-handling fees would still be incurred.
52
Logistics Parks – One major company had examined the establishment of a logistics park toovercome access and activity constraints. Riverhorse Park was found not to be ideal, but Cato Ridgewas well situated and the company felt it likely that it would open its operations there. The office,however, would remain in the CBD. Activities at the logistics park would include container packingand unpacking, automotive transport businesses (mainly carriers), warehousing and distribution, andtruck stops. This company stated that it would like to operate a railway shuttle between Cato Ridgeand the port with access to the Spoornet track, owning and operating its own locomotives. It arguesthat many railways operate on the basis of giving the private sector access to track, and thatSpoornet should do the same. However, most firms regard Cato Ridge as too remote, pointing outthat a major factor affecting competitiveness is distance from the port.
It is clear that there are divided views in the shipping industry with regard to the provision ofspecialised logistics parks as well as to the best locations. However, both Cato Ridge and the landbetween the Bayhead and DIA were mentioned by some companies as being suitable locations. Themunicipality should liaise with shipping companies in its plans for the south Durban Basin area. Thisis an area which seriously requires replanning, and a logistics park could well be a prime occupant ofland released in such a process. The municipality, however, should monitor technical andorganisational developments in the logistics chain worldwide so as to ensure that Durban remainsabreast of international best practice.
8.3 Stakeholder Co-operation
In researching circumstances prevailing at successful ports in other parts of the world, it becameclear that underlying their success was excellent communication and co-operation between the mainstakeholders. In Durban’s case the main stakeholders are broadly the Port, the Municipality, theShipping Sector and the Cargo/Logistics Sector. However, each of these groups has a plethora ofsub-sectors or sub-operations or departments, each of which makes an important contribution withintheir sphere of competence. It was also explained earlier in the report that the larger internationalshipping companies have diversified and integrated further and further along the shipping andcargo/logistics pipelines to the extent where they now have sustantial leverage in terms ofrelationships with other stakeholders. The Ports are forced to do their best to meet the needs ofthese key players as ships are becoming more selective about which ports they stop at with the resultthat competition between ports is increasingly fierce. Furthermore, because the shipping companiesoften have their own logistics operations inland and throughout the pipeline, alternatives of overlandand air transport between ports are becoming important options.
The dividing lines between the larger and smaller stakeholders are now more interlinked than everbefore so it is virtually impossible to compartmentalise the different types of operation. Virtually all ofthe larger firms have investments in selected sub-sectors, and each group is unique. Physically,because of the importance of the port as the operating centre, there is a strong tendency for maritimefirms to cluster around the port.
From the above it can be seen that for such a dynamic industry in one port city to be competitiveagainst their counterparts in other cities, it is essential that they have sophisticated systems andstructures of co-operation and communication within their industry.
Durban has moved along this path but at this stage the structures are still fairly unsophisticated and itis one of the main reasons why its port handling and logistics costs are regarded by industry as toohigh. Attempts to strengthen co-operation have been made in recent years and the Chamber ofCommerce and Industry’s Port Liason Committee is a good example. So is the recently formedTempi Project between Transnet and the eThekwini Municipality. However, within the sub-sectors ofthe various industry associations many are finding it difficult at times to achieve their objectives.
There are many areas where firms have common interests and needs and by working together theywould achieve much better results. Skills development is a good example. Strategic issues such astransport corridors, location of container parks, availability of truckstops, redevelopment of key urbanareas, are just a few of the key areas of debate where organised co-operation would yield betterresults. In the interviews conducted when researching for this study, the same items came up again
53

and again in the discussions. It is clear that there is a great similarity of opinion, but progress hasbeen abysmally slow.
This is a sizeable international gateway port, which has a major economic impact on the livelihoods ofthe local population. The time is ideal to consider the establishment of a Maritime Institute for Durbanto bring all the stakeholders closer together with the objective through co-operation andcommunication of raising the quality of the local maritime industry to one of recognised internationalclass. It is recommended that the matter be further investigated and feature as a strategic item on theAgenda of the Port Liason Committee on which all the different Maritime Associations arerepresented. (See also Section 9.3)
8.4 A Maritime Institute – will it add value ?
The strategic issues facing the local Maritime Industry and the importance of the industry to both thelocal and the national economies demand that the industry move positively towards operating as aunified force. It is of substantial size already and what is needed is a process which will ensure astate of greater unification and collective decision making. It is felt that the creation of a MaritimeInstitute could be the required catalyst. It is not possible to think through the whole process ofestablishing such an institute within this study, but a first look at some of the possible areas where itcould add value to the industry are listed below.
• International Maritime Research and Benchmarking;• Researching and publicising Developments in Marine and Shipping Technology;• Similar for Materials Handling and Logistics Technology;• Skills Development facilitation, structures and systems;• Liason with Tertiary Education and Research Organisations;• Materials Testing;• Industry Debate and Negotiation;• Specialist Studies;• Bridging the gap between Public and Private Sector Stakeholders;• Port Expansion Planning and Debate;• Negotiating the most effective Port Operating Model;• Cataloguing and facilitating resolution of sub-sector issues;• Supporting role in the development of national transport systems; • Involvement in such strategic issues as promulgating Road Transport Corridors;• Co-operation with Local Government re urban redevelopment affecting the industry;• Generally providing a facility for the industry to address its common strategic needs.
It seems from the above list that there are many important strategic areas where the Institutewould enable the industry to become a more efficient and formidable business force, and therebyadd significant value to the Industry, the City, the Region and the Country.
8.5 Urban Upgrading and Planning
The question of a range of urban re-planning programmes related to the Port, its expansion and itssupport industries has been under debate for some time. The following are some of the key projectsunder debate and consideration:
8.5.1 Bayhead Area – This is the focal point of containerised cargo and the ship building andrepair sector . It is also the location of the old railway marshalling yards and one of the main railaccess points to the port. Bayhead Road is the main road transport entry point. There a large numberof old back-of port buildings in the area close to the port, as well as many quite large buildingserected to serve the railway marshalling yards. There are also several areas of open land betweenBayhead Road and the marshalling yards.
Redevelopment of the area has been on hold for some time pending the NPA’s decision on whetherthe area will be required for a dig-out expansion of the port. It will be some time before such adecision is taken (years maybe??) and in the meantime this very valuable and strategically importantarea is operating at way below its potential.
54
The road structure and network is the immediate focus area because of insufficient entry and exitpoints (See Section 8.1). A holding area for large trucks is also a priority. However there are otherpossibilities for interim usage of the land and much of it needs cleaning up and reutilised moreproductively than at present.
Facilities that are in very short supply at present which could be located on an interim basis atBayhead, are container parks, bulk cargo holding areas, vehicle parks until a new car terminal isconstructed, and such operations requiring space but with limited infrastructure construction.
8.5.2 Maydon Wharf – There has already been some discussion on the strategically locatedMaydon Wharf logistics park. As noted above, it is dated in design and urgently needs upgrading withstreet widening where possible, better traffic management, a better road/rail interface, truck parking,etc, Stormwater drainage and petty crime are also problems which can be dealt with without delay.The row of private and SAPO terminals are all focused on different specialist cargos and important tothe local economy. There is sufficient berthing and ship access is reasonable except for the shallowdraft, which for several of the berths is under 10 metres. This logistics township is an importantcomponent of the industry and seriously needs to be redeveloped.
8.5.3 Vehicles – Fully built-up vehicles have in recent years become a major component of theports cargo throughput, both for import and export. Numbers are rising rapidly, and local vehiclemanufacturer Toyota, has a major export programme planned for the next 5 years. To ensure thatthis activity is secured for the long term it is important to assist the process overcome a number ofbottlenecks. At the moment parking space for vehicles is at a premium and it is critical that thisproblem is resolved. The area adjoining the existing car terminal, which was designed as a new Citymulti-purpose terminal is currently absorbing much of the overflow. Vehicles are probably a moresuitable type of cargo for that area than brakebulk and bulk in that are environmentally fairly cleanand can be transported in and out by rail if necessary. Resolving this issue is an urgent matter.
8.5.4 Container Parks – four or five new container parks within 5 Kms of Bayhead are urgentlyrequired (see Section 8.2.4 above)
8.5.5 Jacobs / Clairwood / Mobeni East – These three industrial townships date back to being atthe forefront of Durban’s early industrial development. As was the pattern at the time, they weredesigned around rail transport. The roads are narrow, access is poor and the buildings are dated. Byvirtue of their location in relation to the Bayhead area, they would be ideal locations for future growthof back-of port operations and the cargo/logistics sector.
There are already approximately 150 firms in this category located there and many of themanufacturing companies have moved elsewhere for various reasons. The three townships haveenjoyed some upgrading over the past few years, but there is an opportunity to convert them intoDurban’s prime logistics area linked to the port. This will require substantial re-planning andexpenditure on infrastructure, but the strategic value of such a facility close to the port is inestimable.
8.5.6 Cato Ridge – This has also been dealt with above (see Section 8.2.4). There is a body ofopinion, which favours the establishment of an inland container terminal at Cato Ridge. This wouldserve as a redistribution point for imported cargo as well as locally manufactured goods destined forelsewhere in KZN, Gauteng and the Free State. It would also be the terminal offloading point forgoods from Gauteng and other inland areas destined for the port or for the greater Durban andCoastal areas. It has a locational advantage in being alongside the railway line and the N3 highway toGauteng. The station at Cato Ridge already has shunting lines in place and could be furtherupgraded.
For a freight redistribution to operate satisfactorily at Cato Ridge, it will be essential to institute a railor road or combined hot-shot container delivery service between there and the port. Containers willnaturally be carried in both directions. A hot-shot service can be tailormade in terms of truck size anddesign and a dedicated route can be established. Rail is theoretically better for this sort of service,but to upgrade the rail line to the required standard will be a substantial capital project. Thereforeboth the road and rail options must be investigated. It may also be possible to include somebreakbulk cargo in the system as well.
55

Positive factors in favour are:o Heavy trucks from the interior would not have to drive through the City.o Truck arrivals at Bayhead could be scheduled over a full 24 hour period.o There is space to include a proper Truckstop with overnight facilities, truck servicing,
restaurant, etc.o Transport linkages up and down the coast could be established, which do not have to
enter the City.o Container distribution would be much more efficient.
Negative factors:o Double handling of freight might increase overall transport costs.o Additional capex for a hot-shot rail service.
On balance the scheme seems to have much merit and it should be thoroughly investigated.
8.5.7 Transport Corridors – Heavy trucks are causing havoc with ordinary daily traffic around thecity. Recently a heavy truck from Gauteng entered the city via the M13 to avoid the tollgate. Crossingthe bridge at Pinetown to join the N3 it burst a tyre, crashed into the railing, overturned and caughtfire. Traffic was held up for several hours. Every day trucks damage pavements, knock over trafficlights, break manhole covers and cause endless traffic congestion. Truck accidents are frequent,often with fatalities involved.
This kind of traffic experience is unacceptable in a modern city and comprehensive remedies arecalled for as a matter of urgency. Waiting for the upgrading of the rail system under the currentinfrastructure programme is not going to make the problem go away. More innovative remedies arerequired and greater discipline exercised over the truck operators and drivers. The introduction oftransport corridors for the heavy articulated trucks is one possibility. Trucks entering the municipalarea from up country should have to stay on the N3 right up to the N2 intersection, and then beforced to take a specific route to the port or to an industrial township. Having articulated truckstravelling along M roads and through suburbs is undisciplined and unacceptable from both a safetyand inconvenience aspect for local citizens. It is also onerous on the drivers to have to negotiate theirroute along narrow suburban roads. Establishing a container terminal at Cato Ridge is anotherpossible answer to dealing with the problem.
The matter requires urgent attention and local bye-laws upgraded to address the situation, supportedby appropriate city policing.
8.5.8 Point Waterfront
It is broadly planned that when the widening of the harbour mouth has been completed, a passengerliner pier leading into a waterfront entertainment area on the Point will be constructed. Passengerliner numbers into Durban Port are growing and this form of tourism is enjoying increasing popularityamongst the world’s affluent. A Port such as Durban with such a wide range of tourism attractionsclose at hand, should be able to attract its share of this type of tourist visitor. Having the waterfrontwill in itself be a great attraction. It is recommended that this project be supported and the NPA andthe City are encouraged to “make it happen” at the earliest date possible.
9. FUTURE OF THE PORT
9.1 City Growth and Gateway Status
The economy of Durban is well balanced between Manufacturing, Services and Tourism. The porthas become the heartbeat of the local economy, and its contribution is growing. It has a highmultiplier effect and this can be seen by the large number of firms involved in port related activities.Durban’s main problem at present is a shortage of industrial land. This is largely due to the nature ofits topography, where level tracts of land are hard to find. Over the next 20 years the local economyis likely to experience a high annual growth rate of 5% or more. How can this be accommodatedphysically? Much must surely come from redevelopment of older areas, particularly industrial areas
56

and the CBD. It is inevitable however that industrial development will expand beyond the eThekwiniMunicipal boundaries northwards up the coast and westwards towards Pietermaritzburg and evenbeyond.
The South African economy will also experience high growth rates and the cargo volumes throughthe port, both imports and exports will continue to escalate. There will be a need to rationalise theports activities in order to cope with these rising cargo volumes and it is inevitable that there is somespillover to other ports such as Richards Bay and Ngqura. As pointed out in Section 7.4.1, careshould be taken as to how any rationalisation of cargo is formulated, as attempts to streamline themix could result in job losses in the Durban cargo/logistics sector.
What is most important however, is that port capacity, particularly in the high growth areas ofcontainers, motor vehicles and components, petroleum products and bulk chemicals, should keep upwith demand. Durban’s larger industries such as the Oil Refineries and the Automotive sector arehere because of the port. As long as the port can handle their needs they will stay here and grow.Failure to do so will see them gradually relocate. Furthermore, with a successful port, other exportoriented industries will be attracted to this area so as to eliminate the add-on costs of inlandtransport.
It is very important therefore that Durban does not lose sight of its main vision of the type of city itwants to be in the future when making decisions about the format of the port and its cargo mix.Achieving international recognition as Southern Africa’s international gateway for trade is critical tothe city’s future.
9.2 Role of the Port in South Africa’s Economy
As discussed in Section 1.1, the Port of Durban is South Africa’s largest port in terms of value ofcargo handled as well as number of vessel arrivals per annum. It is estimated that the port and itsrelated industries contribute in excess of 20% of Durban’s GDP (See Section 10). Durban isapproximately 55% of the KwaZulu-Natal GDP, which in turn is approximately 15% of the SouthAfrican GDP. Thus, in round figures the Maritime Industry in Durban contributes between 1.5 and 2.0percent of the national GDP. Depending on which sub-sectors are included in the estimate, thispoints towards a contribution to the local GDP of between R25bn and R35bn.
However, Durban Port’s strategic role is what is important. Due to its geographic location and being anatural deepwater port, it is the most accessible port with sufficient capacity to cater for the needs ofthe county’s industrial heartland in Gauteng. Growth in international trade will be a cornerstone ofSA’s future economic success and Durban Port will play a key role in facilitating this success. It isgeographically placed to fulfil this role more cost-efficiently than any other Southern African port. It istherefore essential that not only the port, but the entire transport/logistics corridor from the port toGauteng operates at high efficiency levels.
9.3 Co-operation and Communication Structures
As mentioned under Section 8.3, the Durban Port Liason Committee was established under theumbrella of the Durban Chamber of Commerce a few years ago on the initiative of the Chamber. Allthe individual Associations falling within the Maritime Sector are represented through their ChairPersons, as well as the Port, the Municipality and the Chamber. This Liason Committee is very active,meeting once a month, and has achieved a number of successes in addressing port related issues.
The Associations represented on the Committee are the following:
Association of Ships Agents and Brokers of South Africa (ASABOSA); Association of Shipping Lines (ASL); Container Lines Operating Forum (CLOF); Island View Lease Holders; Maritime Law Association of South Africa; Maydon Wharf Leaseholders; National Stevedoring Association of South Africa (NASASA); Perishable Products Export Control Board;
57
South Association of Freight Forwarders;- Harbour carriers Division,- Clearing and Forwarding Division.
South Ship Builders and Repairers; South African Shippers Council; National Port Authority (NPA); South African Port Operations (SAPO); EThekwini Municipality; Durban Chamber of Commerce and Industries.
The formation of the Port Liason Committee represents a solid, groundbreaking initiative to improveco-operation and communication within the maritime sector. However, in view of the challengesfacing the sector and the port in particular, and because of the need for the industry to performcompetitively by international standards, it seems the right time to take the process to a morecomprehensive and sophisticated level. The development of a Maritime Institute could well be theroute towards achieving this objective. It is important that there is more focus on thinking strategicallyas an industry in addition to the long list of operating issues, which must inevitably fill the agenda.
Thought should also be given as to how best to bring the industry’s larger customers such as theAutomotive Industry, the Forest Products Industry, the Petroleum Industry, the Chemical Industry, theClothing, Footwear and Textiles Industry, etc. into the loop.
9.4 Port Planning and Capacity Expansion
Expansion of the port’s capacity is dominated at present by pressing requirements for containerhandling and motor vehicle handling capacity, as well as the ability to allow Panamax and Post-Panamax vessels to enter the port. It is clear from the various cargo volume projections that the porthas to make decisions now as to the route it will follow. The port widening and dredging programmeto accommodate the extra large ships is already underway. Expenditure programmes for new modernequipment aimed at raising container handling throughput and efficiency is in the pipeline. Theconversion of Pier 1 to add to container capacity is currently in progress. Urgent talks are in progressas to the best sight for another car terminal. But all of this will cater for another five years or so.
Several alternative options have been developed for adding new bertha by digging out the Bayheadarea and/or the land currently occupied by Durban International Airport (DIA). There are technicaldifficulties with each of these options and the environmental impact assessment processes arelengthy and require several years to complete. Ideally the Bayhead option should receive preferenceover the DIA option as this would release the airport land for industrial development and/or a secondairport. However the impediments confronting this option point strongly towards the DIA dig-out route.It is clear from the cargo projections that the NPA does not have time in hand and needs to make adecision fairly soon. At the same time, the owners of the DIA land are under pressure to sell portionsof the land immediately in order to accommodate urgent industrial expansion.
Therefore Durban needs to decide what kind of a port it wants and how large in terms of cargocapacity that port should be. Given the above it seems logical that Durban should focus on highvalue-added intermediate and end-product manufactured goods, as far as possible with good exportand employment propensity, and gradually move away from bulk and possibly selected breakbulkcargo types. There are some obvious exceptions such as bulk petroleum and chemical products,where it is the main import entry point, and built-up vehicles, which are a key output of the localeconomy. However, caution should be excercised when contemplating transfer of cargo types, thatsuch a move does not permanently destroy significant job numbers in the associated cargo handlingand logistics sectors. These are sensitive issues and should be handled accordingly.
It is important for Durban to retain its status as the main entry point for crude oil and refinedpetroleum products, as that underpins its position as South Africa’s most important international tradegateway. In terms of capacity it needs to plan now for around 6 – 8 million TEUs per annum, withdesign structures available for capacity beyond that, if the high container growth rate continuesbeyond 2020.
58

Catering for the growth in cargo volumes does not mean that the focus should be only on the port.The entire logistics chain will grow with it and their expansion needs to be spatially planned andinfrastructure requirements to be assessed. As mentioned earlier, land is at a premium andexpansion and modernisation of the cargo/logistics sector will require substantial urbanredevelopment. (See also Sections 8.1, 8.2, 8.5,8.7).
(Sections of the above discussion taken from a previous report by the authors titled “Decision MakingFramework for Redevelopment of the Airport Site” – 27 November 2006)
The port is an integral part of the city, and the use of the entire Bay of Natal should be planned so asto blend in with the metropolitan area. There is support in the shipping industry for reserving theEsplanade and Point areas for recreation and passenger vessels, and Maydon Wharf and thesouthern side of the bay for freight vessels. This would entail moving all non-commercial activities −principally two rowing clubs which have boat houses there and a yacht club − from there presentfacilities on the Silt Canal to the Yacht Mole area on the Esplanade where the rowing clubs also haveboat houses and two yacht clubs are located. This is not favoured by the clubs at King’s Rest on theSilt Canal − the rowing clubs point out that the most sheltered water conditions are found on thesouthern side of the bay, while the yacht clubs serves the south Durban area. One rowing clubbelieves that a loss of the King’s Rest facilities might cause it to close. KZN Rowing is regarded bythe National Olympic Association as one of the sporting codes that has made the most progress intransformation, and has been given a national lottery grant in recognition thereof, while the yachtmole’s location virtually in the CBD makes Durban a very attractive destination for foreign yachtswhich winter there in order to undergo outfitting.
There was unanimous support from the shipping industry for the continued use of the Bay for multi-purpose activities. There is no incompatibility, and no complaints from ships’ captains about theactivities of sporting codes, pleasure cruises and fishing. In Sydney and Hong Kong recreational andsporting activities are allowed in designated areas, and the same should apply in Durban. There issufficient water area for all activities, but Durban should not make the same mistake as Cape Town,which lost about one-half of its port to the Waterfront tourism development, reducing its ability to actas a seaport for international trade.
10. CONTRIBUTION TO THE ETHEKWINI ECONOMY
10.1 Shipping Sector
10.1.1. A Methodological Note — Assessing what the maritime industry in Durban is worth isextremely complicated, and there is no apparent way to simplify it. The reason is that shipping linesand agencies are structured in many different ways. The head office of a shipping line, for example,in Europe or Japan, may develop regional offices (to cover a particular geographic region of the line’sglobal operations) or national companies, and the national company in turn may have branch officesin each port and in Johannesburg. An agency in Durban, for example, could:
(i) operate on behalf of the head office − it collects freight revenue, the great bulk of whichis remitted to head office, and it then retains only about 2.5-5% of this as itscommissionable allowance, and collects ancillary service fees (for bills of lading,warehousing, stevedoring, cartage and inland transportation) to cover local overheads.
(ii) operate as its own revenue hub, retaining freight revenue to pay for the running of theship, the office and certain depots, but nevertheless remitting the balance to the headoffice overseas.
(iii) not collect the freight revenue (which instead is all paid direct in US dollars by thecustomer to the principal overseas) but merely receive a percentage thereof to coveroverheads.
Thus, most of the freight revenue collected by the Durban office ultimately is remitted to the headoffice overseas or to a regional office, e.g., a Japanese shipping line would have its head office inJapan but could have regional offices in Europe and North America, and the Durban office could fallwithin the jurisdiction of the European regional office.
59

Enormous sums are reflected on the manifest of vessels docking in the port of Durban. Take, forinstance, a vessel with 3,000 TEUs at a fee of $800 per container; the revenue of $2.4 million(R17.76 million) could be paid either at the port where the ship is loaded or in Durban. If the shipleaves Durban having loaded another 3,000 TEUs, this would produce another R17.76 million ofrevenue. In the present survey, some shipping lines and agents in their responses clearly includedrevenue remitted while others limited their figures to commission and service fees.
In assessing the value of the maritime sector in Durban, the issue is how to treat the differentarrangements: should turnover of the Durban office include freight revenue collected and thenremitted abroad, or should it merely consist of commission and service fees? The former representscollections, the latter earnings.
Another difficulty is that, in some cases, all revenue generated by the South African operations of theshipping line appeared in the books of the Durban office (in cases where the South African headoffice was in Durban) even though transactions were entered into in Johannesburg and branchoffices at other ports, while in other cases the South African head office was in Johannesburg and alltransactions entered into by the Durban office were subsumed in the books of the Johannesburgoffice.
Value added is defined as the contribution to total (i.e., national) output made by an industry or a firm.In the case of a firm it is calculated as sales minus purchases from other firms. These purchasesconsist of inputs (raw materials, services and components) and capital goods.
Revenue that is collected on behalf of a principal cannot be considered as the contribution tonational output by a firm. The appropriate amount that may be so considered is the revenue earnedby the firm from agency and other fees. Although very large sums pass through the books of shippinglines and agents in Durban, it appears that relatively little represents the earnings of the Durbanoffices themselves and is available to enter the metropolitan economy by way of the expendituremultiplier.
10.1.2 Previous Estimates — The first serious attempt to quantify the contribution of the port ofDurban to the metropolitan economy was made by Jones (1997)1. His calculations were for 1995. Hefound that employment in directly port-related activities amounted to a minimum of 31,000. He usedexpenditure multipliers to calculate the effect on the metropolitan economy. This effect is determinedby the consumption propensity of wage earners as well as by the leakage of tax and expenditure outof the economy. The result of these calculations was a multiplier of 2.4 which was applied toremuneration of employees, expenditure on procurement in Durban, and expenditure by typicalvessel corers.
Jones revised his work in 20062 for the TEMPI projects. He alludes to an overall local spendingmultiplier of between 1.9-2.4, and points out that values tending towards the lower end of this rangewere found in comparative studies on ports in Australia and the US. Thus, he adopts a localexpenditure multiplier of 1.9 as being reasonable but somewhat conservative. Expenditure for a portcall for a typical container vessel in 2006 was estimated at R2.65 million and for a typical multi-purpose vessel handling breakbulk cargo R1.75 million at a private/leasehold terminal or R1.86million at a SAPO breakbulk terminal. On this basis total annual calls by container vessels to the portin 2004 (but using 2006 prices) would have generated first-round local spending of R3.3 billion andraise final local incomes by R6.3 billion. For general cargo calls these figures would have been R1.44billion and R2.7 billion respectively. Jones makes the caveat that these estimates are heroic at best,but the fact is that his is the only existing attempt at quantification. Thus, total calls by container andgeneral cargo vessels would have led to first-round local spending of R4.74 billion and raised finallocal incomes by R9 billion. These figures cover both the shipping and cargo sectors.
10.1.3 Survey Results — The difficulty faced in estimating the turnover of the shippinglines/owners/operators/agents was that the companies, as mentioned in Section 11.1.1, arestructured in many different ways. In the turnover figures disclosed to us, it was clear that some
1 . Jones, The Port of Durban and the Durban Metropolitan Economy. Research Monograph No. 10. Durban: EconomicResearch Unit, University of Natal, 1997.22 In “An Economic Perspective of Port Expansion Arising out of the TEMPI Process”. UE Development Economists andUniversity of KwaZulu-Natal, 2006.
60
companies had disaggregated to the level of income earned by the Durban office but that others hadreferred to income collected. Those companies that had disaggregated produced much lowerturnover figures than those that did not, the range being R15 million per annum to R1.8 billion perannum. Total turnover disclosed was R4.73 billion per annum but much of this is repatriated to headoffices abroad. For example, one ship’s agency stated that, excluding what is paid to State-ownedenterprises (port, rail, SARS), a maximum of 5-10% of revenue collected remains in Durban and thatretention in the shipping sector in Durban is very low. Payments to State-owned enterprisesconstituted 20%, ocean freight 65-70% and inland freight 10% of total expenditure. A large shippingline admitted that only a small proportion of revenue collected remained in Durban. An attempt wasmade to ascertain the views of some of the respondents as to the size of the port sector in themetropolitan economy; one company asked its senior executives for their estimates, but none feltable to provide a figure. Another company estimated that liner revenue for shipping lines and agentsalone would amount to about R1 billion per annum and ancillary services (clearing and forwarding,road haulage, etc.), would contribute more than R1 billion per annum. Our figures indicate that theseestimates are too low.
We compared our figures with those of Jones (2006) who arrived at total payments to ship’s agentsby vessels calling at the port of R52 million per annum. This appears to be too low. Applying thebreakdown of expenditure given in the previous paragraph to the figures provided by therespondents, and taking a commission/agency fee rate of 5-10% of ocean freight, we obtain a figurefor commission and agency fees earned by the shipping lines of between R171-276 million perannum. Taking an average of 7.5% as the rate, we arrive at a figure of about R224 million. We haveadjusted Jones’s figures accordingly.
In addition, other activities (boat and yacht building, maintenance and equipment; harbour cruises;catering; fishing; sailing schools; diving) have to be taken into account. Their combined revenueamounts to approximately R151 million per annum.
We then arrived at a figure of R3.48 billion per annum as the first-round effects; applying themultiplier of 1.9 the shipping sector would raise final local incomes in the metropolitan economy by anamount of R6.6 billion per annum.
To put this into perspective, Vancometrics (2005)3 estimated the gross geographic product (GGP) ofthe eThekweni metropolitan economy at R141.1 billion. This means that the shipping sector alonewould contribute about 4.7% of the metropolitan economy’s GGP. To this must be added thecontribution of the cargo sector in order to obtain the total contribution of the maritime industry.
10.2 Cargo Sector Contribution
As has been discussed in the foregoing chapters, the Cargo Sector is complex, with many inter-related operations, functions and services linked together in a dynamic network of businesses. Thisstudy has not attempted to undertake a detailed cost and value-added calculation at the individualfirm level, but some of the data does provide a base for a broad estimate of the sector’s contributionto the local economy. As pointed out earlier, the interview sample yielded a good spread betweenfirms, which are publically owned (34.5%), privately owned (24.1%) and close corporations (37.9%).The remaining 3.4% are overseas owned.
Using the turnover profile of the sample (see section 5.3) as a guide and applying it to the full list ofcargo-related companies, it is estimated that the sector turnover is approximately R60.5bn at currentprices. Employment costs vary widely as a proportion of total costs but in the majority of firms,employment appeared to make up between 40% and 50 % of total costs. This is a very competitiveindustry and value-added can also vary from sub-sector to sub-sector. As a rough guide a figure of50% of turnover has been used as an estimate of direct value-added. Thus value-added by the cargosector in terms of firms involved only in the handling of cargo (including support services such asmarine surveys, import/export agency fees, etc.), and excluding owners of the cargo, is estimated ataround R30.3bn. Using the 2005 estimate of Durban’s GDP of R141.1bn (see page 26), this means
3 Vancometrics, “Ethekweni South Africa: Economic Analysis and Strategy Development”. Durban:2005.
61

that the Cargo Sector of the Maritime Industry contributes approximately 21% of Durban’s GDP. Thisis a substantial contribution and clearly underlines the importance of the port to Durban’s economy.
There is obviously some overlap in the above estimate with that estimated as expenditure by shipscalling at Durban Port, but much of the revenue is generated from land-based companies involved inthe physical handling aspects of importing and exporting. The local multiplier is unlikely to be as highas that of the shipping sector and a factor of around 1.4 to 1.6 seems to be more likely. Table 32below summarises some of the key economic indicators of the contribution of the Cargo Sector to theDurban economy.
Table 32. Economic Profile of the Cargo SectorNo. of Firms:
± 600
Direct Employment:
± 50 000 peopleOwnership: - Overseas 3.4 % - Public Companies 34.5 % - Private Companies 24.1 % - Close Corporations 37.9 %
Turnover Group: < R5m 31.0 % R5m – R10m 20.7 % R10m – R50m 17.2 % R50m – R100m 10.3 % R100m – R250m 3.4 % > R250m 17.2 %
11 SUMMARY AND CONCLUSION
The Port and Maritime Sector together unquestionably are the main economic drivers of the Durbaneconomy. The eThekwini Municipal Area is highly dependent on the sector and its ability to competeinternationally for its economic growth and well-being. It is critical that the port and the inter-relatedshipping and cargo sectors are efficiently capitalised and managed in order that their cost structuresare competitive by international standards. The country is heavily dependent on international tradeboth inwards and outwards, and as such it is critical that Durban’s port is recognised as aninternational trade gateway. To achieve this recognition it must consistently operate at the better endof international standards.
It was encouraging to find that there are a large number of small businesses operating in the valuechain and that it is a fertile area for young entrepreneurs. Outsourcing of certain services to SMMEsappears to be growing and sub-contracting of cartage to owner-drivers of trucks is common practice.There is strong demand for artisans, drivers, forklift and machine operators, storemen and computerliteracy.
62
Estimated Sector Turnover ± R60.5bnEstimated Value-Added ± R30.3bn% of Durban GDP 21 %
The City’s economy has entered a high growth phase, as has that of the SA mainstream economy.From the foregoing analysis it is clear that both the port and the two sectors are not operatingcompetitively and are also rapidly running out of cargo handling capacity due to insufficient berthingand back-of-port space and facilities. Recommendations have been made in the foregoing chaptersas to how the value-chains of the two sectors and certain elements of the port and the cityinfrastructure could be improved and made more competitive.
It is important that the extent of the Port/Maritime Sector contribution to the local economy beunderstood and recognised, as it will provide the main impetus for growing employment in the EMA.The large industrial sectors such as Automotive, Petroleum and Chemicals, Metal Processing, Foodand Beverages, Paper and Pulp, and other Forest Products, are all heavily linked to the port and themaritime sector in both their inbound and outbound value-chains. Thus it is critical that the port andassociated sectors operate efficiently. If Maritime value-chain costs continue to be above internationallevels, the larger manufacturing firms will gradually relocate away from Durban.
Bearing in mind the wide range of materials and products which pass through the port and their effecton the structure of the local cargo handling sector, it seems very important that the port continues tomaintain its cargo diversity. When capacity is under pressure it is tempting to rationalise and narrowthe focus, especially when there is the convenience of another large port up the coast. Becoming toofocused in terms of the cargo profile would have a damaging effect on the local industry. Theemployment capacity of the Cargo sector in particular has been shown, and this employment shouldnot be jeopardised by excessive rationalisation. The net effect of too much rationalisation would be todestroy a significant number of jobs in the private sector. A further point is that for a ship to makemultiple calls is costly and raises the average cost of a port call. This is not to say that selective cargotypes should not be moved to other ports such as Richards Bay over time, but the process should behandled carefully and the full impact on local employment evaluated. The transfers should beformulated together with the private sector during the process.
From the City’s perspective, there will be many difficult challenges in the form of re-planning andupgrading of industrial infrastructure and townships. The rate of economic growth is already puttingsevere strains on the system and bold decisions will be required to address the key issues. In thiscase it will be the growth in Back-of-Port operations, growth of the Cargo Logistics sector and therapid escalation of transport volumes – sea, road, rail and air, which will create the challenges. Thequestion of transport corridors and rerouting of heavy articulated trucks, establishment of an inlandcontainer terminal and re-planning for a revitalised and modernised rail service are just three of themajor strategic issues, which have to be tackled. Finally, because of the expected high growth rateand the backlogs in infrastructure spending, the time for these decisions is right here.
63
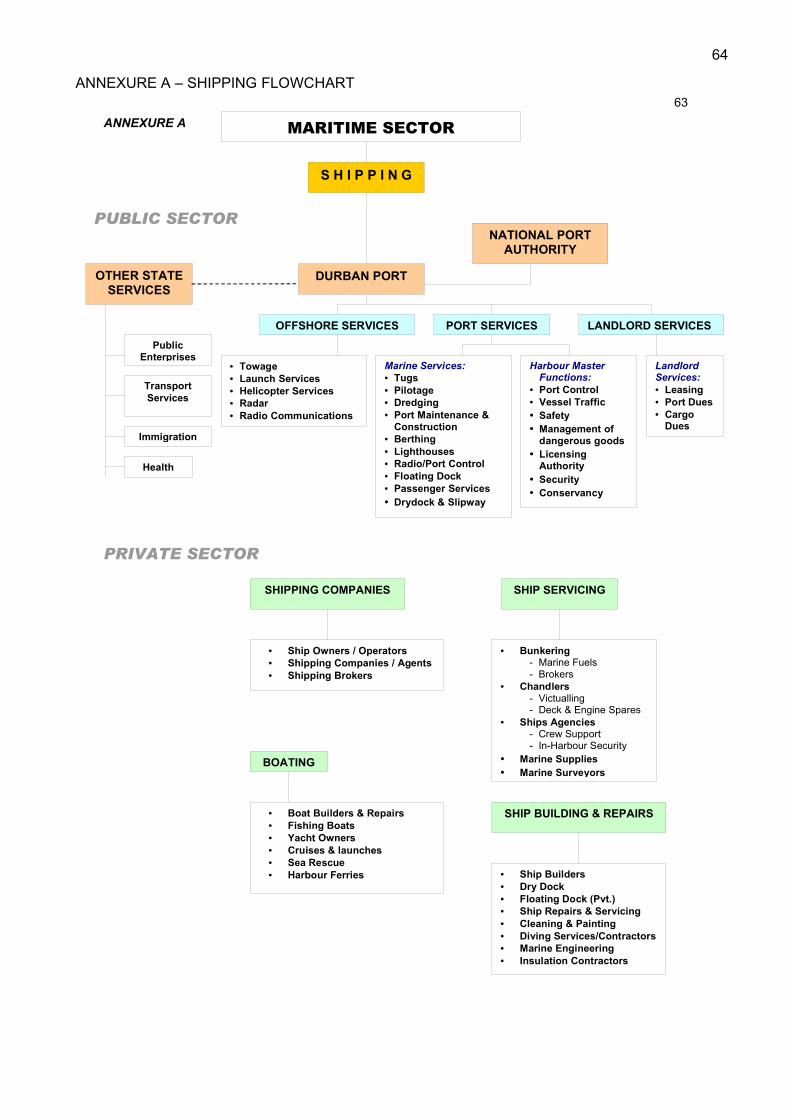
ANNEXURE A – SHIPPING FLOWCHART
MARITIME SECTOR
DURBAN PORT
S H I P P I N G
PORT SERVICES OFFSHORE SERVICES
OTHER STATE SERVICES
Public Enterprises
Transport Services
Immigration
Health
• Towage • Launch Services • Helicopter Services • Radar • Radio Communications
Marine Services: • Tugs • Pilotage • Dredging • Port Maintenance &
Construction • Berthing • Lighthouses • Radio/Port Control • Floating Dock • Passenger Services • Drydock & Slipway
PUBLIC SECTOR
PRIVATE SECTOR
SHIP SERVICING SHIPPING COMPANIES
• Ship Owners / Operators • Shipping Companies / Agents • Shipping Brokers
• Bunkering - Marine Fuels
- Brokers • Chandlers
- Victualling - Deck & Engine Spares
• Ships Agencies - Crew Support - In-Harbour Security
• Marine Supplies • Marine Surveyors
• Boat Builders & Repairs • Fishing Boats • Yacht Owners • Cruises & launches • Sea Rescue • Harbour Ferries
BOATING
SHIP BUILDING & REPAIRS
• Ship Builders • Dry Dock • Floating Dock (Pvt.) • Ship Repairs & Servicing • Cleaning & Painting • Diving Services/Contractors • Marine Engineering • Insulation Contractors
ANNEXURE A
NATIONAL PORT AUTHORITY
63
Harbour Master Functions:
• Port Control • Vessel Traffic • Safety • Management of
dangerous goods • Licensing
Authority • Security • Conservancy
Landlord Services: • Leasing • Port Dues • Cargo
Dues
LANDLORD SERVICES
64
ANNEXURE B – CARGO FLOWCHART
MARITIME SECTOR SECTOR
DURBAN PORT
C A R G O
CARGO SERVICES SERVICES
OTHER STATE SERVICES
Petronet
Customs & Excise
Police/Security
State Warehouses
Port Cargo Handling Facilities: • Container Terminals • Multi PurposeTerminals • Breakbulk Terminals • Vehicle Terminal • Liner Terminal
PUBLIC SECTOR
PRIVATE SECTOR
PRIVATE SERVICES PRIVATE TERMINALS
• Sugar • Grain • Bulk Coal, Metals &
Minerals • Bulk Liquids & Petroleum • Fresh Produce • Forest Products • Soda Ash • Brewery Malt
• Containers - Container Cartage - Pvt. Container Terminals - Container Storage - Container Manufacturing &
Maintenance • Stevedoring
- Cargo handling - Crane & Equipment Hire - Cargo Securing
• Shipping Agencies - Freight Services
• Clearing & Forwarding Agents - Documentation - Customs Clearance
• Financial Services - Banking - Foreign Exchange - Letters of Credit - Marine Insurance
• Warehousing - Warehousing - Refrigeration - Bond Stores
• Transport & Logistics - Transport Carriers - Local Cartage Contractors - Bulk Liquid Carriers - Logistics Services
• Import/Export Agents • Importers
- Commercial - Manufacturing
• Exporters - Commercial - Manufacturing
• Trade Facilitators
IMPORT / EXPORT
Inspection Services
SA PORT OPERATIONS
Transnet
64 ANNEXURE B
ANNEXURE C - KEY COMPONENTS OF THE MARITIME SECTOR VALUE-CHAIN
65

FLOWCHART 1 – BULK LIQUIDS
Tanker Vessels
PipelineControl
Chemical Tank Farms:-Liquid Chemicals-Vegetable Oils-Molasses
Tank farm Services:-Bulk Liquid warehousing-Product Blending-Customs Clearing & Forwarding-Truck Filling & Emptying-Drumming Off-Tanker Cleaning-Weighbridge
TransportTankers
Road & Rail
Industries:(Import & Export)-Chemical-Paint-Food & Beverage-Cosmetic-Detergent-Textile-Automotive-Foam-Etc.
Petroleum Tank Farms:-Refined Petroleum Products-Refined Oils
Petroleum Refineries
SBM
PETRONET Pipeline to GautengPetronetTerminal
Pipeline Network
Product Flows – Import and Export
66

FLOWCHART 2 – MOTOR VEHICLES
VEHICLE CARRIER VESSELS
CAR TERMINAL 1
CAR TERMINAL 2
Vehicle Transporters(Road & Rail)
TOYOTA MANUF. SADurban Plant
GAUTENG AUTO MANUFACTURERS
KZN AUTOMOTIVE DISTRIBUTORS
INLAND AUTOMOTIVE DISTRIBUTORS
AUTOMOTIVE RETAILERS
USED VEHICLE DEALERS
USED VEHICLEIMPORT / EXPORT
(Agents / Distributors)
Product Flows – Import and Export
67
FLOWCHART 3 – BULK AND BREAKBULK
BULK & GENERAL
CARGO VESSELS
BULK TERMINALS:-Sugar-Coal & Difficult Materials-Grain-Metals % Minerals-Woodchips-Ferro-Alloys-Etc.
BREAKBULK & MULTI-PURPOSE TERMINALS:
-Rice-Woodpulp-Forest Products-Steel-Electrical Appliances-Fresh Produce-Soda Ash-Brewery Malt-Machinery-Etc.
Rail & Road
Transport Carriers
Road & Rail
Transport Carriers
Local Distribution
Points
Inland Distribution
Points
Local Manufacturers
Inland Manufacturers
LOCAL:-Warehouses-Distributors-Factories
INLAND:-Warehouses-Distributors-Factories
Product Flows – Import and Export
PORT ACTIVITIES PRIVATE SECTOR ACTIVITIES
68

FLOWCHART 4 – CONTAINERS
CONTAINER &
REEFER VESSELS
DURBAN
CONTAINER
TERMINAL
CARTAGE CONTRACTORS
& LONGHAUL CARRIERS
Container warehouses for Packing, Unpacking &
Re-distribution of Cargoes
Container Parks for Re-distribution of
containers and storage of
empties
Container Manufacture, Maintenance
& Repairs
Industry and
Commerce
CARTAGE CONTRACTORS
& LONGHAUL CARRIERS
Agents:-Import/Export-Shipping
PossibleTruckstop
Container Flows – Import and Export
PORT ACTIVITIES PRIVATE SECTOR ACTIVITIES
69