mario bijelic , tobias gruber and werner ritter
TRANSCRIPT

A Benchmark for Lidar Sensors in Fog: Is Detection Breaking Down?
Mario Bijelic∗, Tobias Gruber∗ and Werner Ritter
Abstract— Autonomous driving at level five does not onlymeans self-driving in the sunshine. Adverse weather is especiallycritical because fog, rain, and snow degrade the perception ofthe environment. In this work, current state of the art lightdetection and ranging (lidar) sensors are tested in controlledconditions in a fog chamber. We present current problemsand disturbance patterns for four different state of the artlidar systems. Moreover, we investigate how tuning internalparameters can improve their performance in bad weathersituations. This is of great importance because most state ofthe art detection algorithms are based on undisturbed lidardata.
I. INTRODUCTION
The race to create smarter sensors for autonomous drivinghas started. For greater functional safety, various companiesare working to develop a third sensor besides camera andradar, to complement their abilities in difficult situations.Currently, light detection and ranging (lidar) sensors, gatedand time of flight (TOF) cameras are competing against eachother. Looking at current proposed sensor setups from estab-lished car manufactures and large American IT companies,one can say that lidar technology has an advantage over itscompetitors TOF and gated imaging. However, autonomousvehicles at level five require environment perception atall times, even under adverse weather conditions such asfog, haze, mist and rain. As Fig. 1 shows, current lidartechnologies have major problems in scattering media suchas fog because they usually work at the limit of eye safetyregulations. Tests in well defined conditions are essential inorder to closely investigate the behavior of these sensors insuch conditions.
A. Motivation
How does lidar work? Basically, lidar sends out a laserpulse which is registered at departure and the time ismeasured until an echo from a target is recorded. In detail,the task gets more and more complex as the needed timeresolution is high and the maximal signal to noise ratio hasto be low. Technologically, there are different types of lidarsystems. There are lidar systems for the automotive sector,military, robotics, surveillance or airborne laser scanners fortopological mapping. The detailed solutions differ becausethe application field is wide. In the automotive sector costsensitive, fast and high resolution laser scanners are required.The best known producers are probably Velodyne, Ibeo andValeo. State of the art systems are based on mechanicalbeam steering, optical laser diodes for pulse emission and
All authors are with Daimler AG, Wilhelm-Runge-Str. 11, 89081 Ulm,Germany. {mario.bijelic, tobias.gruber, werner.r.ritter}@daimler.com
∗ Mario Bijelic and Tobias Gruber have contributed equally to the work.
Fig. 1: Point cloud of a Velodyne HDL64-S3D in dense fog.
avalanche photo diodes for detection [1]–[3]. But currenttrends [4] indicate the mechanical parts will be replacedby solid state technology which enables more robust andmaintainable laser scanners.
The most advanced laser and technologically appealingscanners are the publicly presented military grade prod-ucts. One of those products is the obscurant penetratingautosynchronous lidar (OPAL) Neptec scanner [5], [6]. Incontrast to current automotive sensors, which are basedon 905 nm lasers, it is based on a 1550 nm laser source.Also airborne and surveillance laser scanners are based onthe short wave infrared (SWIR) region, e.g. the productsfrom Teledyne Optec. Unfortunately, this shift to a higherwavelength requires more expensive fiber lasers and indiumgallium arsenide (InGaAs) detectors.
In order to compare these different forms of lidar sys-tems in adverse weather conditions, an easy and repro-ducible benchmark is needed. Within the European Union(EU) project aDverse wEather eNvironment Sensing systEm(DENSE), we present such a test procedure for state of the artlidar sensors and the results. Moreover, we show and evaluatedisturbance patterns. All these results mark a baseline forupcoming developments in the project.
B. Related Work
1) Lidar characterization: In addition to theoretical char-acterization of lidar systems as in [7], experimental eval-uation and especially benchmarks between different sensortechnologies are very important. A first experimental studywas already performed in 1991 by Hebert and Krothov [8].They verified measurement models with experiments andquantized both range precision and angular precision. Assoon as 2D laser scanners such as the Sick LMS 200 werecommercially available, they were characterized by Ye andBorenstein [9] through extensive experimentation. A squaretarget was precisely moved in front of the laser scanner inorder to obtain insight into phenomena such as the rangedrift over time, the effect of the incidence angle and themixed pixels problem. In 2008, a first assessment of four
arX
iv:1
912.
0325
1v1
[cs
.CV
] 6
Dec
201
9

different laser range finders (Sick LMS200, Hokuyo URG-04LX, Ifm Effector O1D100 and Sick DT60) were performed[10]. This benchmark was extended in [11] where a totalof 10 different range sensors were evaluated. In additionto characterization in the lab, measurements in undergroundenvironments showed the performance of these sensors inreal environments.
2) Influence of bad weather on lidar systems: WhenPeynot et al. recorded a dataset for an advanced perceptionsystem for autonomous vehicles in environmental conditions(dust, smoke and rain), they observed that dust particles inthe air are detected by laser sensors and hide obstacles behindthe dust cloud [12]. In [13], Rasshofer et al. theoreticallyinvestigated the influence of weather phenomena based onMie’s theory in order to develop a novel electro-optical laserradar target simulator system. They verified their models withreal world measurements in fog, rain and snow, however,these measurements rely on random weather conditions andcover only rough visibility differences. Ijaz et al. showed in[14] that the attenuation due to fog and smoke in a free spaceoptical communication link are not wavelength dependentfor visibilities less than 500 m and wavelengths in between600-1500 nm. Their evaluations were performed in a verysmall laboratory controlled atmospheric chamber. Trickey etal. investigated the penetration performance of the Opal Lidarin dust, fog, snow whiteouts and smoke [5]. Dust and fogperformances have been evaluated in an aerosol chamberwhile snow conditions and smoke were obtained in field tests.A very detailed inspection and discussion of two popularwavelengths for lidar systems, i.e. 905 nm and 1550 nm, wasdone by Wojtanowski et al. [15]. Recently, Hasirlioglu etal. studied the disturbances due to low ambient temperaturesand exhaust gases [16]. Considering all these references [5],[12]–[16], it is clear that there is a huge impact from adverseweather on lidar systems. Some even have floated the idea toestimate the weather conditions by comparing lidar points ingood weather and in adverse weather [17]. For autonomousdriving in adverse weather, it is very important to gain evenmore insight into the degradation of lidar systems. Thiswork presents a very detailed performance evaluation offour popular automotive lidar systems under defined weatherconditions in a fog chamber. The size of the fog chamberallows us to set up a realistic street scenario and it is possibleto generate fog with two different droplet distributions andchange the visibility in very small steps.
II. TESTED LASER SCANNERS
In this test, four state of the art laser scanners from Ibeoand Velodyne are compared with one another, i.e. VelodyneHDL-64S2, Velodyne HDL-64S3, Ibeo LUX and Ibeo LUXHD. A technical summary of these models can be foundin Table I. Both Velodyne laser scanners S2 and S3 do notdiffer in their specifications. A 10 % reflective target is visibleup to 50 m. A high reflective target with 80 % reflectivityis visible up to 120 m. However, the S2 is an older modeland since scan quality has increased (Fig. 2). Primarily theintensity calibration was enhanced and is now stable across
TABLE I: Technical summary of the tested laser scanners.Differences between similar models are marked red.
Manufacturer Velodyne IbeoModel HDL-64S2/S3D LUX /LUX HDLaser layers 64 4Range [m] 50/120 50/200 30/120Multiple echoes 1 2 3Heavy duty No No YesWavelength [nm] 905 905Data rate [Hz] 5-20 12.5/25/50Horiz. FOV [◦] 360 85Horiz. resolution [◦] 0.0864-0.1728 0.125/0.25/0.5Vert. FOV 26.33 3.2Vert. spacing 1/2 to 1/3◦ 0.8Embedded software No YesDistance accuracy [cm] ≤2@1σ 4Operating temp. [◦C] -10 to 50 60 -40 to 85Points per second ≈ 1.3× 10⁶ ≈ 2× 10⁶ ≈ 44× 103
S2 S2/S3D S3Dlong exp. short exp. long exp.
Fig. 2: Captured laser intensities with a Raptor OWL-640camera on a 50% dry reflective target. A short exposure wasset to capture the scan pattern for the S3D and S2, whichare equivalent. Longer exposure times illustrate the differentscan qualities between the S2 and S3. Notice the increaseduniformity for the S3D.
different scanning layers. The S3 generation is split into twosubproducts: The Velodyne S3S and S3D. The S stands forsingle return and D for dual return. In our case, the dualreturn option is more interesting, as it is able to detect thestrongest and last return from a laser pulse and transmitboth to a host computer. As the bandwidth is limited to1 Gigabit per second, the horizontal resolution is reducedby approximately 30 %. Counting both strongest and lastreturned points, the overall number of points increases from≈ 1.3 Mio. to ≈ 2 Mio. points. We expect that the usage ofmultiple echoes will enable greater fog penetration.
Furthermore, both Ibeo scanners are technically similarbecause the Ibeo LUX HD is based on the Ibeo LUX. HDdesignates heavy duty because the LUX HD was originallydeveloped for combine harvesters, where the environmentis very dusty. The main difference is a modified lens anda tinted covering. The sensor was modified in order toenable more robust detections at close distances, as the laserscanners had to face a great deal of whirled-up dust. Dueto the changes, the maximum viewing distance has beenlowered. Both laser scanners offer four scanning rows andthe same resolution.
In total, the Velodyne and Ibeo scanners differ quite alot despite both having the same wavelength (905 nm) andmechanical beam steering. The Velodyne scanner offers a

360◦ field of view (FOV), while the field of view of theIbeo scanners is limited to 85◦. Moreover, the resolutionof the Velodyne sensors is several magnitudes larger andenables a more detailed environment perception. In addition,the Velodyne scanner is able to provide the intensity for eachperceived point.
A. Intensity calculation
For current automotive application, the measured intensityis becoming increasingly important. [18] reviews an over-all calibration process and possible influences on intensitymeasures. In addition, four levels of intensity calibration aredefined. It starts with level 0, where raw intensity measuresare provided by a laser scanner and ends with level 3, wherea rigorous calibration has been applied and the intensitymeasures are correct and identical across different systems.Level 0 calibration methods are provided by the laser scannermanufacturer and the produced output intensities are notcomparable to other manufacturers.
The process of measuring the true intensity differs fromeach manufacturer and is proprietary, but this measuringprocess is crucial for a robust environment perception andcan increase the robustness in adverse weather, as [19] and[20] show. Only the Velodyne scanners (S2 and S3D) providea raw intensity measure (level 0), which will be analyzed forpossible influences due to fog.
In [21], Velodyne claims to increase the capabilities inadverse weather, due to the usage of a digital signal processorwhich enables dynamically tuning the laser power if a clearobject reflection is not obtained from a certain laser pulse.Both Velodyne S2 and S3D are able to apply this processautomatically and to choose from eight power levels. Thepower level is set in an intelligent manner and enablesdifferent power levels for different reflective targets withinone scan. The S3D models has the unique ability to set thisparameter manually for all points and return the actual laserpower for each laser point, however, at the expense of 3 bitsmeaning a loss of 1.4 cm depth resolution. Furthermore, thenoise level can be set. The noise level describes the grounduncertainty floor for a detected signal from spurious lightand thermal excitations. In this sense, the parameters will betuned and an optimal performance point will be derived inSection IV-D.
In order to achieve a level 0 raw data point cloud thehardware inhomogeneity between each laser inside the Velo-dyne laser scanners has to be corrected. Each laser beamis collimated by an independent lens and driven by anindependent laser diode. Therefore, the beam divergence isnot uniform. Velodyne provides a factory-side calibrationcontaining a slope s and focal distance fd for each laserin order to correct the beam divergence. The raw intensityIR is corrected to IC with the know distance d from thepoint measurement by
IC = IR + s
∣∣∣∣∣(f0 −
(1− d
max(d)
)2)∣∣∣∣∣ (1)
Fig. 3: Experiment setup in the fog chamber.
Fig. 4: Experiment setup in the fog chamber.
where f0 is given by
f0 =
(1− fd
scale
)2
. (2)
One has to keep in mind that beam divergence is worse if thelaser beam is confronted with a scattering medium and moresophisticated methods can be defined for a known visibility.[22] offers a good introduction into the physics of scatteringprocesses.
III. EXPERIMENTS
Well-defined weather conditions are essential for testingand comparing different sensors. To the authors’ best knowl-edge, the climate chamber of CEREMA in Clermont Ferrand(France) is the only one in Europe that is able to producestable fog with a certain meteorological visual range Vin two different fog droplet distributions, i.e. radiation fog(small droplets) and advection fog (large droplets) [23]. Thefog density is continuously controlled by a transmissometerthat measures the atmospheric transmission factor T . Asdescribed in [23], the meteorological visual range V , alsoknown as visibility, can be derived from T as a more practicalparameter to determine the fog density.
We set up a static scene as depicted in Fig. 3. Thestatic scene contains many different targets, see Fig. 4: oldexhaust pipe (0), reflector posts (1), differently pedestrianmannequins, i.e. child (2), woman (3), man (4), traffic sign(5), tire without rim (6), car (CAR2), road marking andmultiple reflective targets. The lidar sensors are placed at thebeginning of the chamber where the test vehicle (CAR1) islocated. The Velodyne sensors, i.e. HDL64-S2 and HDL64-S3D, are mounted on top of CAR1 while the Ibeo sensors,i.e. Lux and Lux HD, are mounted as they would be on abumper on the left side of CAR1 at a height of approximately

0.9 m with a forward-looking field of view (see Fig. 3). Thestatic scene is recorded under different fog densities and fogdroplet distributions in order to investigate the influence offog to the lidar performance. Because the Velodyne HDL64-S3D internal parameters laser output power and noise groundlevel can be varied, the influence of these parameters onmeasurements in adverse weather can be estimated.
IV. EVALUATION
A. Qualitative Evaluation
For a first impression of the lidar performance in fog,we qualitatively assess the bird’s-eye views in Fig. 5 and6. Fig. 5 shows the bird’s-eye views for the strongest andlast return for both the Velodyne HDL64-S2 and the HDL64-S3D. The colors encode the intensity. In general, it is obviousthat fog impairs lidar performance heavily. The fog distur-bance results in a cloud around the sensor, because the signalis reflected by fog droplets close to the car. This createsthe need to filter such clutter points, drastically reducing theeffective resolution. In the HDL64-S3D scans a constant redcircle around the laser scanner is visible. Those points appearif the recorded echoes are below the noise level and aretherefore projected to their default position. This can onlybe observed if the power return mode is activated, otherwiseno point is returned. Moreover, the maximal viewing distanceis limited by attenuation because the illumination power islimited and possible reflected signals vanish in the signalnoise. The Velodyne HDL64-S3D delivers better results thanthe older model HDL64-S2. With respect to the bird’s-eyeview, there is no visible difference between strongest andlast return. For small visibilities around 13 m, all sensorssuffer more in radiation fog than in advection fog. Forhigher visibilities the performance is equal or even betterin radiation fog than in advection fog.
The bird’s-eye views for the Ibeo LUX and Ibeo LUXHD are illustrated in Fig. 6. The color coding indicates thecorresponding layer, i.e. layer 1 = red, layer 2 = blue , layer 3= green, layer 4 = yellow. As for the Velodyne sensors, fogreduces the maximal viewing distance heavily. By design,the Ibeo LUX HD contains less clutter than the Ibeo LUX.Starting from V = 36m, both Ibeo sensors are able todetect all targets in the experiment setup while the Velodynesensors still have difficulties in larger distances. There isno difference visible between advection and radiation fog.Compared to the Velodyne sensors, the Ibeo sensors canperceive the license plate of the car and the traffic sign at alower visibility starting from 24 m. As there is only a smalldifference between advection and radiation fog, we continuethe following evaluation with only advection fog.
B. Maximum viewing distances
For a more detailed evaluation, a person successivelymoved three large well-calibrated Zenith Polymer diffusereflective targets (50x50 cm) with reflectivities of 5%, 50%and 90% at a height of 0.9 m along the main viewing axis(see arrow in Fig. 3) in order to obtain the maximum viewingdistance. The person and the target are well separated as the
person holds the target 1.5 m away from their body with apole. The maximum viewing distance is obtained by takingthe distance from the last visible point on the targets. Allsensors used their automatic algorithm to set the proper laserparameters. Due to the length of the chamber, the evaluationof the maximum viewing distance dmax is limited. This limitdiffers in between the Ibeo and Velodyne sensors because ofdifferent mount points.
Fig. 7 shows the maximum viewing distance vs meteoro-logical visibility V for all four sensors, based on the 90 %target. Since the targets are kept within the fog chamber andget wet as is common for objects in foggy conditions, theyare not ideally diffusive reflective and a specular componentcan influence the measurements. In order to keep the targetsdry, heating elements would be required and these would in-fluence the fog homogeneity. Keeping the fog homogeneousis more important and as the targets are always directedtowards the laser scanner, our results show an upper boundwhich can decrease for dry targets. Fig. 7 clearly illustratesthat fog limits the maximum viewing distance dmax. At fogdensities with V < 40m, dmax is significantly less than 25 m.This is critical for driver safety as weather conditions candrop below 50 m visibility and the perceived depth fromthe laser scanners does not allow emergency stops on time.All sensors show equal performance within 0.5 m, despitethe older Velodyne HDL64-S2. In this evaluation, there isalmost no difference between strongest and last return. Thisis probably due to the specular component. Therefore, thelast returned point is also the strongest.
C. Strongest Return vs. Last Return
Strongest and last return differ in modality. In general, thestrongest return offers a more stable and accurate measure.But in adverse weather more received pulses grant a higherprobability to get an actual object responses. This compar-ison points out the difference between different echoes infog. In order to elaborate this difference, the static scenariois evaluated as follows: the point cloud 1.5 m in front of thecar is binned in 122 depth slices of 0.25 m. Then, the numberof points in each depth bin is obtained by averaging 100 pointclouds. Fig. 8 shows the mean number of points obtained ineach depth bin for different echoes. The power level is chosenautomatically by the laser scanner and the noise level is set tothe standard value 24. For clear weather, the strongest returnand last return give the same point cloud which serves asground truth reference. By increasing the fog density, it canbe clearly seen that the number of points decreases and thatthe last return shows a larger overlap with the reference pointcloud than the strongest return. The higher number of pointscompared to the ground truth is due to the clutter which isreceived at very close distance.
D. Parameter Evaluation
As described before, the Velodyne HDL64-S3D offers thepossibility to manually adjust the internal parameters laseroutput power and noise ground level. The power level canbe set to an integer value in between 0 and 7. The noise

HDL64-S2 HDL64-S3 strongest HDL64-S3 lastre
fere
nce
V=
45m
radi
atio
nad
vect
ion
V=
36m
radi
atio
nad
vect
ion
V=
24m
radi
atio
nad
vect
ion
V=
13m
radi
atio
nad
vect
ion
Fig. 5: Bird view of the Velodyne sensors for different fog types and fog densities. Color encodes the intensity.
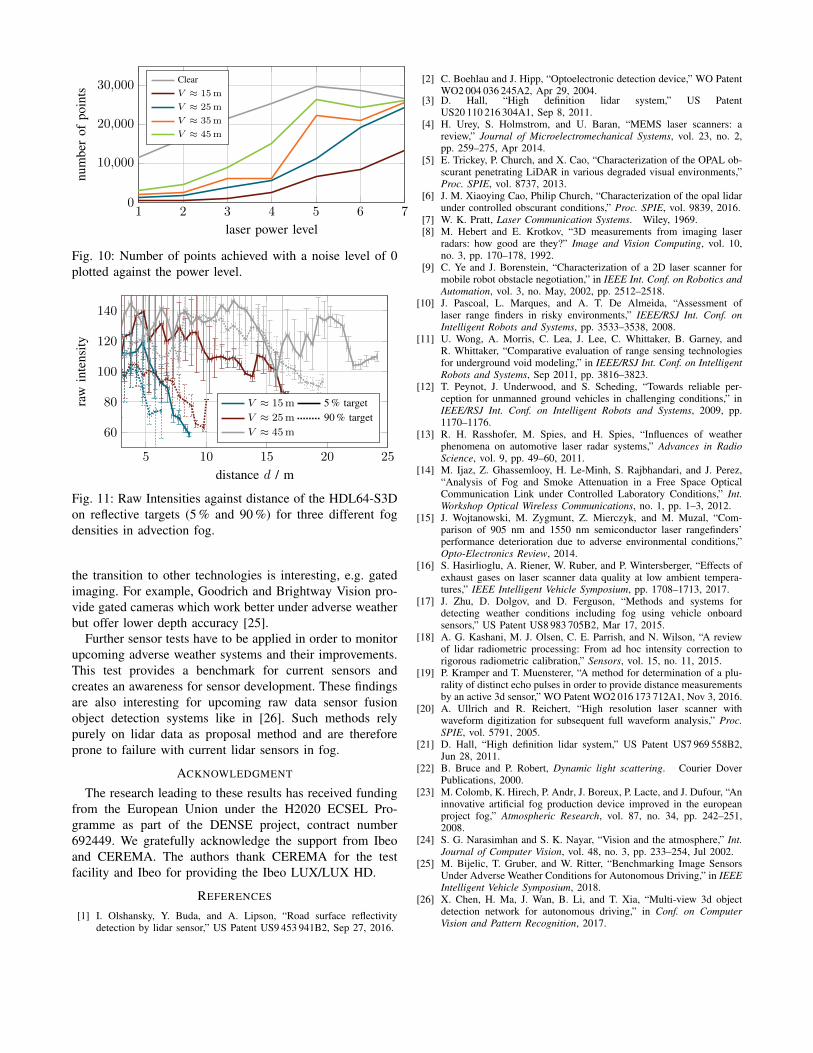
level is a byte value, thus 0-255, which corresponds to theintensity value range. The measurement was iterated overthe power levels 1 − 7. For each power level the noiselevels [0, 12, 24, 48, 96, 192, 240] were set. Fig. 9 shows thenumber of points and intensities binned in depth slices overthe measurement time in advection fog and for the last echo.As already mentioned, there is a clear correlation between thefog density and the number of points or rather the intensities.For all measurements, it can be seen that higher laser powerguarantee a longer range while the noise level can adjustpossible clutter. Fig. 10 gives the number of points vs powerlevel at one single noise level 0 for different fog densities.For increased fog densities, the number of returned pointsincreases with the laser output power. However, for clearconditions or light fog, high power levels make the laserprune to oversaturate the detector. Increasing the noise levelmeans that more points in close distance can be observedand therefore the clutter points show a high intensity. Thisindicates that a depth-dependent noise level is required to
filter out possible clutter points [19]. However, both param-eters are restricted to either saturate the receiver if the laserpower is too high, or to neglect many points if the noiselevel is too high.
E. Intensity Evaluation
The intensity values are of interest as they corresponddirectly to the measured signal peak amplitude. Therefore,the intensity also determines when the signal disappears. Inthis sense, it is interesting to determine which intensity ismeasured. In Fig. 11 the raw intensities for the 5 % and 90 %target against distance are plotted. The HDL64-S3D scanneris set to automatic laser power and the noise level is set to 24.As described in [24], intensity decreases exponentially dueto attenuation. However, a fit to an exponential scatteringmodel is not possible under the given confidence as thevalues jump when a less intense laser ring disappears fromthe target and is replaced by a higher intense laser ring. Thisinhomogeneity in between the laser rings of the HDL64-S3D can bee seen in Fig. 2 and is worse for the HDL64-

Ibeo LUX Ibeo LUX HDadvection radiation advection radiation
refe
renc
e45
m36
m24
m13
m
Fig. 6: Bird’s-eye views of the Ibeo sensors for different fog types and fog densities. Color encodes the layer: layer 1 (red),layer 2 (blue), layer 3 (green), layer 4 (yellow).
0 10 20 30 40 500
10
20end of chamber (Ibeo)end of chamber (Velodyne)
meteorological visibility V / m
max
imum
view
ing
dist
ance
dm
ax/
m
S2S3D lastS3D strongestLUXLUX HD
Fig. 7: Maximum viewing distance comparison for allsensors in advection fog and reflective targets with 90%reflectivity.
S2. On average, 5 % reflective targets show a ≈ 20 % lowerintensity than 90 % targets. It is worth to mention that thetarget disappears before reaching the minimum noise level.
V. CONCLUSION AND OUTLOOK
In conclusion, the performance of all four state of theart laser scanners breaks down in fog. In direct comparison,only the older Velodyne HDL64-S2 is outperformed. Othersensors show similar performance, which is also due to thestrict eye safety constraints lidar systems are facing withinthe near infrared (NIR) band to achieve laser class 1.
Manually adjusting internal parameters increases perfor-mance, e.g. increasing the laser output power for the HDL64-S3D increases range. Under adverse weather conditions, thesensors on average run only on level 5 out of 7 possible
2 4 6 8 10 12 140
1,000
2,000
distance m / m
num
ber
ofpo
ints
ClearV ≈ 35m
V ≈ 15m
last echostrongest echo
Fig. 8: Number of points in distance bins for clear weatherand advection fog different visibilities V . For each fogdensity, the strongest and last echo is shown.
levels. The sensor algorithm may be confused by early highintense clutter responses which lead to a reduction of laserpower. The authors assume that if any point is measured, thelaser power is not increased further.
Overall in fog the maximal viewing distance is limitedto a fraction of the clear weather capabilities. Below 40 mmeteorological visibility, perception is limited to less than25 m. Applying multiple echoes and adaptive noise levelsincreases performance in total by a magnitude of a fewmeters. But this is far away from reliable perception in densefoggy conditions. If this problem is not solved, autonomousdriving will be limited to level four.
Therefore, intense research is needed to adapt lidar solu-tions from the military or airborne sector to cost sensitiveand scalable laser scanners in the SWIR region. Otherwise,

0 100 200 300 400 500 6000
15
30
0 100 200 300 400 500 6000
15
30
0 100 200 300 400 500 6000
15
30
0 100 200 300 400 500 6000
15
30
0 100 200 300 400 500 6000
15
30
time t / s
101
102
103
num
ber
ofpo
ints
Cle
arV
≈45
mV
≈35
mV
≈25m
V≈
15m
dist
ance
d/
mpower level
1 2 3 4 5 6 7
(a) Number of points
0 100 200 300 400 500 6000
15
30
0 100 200 300 400 500 6000
15
30
0 100 200 300 400 500 6000
15
30
0 100 200 300 400 500 6000
15
30
0 100 200 300 400 500 6000
15
30
time t / s
0
0.2
0.4
0.6
0.8
1
inte
nsity
Cle
arV
≈45
mV
≈35
mV
≈25
mV
≈15
m
dist
ance
d/
m
power level
1 2 3 4 5 6 7
(b) Intensity
Fig. 9: Evaluation for different laser power and noise levels in advection fog with different visibilities. The measurementshows the iteration over seven power levels (1-7) and for each power level the noise level is increased as follows:[0, 12, 24, 48, 96, 192, 240].
1 2 3 4 5 6 70
10,000
20,000
30,000
laser power level
num
ber
ofpo
ints
ClearV ≈ 15m
V ≈ 25m
V ≈ 35m
V ≈ 45m
Fig. 10: Number of points achieved with a noise level of 0plotted against the power level.
5 10 15 20 25
60
80
100
120
140
distance d / m
raw
inte
nsity
V ≈ 15m 5 % targetV ≈ 25m 90 % targetV ≈ 45m
Fig. 11: Raw Intensities against distance of the HDL64-S3Don reflective targets (5 % and 90 %) for three different fogdensities in advection fog.
the transition to other technologies is interesting, e.g. gatedimaging. For example, Goodrich and Brightway Vision pro-vide gated cameras which work better under adverse weatherbut offer lower depth accuracy [25].
Further sensor tests have to be applied in order to monitorupcoming adverse weather systems and their improvements.This test provides a benchmark for current sensors andcreates an awareness for sensor development. These findingsare also interesting for upcoming raw data sensor fusionobject detection systems like in [26]. Such methods relypurely on lidar data as proposal method and are thereforeprone to failure with current lidar sensors in fog.
ACKNOWLEDGMENT
The research leading to these results has received fundingfrom the European Union under the H2020 ECSEL Pro-gramme as part of the DENSE project, contract number692449. We gratefully acknowledge the support from Ibeoand CEREMA. The authors thank CEREMA for the testfacility and Ibeo for providing the Ibeo LUX/LUX HD.
REFERENCES
[1] I. Olshansky, Y. Buda, and A. Lipson, “Road surface reflectivitydetection by lidar sensor,” US Patent US9 453 941B2, Sep 27, 2016.
[2] C. Boehlau and J. Hipp, “Optoelectronic detection device,” WO PatentWO2 004 036 245A2, Apr 29, 2004.
[3] D. Hall, “High definition lidar system,” US PatentUS20 110 216 304A1, Sep 8, 2011.
[4] H. Urey, S. Holmstrom, and U. Baran, “MEMS laser scanners: areview,” Journal of Microelectromechanical Systems, vol. 23, no. 2,pp. 259–275, Apr 2014.
[5] E. Trickey, P. Church, and X. Cao, “Characterization of the OPAL ob-scurant penetrating LiDAR in various degraded visual environments,”Proc. SPIE, vol. 8737, 2013.
[6] J. M. Xiaoying Cao, Philip Church, “Characterization of the opal lidarunder controlled obscurant conditions,” Proc. SPIE, vol. 9839, 2016.
[7] W. K. Pratt, Laser Communication Systems. Wiley, 1969.[8] M. Hebert and E. Krotkov, “3D measurements from imaging laser
radars: how good are they?” Image and Vision Computing, vol. 10,no. 3, pp. 170–178, 1992.
[9] C. Ye and J. Borenstein, “Characterization of a 2D laser scanner formobile robot obstacle negotiation,” in IEEE Int. Conf. on Robotics andAutomation, vol. 3, no. May, 2002, pp. 2512–2518.
[10] J. Pascoal, L. Marques, and A. T. De Almeida, “Assessment oflaser range finders in risky environments,” IEEE/RSJ Int. Conf. onIntelligent Robots and Systems, pp. 3533–3538, 2008.
[11] U. Wong, A. Morris, C. Lea, J. Lee, C. Whittaker, B. Garney, andR. Whittaker, “Comparative evaluation of range sensing technologiesfor underground void modeling,” in IEEE/RSJ Int. Conf. on IntelligentRobots and Systems, Sep 2011, pp. 3816–3823.
[12] T. Peynot, J. Underwood, and S. Scheding, “Towards reliable per-ception for unmanned ground vehicles in challenging conditions,” inIEEE/RSJ Int. Conf. on Intelligent Robots and Systems, 2009, pp.1170–1176.
[13] R. H. Rasshofer, M. Spies, and H. Spies, “Influences of weatherphenomena on automotive laser radar systems,” Advances in RadioScience, vol. 9, pp. 49–60, 2011.
[14] M. Ijaz, Z. Ghassemlooy, H. Le-Minh, S. Rajbhandari, and J. Perez,“Analysis of Fog and Smoke Attenuation in a Free Space OpticalCommunication Link under Controlled Laboratory Conditions,” Int.Workshop Optical Wireless Communications, no. 1, pp. 1–3, 2012.
[15] J. Wojtanowski, M. Zygmunt, Z. Mierczyk, and M. Muzal, “Com-parison of 905 nm and 1550 nm semiconductor laser rangefinders’performance deterioration due to adverse environmental conditions,”Opto-Electronics Review, 2014.
[16] S. Hasirlioglu, A. Riener, W. Ruber, and P. Wintersberger, “Effects ofexhaust gases on laser scanner data quality at low ambient tempera-tures,” IEEE Intelligent Vehicle Symposium, pp. 1708–1713, 2017.
[17] J. Zhu, D. Dolgov, and D. Ferguson, “Methods and systems fordetecting weather conditions including fog using vehicle onboardsensors,” US Patent US8 983 705B2, Mar 17, 2015.
[18] A. G. Kashani, M. J. Olsen, C. E. Parrish, and N. Wilson, “A reviewof lidar radiometric processing: From ad hoc intensity correction torigorous radiometric calibration,” Sensors, vol. 15, no. 11, 2015.
[19] P. Kramper and T. Muensterer, “A method for determination of a plu-rality of distinct echo pulses in order to provide distance measurementsby an active 3d sensor,” WO Patent WO2 016 173 712A1, Nov 3, 2016.
[20] A. Ullrich and R. Reichert, “High resolution laser scanner withwaveform digitization for subsequent full waveform analysis,” Proc.SPIE, vol. 5791, 2005.
[21] D. Hall, “High definition lidar system,” US Patent US7 969 558B2,Jun 28, 2011.
[22] B. Bruce and P. Robert, Dynamic light scattering. Courier DoverPublications, 2000.
[23] M. Colomb, K. Hirech, P. Andr, J. Boreux, P. Lacte, and J. Dufour, “Aninnovative artificial fog production device improved in the europeanproject fog,” Atmospheric Research, vol. 87, no. 34, pp. 242–251,2008.
[24] S. G. Narasimhan and S. K. Nayar, “Vision and the atmosphere,” Int.Journal of Computer Vision, vol. 48, no. 3, pp. 233–254, Jul 2002.
[25] M. Bijelic, T. Gruber, and W. Ritter, “Benchmarking Image SensorsUnder Adverse Weather Conditions for Autonomous Driving,” in IEEEIntelligent Vehicle Symposium, 2018.
[26] X. Chen, H. Ma, J. Wan, B. Li, and T. Xia, “Multi-view 3d objectdetection network for autonomous driving,” in Conf. on ComputerVision and Pattern Recognition, 2017.