marine transportation draft technical backgrounder · 17/11/2016 · draft technical backgrounder...
TRANSCRIPT

DRAFT TECHNICAL BACKGROUNDER Northern Ontario Multimodal Transportation Strategy
Marine Transportation
Prepared for the Ontario Ministry of Transportation and Ministry of Northern Development and Mines
Consulting Team: IBI Group | Hemson Consulting Ltd. November 2016

IBI GROUP DRAFT TECHNICAL BACKGROUNDER: MARINE TRANSPORTATION Prepared for the Ontario Ministry of Transportation and Ministry of Northern Development and Mines
November 2016
This draft technical backgrounder was prepared for the Ontario Ministry of Transportation and Ministry of Northern Development and Mines by the consultant team to assist the ministries in developing the Northern Ontario Multimodal Transportation Strategy. The opinions and ideas in this backgrounder are those of the authors and do not necessarily reflect the positions of the ministries or of the Government of Ontario.
Cette publication hautement spécialisée Marine Transportation Technical Backgrounder n'est disponible qu'en anglais conformément au Règlement 671/92, selon lequel il n’est pas obligatoire de la traduire en vertu de la Loi sur les services en français. Pour obtenir des renseignements en français, veuillez communiquer avec le Ministère des Transports au 1-844-505-5006 ou par courriel à [email protected].

IBI GROUP DRAFT TECHNICAL BACKGROUNDER: MARINE TRANSPORTATION Prepared for the Ontario Ministry of Transportation and Ministry of Northern Development and Mines
Table of Contents
November 2016 i
1 Introduction ............................................................................................... 1
2 Jurisdiction, Policies and Programs ....................................................... 3
2.1 Vessel Registry ................................................................................. 3
2.2 Ports ................................................................................................. 3
2.3 Maritime Pilotage .............................................................................. 4
2.4 Programs .......................................................................................... 4
3 Waterways ................................................................................................. 5
3.1 Great Lakes – St. Lawrence Seaway System ................................... 8
Seaway Locks....................................................................................... 8
GLSLS Pilotage .................................................................................. 10
3.2 Hudson Bay – James Bay .............................................................. 12
4 Ports ......................................................................................................... 13
4.1 Port Administration ......................................................................... 13
4.2 Physical Port Characteristics .......................................................... 14
Port of Thunder Bay ............................................................................ 14
Port of Sault Ste. Marie ....................................................................... 19
5 Marine Vessels ........................................................................................ 20
6 Goods Movement .................................................................................... 23
6.1 Freight Operators............................................................................ 23
6.2 Goods Movement by Port ............................................................... 23
Port of Thunder Bay ............................................................................ 29
US Traffic on the Upper Lakes ............................................................ 30
6.3 Hudson Bay and James Bay .......................................................... 30
7 Passenger Travel .................................................................................... 31
7.1 Ferry Services ................................................................................ 31
Provincially-Operated Services ........................................................... 31

IBI GROUP DRAFT TECHNICAL BACKGROUNDER: MARINE TRANSPORTATION Prepared for the Ontario Ministry of Transportation and Ministry of Northern Development and Mines
Table of Contents (continued)
November 2016 ii
Other Ferry Services ........................................................................... 31
7.2 Lake Cruises ................................................................................... 32
Challenges to Operating Cruise Ships on the Great Lakes ................. 32
8 Operating Season Trends ....................................................................... 35
9 Water Level Trends ................................................................................. 37
9.1 Great Lakes .................................................................................... 37
9.2 Hudson Bay and James Bay .......................................................... 40
10 Environmental Considerations of Marine Shipping ............................. 41
11 Outlook for the Northern Ontario Marine Sector .................................. 42
11.1 Great Lakes Freight Transportation ................................................ 42
Grain ................................................................................................. 43
Iron Ore and Limestone ...................................................................... 43
Coal ................................................................................................. 43
Potash ................................................................................................ 43
Aggregates ......................................................................................... 44
Emerging Industries ............................................................................ 44
Ring of Fire ......................................................................................... 44
The Future of Great Lakes Marine Traffic ........................................... 44
Summary ............................................................................................ 45
11.2 James Bay/Hudson Bay Marine Traffic ........................................... 45
11.3 Marine Passenger Services on the Upper Great Lakes .................. 46
12 Issues and Opportunities ....................................................................... 47
12.1 Summary of Issues ......................................................................... 47
Limited Freight Markets for Marine Shipping ....................................... 47
Depressed Cargo Markets .................................................................. 47
Constrained Passenger Markets ......................................................... 48
Low Water Levels ............................................................................... 48
Infrastructure Constraints .................................................................... 48
Potential Loss of Port Infrastructure and Access to Currently Inactive Ports ........................................................................................ 48
12.2 Opportunities .................................................................................. 49
Potential Increased Energy Efficiency of Marine Mode ....................... 49

IBI GROUP DRAFT TECHNICAL BACKGROUNDER: MARINE TRANSPORTATION Prepared for the Ontario Ministry of Transportation and Ministry of Northern Development and Mines
Table of Contents (continued)
November 2016 iii
Cargo Markets .................................................................................... 49
Passenger Markets ............................................................................. 50
Longer Ice-Free Shipping Seasons ..................................................... 50
Container Vessel Operations on the Great Lakes ............................... 50
Improving Operation of the St. Lawrence and Welland Canal Locks .. 50
References ....................................................................................................... 52
Alternate Text for Exhibits .............................................................................. 55
List of Exhibits
Exhibit 1.1: Northern Ontario Multimodal Transportation Infrastructure ..... 2
Exhibit 3.1: Great Lakes Water Depths ..................................................... 6
Exhibit 3.2: Water Depths in Hudson Bay, James Bay, and the Hudson Strait ............................................................................................ 7
Exhibit 3.3: View of Soo Locks Looking East, with Laker Exiting the Locks ........................................................................................... 9
Exhibit 3.4: Pilotage Fees in International District 3 ................................ 11
Exhibit 3.5: Pilotage Fees in Undesignated and Contiguous Waters in the Great Lakes ............................................................................... 11
Exhibit 4.1: Characteristics of Northern Ontario’s Ports .......................... 15
Exhibit 4.2: Lake Huron Bathymetry: Manitoulin Island/North Channel/Georgian Bay Area ...................................................... 16
Exhibit 4.3: Georgian Bay Bathymetry: Parry Sound Area ...................... 17
Exhibit 4.4: Vessel Loading at the Port of Thunder Bay .......................... 18
Exhibit 4.5: Port of Thunder Bay Piers and Storage Facilities ................. 18
Exhibit 5.1: Select Marine Vessel Characteristics ................................... 21
Exhibit 5.2: US and Canadian Laker Vessels at Sault Locks .................. 22
Exhibit 5.3: Canadian Laker (“Seaway Max”) Vessel Example ................ 22
Exhibit 6.1: Cargo Handled at Northern Ontario Marine Ports, 2011 ....... 24

IBI GROUP DRAFT TECHNICAL BACKGROUNDER: MARINE TRANSPORTATION Prepared for the Ontario Ministry of Transportation and Ministry of Northern Development and Mines
Table of Contents (continued)
November 2016 iv
Exhibit 6.2: Cargo Shipped to/from Northern Ontario Marine Ports by Commodity Type, 2011 .............................................................. 25
Exhibit 6.3: Cargo Shipped to/from Northern Ontario Marine Ports by Origin/Destination Port and Commodity Type, 2011 .................. 26
Exhibit 6.4: Cargo Handled at Northern Ontario Marine Ports, 2001-2011 ........................................................................................... 27
Exhibit 6.5: Thunder Bay Historic Cargo and Vessel Handling ................ 29
Exhibit 8.1: Historic Dates of Opening and Closing of Navigation at Port of Thunder Bay .............................................................................. 35
Exhibit 9.1: Historic Water Level Trends in the Great Lakes, 1918–2015 38
IBI GROUP DRAFT TECHNICAL BACKGROUNDER: MARINE TRANSPORTATION Prepared for the Ontario Ministry of Transportation and Ministry of Northern Development and Mines
November 2016 1
1 Introduction
Bordered by the Great Lakes to the south and Hudson and James Bay to the north, and with numerous smaller lakes and waterways throughout, Northern Ontario has significant potential for marine transportation services. Three types of marine movements currently play an important role in the economy of Northern Ontario:
the Great Lakes-St. Lawrence Seaway system;
marine resupply operations on James Bay and Hudson Bay; and
ferry and passenger services.
Approximately 20 million tonnes of cargo are handled annually at Northern Ontario’s marine ports. Northern Ontario’s marine ports are shown in relation to the region’s multimodal transportation system in Exhibit 1.1.
The purpose of this technical backgrounder is to outline the current state of marine transportation in Northern Ontario, and to discuss outlooks, issues, and potential opportunities for this sector.

IBI GROUP DRAFT TECHNICAL BACKGROUNDER: MARINE TRANSPORTATION Prepared for the Ontario Ministry of Transportation and Ministry of Northern Development and Mines
November 2016 2
Exhibit 1.1: Northern Ontario Multimodal Transportation Infrastructure

IBI GROUP DRAFT TECHNICAL BACKGROUNDER: MARINE TRANSPORTATION Prepared for the Ontario Ministry of Transportation and Ministry of Northern Development and Mines
November 2016 3
2 Jurisdiction, Policies and Programs
The Canadian constitution allocates maintenance and operations of marine systems to the federal government but, as will be described, there are areas of intervention that have been used by provincial, municipal and private agencies.
2.1 Vessel Registry
Under international law, every commercial vessel must be registered with a country. The country to which a vessel is registered is referred to as its “flag state”, and the ship literally bears the country’s flag for ease of identification. The country with which the vessel is registered establishes and enforces regulations regarding the vessel’s ownership, safety, administration, and technical and labour matters. Most vessels in the Great Lakes are “Canadian-flag ships” or “US-flag ships”, although foreign flag ships are also common for ships carrying overseas cargos.
The Coasting Trade Act, 1992, a federal statute, regulates Canada’s domestic marine activity, supporting domestic marine interests. Among other provisions, the Act stipulates that non-domestic vessels must not serve two Canadian ports in succession. The US equivalent is the Merchant Marine Act of 1920, also known as the Jones Act which has the same prohibition about foreign
ships carrying cargo between US ports. The term for transporting goods or passengers between two points in the same country by a vessel or registered in another country is cabotage.
2.2 Ports
All ports in Canada are federally regulated through legislation, primarily the Canada Marine Act. In the 1990s, port authorities were established to operate
major Canadian ports on a commercial basis. The only Canada Port Authority in Northern Ontario is at Thunder Bay.
The Department of Fisheries and Oceans (DFO), a Federal agency, is responsible for the construction of public ports. Navigation aids and traffic control are provided by the Canadian Coast Guard, which is part of the DFO.
The administration of specific Northern Ontario ports is discussed further in Section 4.

IBI GROUP DRAFT TECHNICAL BACKGROUNDER: MARINE TRANSPORTATION Prepared for the Ontario Ministry of Transportation and Ministry of Northern Development and Mines
November 2016 4
2.3 Maritime Pilotage
Under the Canadian Pilotage Act, certain vessels must carry a local pilot to
help the vessel safely navigate the lakes system.
In the Great Lakes, pilotage is administered by the Great Lakes Pilotage Authority. Pilotage regulations for the Great Lakes – St. Lawrence Seaway System are discussed in further detail in Section 3.1.
2.4 Programs
The Northern Ontario Heritage Fund Corporation (NOHFC) has provided funding for port development in the North. Waterfront redevelopment community infrastructure projects that have potential to contribute to economic development and job creation are eligible for funding through the NOHFC. For example, the NOHFC funded the preliminary engineering and site plan studies for the proposed Port of Algoma project in Sault Ste. Marie, and will provide $1 million for the Port of Thunder Bay to increase its loading area and storage.
Private sector investors, municipal governments, and the Federal Government also help to fund port facilities, although there are few dedicated marine transportation programs in place.

IBI GROUP DRAFT TECHNICAL BACKGROUNDER: MARINE TRANSPORTATION Prepared for the Ontario Ministry of Transportation and Ministry of Northern Development and Mines
November 2016 5
3 Waterways
Exhibit 3.1 and Exhibit 3.2 shows the bathymetry — water depths — of the Great Lakes and of the Hudson Bay area, respectively, together with ports on these waterways. The depths shown are based on a standard or datum and are affected by tides, high winds, and in the case of the Great Lakes, fluctuating lake levels.
Freight-carrying vessels used on the Great Lakes tend to have drafts approaching 8.1 m1 (26.5 feet). This is the maximum draft accepted in St.
Lawrence Seaway and Welland Canal channels and locks. While there is sufficient depth throughout much of these waterways for such vessels, areas less than this depth, shown in red, indicate a challenge for large vessels. (Narrow channels have been cut through Lake St. Clair — between Lake Huron and Lake Erie — and at the west end of Lake Erie to allow cargo vessels to pass through these shallower areas.)
Low lake levels in channels and adjacent to docks can affect navigation and can limit the types of vessels or the loads they carry.
Lake Superior, at the highest elevation of the Great Lakes, is also the deepest, reaching depths of over 300 m, and along the north shore, water depths are 40 m or more close to land. In contrast, to the south, Lake Erie is much shallower: the depth at its deepest point is 64 m.
Along the Hudson and James Bay shorelines, water depths increase more gradually, with James Bay depths reaching no more than 40 m and less than 10 m in its southwest coastal areas. On the west coast of Hudson Bay, Churchill, Manitoba has a deep-water port, serving large ocean-going vessels typically loaded with grain from Western Canada and also providing resupply operations to remote communities on Hudson Bay during the ice-free summer months.
These waterways are described in further detail below.
1 Note that the fresh water of Great Lakes offers less buoyancy than saltwater bodies do. The same vessels would sit a bit higher in ocean water.

IBI GROUP DRAFT TECHNICAL BACKGROUNDER: MARINE TRANSPORTATION Prepared for the Ontario Ministry of Transportation and Ministry of Northern Development and Mines
November 2016 6
Exhibit 3.1: Great Lakes Water Depths
Bathymetry Data Source: National Geophysical Data Center (1999)

IBI GROUP DRAFT TECHNICAL BACKGROUNDER: MARINE TRANSPORTATION Prepared for the Ontario Ministry of Transportation and Ministry of Northern Development and Mines
November 2016 7
Exhibit 3.2: Water Depths in Hudson Bay, James Bay, and the Hudson Strait
Bathymetry Data Source: Huot-Vézina et al. (2013).

IBI GROUP DRAFT TECHNICAL BACKGROUNDER: MARINE TRANSPORTATION Prepared for the Ontario Ministry of Transportation and Ministry of Northern Development and Mines
November 2016 8
3.1 Great Lakes – St. Lawrence Seaway System
The Great Lakes St. Lawrence Seaway (GLSLS) System permits the passage of ocean-going vessels from the Atlantic Ocean into the heart of the continent as far as the western shore of Lake Superior. As such, it enables the marine mode – both lakers and ocean-going vessels – to serve large numbers of ports throughout the system, including 12 ports in Northern Ontario.
Seaway Locks
The size of the vessels that can enter the Lakes is limited by the dimensions of the lock chambers along the system. The most limiting of the locks are the ones in the Welland Canal between Lakes Erie and Ontario, built to bypass Niagara Falls, and the canals on the St. Lawrence River between Lake Ontario and Montreal. The Soo Locks at Sault Ste. Marie, Michigan, have greater dimensions than those in the Welland Canal and the Montreal/Lake Ontario locks.
This GLSLS system has played a historic role in the Canada’s economic development. Locks were constructed in the nineteenth century — and the first lock on the St. Mary’s river was built even earlier, by the North West Company in 1797. These locks and canals have been enlarged in stages over time until 1959 to take bigger vessels.
Most locks on the GLSLS are Canadian owned and operated; however, all of the Soo Locks carrying commercial traffic at Sault Ste. Marie were built by the United States (as are the Snell and Eisenhower locks in the vicinity of Prescott in the St. Lawrence River). The Soo locks consist of five parallel locks; the four southerly locks (three of which are currently operational) are owned and maintained by the United States Army Corps of Engineers. The fifth smaller lock on the Canadian side was opened in 1998 and is used for recreational and tour vessels. Exhibit 3.3 shows an aerial view of the Soo Locks; there is no cost to users for passage through these locks. There are tolls on travel through the Welland and St. Lawrence locks.

IBI GROUP DRAFT TECHNICAL BACKGROUNDER: MARINE TRANSPORTATION Prepared for the Ontario Ministry of Transportation and Ministry of Northern Development and Mines
November 2016 9
Exhibit 3.3: View of Soo Locks Looking East, with Laker Exiting the Locks
Source: By U.S. Army Corps of Engineers soldier or employee - http://www.lre.usace.army.mil/newsandevents/publications/publications/soolocks-saultste-marie/aerialpicture2/, Public Domain, https://commons.wikimedia.org/w/index.php?curid=592956

IBI GROUP DRAFT TECHNICAL BACKGROUNDER: MARINE TRANSPORTATION Prepared for the Ontario Ministry of Transportation and Ministry of Northern Development and Mines
November 2016 10
GLSLS Pilotage
There are four compulsory pilotage areas for vessels in the Seaway system. These are as follows, listed from east to west:
Cornwall District: Canadian waters of the St. Lawrence River between the northern entrance to St. Lambert Lock near Montreal to the pilot boarding station near St. Regis, Quebec, near Cornwall, Ontario;
International District 1: Canadian waters continuing west from Cornwall District through to the Port of Kingston area;
International District 2: Three areas in Lake Erie area:
the Welland Canal
Lake Erie west of approximately Point Pelee (the area of Lake Erie having the most shallow water depths)
the Canadian waters of the connecting channels between Lake Erie and Lake Huron
International District 3: the Canadian waters of St. Marys River connecting Lake Huron and Lake Superior, as far north as but not including the Sault Ste. Marie locks.
In addition to the above designated compulsory pilotage areas, the following vessels are required to carry pilots in all Canadian waters in Lakes Ontario, Erie, Huron and Superior, including undesignated areas:
a ship of more than 1,500 gross tonnage; and
a ship that is not registered in Canada and is over 35 m in length.
Exceptions to pilotage requirements are made for ferries that run on a regular schedule and for tugs in specific situations.
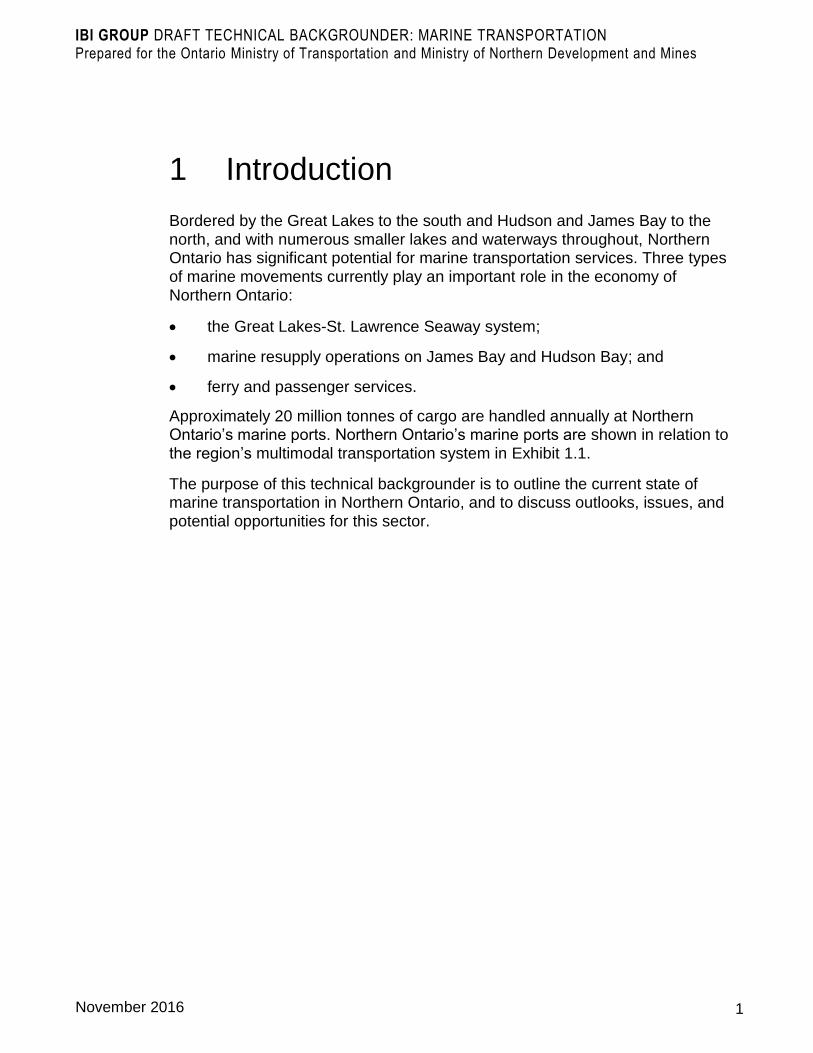
When pilotage is required, vessel operators are required to pay fees set in the Great Lakes Pilotage Tariff Regulations. The fee structures vary by pilotage
district. The fee structure for Northern Ontario waters is outlined for International District 3 in Exhibit 3.4 and for the Undesignated and Contiguous Waters of the Great Lakes in Exhibit 3.5.
IBI GROUP DRAFT TECHNICAL BACKGROUNDER: MARINE TRANSPORTATION Prepared for the Ontario Ministry of Transportation and Ministry of Northern Development and Mines
November 2016 11
Exhibit 3.4: Pilotage Fees in International District 3
Pilotage Service Basic Charge
Movage* $1,139
Trip, other than a movage*, between:
the southern limit of the District and the northern limit of the District or the Algoma Steel Corporation Wharf at Sault Ste. Marie, Ontario
$3,025
the southern limit of the District and Sault Ste. Marie, Michigan, or any point in Sault Ste. Marie, Ontario, other than the Algoma Steel Corporation Wharf at Sault Ste. Marie, Ontario
$2,533
the northern limit of the District and Sault Ste. Marie, Ontario, including the Algoma Steel Corporation Wharf at Sault Ste. Marie, Ontario, or Sault Ste. Marie, Michigan
$1,139
Note: * Movage is defined in the Great Lakes Pilotage Regulations as “shifting of a ship from one place to another within the confines of a port but does not include shifting carried out solely by means of a ship’s lines for the purpose of loading or unloading cargo or clearing berthing space for use by another ship.”
Source: Great Lakes Pilotage Regulations
Exhibit 3.5: Pilotage Fees in Undesignated and Contiguous Waters in the Great Lakes
Pilotage Service Basic Charge
Being present on board for a six-hour period or part of a six-hour period, in the undesignated waters and contiguous waters of:
Lake Ontario $1,001
Lake Erie $880
Lake Huron, Lake Michigan or Lake Superior $608
Docking or undocking each time in the undesignated waters and contiguous waters of:
Lake Ontario $953
Lake Erie $678
Lake Huron, Lake Michigan or Lake Superior $582
Source: Great Lakes Pilotage Regulations

IBI GROUP DRAFT TECHNICAL BACKGROUNDER: MARINE TRANSPORTATION Prepared for the Ontario Ministry of Transportation and Ministry of Northern Development and Mines
November 2016 12
3.2 Hudson Bay – James Bay
The shallow waters near the shores of Hudson Bay and James Bay hinder deep water shipping along the northern shore. Marine activity in the Far North of Ontario is limited to Arctic resupply barges (discussed in Section 5) operating from Moosonee from summer through early fall, with service to communities such as Fort Albany, Attawapiskat, and Fort Severn, as well as some trips to Quebec communities.
Hudson Bay’s western shore is also home to Canada’s only Arctic seaport with a railway connection to the south, at Churchill, Manitoba. This port can accommodate larger ocean-going vessels, including Panamax ships, which
need 39.5-ft. (12.04-m) drafts. The port is currently privately owned, and has mainly carried grain exports that arrive by rail from the Prairie Provinces. In the summer of 2016, however, the owners of the port have suspended operations because of financial difficulties.
Development of a deep water port in Northern Ontario would be very difficult and expensive. As was shown previously in Exhibit 3.2, the 0 to 10-m water depth (highlighted in red) extends a considerable distance from the shore. A deep water port would require significant dredging to accommodate the draft of larger vessels, including the dredging of an approximately 10-km long trench in the bay to handle deeper vessels. Adding to the complexity and cost, the trench would have to be cleared every year because it would naturally fill in.

IBI GROUP DRAFT TECHNICAL BACKGROUNDER: MARINE TRANSPORTATION Prepared for the Ontario Ministry of Transportation and Ministry of Northern Development and Mines
November 2016 13
4 Ports
Northern Ontario marine shipping ports are of varying sizes, the ones handling the largest volumes being Thunder Bay, Sault Ste. Marie and Meldrum Bay. These larger ports and several smaller ports are along the Great Lakes, as shown in Exhibit 3.1.
The barges serving James Bay and Hudson Bay communities do not require port facilities. (Attempts have been made to build port facilities for the most northerly Ontario communities in the past, but these facilities have sustained
irreparable ice damage during the winter seasons.)
Most ports tend to be specialized in the goods moved at each port. For example, large amounts of grain and other bulk commodities are loaded onto vessels for export at the Port of Thunder Bay, and Sault Ste. Marie handles large amounts of steel-related materials (e.g. iron ore, coal and limestone inputs and steel products outbound). Goods moved at each port are discussed in Section 6.
4.1 Port Administration
The Port of Thunder Bay is administered by the Thunder Bay Port Authority (TBPA). The TBPA is one of the Canada Port Authorities, which were created by the Federal Government. These Port Authorities are local bodies with a financially autonomous commission made up of federal, provincial and local representatives. In theory they are supposed to pay all of their expenses from revenues and they essentially do so except for occasional special programs, such as the Province’s recent announcement of $1 million to expand the port’s Keefer Terminal.
Sault Ste. Marie is essentially a private port that is mostly operated by the Essar Steel Algoma with some other firms also using the docks by agreement. There are on-going studies to develop a public port facility, but the implementation for this has not yet been finalized; the current financial
difficulties of Essar Steel may also delay the plan.
Meldrum Bay, Bruce Mines, Spragge, Fisher Harbour and Whitefish are privately-operated ports.
Other ports on Lake Superior and on Georgian Bay are active for fishing, recreation, and local supply.

IBI GROUP DRAFT TECHNICAL BACKGROUNDER: MARINE TRANSPORTATION Prepared for the Ontario Ministry of Transportation and Ministry of Northern Development and Mines
November 2016 14
4.2 Physical Port Characteristics
The physical characteristics of individual Northern Ontario ports are summarized in Exhibit 4.1. The physical and administrative characteristics of the two largest Northern Ontario ports, Thunder Bay and Sault Ste. Marie, are described further below.
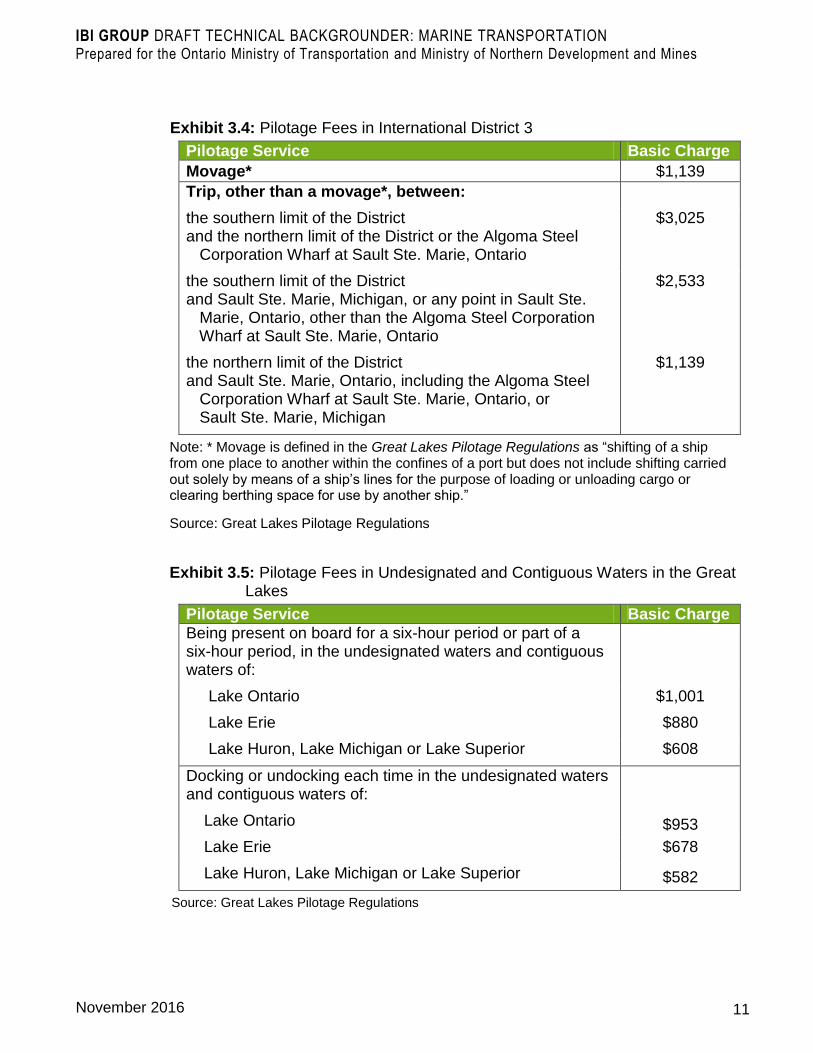
Of particular importance to the viability and operations of a port are water depths in the harbour and approaches. Water depths in the vicinity of ports in the Manitoulin Island/North Channel area of Lake Huron are shown in Exhibit 4.2, and are shown for the Parry Sound/Georgian Bay area in Exhibit 4.3. A water depth of about 8 m is the limit for viability for moving marine freight, and the exhibits show that much of the area is greater than this depth. Depths are generally greater in Lake Superior, as shown in Exhibit 3.1, and approach depths are not a limiting factor for its ports, in particular the major ports of Thunder Bay and Sault Ste. Marie.Port of Thunder Bay
The main role of the Port of Thunder Bay is exporting commodities, particularly grain, from Western Canada.
CN and CP rail lines both access the Port of Thunder Bay and a 200-railcar marshalling yard. The port is also connected to Highways 11 and 17 by a 4-lane artery, the Harbour Expressway. Several highway carriers are tenants at the port (Research and Traffic Group, 2009).
The port has storage space for a variety of commodities; the port’s storage facilities are shown in Exhibit 4.4 and itemized in Exhibit 4.5.
The port’s Keefer terminal has over 500,000 sq. ft. of inside storage space and 16 acres of open storage. The Port has plans to reconfigure the Keefer terminal. The project will include replacing one of the warehouse with new storage areas, as well as a new dock-side shore crane to load/unload cargo destined for Canada’s West.
The Port Authority has also partnered with CN to develop a gateway for cargo destined for Alberta’s oil sands, after CN improved its route to Fort McMurray, directing cargo to the port that would have otherwise been unloaded at a US Great Lakes port (Research and Traffic Group, 2009).
In April 2015, the Ministry of Northern Development and Mines announced that the Province would invest $1 million through the Northern Ontario Heritage Fund Corporation (NOHFC) to remove a disused building at the Port’s Keefer Terminal and build a new larger loading area with 40,000 square feet of new storage to increase the port’s capacity (MNDM, 2016).

IBI GROUP DRAFT TECHNICAL BACKGROUNDER: MARINE TRANSPORTATION Prepared for the Ontario Ministry of Transportation and Ministry of Northern Development and Mines
November 2016 15
Exhibit 4.1: Characteristics of Northern Ontario’s Ports
Port
Water Depth (m)
Number of Docks (i.e. Vessel Capacity)
Handling Facilities Storage
Dock Access by Road
Distance to Provincial Highway
Dock Access by Rail
Port Land Area (ha)
Customs Facilities
Ports Handling > 2 Million Tonnes Cargo Annually
Thunder Bay 5.8-8.2 21 Main St/ Harbour Expy 5 km to Hwy 17/61 CN and CP 160
Sault Ste. Marie 7-9.1 10 Lyons Ave (Essar) or Bay St (Public)
5 km to Hwy 17
CN -
180
Meldrum Bay <10 2 Lafarge Rd 8.6 km to Hwy 540 - 12
Other Northern Ontario Ports
Badgeley Island Quarry Dock
<10 1 N/A N/A - 1
Bruce Mines (Trap Rock Loading Facility)
<10 1 Unnamed Road 1 km to Hwy 17 - 2.3
Fisher Bay <10 Unnamed Road 7.6 km to Hwy 6 - 2
Heron Bay <10 1 Unnamed Road 2.5 km to Hwy 627 - 1
Marathon <10 1 Winton St 6.3 km to Hwy 17 - 3
Parry Sound Harbour <10 1 Bay St 2.9 km to Hwy 400 - 0.9
Port of Thessalon (Smelter Bay)
<10 2 Peachey St 1.5 km to Hwy 17 - 4.2
Spragge Harbour <10 1 Highway 17 - - 8.5
Whitefish <10 Bay of Islands Rd 600 m to Hwy 6 - ?

IBI GROUP DRAFT TECHNICAL BACKGROUNDER: MARINE TRANSPORTATION Prepared for the Ontario Ministry of Transportation and Ministry of Northern Development and Mines
November 2016 16
Exhibit 4.2: Lake Huron Bathymetry: Manitoulin Island/North Channel/Georgian Bay Area
Bathymetry Data Source: National Geophysical Data Center (1999)
IBI GROUP DRAFT TECHNICAL BACKGROUNDER: MARINE TRANSPORTATION Prepared for the Ontario Ministry of Transportation and Ministry of Northern Development and Mines
November 2016 17
Exhibit 4.3: Georgian Bay Bathymetry: Parry Sound Area
Bathymetry Data Source: National Geophysical Data Center (1999)

IBI GROUP DRAFT TECHNICAL BACKGROUNDER: MARINE TRANSPORTATION Prepared for the Ontario Ministry of Transportation and Ministry of Northern Development and Mines
November 2016 18
Exhibit 4.4: Vessel Loading at the Port of Thunder Bay
Photo Credit: Margaret Tomei
Exhibit 4.5: Port of Thunder Bay Piers and Storage Facilities
Terminal/Pier name Length (m)
Depth (m)
Storage Capacity (tonnes)
Commodity Group
Canada Malting 305 8.2 80,900 Grain
Cargill 518 8.2 176,020
Mission 411 8.2 121,240
P&H Elevator 350 5.2 40,800
Richardson 396 8.2 210,030
Viterra A 500 8.2 362,000
Viterra B 510 8.2
Viterra C 320 8.2 235,000
Western Grain #10 160 7 30,000
Ontario Power Generation 207 8 2,000,000 Coal
Resolute 244 6.1 25,000 Forest Products
Empire State (Lafarge) 305 7.7 85,000 Stone, sand and bulk cargo Thunder Bay Terminals 223 8.2 40,000
Valley Camp {Bulk Dock} 550 8.2 100,000
Valley Camp {Potash Dock} 201 8.2 N/A
Keefer Terminal {Shed#1-#2} 762 7.9 N/A General cargo
Keefer Terminal {Shed#3-#4} 762 7.9 N/A
General Chemicals 91 7.3 26,632 Liquids
Petro-Canada 131 7.9 54,000
Great West Timber 122 5.8 N/A Lumber
Smurfit Stone Pulp and paper
Source: Research and Traffic Group (2009)

IBI GROUP DRAFT TECHNICAL BACKGROUNDER: MARINE TRANSPORTATION Prepared for the Ontario Ministry of Transportation and Ministry of Northern Development and Mines
November 2016 19
Port of Sault Ste. Marie
Most of the volumes through existing facilities at Sault Ste. Marie are related to operations of Essar Steel Algoma, which owns the harbour complex next to its steel production facilities. The port is above the St. Mary’s River rapids and locks at the Lake Superior level. Some other materials move over the port’s facilities with permission of Essar.
The Port is close to Highway 17 and US Interstate 75 (via the Sault Ste. Marie International Bridge). There is a CN rail yard adjacent to Essar Steel’s facility.
Essar Steel’s facility currently has 9 docks with water depths ranging from 7 to 9.1 metres.
According to a report on harbour expansion, the harbour complex faces challenges accommodating current marine movements because of deteriorating docks, limited storage, and a lack of water depth to accommodate larger vessels (KPMG, 2013). The report outlines that there is potential for significant growth from existing harbour users, potential users that currently ship goods through other ports, and other potential users with current or planned industrial operations in Northern Ontario. An agreement to develop a public port based on Essar lands (the Port of Algoma) was reached, but has reportedly not proceeded due to Essar Steel’s financial difficulties.
In addition to the Essar port facility, there is another facility located east of the Soo Locks at the Lake Huron level. The facility is operated by Purvis Marine Limited after Transport Canada divested the port in the late 1990s (KPMG, 2013). The port has one 150-m dock with a 6.1-m water depth. The dock primarily handles inbound petro-chemicals and infrequent shipments of cargo by barge from Michigan too large to cross the international bridge.
The facility is close to Highway 17, but has no direct rail access.

IBI GROUP DRAFT TECHNICAL BACKGROUNDER: MARINE TRANSPORTATION Prepared for the Ontario Ministry of Transportation and Ministry of Northern Development and Mines
November 2016 20
5 Marine Vessels
Characteristics of marine vessels used in Northern Ontario are summarized in Exhibit 5.1; large vessels used at the Port of Churchill (Panamax ocean-going vessels) are also included for comparison. There are three types of vessels that use the GLSLS system; the relative sizes of the first two types can be seen in Exhibit 5.2:
Canadian-flagged domestic ships or “Canadian lakers”, also shown in Exhibit 5.3 and earlier in Exhibit 3.3, are vessels built specifically for the Great Lakes with their dimensions being set by the width, depth and length of the locks on the Welland and St. Lawrence canal. These efficiently carry high volumes of bulk cargo. However, their long narrow structure does not permit them to enter the Atlantic Ocean, as they are not strong enough to survive very large waves. In Northern Ontario they carry large volumes of traffic from Thunder Bay and to/from Sault Ste. Marie. Some of this cargo is also handled directly to overseas destinations by ocean-going vessels, but the majority is exported in lakers to transfer ports on the lower St. Lawrence, where bigger ocean-going vessels can receive the cargo.
A full size laker (730 feet long and 78 feet wide as restricted by the dimensions of the locks on the Welland Canal and the St. Lawrence River) can carry up to 30,000 tonnes of cargo, slightly less when going through the Welland/Seaway locks where the depth is restricted to approximately 8 m (26.5 feet). If on a particular trip, the vessel is not passing through the locks then more cargo can be loaded, for example on a trip from Meldrum Bay to a Lake Huron or Lake Erie port.
There are also some larger US-flagged lakers that can carry almost three times this load that only operate on the Upper Lakes and never go through the Welland Canal.
Ocean going vessels, or “salties”, can travel to the centre of the continent via the canal systems, as long as they are smaller than Canadian lakers; otherwise, their cargoes can be handled at Quebec marine ports. These vessels are typically limited by their beam (maximum width).
With a Canadian laker able to carry as much as almost 1,000 transport trucks (with a typical transport truck carrying a load of about 30 tonnes) or the equivalent of about 300 rail cars, there is the potential for considerable cost efficiencies when moving goods by the marine mode. However, marine mode efficiency depends on a variety of factors including the type of cargo, the

IBI GROUP DRAFT TECHNICAL BACKGROUNDER: MARINE TRANSPORTATION Prepared for the Ontario Ministry of Transportation and Ministry of Northern Development and Mines
November 2016 21
distance, the travel time, the negotiated rates, and the additional fees and charges (such as pilotage fees) associated with marine transportation.
Arctic resupply barges such as those that operate on James Bay and Hudson Bay are much smaller than the Great Lakes vessels described above, and have much less draft, allowing them to operate in shallower waters and not requiring significant port infrastructure. The barges can be pushed up onto shore if needed.
Exhibit 5.1: Select Marine Vessel Characteristics
TYPICAL DIMENSIONS AND CAPACITY
Vessel Type Draft (m) Width (m)
Length (m)
Capacity (DWT*) Usage
Great Lakes Vessels
Canadian-flagged domestic vessels (“Canadian lakers”): “Seaway Max”
7.92 23.8 225.5 30,000 These can travel between ports along the GLSLS, and at times at ports outside the GLSLS. These are made to just fit the minimum seaway lock dimensions: 24.4 m x 233.5 m. “Salties”, or ocean-going vessels, must be no larger than this size to traverse the GLSLS.
US-flagged domestic vessels (“lakers”)/ “1000-footer”
8-9 32 308.9 70,000 These operate within the four upper Great Lakes as their large size does not allow passage through the Welland Canal.
James Bay: Arctic Resupply Vessels
Barge up to 1.8 13 52 up to 1,000 As currently used by Moosonee Transportation Ltd.
Port of Churchill, MB: Larger vessels not used in Northern Ontario Ports
Panamax 12.04 32.31 294.13 65,000 This represents the largest vessel; most are smaller
* DWT (Deadweight Tonnage) is a measure of a ship’s carrying capacity. It does not include the weight of the ship. Capacity varies slightly by vessel.
Sources: Great Lakes vessels: Transport Canada (2007)

IBI GROUP DRAFT TECHNICAL BACKGROUNDER: MARINE TRANSPORTATION Prepared for the Ontario Ministry of Transportation and Ministry of Northern Development and Mines
November 2016 22
Exhibit 5.2: US and Canadian Laker Vessels at Sault Locks
The Walter J McCarthy Jr. (left) of the American Steamship Company and the Paul R. Tregurtha (right) of the Interlake Steamship Company are US lakers or 1000-footers – these are too large to navigate the locks of the Welland Canal or of the St. Lawrence River. The smaller Tadoussac (centre) of Canada Steamship Lines is a Canadian-flagged laker built to the maximum dimensions possible for navigating throughout the Great Lakes - St. Lawrence Seaway System.
Source: By NOAA Great Lakes Environmental Research Laboratory - ., CC BY-SA 2.0, https://commons.wikimedia.org/w/index.php?curid=46911634
Exhibit 5.3: Canadian Laker (“Seaway Max”) Vessel Example
Photo credit: By relvax - Own work, CC BY-SA 2.0, https://www.flickr.com/photos/reivax/246696833/in/photostream/

IBI GROUP DRAFT TECHNICAL BACKGROUNDER: MARINE TRANSPORTATION Prepared for the Ontario Ministry of Transportation and Ministry of Northern Development and Mines
November 2016 23
6 Goods Movement
6.1 Freight Operators
Two Canadian shipping lines carry dry bulk cargo on the Lakes:
Algoma Central, which has 28 vessels, 15 of which are self-unloaders; and
Canada Steamship Lines, which has 19 vessels, 9 of which are
self-unloaders.
A number of other companies provide tanker services and smaller vessels including tug and barge services.
6.2 Goods Movement by Port
Goods handled in 20112 by the marine mode by Northern Ontario port are summarized in Exhibit 6.1. Commodity detail for these movements is shown in Exhibit 6.2. The origin and destination ports for goods moved to and from Northern Ontario ports by commodity are shown in Exhibit 6.3. Historic volumes (2001, 2006 and 2011) are also summarized in Exhibit 6.4.
2 As of 2011, Transport Canada no longer collects goods movement data by port.

IBI GROUP DRAFT TECHNICAL BACKGROUNDER: MARINE TRANSPORTATION Prepared for the Ontario Ministry of Transportation and Ministry of Northern Development and Mines
November 2016 24
Exhibit 6.1: Cargo Handled at Northern Ontario Marine Ports, 2011
Source: IBI analysis of Transport Canada data (2016)

IBI GROUP DRAFT TECHNICAL BACKGROUNDER: MARINE TRANSPORTATION Prepared for the Ontario Ministry of Transportation and Ministry of Northern Development and Mines
November 2016 25
Exhibit 6.2: Cargo Shipped to/from Northern Ontario Marine Ports by Commodity Type, 2011
Source: Summary of Transport Canada data (2016)
IBI GROUP DRAFT TECHNICAL BACKGROUNDER: MARINE TRANSPORTATION Prepared for the Ontario Ministry of Transportation and Ministry of Northern Development and Mines
November 2016 26
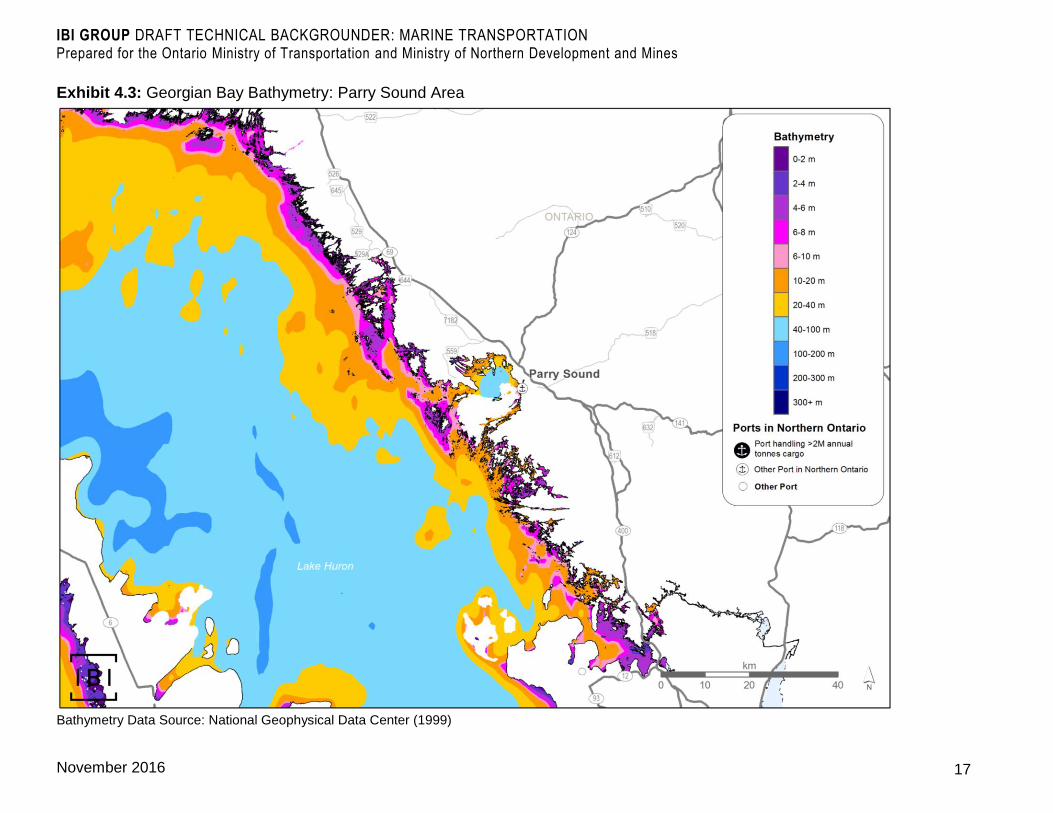
Exhibit 6.3: Cargo Shipped to/from Northern Ontario Marine Ports by Origin/Destination Port and Commodity Type, 2011
Source: Summary of Transport Canada data (2016)

IBI GROUP DRAFT TECHNICAL BACKGROUNDER: MARINE TRANSPORTATION Prepared for the Ontario Ministry of Transportation and Ministry of Northern Development and Mines
November 2016 27
Exhibit 6.4: Cargo Handled at Northern Ontario Marine Ports, 2001-2011
Loaded at Port, Thousand Tonnes Unloaded at Port, Thousand Tonnes Total Activity, Thousand Tonnes
Port 2001 2006 2011 2001-11 Growth 2001 2006 2011
2001-11 Growth 2001 2006 2011
2001-11 Growth
Thunder Bay 8,637 7,975 7,317 -15% 446 356 292 -35% 9,083 8,331 7,609 -16%
Marathon 39 - - -100% 42 27 - -100% 81 27 - -100%
Heron Bay - - - - 50 28 12 -77% 50 28 12 -77%
Michipicoten - 2 - - - - - - - 2 - -
Sault Ste. Marie 716 846 858 20% 4,043 4,910 4,610 14% 4,759 5,756 5,468 15%
Bruce Mines 798 1,189 1,183 48% - - 17 - 798 1,189 1,201 50%
Thessalon 599 623 541 -10% 81 7 39 -52% 680 630 580 -15%
Spragge - - - - - 23 - - - 23 - -
Serpent Harbour - 0 - - 494 447 395 -20% 494 447 395 -20%
Little Current - - - - - 22 9 - - 22 9 -
Whitefish River - - - - 76 110 110 45% 76 110 110 45%
Badgeley Island 351 414 103 -71% - - - - 351 414 103 -71%
Meldrum Bay 4,014 4,777 2,859 -29% 79 19 17 -78% 4,093 4,796 2,876 -30%
Fisher Harbour - - - - 384 398 289 -25% 384 398 289 -25%
Manitoulin* 29 - - -100% - - - - 29 - - -100%
Britt - - - - 24 16 - -100% 24 16 - -100%
Parry Sound - - - - 118 155 161 37% 118 155 161 37%
Fort Albany 6 - - -100% 0 - - -100% 6 - - -100%
Total 15,189 15,826 12,861 -15% 5,836 6,518 5,951 2% 21,025 22,344 18,812 -11%
Note: * not included in listing of ports in this document due to very small volumes of cargo
Source: Summary of Transport Canada data (2016)

IBI GROUP DRAFT TECHNICAL BACKGROUNDER: MARINE TRANSPORTATION Prepared for the Ontario Ministry of Transportation and Ministry of Northern Development and Mines
November 2016 28
Based on the 2011 commodity flow data, the marine mode is used by Northern Ontario industry sectors in the following ways:
Agricultural products represent the largest volume of marine traffic in Northern Ontario, with 4.8 million tonnes of western grain arriving in Thunder Bay by rail for marine export to southern Ontario, Quebec and overseas.
Mining sector flows are dominated by the movement of aggregate and products from cement plants. Also, in 2011 over 800,000 tonnes of coal from Western Canada were loaded onto vessels in Thunder Bay. Potash also passes through the port.
Manufacturing sector flows are dominated by steel-related shipments to and from Sault Ste. Marie.
The marine mode is not used to a significant degree by the forestry industry.
An overview of goods moved in 2011 at individual Northern Ontario ports is provided below:
Thunder Bay. In 2011, cereal grains and other agricultural products and prepared foods represented 6.3 million tonnes of the cargo shipped from the Port of Thunder Bay. Approximately 66% was shipped to Quebec ports (mostly for export from there), 17% to Ontario GLSLS ports, and 12% directly to overseas ports.
Sault Ste. Marie: At the Port of Sault Ste. Marie, iron ore and limestone are brought in, primarily from Michigan, and completed steel products are shipped out. Some slag products are also shipped out and coal is also shipped in (from Thunder Bay and Michigan). There are also other movements through the Sault Ste. Marie locks by US ships not related to shipments to/from Northern Ontario ports.
Meldrum Bay: Meldrum Bay is located on the west end of Manitoulin Island, where Lafarge exports stone products from its own quarry primarily to ports in the United States (Michigan, Illinois and Ohio (1.5 million tonnes in 2011), and to a lesser extent to Southern Ontario ports (870,000 tonnes) and Quebec ports (57,000 tonnes).
Bruce Mines: Primarily gravel and crushed stone are shipped out at Bruce Mines port, primarily to US ports (830,000 tonnes in 2011) and to a much lesser extent, to southern Ontario ports (305,000 tonnes).
Other Ports: There are also smaller ports on or adjacent to the North Channel of Georgian Bay. These are Spragge and Whitefish on the mainland side of the North Channel, which import and export a variety of minerals, fuels, and other products.

IBI GROUP DRAFT TECHNICAL BACKGROUNDER: MARINE TRANSPORTATION Prepared for the Ontario Ministry of Transportation and Ministry of Northern Development and Mines
November 2016 29
More recently, as will be discussed further below, Thunder Bay traffic has increased since 2011. Meanwhile, Sault Ste. Marie marine traffic has decreased since 2011 since due to a decline in the steel industry.
Port of Thunder Bay
Data on historic tonnage handled at Thunder Bay dating back to 1952 is shown in Exhibit 6.5. Over the past 15 years, the port has handled in the order of 8 million tonnes of cargo annually. This is significantly less than its peak in the 1980s, when over 23 million tonnes of cargo per year passed through the port. Today almost 90% of these cargos are made up of various types of grain, but in
the past larger volumes of coal and potash were also handled.
Exhibit 6.5: Thunder Bay Historic Cargo and Vessel Handling
Source: IBI analysis of data from the Port of Thunder Bay <http://www.portofthunderbay.com/article/historical-cargo-statistics-281.asp>
Today, Thunder Bay is carrying smaller volumes of all these commodities than in the past because of changing market conditions. More potash and grain now travels west through the ports of Vancouver and Prince Rupert because many of the markets are on the Pacific. However, in 2014 the Port achieved record financial results and generated $1.5 million from operations (MNDM, 2016).

IBI GROUP DRAFT TECHNICAL BACKGROUNDER: MARINE TRANSPORTATION Prepared for the Ontario Ministry of Transportation and Ministry of Northern Development and Mines
November 2016 30
US Traffic on the Upper Lakes
In addition to Canadian traffic on the Upper Lakes there was a considerable amount of US traffic. This is dominated by iron ore flows from Minnesota to US ports on Lake Huron and Lake Erie. In addition there are grain flows from Duluth to other US ports and directly to overseas destinations.
The iron ore flows are handled by US lakers, which, as described previously, can be larger than Canadian services because they do not pass through the Welland Canal or St. Lawrence Seaway.
6.3 Hudson Bay and James Bay
Goods are also moved on James Bay and Hudson Bay. From summer through early fall, re-supply barges from Moosonee serve communities on the James Bay coast in Ontario and Quebec. Goods moved include fuel and other heavier goods.

IBI GROUP DRAFT TECHNICAL BACKGROUNDER: MARINE TRANSPORTATION Prepared for the Ontario Ministry of Transportation and Ministry of Northern Development and Mines
November 2016 31
7 Passenger Travel
7.1 Ferry Services
Provincially-Operated Services
There are two passenger and car ferry services operated in Northern Ontario by the Ontario Government through the Owen Sound Transportation Company:
The first is the Chi-Cheemaun, which is operated during the summer months from the Bruce Peninsula to Manitoulin Island, to provide a “short-cut” across the mouth of Georgian Bay. In the peak summer months the ferry operates four times per day in each direction. In the off peak spring and fall months (May and October), the ferry operates twice daily with an additional sailing Friday evenings. The 40-km trip takes about 1 hour and 45 minutes. The ferry has capacity for 648 passengers and 143 vehicles, and can carry large vehicles such as busses and transport trucks, but cannot take overweight trucks at her maximum draft of 13 feet.
The second service is the Niska 1 ferry between the town of Moosonee on the mainland and Moose Factory, which is located on an island in the Moose River off of western James Bay, approximately 2.5 km each way. The Niska 1 is capable of carrying two full length tractor-trailers or eight passenger vehicles, and up to 50 people. The ferry offers hourly service Monday to Friday 8 a.m. to 4 p.m. during the summer months. The ferry is operated in partnership by Ontario Northland Transportation Commission and the Owen Sound Transportation Company.
In addition to the ferry services operated by the Owen Sound Transportation Company, the Gardiner Ferry, operated by MTO, allows travellers on Highway 579 to cross the Abitibi River in Blount Township, approximately 25 km north of Cochrane.
Other Ferry Services
The Municipality of Red Lake operates a ferry between the mainland and McKenzie Island, every half-hour daily from early morning to evening during the operating season. The trip is approximately 900 m across the McKenzie Channel.
A truck ferry service between the north and south shores of Lac Seul in Northwestern Ontario is operated on an as-required basis. This privately-

IBI GROUP DRAFT TECHNICAL BACKGROUNDER: MARINE TRANSPORTATION Prepared for the Ontario Ministry of Transportation and Ministry of Northern Development and Mines
November 2016 32
operated ferry service facilitates an efficient transportation route for product delivery to the sawmill in Hudson, Ontario. This was a cooperative project between federal and provincial governments, Lac Seul First Nation and McKenzie Forest Products Ltd.
A band-owned ferry operates between Temagami First Nation’s Bear Island and the mainland in the summer months.
7.2 Lake Cruises
Currently there are few passenger ships operated on the Upper Lakes, although the Chi-Cheemaun ferry is regarded as a mini-cruise by many.
Cruises are operated on the St. Lawrence River and there are limited trips into the Lower Great Lakes. In 2016 there are three cruise ships operating, two of these have stops in Little Current and Sault Ste. Marie. A further line does pass through Lake Huron but with no Canadian stops. None of the three vessels carries a Canadian flag.
Challenges to Operating Cruise Ships on the Great Lakes
The federal Coasting Trade Act aims to encourage the use of Canadian-flag
ships by restricting the transport of goods or passengers between two Canadian ports to Canadian-flag ships. However, there are challenges to making Canadian cruise ship lines financially viable, and there hasn’t been a major Canadian cruise ship line since CP Ships pulled its last cruise ship in 1965. Challenges include the following:
The shorter Canadian marine operating season means that the cruise ship must be able to operate elsewhere during the times when the Great Lakes are not navigable for the cruise line to be financially viable.
The cost of operating a ship with a unionized Canadian crew is much greater than for ships with crews from other countries with more lax
labour regulations. For example, for cruise ships in the Bahamas, the typical cruise ship crew works four months at a time without a break at home. Under Canadian labour laws, Canadian crew members need to be able to return home every 7 to 10 days. If the ship is operating away from the Great Lakes during the winter, this requirement would still apply and crew members would need to be flown home every 7 to 10 days.
There exists a disparity in treatment of operations of overnight passenger cruise ships on inland waters versus coastal waters: The

IBI GROUP DRAFT TECHNICAL BACKGROUNDER: MARINE TRANSPORTATION Prepared for the Ontario Ministry of Transportation and Ministry of Northern Development and Mines
November 2016 33
Coasting Trade Act exempts foreign cruise vessels operating on the
East and West coasts (the lower of St. Lawrence and lower Fraser River) from requiring a coasting trade license provided the cruise calls at a foreign port (e.g. St. Pierre, France, or a U.S. port) or the passengers are not picked up at one Canadian port and dropped off at another Canadian port. Conversely, the Act requires a foreign cruise ship to acquire a license to operate on the Great Lakes, even if that ship calls at a foreign port.
Duties: While engaged in coasting trade, a foreign built vessels less than 129 meters (which is the size of most Seawaymax compliant overnight passenger cruise ships), is subjected to customs duty, payable per month at the rate of 1/120 of 25 per cent of the declared fair market value of the foreign ship. Custom charges on the ships can be significant, and when passed on can make trips more costly for the consumer.
Customs and Border Clearance: According to the U.S. law, foreign ships are required to do a complete customs and immigration clearance for the passengers and crew at every American port of call which is of great inconvenience to the passengers.
LMIA: The requirement for overnight passenger cruise ship operators by Citizenship and Immigration Canada under the Coasting Trade Act to have a Labour Market Impact Assessment on their foreign crew at the cost of $1,000 per crew member proves costly.
The Ontario Ministry of Tourism, Culture and Sport (MTCS) is actively trying to create new opportunities is soliciting foreign cruise line to provide Great Lakes cruises, but this also has its challenges:
Due to cabotage laws, non-Canadian-flag ships cannot serve two Canadian ports in a row, so they need to alternate between Canadian and US ports. One difficulty with this is that many ports have non-existent or insufficient border security services and facilities. MTCS has asked Transport Canada for an exemption to border security for these tours, so that passengers need only go through security at the first Canadian port.
The process for foreign-flag vessels to enter the Canadian market for foreign operators can be confusing and time consuming. MTCS has suggested that an operations manual to navigate the regulatory environment and lay out the necessary steps would be helpful.
Pilotage fees (paid to have a Canadian pilot on board as per regulations) are significant.
Barriers to growth in overnight passenger cruise ship traffic include:

IBI GROUP DRAFT TECHNICAL BACKGROUNDER: MARINE TRANSPORTATION Prepared for the Ontario Ministry of Transportation and Ministry of Northern Development and Mines
November 2016 34
Complex regulatory environment due to Coasting Trade Act (CTA).
Time and Distance: Legislative Status Quo in US and Canada (Jones Act and CTA respectively does not allow for unidirectional rationalized itinerary. Cruise operators, in keeping with the provisions of the Acts have to plan complex itineraries with more time on sea than in ports.
Expense: Labour Market Impact Assessment for foreign crew, payment of duties, pilotage and licensing fees.
Lack of destination awareness by vessel owners or customers.
Trends and drivers include:
The trend in new ship building is the mega ship with 6,000 passengers and 2,000 crew which is not Seawaymax compliant (limited to a beam of 78ft.)
Smaller ship new builds are in the ultra-luxury category, so the water and land experiences need to be tailored to this market.
The growth in cruise ships traversing the North West Passage may offer opportunities for Indigenous experiences in Hudson Bay and James Bay.

IBI GROUP DRAFT TECHNICAL BACKGROUNDER: MARINE TRANSPORTATION Prepared for the Ontario Ministry of Transportation and Ministry of Northern Development and Mines
November 2016 35
8 Operating Season Trends
The economic efficiency and tariffs charged for goods movements provided by operators using the GLSLS system are affected by the length of the annual shipping season, owing to lost revenues during the months when the system is closed owing to the winter freeze-up.
The shipping season length has increased over recent decades. For example, the historic data of opening and closing of navigation at the Port of Thunder Bay are shown in Exhibit 8.1, showing a clear trend of earlier opening dates
(approximately April 12 in the mid-1950s to approximately March 25 in the early 2010s, an increase of 18 days,) and later closing dates (approximately December 17 in the mid-1950s to mid-January in the early 2010s, an increase of almost one month).
The increase in shipping season length over recent decades is generally attributed to the ongoing warming trends of climate change, but it is possible that some of the lengthening of the season can be attributed to use of bubblers and other mechanisms to prevent ice formation on docks and walls.
Exhibit 8.1: Historic Dates of Opening and Closing of Navigation at Port of Thunder Bay
Source: IBI analysis of data form Port of Thunder Bay <http://www.portofthunderbay.com/article/historical-cargo-statistics-281.asp>

IBI GROUP DRAFT TECHNICAL BACKGROUNDER: MARINE TRANSPORTATION Prepared for the Ontario Ministry of Transportation and Ministry of Northern Development and Mines
November 2016 36
The longer shipping season length has been noted for the broader GLSLS system. For example, the average length of the seaway navigation system operating season (Montreal – Lake Ontario section) for the five-year period 1982 to 1986 was 269 days; 20 years later, the average for the five-year period 2002 to 2006 was 279 days (Great Lakes Shipping, 2008).
This trend of increasing marine shipping operating seasons is expected to continue; if it proceeds at the same rate, the average shipping season for the GLSLS would be about 10 months by the early 2040s. Beyond that, further gains would be more limited, since locks must be non-operational at least one month/year for annual maintenance (if there are no special problems) and at
least two months/year every three to five years for rehabilitation of lock machinery and walls.
In outreach sessions held in June of 2016, the limited availability of icebreakers was mentioned as a constraint on season lengthening.

IBI GROUP DRAFT TECHNICAL BACKGROUNDER: MARINE TRANSPORTATION Prepared for the Ontario Ministry of Transportation and Ministry of Northern Development and Mines
November 2016 37
9 Water Level Trends
9.1 Great Lakes
Water levels in the Great Lakes are somewhat regulated through flow-control structures. Lake Superior’s levels are controlled by dams and hydro-electric power plants on St. Mary’s River, where a regulation plan has been in place since 1921. Lake Ontario has had similar controls in place since 1960 — its outflows are controlled at the Moses-Saunders Dam and Long Sault Dam on the
St. Lawrence River, although there are restrictions in the ability to fully regulate; too much reservation will lower water levels in Montreal harbour and on the St. Lawrence River. Lake Erie levels are partially controlled by structures on the Niagara River.
Water levels in the Great Lakes are cyclical as illustrated in Exhibit 9.13. The effect of the control structures on these water levels is somewhat unclear and the International Joint Commission (IJC)4 notes that the Great Lakes-St. Lawrence Seaway is a complex dynamic system that is only partly understood.
With this in mind, Canadian and US monitoring data have shown a general increasing trend in water levels between 1918 and 2015 in all lakes except Lake Superior. However, the exhibits also highlight that the entire lake system has shown consistent declines in water levels over the past 40 years or more, with Lake Michigan-Huron seeing the largest decline from 177.1 m in 1970 to 176.4 m in 2013 — a fall of about 70 cm although these water levels have increased in 2015 and 2016. Declines in Lake Ontario have been less pronounced at just 3 cm. In more recent years, however there has been a decrease in water levels in all of the Lakes; there is concern that this has resulted from climate change impacts that have reduced ice cover and increased evaporation rates.
3 Depths are measured relative to the International Great Lakes Datum of 1985 (IGLD 1985), which is based on a sea level datum at Rimouski, Quebec near the mouth of the St. Lawrence River. 4 The International Joint Commission is a trans-border organization tasked with resolving Canadian-US border issues under the 1909 Boundary Waters Treaty.

IBI GROUP DRAFT TECHNICAL BACKGROUNDER: MARINE TRANSPORTATION Prepared for the Ontario Ministry of Transportation and Ministry of Northern Development and Mines
November 2016 38
Exhibit 9.1: Historic Water Level Trends in the Great Lakes, 1918–2015
Source: IBI analysis of data from Fisheries and Oceans Canada and the US Army Corps of Engineers

IBI GROUP DRAFT TECHNICAL BACKGROUNDER: MARINE TRANSPORTATION Prepared for the Ontario Ministry of Transportation and Ministry of Northern Development and Mines
November 2016 39
Exhibit 9.1: Historic Water Level Trends in the Great Lakes, 1918–2015 (continued)
Source: IBI analysis of data from Fisheries and Oceans Canada and the US Army Corps of Engineers

IBI GROUP DRAFT TECHNICAL BACKGROUNDER: MARINE TRANSPORTATION Prepared for the Ontario Ministry of Transportation and Ministry of Northern Development and Mines
November 2016 40
The problem of lower levels in Lake Michigan-Huron has been attributed to dredging of the St. Clair River by the US Army Corps of Engineers and scouring of the river bed but the root cause remains uncertain; climate change is also considered as a likely contributor (Warren and Lemmen, 2014). This trend is economically significant: one recent study estimates that a reduction in draft of 1 m would reduce the cargo carrying capacity of vessels using the Great Lakes by 17%. As noted, "… The direct effects of global climate change are expected to be mixed, with the adverse effects of lower water levels expected to be offset to some extent by a longer shipping season" (Millerd, 2007).
The recent Canadian Federal budget included funds to study the problem.
9.2 Hudson Bay and James Bay
Research has shown that water levels in the Hudson Bay and James Bay have been falling by about 9.7 mm annually for at least the past 70 years due to isostatic rebound5 (Bush et al, 2014). Climate change effects such as warming temperatures, glacial melting, and changing precipitation patterns in the Far North may offset the effects of isostatic rebound in the future. Models have shown that a 3˚C increase in temperature could slow the rate of water level change to about 2.5 mm per year (Stewart and Lockhart, 2004).
Even with the moderating effect of climate change, the fastest rates of isostatic rebound are occurring near the shores of the Bays so coastal areas along Ontario’s northern shore are least likely to observe significant slowdowns in water level change. Given the already shallow water depths shown in Exhibit 3.2, the development of deep water ports in the Far North is likely to remain a challenge in the foreseeable future.
5 Isostatic rebound occurs when the land rises slowly after the removal of a significant weight. In the Hudson Bay/James Bay area, this phenomenon is occurring due to the removal of the continental ice sheet, which occurred at the end of the last ice age.

IBI GROUP DRAFT TECHNICAL BACKGROUNDER: MARINE TRANSPORTATION Prepared for the Ontario Ministry of Transportation and Ministry of Northern Development and Mines
November 2016 41
10 Environmental Considerations of Marine Shipping
The Chamber of Marine Commerce has summarized the following advantages of marine shipping from an environmental perspective (Chamber of Marine Commerce, 2016):
Vessels operating on the Great Lakes are, on average, seven times more fuel efficient than trucks and 1.14 times more fuel efficient than
trains. The distance travelled per tonne of cargo on one litre of fuel is 243 km by Great Lakes ship, compared to 213 km by rail, and 35 km by transport truck.
Great Lakes ships have the lowest carbon footprint, emitting 11.9 CO2 grams per tonne per kilometre, compared to 14.2 km grams for rail and 75.5 grams by transport truck.
One ship can carry the equivalent of almost 1,000 trucks and approximately 300 rail cars. Marine shipping therefore reduces road congestion and highway maintenance costs.
The Chamber of Marine Commerce (2016) also notes the reduced environmental impact of new and planned marine vessels. Ship owners are investing in the development of super-efficient, environmentally friendlier ships to the GLSLS system over the next three years. Improved engine and hull design will increase fuel efficiency and decrease airborne emissions. Double-hull design will help prevent spills. The new ships will emit up to 40% less emissions than existing motor vessels.
Investments are also being made in new ship designs and engine technology to be introduced over the next 10 years to meet regulatory changes. Tier II engines will reduce air emissions such as nitrogen oxides by 86% and engine-exhaust gas scrubbers will cut sulfur oxides by 99%. As older vessels are replaced, ballast water treatment equipment is also planned to be installed in new equipment, as untreated ballast water can introduce invasive species into oceans, lakes, rivers, and port areas, which is a significant environmental concern.
Despite the general fuel efficiency and positive environmental benefits of marine shipping, there are also several potential negative environmental consequences. These include the introduction of invasive species, the emission of greenhouse gases and other matter, water contamination, and impacts on wildlife shore habitats. It is also significant that the US has not yet aligned its requirements with the International Marine Organization’s guidelines on suitable technologies for water ballast treatment, which means US ship owners are not investing in the technology and are putting Canadian waterways at environmental risk.

IBI GROUP DRAFT TECHNICAL BACKGROUNDER: MARINE TRANSPORTATION Prepared for the Ontario Ministry of Transportation and Ministry of Northern Development and Mines
November 2016 42
11 Outlook for the Northern Ontario Marine Sector
Like all modes of transportation, the demand for marine transportation is derived. Transportation is not an end in itself but depends on the demand which is created by other activities. It is necessary to look at the future of Northern Ontario industries to establish the likely future use of the marine mode.
11.1 Great Lakes Freight Transportation
There have been several developments over recent decades that influence the demand for marine transportation on the Great Lakes and particularly on the Upper Lakes:
Improvements in the efficiency of competing modes have limited marine traffic. For example, the rail industry has introduced significant efficiencies through longer trains, more fuel-efficient locomotives and improved operations which have essentially taken away most general cargo from the Great Lakes.
Increases in the size of container vessels operating on the world’s oceans have similarly limited use of container-carrying vessels on the Great Lakes. It is much more efficient for large container vessels to dock in Montreal or Halifax and move containers by rail to inland destinations. There are therefore no marine container terminals located in Northern Ontario although it has been suggested that some feeder lines to the ocean services might be established. So far none of these has materialized.
This leaves most marine traffic focussed on bulk commodities such as grain, iron ore, coal, limestone, aggregates and potash. The movement of these by water is cheaper and less carbon-intensive than by other modes. They are also not time-sensitive shipments. In addition there are some
movements of steel products by the marine mode. The future extent of marine traffic of these commodities depends upon the health of the related industries and market trends.

IBI GROUP DRAFT TECHNICAL BACKGROUNDER: MARINE TRANSPORTATION Prepared for the Ontario Ministry of Transportation and Ministry of Northern Development and Mines
November 2016 43
Grain
Grain traffic through the Port of Thunder Bay has varied considerably with high levels reached in the early 1980s and considerable decline since then although recently activity has increased again. The main reason for this trend is that there has been more market growth in the Pacific basin than in the Atlantic and it is more efficient to use the ports of Vancouver and Prince Rupert for these movements.
It is predicted that the 2016 Western Canadian grain crop will be quite large and therefore grain traffic may increase again, depending on the location of the markets that may be found for the additional grain produced. Grain and
agricultural products traffic through the Port of Thunder Bay during the past thirty years has fluctuated from a high of about 24 million tonnes in 1984 to a low of about 7 million tonnes in 2013, with a current (2015) level of 8.9 million tonnes. Fluctuations over a somewhat smaller range, e.g. 5 – 20 million tonnes/year are likely during the coming 25 years, primarily reflecting variations in annual crop sizes.
Iron Ore and Limestone
Iron ore and limestone traffic on the Upper Lakes to Canadian ports essentially depends upon the health of the Essar Steel Mill in Sault Ste. Marie which is currently reported to be up for sale and whose future is unclear. Essar also ships some of its products by water to US markets. There are reports that a buyer for the mill may change the product mix. In any case there are not likely to be large increases in inbound or outbound marine traffic although some growth may result from new management of Essar Steel if this should occur.
Coal
Coal movements have been made up of two flows, metallurgical coal from Western Canada to steel mills in Sault Ste. Marie and Hamilton and thermal coal to Ontario Hydro electricity generating plants. The metallurgical coal depends on the activity levels of the steel mills in Sault Ste. Marie, Nanticoke and Hamilton; the future of the Essar Steel plant has been discussed and the activity level at
the Lower Lakes plants is at a low level. Ontario Hydro has stopped using thermal coal, replacing it in most cases with natural gas. The outlook is therefore for no growth and possible continuing decline in traffic levels.
Potash
Currently there is a glut of potash on world markets and traffic is not growing. In addition there has been, over the years a movement to Pacific markets and continuing competition from potash mines in Europe and elsewhere. Again, the outlook is for continuing low traffic levels with a partial recovery possible in the

IBI GROUP DRAFT TECHNICAL BACKGROUNDER: MARINE TRANSPORTATION Prepared for the Ontario Ministry of Transportation and Ministry of Northern Development and Mines
November 2016 44
medium term as growth in world demand catches up with the current over-supply.
Aggregates
One cargo that may have a positive future is the movement of aggregates from Northern Ontario to the US and to Southern Ontario. There is some established movement of this commodity today, particularly to Michigan and Southwestern Ontario where there are limited local sources of aggregates. The Ontario Government has a policy of sourcing aggregates in the region where they are consumed but, in the long term, the demand for aggregates in Southern Ontario
may exceed the local supply. Marine transportation over longer distances is efficient and environmentally positive although increasing use will require the enlargement or establishment of port facilities in Southern Ontario. The outlook is therefore for possible growth in the medium term.
Emerging Industries
Wood pellets represent an alternative power source to be processed at biomass power plants. The production of wood pellets is an emerging industry for which Northern Ontario is well suited. Ontario Power Generation tends to have power plants close to the source of these pellets (e.g. in Cochrane, Thunder Bay and Atikokan), but currently not all pellets are locally sourced. However, with support from marine and/or rail transportation service providers, the use of wood pellets could be expanded to other areas, though this is not anticipated to be a large growth area for marine shipping.
Ring of Fire
Another potential source of increasing marine traffic is the potential of large-scale mineral extraction activities in the Ring-of-Fire area. Depending on the scale of activities developed and the methods of production adopted, there could be additional marine activity.
The Future of Great Lakes Marine Traffic
The St. Lawrence-Great Lakes shipping route is an irreplaceable resource. Inexpensive marine transport contributes to the efficiency and viability of the agricultural sector and the industries that rely on it. For the economic health of the adjacent regions it must be maintained.
As discussed above, the traffic outlook is more likely to be a continuation of existing levels of flows rather than large increases.

IBI GROUP DRAFT TECHNICAL BACKGROUNDER: MARINE TRANSPORTATION Prepared for the Ontario Ministry of Transportation and Ministry of Northern Development and Mines
November 2016 45
The advancing age of many of the port facilities, canals and locks means that ongoing surveillance and maintenance is required. There are operational and cost factors that need attention such as the costs of pilotage, Coast Guard fees and other aspects that need attention.
In recent years the Conference of Great Lakes and St. Lawrence Governors and Premiers has developed a Strategy for the Great Lakes-St. Lawrence River Maritime Transportation System. This was published in 2016 and suggests that there is considerable scope for increasing use of the system. A strategy was recommended based upon four themes:
Increasing efficiency and reducing cost.
Building new markets.
Growing economic activity around the maritime system.
Delivering results and managing for the future.
Because of the varied nature of marine activity, however, no forecast of potential usage was developed.
Summary
Traffic levels of bulk cargos and other freight are expected to remain largely at existing levels, considerably reduced from those of several decades ago, owing to growing use of Pacific ports for Canada's commodity exports and reflecting effective competition from the rail mode for bulk commodities, general cargo and container traffic.
Static or declining commodity traffic levels are expected in movements of grain and other agricultural products, coal, iron ore, limestone, and potash, although some or all of the latter three commodities may experience modest increases in the medium-term, and traffic levels of grain and agricultural products can be expected to fluctuate quite widely depending on annual crop yields.
Growth prospects are more positive for movement of aggregates to US and Southern Ontario destinations, and shipping of Ring of Fire mineral products to
world markets if and as that resource is developed.
11.2 James Bay/Hudson Bay Marine Traffic
This movement has been relatively stable over the last several years although there have been increased movements to some Quebec ports on Hudson Bay. The use of these services depends essentially on the extent of competing road or ice road networks. For example, the all-season road network in Northern

IBI GROUP DRAFT TECHNICAL BACKGROUNDER: MARINE TRANSPORTATION Prepared for the Ontario Ministry of Transportation and Ministry of Northern Development and Mines
November 2016 46
Quebec has been extended to several ports, so that the communities now therefore depend less on marine shipments.
Marine resupply traffic to coastal communities is expected to remain relatively stable, as favorable influences from a lengthening ice-free shipping season (due to ongoing warming impacts of climate change) are counteracted by competition from extensions of all-season roads to additional coastal communities.
The future of the Port of Churchill is uncertain. The 2016 shipping season was cancelled by the port’s owner, Omnitrax. Long-term closure of the port would greatly affect the economy of Churchill as well as the potential for marine shipments by arctic barge from the port to Fort Severn and Weenusk, the two
First Nation communities on Hudson Bay in Ontario’s Far North.
11.3 Marine Passenger Services on the Upper Great Lakes
Use of the marine passenger mode on the Upper Lakes has been relatively static in the past years; however, there are potentials for increasing use. For example, the Chi-Cheemaun ferry, operated by the Owen Sound Transportation Company on behalf of the Province, has refocused its marketing efforts from being a highway shortcut to becoming a marine excursion and a leisure activity. This has resulted in considerably more traffic. Other ferry activity has been stable and will probably remain stable.
There are increasing levels of activity of cruise ships on the Lower Lakes and this could be extended to the Upper Lakes. There is therefore a potential outlook for growth in cruise ship traffic on the upper Great Lakes if regulatory issues can be resolved, as discussed more fully in the Tourism Technical Backgrounder, e.g.in order to enable more effective itineraries in calling at US and Canadian ports. Climate change is also expected to be a contributing factor, as ongoing warming lengthens the season and increases the attractiveness of marine excursions.
IBI GROUP DRAFT TECHNICAL BACKGROUNDER: MARINE TRANSPORTATION Prepared for the Ontario Ministry of Transportation and Ministry of Northern Development and Mines
November 2016 47
12 Issues and Opportunities
12.1 Summary of Issues
Limited Freight Markets for Marine Shipping
The marine mode is generally best suited for shipping stable bulk commodities that are not time-sensitive and that are shipped in large quantities and traveling long distances to maximize efficiencies. The marine mode is also ideal for goods that will be carried overseas. Conversely, marine is not practicable for low-volume, small shipment sizes, time-sensitive or perishable goods.
Because of the very significant efficiencies that can be achieved through moving large shipments of bulk commodities by the marine mode, it is even cost-effective for goods that have relatively low value per tonne, such as aggregates.
Ideally, goods shipped by marine mode would be produced close to source or have facilities to move goods from rail or truck efficiently. Otherwise, considerable warehousing or storage facilities would be needed near the port to store the large volumes of goods that can be carried by each individual ship — as noted in Section 10, one large ship can carry as much as a thousand trucks.
Depressed Cargo Markets
Most cargos handled on the Great Lakes are bulk commodities, but there are some vessels carrying general or “project” cargos. In the past, a number of “package lakers” operated carrying general cargo, but these have been retired. Cargo volumes have been declining at most Northern Ontario ports during the past 15 years (Exhibit 6.4) and the outlook for future growth in marine shipment of most types of commodities is limited, as outlined in Section 11.
There have been experiments using tug and barge services to export forest products to the US, but such services have not materialized, and almost no forest products move on the Great Lakes, as rail and truck have taken over that
market.
Barge resupply services to remote coastal communities on James Bay and Hudson Bay are also facing competition as all-season roads are extended northward to these communities, particularly in Quebec.
As outlined in Section 11, the outlook for recovery in cargo volumes is limited in most of these markets, providing little incentive for modernization or expansion of port and seaway facilities, with some exceptions as discussed below under Opportunities.
IBI GROUP DRAFT TECHNICAL BACKGROUNDER: MARINE TRANSPORTATION Prepared for the Ontario Ministry of Transportation and Ministry of Northern Development and Mines
November 2016 48
Constrained Passenger Markets
The Chi Cheemaun ferry has successfully rebranded itself as a mini-cruise and passenger volumes on other ferry services are steady, but otherwise there are few passenger ships now operating on the Upper Lakes. As described more fully in Section 7.2, cruise ship services are constrained by the economics of a relatively short operating season and high operating costs plus regulatory constraints (e.g. cabotage laws and market entry procedures).
Low Water Levels
As noted in Section 9, one problem that has increased in recent decades is low water levels on Lake Huron. Although water levels on other lakes can be somewhat controlled, the levels on Lakes Huron and Michigan are regulated by the outflow on the St. Clair River, which is not controlled. Although it has been suggested that the lowering of water levels is the result of dredging on the St. Clair River by the US Corps of Engineers, the main causes are not clear; climate change is potentially implicated. Nevertheless, lower water levels reduce the payload that can be loaded onto vessels in some years.
Infrastructure Constraints
Because of the size restrictions imposed by lock dimensions and the time taken to traverse the various canals, there are no container vessel services on the Great Lakes. There have been suggestions made to introduce feeder container services on the Lakes to Montreal, but this has not occurred, although some containers arrive by ocean vessels as deck cargo.
Another problem that concerns the Seaway-Lakes route is aging infrastructure. The Welland Canal locks are over 80 years old and the St. Lawrence facilities are approaching 60. The US Soo locks are also showing their age as is much harbour infrastructure. There will have to be re-investment in these facilities if the viability of the system is to be maintained.
In James Bay and Hudson Bay, there has been some discussion of providing docks and port facilities to northern communities along the coasts, but there has
been no progress, as it is difficult to protect facilities from ice damage. Resupply barges continue to operate without such facilities.
Potential Loss of Port Infrastructure and Access to Currently Inactive Ports
Northern Ontario has a number of ports that had been active in the past but are currently not in operation, e.g. Michipicoten, Manitoulin. The potential future use of these ports for shipping materials related to emerging markets, for new tourism offerings, etc., will not be an option where the port area and
IBI GROUP DRAFT TECHNICAL BACKGROUNDER: MARINE TRANSPORTATION Prepared for the Ontario Ministry of Transportation and Ministry of Northern Development and Mines
November 2016 49
transportation access to the port are not protected. There is also a need to maintain compatible land uses in the vicinity of the currently unused ports so that potential future renewal and use of the port is not precluded.
12.2 Opportunities
Potential Increased Energy Efficiency of Marine Mode
For certain shipments (e.g. large shipments of bulk commodities), the marine mode can perform many times better than trucks in terms of energy efficiency per tonne-kilometre, and can also be more efficient than rail. Energy efficiency varies significantly with shipment size, vehicle loading, terrain, engine types, speed and other factors, although the fuel efficiency figures noted below by Research and Traffic Group (2013) are indicative when carrying the existing mix of marine cargo:
Marine: 243 tonne-kilometres per litre of fuel;
Class I rail freight: 213 tonne-kilometres per litre of fuel; and
Heavy trucks: 35 tonne-kilometres per litre of fuel.
Aside from port infrastructure and the dredging of canals through shallower waters, the marine mode has much lower infrastructure needs, and would reduce the pressure on road infrastructure in particular if goods were to be moved by ship rather than by truck where feasible.
Cargo Markets
There is some potential to use laker vessels to move aggregates from Northern Ontario to Southern Ontario and to US ports on the Great Lakes. This economic opportunity has been suggested by various parties in the past, but at this point it is a minor activity with Meldrum Bay on Manitoulin Island and Spragge on the Northern Channel being the only active ports. There could be an opportunity to expand such operations at these and other Northern Ontario ports. The topic of moving aggregates is explored separately in a separate technical backgrounder on Aggregates.
Development of the substantial mineral resources at the Ring of Fire in the Far North could provide a significant opportunity for marine shipments to world markets via Great Lakes ports (e.g. Thunder Bay or a refurbished smaller port on Lake Superior such as Nipigon or Marathon), with road and/or rail shipment southward to these ports from the mines.

IBI GROUP DRAFT TECHNICAL BACKGROUNDER: MARINE TRANSPORTATION Prepared for the Ontario Ministry of Transportation and Ministry of Northern Development and Mines
November 2016 50
Passenger Markets
Expanded lake cruises on the Upper Lakes are a major opportunity for growth in marine passenger markets. The demand for such services can be expected to grow, as ongoing climate change produces warmer temperatures and longer operating seasons. As noted in Section 12.1, the chief impediment to such expansion appears to be regulatory, and discussions between the federal and Ontario governments may, it would be hoped, result in reducing these constraints.
The existing (2016) operation of three cruise ships on the Upper Lakes, with two of them stopping at Little Current and Sault Ste. Marie could be greatly
expanded, with economic and social/cultural benefits to Northern Ontario and its tourism industry.
There is also growing demand for, and supply of, Arctic cruise ships passing through the Northwest Passage and, potentially, into Hudson Bay. Unfortunately shallow coastal waters on the north coast of Ontario are a major impediment to achieving similar benefits in Northern Ontario from this traffic. The Port of Churchill, in Manitoba, and possibly development of a suitable port in Northern Quebec would bring benefits to those provinces.
Further expansion of the Chi Cheemaun ferry/mini-excursion is an ongoing opportunity. The two ferry services operated by the Ontario Government appear to be providing sufficient capacity to meet current and anticipated demand.
Longer Ice-Free Shipping Seasons
The steady increase in marine operating season length provides an opportunity for increased and more economically viable services. This applies both to cargo and passenger operations on the Great Lakes, and also to barge resupply operations on James Bay and Hudson Bay.
Container Vessel Operations on the Great Lakes
As global deep-sea container vessel operations continue to be amalgamated with "megacontainer" vessels providing regular deliveries to/from container hub ports serving each continent, the opportunity may arise to establish a Laker-size container vessel operation between Sydney (Nova Scotia) or Halifax and Great Lakes ports. Changes in transit times, for both cargo and container flows, would be important considerations.
Improving Operation of the St. Lawrence and Welland Canal Locks
Technological improvements are being made to the operations of the locks which should reduce transit times and therefore shipping costs. There are also a

IBI GROUP DRAFT TECHNICAL BACKGROUNDER: MARINE TRANSPORTATION Prepared for the Ontario Ministry of Transportation and Ministry of Northern Development and Mines
November 2016 51
number of innovations being studied of season-lengthening measures which again will improve the economics of shipping. Climate change may also have an effect on this but there are limitations due to the need for annual maintenance of infrastructure.
Suggestions have also been made concerning constructing locks and channels with larger dimensions but this is unlikely due to the extreme costs and the relatively modest outlook for growth in marine traffic.

IBI GROUP DRAFT TECHNICAL BACKGROUNDER: MARINE TRANSPORTATION Prepared for the Ontario Ministry of Transportation and Ministry of Northern Development and Mines
November 2016 52
References
Bush, Loder, James, Mortsch, and Cohen (2014). Canada in a Changing Climate: Sector Perspectives on Impacts and Adaptation. Retrieved 2016-05-31 from <http://www.nrcan.gc.ca/environment/resources/publications/ impacts-adaptation/reports/assessments/2014/16309>.
CBSA (2016). Directory of CBSA Offices and Services. Retrieved 2016-05-27 from <http://www.cbsa-asfc.gc.ca/do-rb/menu-eng.html>.
Chamber of Marine Commerce (2016). Environment. Citing Research and Traffic Group (2013). Environmental and Social Impacts of Marine Transport in the Great Lakes-St. Lawrence Seaway region. Retrieved 2016-06-08 from <
http://www.marinedelivers.com/environment>.
CPCS in association with University of Toledo, Economic Development Research Group, Prime Focus LLC, Sustainable Ports, Richard Stewart of the Great Lakes Maritime Research Institute (2012). NCFRP 35: Mulimodal Freight
Transportation within the Great Lake-Saint Lawrence Basin, Final (Task 5).
Prepared for National Cooperative Freight Research Program.
CPCS (2013). Benefits Case for the MS Chi-Cheemaun. Owen Sound Transportation Company.
CPCS (2013). Market Feasibility Study for the MS Chi-Cheemaun. Owen Sound Transportation Company.
CPCS (2013). Transportation Requirements for Economic Sector Development in Northern Ontario. Toronto: Ministry of Transportation Ontario.
KPMG (2013). Regional Harbour Expansion Market and Business Analysis. Sault Ste. Marie: City of Sault Ste. Marie.
Great Lakes Shipping, Trade and Aquatic Species; Special Report 291, 2008,
Chapter 4.
Huot-Vézina, G., V. Brake, N. Pinet and D. Lavoie (2013). GIS Compilation of the Hudson Bay / Foxe Sedimentary Basins; Geological Survey of Canada,
Open File 7364. doi: 10.4095/292800
Justice Canada. (2015). Great Lakes Pilotage Tariff Regulations. Ottawa:
Government of Canada.
Justice Canada. (2011). Great Lakes Pilotage Regulations. Ottawa: Government of Canada.
Justice Canada. (1985). Pilotage Act. Ottawa: Government of Canada. Millerd,
F. (2007). Global Climate Change and Great Lakes International Shipping.

IBI GROUP DRAFT TECHNICAL BACKGROUNDER: MARINE TRANSPORTATION Prepared for the Ontario Ministry of Transportation and Ministry of Northern Development and Mines
November 2016 53
Transportation Research Board Special Report 291: Great Lakes Shipping, Trade and Aquatic Invasive Species.
MariNova Consulting Ltd., Ontario Marine transportation Study, Phase I Final Report: Industry profile and Economic Impact, April, 2009
Ministry of Northern Development and Mines (2016). Ontario Supports Expansion of Port of Thunder Bay. Retrieved 2016-05-31 from https://news.ontario.ca/mndmf/en/2016/04/ontario-supports-expansion-of-port-of-thunder-bay.html
National Geophysical Data Center (1999): Bathymetry of Lake Erie and Lake Saint Clair. National Geophysical Data
Center, NOAA. doi:10.7289/V5KS6PHK [2016].
Bathymetry of Lake Huron. National Geophysical Data Center, NOAA. doi:10.7289/V5G15XS5 [2016]. Bathymetry of Lake Michigan. National Geophysical Data Center, NOAA. doi:10.7289/V5B85627 [2016]. Bathymetry of Lake Ontario. National Geophysical Data Center, NOAA. doi:10.7289/V56H4FBH [2016]. Downloaded 2016-05-xx from <http://geo2.scholarsportal.info>
National Geospatial Intelligence Agency (2016). The World Port Index (Pub 150). Retrieved 2016-05-27 from http://msi.nga.mil/NGAPortal/MSI.portal?_nfpb=true&_pageLabel=msi_portal_page_62&pubCode=0015
Research and Traffic Group in Association with CPCS Transcom (2009). Multimodal Freight and Passenger Traffic Flows, and Infrastructure Study, Ontario-Quebec Continental Gateway and Trade Corridor, Phase 1 Marine Mode Report. Prepared for Transportation Canada, Ministry of Transportation
Ontario, Ministere des Transports du Quebec.
St. Lawrence Governors and Premiers (2015). Strategy for the Great Lakes – St. Lawrence River, Maritime Transportation System. Prepared for conference of
Great Lakes and St. Lawrence Governors and Premiers.
Stewart & Lockhart (2004). Summary of the Hudson Bay Marine Ecosystem
Overview. Retrieved on May 31, 2016 from http://www.dfo-mpo.gc.ca/Library/280328.pdf
Thunder Bay Port Authority (2014). Annual Report. Thunder Bay Port Authority.
Transport Canada (2007). Great Lakes St. Lawrence Seaway Study. Retrieved 2016-05-27 from <http://www.marad.dot.gov/wp-content/uploads/pdf/GLSLs_finalreport_Fall_2007.pdf>

IBI GROUP DRAFT TECHNICAL BACKGROUNDER: MARINE TRANSPORTATION Prepared for the Ontario Ministry of Transportation and Ministry of Northern Development and Mines
November 2016 54
Transportation Research Board (2008). Great Lakes Shipping, Trade and Aquatic Species: Special Report 291, Chapter 4. Accessed 2016-05-31 at <www.nap.edu/read/12439/chapter4>
Warren, J.F. and Lemmen, D.S. (2014). Canada in a Changing Climate: Sector Perspectives on Impacts and Adaptation. Government of Canada, Ottawa, ON.
286 p; pp. 27 and 29, drawn on in Vincent, L. et al 2012 and Environment Canada 2011.
IBI GROUP DRAFT TECHNICAL BACKGROUNDER: MARINE TRANSPORTATION Prepared for the Ontario Ministry of Transportation and Ministry of Northern Development and Mines
November 2016 55
Alternate Text for Exhibits
Exhibit 1.1: Northern Ontario Multimodal Transportation Infrastructure
This map shows the roads, railways, and airports that make up Northern Ontario’s transportation system. Airports are classified as remote, municipal, or international. Roads are classified as primary, secondary, other all-season, winter, or major out of province. Active railways are distinguished by owner. Marine features are distinguished as major ports, other ports, or provincial ferries. International border crossings are also noted. The Far North boundary is
shown, as are the approximate southern limits of continuous permafrost and discontinuous permafrost.
Return to Exhibit 1.1
Exhibit 3.1: Great Lakes Water Depths
This map depicts the water depth of the Great Lakes in metres. The categories are 0-10, 10-20, 20-40, 40-100, 100-200, 200-300, and 300 and deeper. Ports in Northern Ontario are distinguished by those handling over 2 million annual tonnes of cargo, other ports in Northern Ontario, and other ports.
Return to Exhibit 3.1
Exhibit 3.2: Water Depths in Hudson Bay, James Bay, and the Hudson Strait
This map depicts the water depth of Hudson Bay, James Bay, and the Hudson Strait. The categories are 0-10, 10-20, 20-40, 40-100, 100-200, 200-300, and 300 and deeper. Ports, population centres, and First Nation communities are marked.
Return to Exhibit 3.2
Exhibit 4.2: Lake Huron Bathymetry: Manitoulin Island/North Channel/Georgian Bay Area
This is a map showing the water depth in Lake Huron around Manitoulin Island, the North Channel, and the Georgian Bay area. The categories of depth in metres are 0-2, 2-4, 4-6, 6-10, 10-20, 20-40, 40-100, 100-200, 300-300, and over 300. Ports are distinguished by those handling over 2 million annual tonnes of cargo and other ports in Northern Ontario.
Return to Exhibit 4.2
Exhibit 4.3: Georgian Bay Bathymetry: Parry Sound Area
This is a map showing the water depth of Georgian Bay in the Parry Sound area. The categories of depth in metres are 0-2, 2-4, 4-6, 6-10, 10-20, 20-40,

IBI GROUP DRAFT TECHNICAL BACKGROUNDER: MARINE TRANSPORTATION Prepared for the Ontario Ministry of Transportation and Ministry of Northern Development and Mines
November 2016 56
40-100, 100-200, 300-300, and over 300. Ports are distinguished by those handling over 2 million annual tonnes of cargo, other ports in Northern Ontario, and other ports.
Return to Exhibit 4.3
Exhibit 5.2: US and Canadian Laker Vessels at Sault Locks
This image shows three ships with two docked on either side of a channel and one moving through the middle. Two are US lakers, which are too big to navigate the Welland canal and the St. Lawrence River. The other ship is a Canadian Laker, which is noticeably smaller and can navigate the Welland Canal Locks and St. Lawrence Seaway.
Return to Exhibit 5.2
Exhibit 6.1: Cargo Handled at Northern Ontario Marine Ports, 2011
This bar chart displays the cargo handled at Northern Ontario marine ports in millions of commodity tonnes moved in 2011 by port. The chart shows the amount of cargo loaded and unloaded at each port. Ports included are Thunder Bay, Heron Bay, Sault Ste. Marie, Bruce Mines, Thessalon, Serpent Harbour, Little Current, Whitefish River, Badgeley Island, Meldrum Bay, Fisher Harbour, and Parry Sound.
Return to Exhibit 6.1
Exhibit 6.2: Cargo Shipped to/from Northern Ontario Marine Ports by Commodity Type, 2011
This bar chart displays the cargo handled at Northern Ontario marine ports in millions of commodity tonnes moved in 2011 by port and by commodity type. The chart shows the amount of cargo loaded and unloaded at each port. Ports included are Thunder Bay, Heron Bay, Sault Ste. Marie, Bruce Mines, Thessalon, Serpent Harbour, Little Current, Whitefish River, Badgeley Island, Meldrum Bay, Fisher Harbour, and Parry Sound. The commodities included are cereal grains; other agricultural products; other food products; metallic ores; base metal and articles of base metal; monumental or building stone; gravel and crushed stone; natural sands; products of non-metallic minerals; other non-metallic minerals e.g. salt; coal; fuels; products of petroleum refining and coal; basic chemicals; fertilizers and fertilizer material; manufactured products; waste and scrap; and miscellaneous transported products.
Return to Exhibit 6.2
Exhibit 6.3: Cargo Shipped to/from Northern Ontario Marine Ports by Origin/Destination Port and Commodity Type, 2011
This bar chart shows the cargo shipped to and from Northern Ontario in 2011 by origin and destination port in millions of commodity tonnes moved. Origins and

IBI GROUP DRAFT TECHNICAL BACKGROUNDER: MARINE TRANSPORTATION Prepared for the Ontario Ministry of Transportation and Ministry of Northern Development and Mines
November 2016 57
destinations include Quebec, Ontario, Nova Scotia, Michigan, Ohio, Indiana, Illinois, Pennsylvania, other US ports, and foreign ports. The commodities included are cereal grains; other agricultural products; other food products; metallic ores; base metals and article of base metal; monumental or building stone; gravel and crushed stone; natural sands; products of non-metallic minerals e.g. salt; coal; fuels; products of petroleum refining and coal; basic chemicals; fertilizers and fertilizer material; manufactured products; waste and scrap; and miscellaneous transported products.
Return to Exhibit 6.3
Exhibit 6.5: Thunder Bay Historic Cargo and Vessel Handling
This line chart shows the total annual cargo tonnes handled in millions and the number of total annual vessels handled at the Port of Thunder Bay from 1950 to 2015.
Return to Exhibit 6.5
Exhibit 8.1: Historic Dates of Opening and Closing of Navigation at Port of Thunder Bay
This line chart shows the historic opening and closing of navigation at the Port of Thunder Bay from mid-1950s to 2015. The chart has 4 lines: one showing the opening of navigation, one showing the closing of navigation, one showing the linear trend for the opening of navigation, and another showing the linear trend for the closing of navigation.
Return to Exhibit 8.1
Exhibit 9.1: Historic Water Level Trends in the Great Lakes, 1918–2015
This exhibit consists of a series of 4 line graphs depicting the historic water level trends in the Great Lakes between 1918 and 2015. The four graphs provide water levels for Lake Superior, Lake Michigan-Huron, Lake Erie, and Lake Ontario. Water level is recorded in mean annual water level above sea level in metres. Each graph includes two linear trend lines: one for 1918-2015 and another for 1970-2015.
Return to Exhibit 9.1