marine mammal health and stranding response program evaluation key findings john h. prescott marine...
TRANSCRIPT

Marine Mammal Health and Stranding Marine Mammal Health and Stranding Response Program EvaluationResponse Program Evaluation
Key FindingsKey Findings
John H. Prescott Marine Mammal Rescue Grant Assistance Program WorkshopJohn H. Prescott Marine Mammal Rescue Grant Assistance Program Workshop
Responsive ManagementResponsive Management
Thursday, December 10, 2009Thursday, December 10, 2009Photo: NOAA

www.responsivemanagement.com

Responsive Management
Methodology External Survey of Stakeholders (n = 124) Survey instrument developed based on 20 in-depth personal interviews
with Network participants Multi-modal Survey
• Electronic form
• Telephone
Four Regions
• Northeast Region
• Southeast Region
• Southwest Region
• Northwest Region
Data Analysis and Final Report
• Major findings
• Recommendations

KEY FINDINGS
Responsive Management

Responsive Management
Key Topic Areas
1. Participant Training and Educational Backgrounds
2. Funding
3. Event Preparedness
4. Communication
5. NMFS Publicity and Outreach
6. Network Improvement

1. Participant Training and Educational Backgrounds
Responsive Management

Responsive Management
Participant Training and Educational Backgrounds
Not all participants have the same educational backgrounds and levels of training.
• The discrepancies in training and education are commonly viewed as problematic.

Responsive Management
Do you agree or disagree that gaps or discrepancies exist in the training and educational backgrounds of some regional
Network participants?
10
2
6
11
37
35
0 20 40 60 80 100
Strongly agree
Moderately agree
Neither agree nordisagree
Moderatelydisagree
Strongly disagree
Don't know
Percent (n=124)
72% agree

5
79
12
3
0 20 40 60 80 100
Very problematic
Somewhatproblematic
Not at allproblematic
Don't know
Percent (n=91)
Do you consider gaps and discrepancies in the training and educational backgrounds of some regional Network participants to be problematic to the
overall effectiveness of the Marine Mammal Stranding Network? (Asked of those who agree that gaps or discrepancies exist in the training and educational
backgrounds of some regional Network participants.)
Responsive Management

Responsive Management
2. Funding

Responsive Management
Funding
Funding for Stranding Network organizations is a problem.
• More Network participants disagree (52%) than agree (39%) that their organization is adequately funded to fulfill duties.
• Of those who participate in post-release monitoring, a majority disagree (63%) that their organization is adequately funded for this.
• Similarly, “funding” is by far the top answer among resources needed by organizations to improve their effectiveness.

Responsive Management
Do you agree or disagree that your organization is currently being funded at a level adequate to fulfill the duties of a
Stranding Network participating organization?
14
25
7
22
30
2
0 20 40 60 80 100
Strongly agree
Moderately agree
Neither agree nordisagree
Moderatelydisagree
Strongly disagree
Don't know
Percent (n=125)
52% disagree

Do you agree or disagree that your organization has adequate funding with which to conduct post-release monitoring of
marine mammals? (Asked of those whose organization participates in post-release monitoring of marine mammals.)
4
20
8
39
24
4
0 20 40 60 80 100
Strongly agree
Moderately agree
Neither agree nor disagree
Moderately disagree
Strongly disagree
Don't know
Percent (n=49)
Responsive Management
63% disagree

What resources do you need in order to improve the effectiveness of your organization?
6
4
82
51
43
28
14
5
0 20 40 60 80 100
Funding
Staff
Training
Packing / shipping materials for carcasses,tissues, etc.
Regulations / guidelines
Better facilities
Better communications / better access to data
Other
Mu
ltip
le R
es
po
nse
s A
llo
wed
Percent (n=123)
Responsive Management

Responsive Management
3. Event Preparedness

Responsive Management
Event Preparedness
Substantial percentages of Network participants feel their organizations are not at all prepared for the following events:
• an oil spill (38%)
• a disentanglement event (20%)

Responsive Management
Percent whose organization is not prepared at all regarding response to each of the following events.
8
14
15
20
38
0 20 40 60 80 100
An oil spill
A disentanglement event (such aslarge cetacean or pinniped)
A mass stranding
A large whale stranding
An Unusual Mortality event
Percent

Responsive Management
Event Preparedness
Feelings of being unprepared are most commonly due to the following:
• inexperience
• lack of training for the event
• unfamiliarity with proper protocols and procedures for the event
• lack of available funding and staff

Responsive Management
Why do you think your organization is unprepared regarding response to an oil spill? (Asked of those who think their
organization is unprepared for the event.)
2
77
73
63
58
54
8
0 20 40 60 80 100
Limited experience in responding to this typeof event
Training
Knowledge of proper guidelines, protocols,and procedures
Funding
Staff
Facilities / equipment
Other
Mu
ltip
le R
es
po
nse
s A
llo
wed
Percent (n=48)

Responsive Management
Why do you think your organization is unprepared regarding response to a disentanglement event (such as large cetacean or pinniped)? (Asked of those who think their organization is
unprepared for the event.)
79
71
67
54
38
4
0 20 40 60 80 100
Limited experience in responding to thistype of event
Training
Knowledge of proper guidelines, protocols,and procedures
Staff
Funding
No answer
Mu
ltip
le R
es
po
nse
s A
llo
wed
Percent (n=24)

Responsive Management
4. Communication
Responsive Management
Communication
There may be opportunities to:
• better educate Stranding Network participants on the role of the national Stranding Coordinator
• improve Network communication in several areas

Responsive Management
What is your perception of the role of the national Stranding Coordinator?
27
22
6
19
16
14
13
12
8
0 20 40 60 80 100
Set priorities / determine direction / set policies
Oversee / coordinate with the Regional Coordinator
Provide overall support / guidance for Network / overseeNetwork
Coordinate all regions / provide overall coordination
Disseminate information and training
Maintain consistency in data collection
Determine funding opportunities / assist with funding
Other
Don't know / unsure / role is unclear
Mu
ltip
le R
es
po
nse
s A
llo
wed
Percent (n=104)

Responsive Management
Communication
Substantial percentages of Network participants describe the following types of Network communication as fair or poor:
• communication between regions (50%)
• communication with the NMFS after responses to strandings (25%)
• communication with other Network participant organizations in region (24%)
• overall communication with the NMFS (22%)
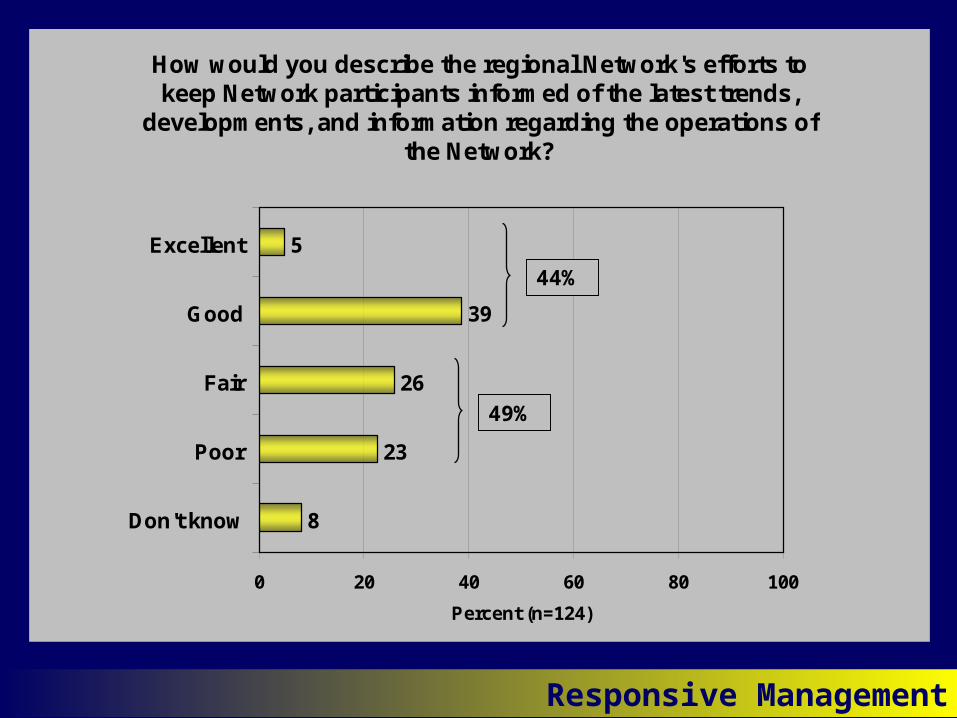
• regional efforts to keep Network participants informed of the latest trends, developments, and information (49%)

Responsive Management
Percent who would describe communication between the following organizations and their organization as fair or poor.
17
22
24
24
25
50
16
0 20 40 60 80 100
Between your region and other regions throughout thenational Marine Mammal Stranding Network
The National Marine Fisheries Service after responses tostrandings
National Marine Fisheries Service area representatives(Asked of Southeast Region participants.)
Other Network participant organizations in their region
Overall, the National Marine Fisheries Service
The state coordinator (Asked of Southeast Regionparticipants.)
The National Marine Fisheries Service during responsesto strandings
Percent
Responsive Management
How would you describe the regional Network's efforts to keep Network participants informed of the latest trends,
developments, and information regarding the operations of the Network?
5
39
26
23
8
0 20 40 60 80 100
Excellent
Good
Fair
Poor
Don't know
Percent (n=124)
49%
44%
Responsive Management
5. NMFS Publicity and Outreach

Responsive Management
NMFS Publicity and Outreach
Substantial percentages of Stranding Network participants indicate that the NMFS could improve efforts to:
• provide feedback to the public regarding strandings and other Network information
• assist participant organizations with media and publicity
A majority of participants also agree that the NMFS should work more closely with neighboring nations.

Responsive Management
How would you rate the National Marine Fisheries Service's efforts to provide feedback to the public regarding strandings
and other Network information?
7
35
25
18
15
0 20 40 60 80 100
Excellent
Good
Fair
Poor
Don't know
Percent (n=123)
43%

Responsive Management
How would you rate the efforts of the National Marine Fisheries Service to assist your organization with media and
publicity (such as during major stranding events)?
10
32
22
17
20
0 20 40 60 80 100
Excellent
Good
Fair
Poor
Don't know
Percent (n=125)
39%

Responsive Management
Do you agree or disagree that the National Oceanic and Atmospheric Administration should be working more closely
with neighboring nations to provide training, enhanced communication or collaboration with other countries?
36
25
24
2
2
10
0 20 40 60 80 100
Strongly agree
Moderately agree
Neither agree nor disagree
Moderately disagree
Strongly disagree
Don't know
Percent (n=125)
61% agree

Responsive Management
6. Network Improvement

Responsive Management
Network Improvement
Although organizations’ greatest needs are for additional funding and training, there is also a desire for greater coordination and collaboration throughout the Stranding Network.
Excluding funding, top ways Network participants can enhance the capacity to produce scientific information are:
• communication / coordination / collaboration
• additional training
• standardization of data collection / archiving

Responsive Management
Excluding funding, how can Network participants enhance the capacity to produce more scientific information?
49
22
22
5
4
4
0 20 40 60 80 100
Better communications / coordination /collaboration
Additional training
Standardization of collection / archiving
Regulatory change / change of priorities
Better outreach
Use partnerships
Mu
ltip
le R
es
po
nse
s A
llo
wed
Percent (n=106)

Responsive Management
Network Improvement
Most commonly needed additional resources are:
• funding
• training
• equipment
• better communication / cooperation
• staff

Responsive Management
Including financial resources, what additional resources are needed in your region to improve the efficiency of the Marine
Mammal Stranding Network?
23
7
41
25
19
16
15
11
0 20 40 60 80 100
Funding
Training
Equipment (including vehicles)
Improved communication / cooperation (e.g., betweenorgs, between NMFS and regions/orgs)
Staff
Improved / enhanced facilities / labs
Improved / more consistent / more thorough datacollection
Other
Mu
ltip
le R
es
po
nse
s A
llo
wed
Percent (n=111)

Responsive Management
Excluding financial resources, what additional resources are needed in your region to improve the efficiency of the Marine
Mammal Stranding Network?
26
22
13
11
43
0 20 40 60 80 100
Improved communication / cooperation (e.g.,between orgs, between NMFS and regions/orgs)
Training
Staff
Equipment (including vehicles)
Other
Mu
ltip
le R
es
po
nse
s A
llo
wed
Percent (n=89)

Responsive Management
Network Improvement
Network participants think the following should be priorities in their region:
• improved data collection
• additional / better funding sources
• improved communication / coordination / cooperation

What should the priorities be for the Marine Mammal Stranding Network in your region over the course of the next 5
years?
25
10
27
22
21
17
15
12
0 20 40 60 80 100
Improve data collection methods / consistency ofdata collection
Secure better funding / find additonal funding
Improve regional / overall Network cooperation /coordination / communication
Improve education / outreach
Improve stranding event response rates
Update / enhance facilities and labs
Improve necropsy process / conduct morethorough necropsies
Other / don't know
Mu
ltip
le R
es
po
nse
s A
llo
wed
Percent (n=101)
Responsive Management

Responsive Management
Photo: PBS

Responsive Management
PRESCOTT GRANT

Responsive Management
Prescott Grant
The Prescott Grant is one of the top sources of funding for Stranding Network organizations.
• Half of all organizations surveyed (50%) currently receive at least some funding through the Prescott Grant.
• More than a quarter (27%) identify the Prescott Grant as their organization’s primary source of funding.

How is your organization currently funded?
4
4
6
55
50
38
21
18
10
3
9
3
0 20 40 60 80 100
Private donations / private funding
Prescott Grant
Grants, excluding Prescott Grant
Merchandise sales
Registration / membership fees
No funding / all volunteer
State government funding
Federal funding
Local government
Endowed chair(s)
Other
Don't know
Mu
ltip
le R
es
po
nse
s A
llo
wed
Percent (n=126)
Responsive Management

What is your organization's primary source of funding?
9
1
3
29
27
11
6
6
4
3
0 20 40 60 80 100
Private donations / private funding
Prescott Grant
Grants, excluding Prescott Grant
No funding / all volunteer
State government funding
Local government
Federal funding
Registration / membership fees
Other
Don't know
Percent (n=124)
Responsive Management

Responsive Management
Prescott Grant
A substantial percentage of Network participants whose organizations are funded through the Prescott Grant (31%) say they are dissatisfied with the funding opportunities made available through the Prescott Grant.

How satisfied or dissatisfied are you with the funding opportunities made available through the Prescott Grant?
(Asked of Prescott Grant recipients.)
17
40
2
29
2
11
0 20 40 60 80 100
Very satisfied
Somewhatsatisfied
Neither satisfiednor dissatisfied
Somewhatdissatisfied
Very dissatisfied
Don't know
Percent (n=63)
Responsive Management
31% dissatisfied

Responsive Management
Prescott Grant
Common reasons for dissatisfaction with the Prescott Grant are:
• the grant does not provide enough funds to cover organizational needs
• funds do not arrive on time or are awarded late
• the Prescott Grant is influenced by politics / favoritism

Why are you dissatisfied with the funding opportunities made available through the Prescott Grant? (Asked of Prescott
Grant recipients who are dissatisfied with the funding opportunities available.)
3
6
30
20
17
14
11
11
0 20 40 60 80 100
Not enough funds to cover organization needs
Funds do not arrive in time / are awarded late
Prescott award process is influenced too much bypolitics / favoritism
Prescott priorities fail to encompass scope of work
Prescott award process is influenced by region(s) /favors certain regions
Prescott review process is unfair / inadequate
Other
Don't know
Mu
ltip
le R
es
po
nse
s A
llo
wed
Percent (n=64)
Responsive Management

Responsive Management
Prescott Grant
A substantial percentage of Network participants whose organizations are funded through the Prescott Grant (29%) say they are dissatisfied with the Prescott Grant’s application process.

How satisfied or dissatisfied are you with the application process for the Prescott Grant?
(Asked of Prescott Grant recipients.)
11
30
16
27
2
14
0 20 40 60 80 100
Very satisfied
Somewhatsatisfied
Neither satisfiednor dissatisfied
Somewhatdissatisfied
Very dissatisfied
Don't know
Percent (n=63)
Responsive Management
29% dissatisfied

Responsive Management
Prescott Grant
Common reasons for dissatisfaction with the Prescott Grant application process are:
• requires too much information
• depends too much on politics / favoritism
• contributes to disproportionate spreading of funds throughout the Network

Why are you dissatisfied with the application process for the Prescott Grant? (Asked of Prescott Grant recipients who are
dissatisfied with the application process.)
3
6
8
10
14
14
19
6
3
6
0 20 40 60 80 100
App / award process requires too much info
App / award process based on politics / favoritism
App / award process favors certain regions /disproportionate spreading of funds in Network
Guidelines are redundant and/or cumbersome
Grant requirements / guidelines are unclear
App / award process timeline is too short
Prescott program priorities do not conform toexpressed intent of original legislation
Wrong time of year
Other
Don't know
Mu
ltip
le R
es
po
nse
s A
llo
wed
Percent (n=63)
Responsive Management
Responsive Management
Photo: NOAA