marine - cbd home · the algerian conservatoire national du littoral (cnl - national coastal...
TRANSCRIPT

Paper 13
PLAN BLEU - UNEP/MAP Regional Activity Centre
MARINEECOSYSTEMS
Anaï MangosMaud-Anaïs Claudot
Economic study of the impacts of marine and coastal protected
areas in the Mediterranean
October 2013

ECONOMIC STUDY OF THE IMPACTS OF MARINE AND COASTAL PROTECTED AREAS IN THE MEDITERRANEAN
Photos © Plan Bleu, Photaki
Legal noticeThe designation employed and the presentation of the material in this document do not imply the expression of any opnion whatsoever on the part of Plan Bleu concerning the legal status of any State, Territory, city or area, or of its authorities, or concerning the delimitations of their frontiers or boundaries..
CopyrightThis publication may be reproduced in whole or in part in any form for educational or non-profit purposes without special permission from the copyright hlder, provided acknowledgement of the source is made. Plan Bleu would appreciate receiving a copy of any publication that uses his publication as a source. This publication cannot be used for resale or for any other commercial purpose whatsoever without permission in writing for Plan Bleu.
For bibliographic purposes this volume may be cited as:Mangos A., Claudot M.-A. (2013). Economic study of the impacts of marine and coastal protected areas in the Mediterranean. Plan Bleu, Valbonne. (Plan Bleu Papers 13).
This publication is available for download from Plan Bleu website: www.planbleu.org.
Plan BleuUNEP/MAP Regional Activity Centre15, rue Beethoven, Sophia Antipolis06560 ValbonneFrancewww.planbleu.org
Publication produced under the leadership of Plan Bleu’s director, Hugues Ravenel.
Author Anaï Mangos and Maud-Anaïs Claudot
National experts who contributed to the case studiesMiss Laura MARTINEZ RUBIO for the Cap de Creus Natural Park in Spain, Mr Mounir BALLOUMI for the Sensitive Area of the Kuriat Islands in Tunisia, Mrs Esra BASAK for the Specially Protected Area of Kas Kekova in Turkey, Mr Ioannis SPILANIS for the National Marine Park of Zakynthos in Greece, and Mr Saïd Chaouki CHAKOUR for the Mount Chenoua and Kouali Coves Protection Project in Algeria
Revew panelProject steering committee, Didier Sauzade, Dominique Legros (Plan Bleu).
CartographyMedPan (Network of Managers of Marine Protected Areas in the Mediterranean), Jean-Pierre Giraud
Bibliography and documentationHélène Rousseaux
Graphic design and productionGraph8
The report hasbeen produced with the support of :
The analyses and conclusions expressed in this publication do not necessarily reflect theo pinions of the French Globan Environment Fund (FGEF), the French Development Agency (AFD) or the Spanish Agency for International Cooperation for Development (AECID)..
ISBN 978-2-912081-37-7
Printed by NIS photoffsetPapier CyclusPrint 130 and 250
© 2013 Plan Bleu

PLAN BLEU PAPERS N° 13
Table of contentsAcknowledgments 4Preface 5Introduction 6
Foreword 6Objectives 6Limitation of the study 7
General approach and salient points of the case studies 9Context of the study 9EvaluatioN method 10Application of the cost benefit analysis 11Characteristics of the MCPAs studied 14Salient features of the case studies 14Contribution and limits of the study 16References 18
The Kuriat islands, biodiversity refuge at the heart of Monastir coast 20Integration of the Kuriat Islands protection in the surrounding motion 20What is the outlook for protection of the Kuriat Islands? 23Conclusion 28
Cap de Creus, the longest natural coastline of the Costa Brava 29Integration of the NPCC into the Alt Empordà district 29What is the oulook for the NPCC? 32Conclusion 37
Kas-Kekova, archeological and natural heritage to be preserved 38Kas-Kekova on the edge of Antalya Province 38What is the outlook for Kas Kekova SEPA? 41
The island of Zakynthos, a heaven for tourists and loggerhead turtles 46Integration of the NMPZ into the local development of Zakynthos 46What is the outlook for the NMPZ? 49Conclusion 53
Mount Chenoua Kouali coves, a potentiel MCPA 55The MCPA, a management tool for sustainable resource use and tourism 55Prospective analysis for fishing and tourism 58Conclusion 58
Table of illustrations 60List of figures 60List of tables 61
02 I 03

ECONOMIC STUDY OF THE IMPACTS OF MARINE AND COASTAL PROTECTED AREAS IN THE MEDITERRANEAN
ACKNOWLEDGMENTS
Plan Bleu would like to thank the French Global Environment Fund (FGEF), the Agence Française de Développement (AFD - French Development Agency) and the Spanish Agency for International Cooperation and Development (AECID) for supporting this research programme.
This study was facilitated by the Regional Activity Centre for Specially Protected Areas (RAC/SPA), the Network of Managers of Marine Protected Areas in the Mediterranean (MedPAN) and the WWF MedPO (World Wildlife Fund Mediterranean Programme Office).
It is based on the results of five case studies carried out by consultants selected by Plan Bleu: Miss Laura MARTINEZ RUBIO for the Cap de Creus Natural Park in Spain, Mr Mounir BALLOUMI for the Sensitive Area of the Kuriat Islands in Tunisia, Mrs Esra BASAK for the Specially Protected Area of Kas Kekova in Turkey, Mr Ioannis SPILANIS for the National Marine Park of Zakynthos in Greece, and Mr Saïd Chaouki CHAKOUR for the Mount Chenoua and Kouali Coves Protection Project in Algeria.
This study would not have been possible without the collaboration of the managers of the areas concerned by the case studies and particularly Ms Victoria RIERA, manager of the Cap de Creus Natural Park in Spain, Ms Saba GUELLOUZ of the Agency for Coastal Protection and Development and Ms Souha EL ASMI of RAC/SPA for the Sensitive Area of the Kuriat Islands in Tunisia, Ms. Marina GOMEI of WWF MedPO and Mr. Harun GUCLUSOY of UNDP’s Ancara Agency and the UNDP agency of Ankara and the GDNAP (General Directorate for Natural Assets Protection)
for the Specially Protected Area of Kas Kekova in Turkey, Mr. Laurent SOURBES, manager of the National Marine Park of Zakynthos in Greece, and M. Abdelaali BEGHOURA, director of the Algerian Conservatoire National du Littoral (CNL - National Coastal Conservatory)for the Mount Chenoua and Kouali Coves Protection project in Algeria, as well as the focal points of Plan Bleu for the countries mentioned.
The study also benefited from the expert opinions of the steering committee put together by Plan Bleu to direct its research programme on the economic approach to Mediterranean marine ecosystems, under the direction of Mr Lucien CHABASON, President of Plan Bleu. We would like to extend our particular gratitude to Mr Abderrahmen GANNOUN, director of the RAC/SPA; Mr Samir GRIMES, Professor and researcher at ENSSMAL (Ecole nationale supérieure des sciences de la mer et de l’aménagement du littoral – Algerian National School of Ocean sciences and coastal development); Mr Alain JEUDY de GRISSAC, Marine Conservation Programme Coordinator, IUCN Med (International Union for Conservation of Nature, Centre for Mediterranean Cooperation); Mr Jean-Louis WEBER, international expert in environmental accounting, Ms Marina GOMEI, Marine Protected Area Programme Officer at WWF MedPO and Mrs Chloé WEBSTER, Scientific Manager at MedPan..

PLAN BLEU PAPERS N° 13 04 I 05
PREFACE
In the wake of the Rio+20 Summit, which reaffirmed the commitment of the Parties to the Convention on Biological Diversity and particularly the Aichi targets, committing them to protect at least 17% of the world’s land surface and 10% of marine and coastal areas through an efficient network of protected areas, marine protection has become a more important issue than ever before.
This commitment attests to the fact that public policymakers have become aware of the contribution of marine and coastal ecosystems to human life and well-being. In the words of Pavan Sukhdev, “We cannot manage what we do not measure”, so the evaluatin of services provided by marine ecosystems is one step towards protecting them efficiently.
This is especially the case in the Mediterranean, which is one of the 25 global biodiversity hotspots and which has a high level of endemism. Development in Mediterranean countries is highly concentrated in coastal areas, which creates significant pressure on the marine and coastal environment. The intensity of the governance issues between different stakeholders and even between several states concerning the marine environment necessitate well-informed decision-making based on the most extensive information available.
As an organisation dedicated to global environment conservation and sustainable development, particularly in developing countries, the French Global Environment Fund (FGEF) has contributed to the creation of more than 70 Marine and Coastal Protected Areas (MCPA) throughout the world, covering more than 8,000 km². A
2010 assessment of these projects identified success criteria for the creation, management and long-term financing of MCPAs by capitalising on the experience gained over ten years of working alongside managers.
As a stakeholder of the Strategic Partnership for the Mediterranean Large Marine Ecosystem, the FGEF relies on Plan Bleu’s expertise in sustainable development and prospective issues drawn from over thirty years of experience in the Mediterranean. Based on the case studies presented, the analysis of MCPAs proposed in this study provides a better understanding of the economic effects of MCPAs on local development and is used to draw lessons adapted to the Mediterranean context. This knowledge aims to contribute to better integrating Mediterranean MCPAs into the local socio-economic dynamics while finding an equal balance between resource conservation and the well-being of the local population.
Hugues Ravenel
DirectorPlan Bleu
François-Xavier Duporge
General SecretaryFonds français pour l'environnement mondial

ECONOMIC STUDY OF THE IMPACTS OF MARINE AND COASTAL PROTECTED AREAS IN THE MEDITERRANEAN
INTRODUCTION
The ocean is a global system that provides ecosystem services essential to life and significant sustainable development opportunities, however its conservation is a major issue for the future. This is particularly true for the Mediterranean Sea. Its climatic and geographical characteristics as a semi-enclosed sea provide it with rich biodiversity marked by high endemism, making it extremely vulnerable to natural and anthropogenic pressures.
FOREWORDThe considerable increase in shipping over the last several decades, along with the development of areas, anthropogenic pollution, the introduction of invasive species and overfishing (considered as the greatest pressure on coastal ecosystems according to the General Fisheries Commission for the Mediterranean - GFCM) are major factors that disturb marine and coastal ecosystems.
Marine and coastal protected areas (MCPA), defined by the United Nations Convention on Biological Diversity (CBD) as “Any defined area within or adjacent to the marine environment, together with its overlying water and associated flora, fauna, historical and cultural features, which has been reserved by legislation or other effective means, including custom, with the effect that its marine and/or coastal biodiversity enjoys a higher level of protection than its surroundings”1, are presented as tools adapted to protecting marine and coastal environments and their biodiversity. At the 10th Conference of the Parties to the CBD held in Nagoya in 2010, the international community confirmed the importance of this type of tool by adopting a strategic plan that sets out to create a network of marine protected areas covering at least 10% of coastal areas and oceans by 2020. This is an ambitious target for the Mediterranean, where MCPAs currently only concern 4% of the marine surface area2. In February 2012, after the last Conference of the Parties to the Barcelona Convention on the protection of the marine and coastal environment in the Mediterranean, the Paris declaration reaffirmed the commitment of member states to creating a consistent and well-managed network of MCPAs.
Conducting analyses and prospective studies for the Mediterranean scale as decision-making tools is one of the components of the Plan Bleu’s founding mission. As a Mediterranean Action Plan (MAP) regional activity centre, and in line with the Strategic Action Programme for the conservation of Biological Diversity (SAP BIO) in the Mediterranean Region – which aims to improve existing MCPAs and create new protected areas – since 2010, Plan Bleu has been developing a marine environment research programme.
1 COP 7, Decision 7/5, Appendix 3.2 This number even drops to 0.4% without the Pelagos Sanctuary. Source: Status of Marine Protected Areas in the Mediterranean, WWF, IUCN, MedPan, 2009.
OBJECTIVES As part of the programme this study aims to qualify and quantify the effects of protection on the socio-economic situation by observing changes in ecosystem services provided in five Mediterranean sites.
The objective of this exploratory study is to highlight the links between environmental protection and local development in the specific case of Marine and Coastal Protected Areas. It shows that the protection of natural environments can generate socioeconomic benefits for local development. These are based on the long-term increase in services provided by ecosystems that contribute to human wellbeing.
This work, based on the evaluation of the impacts of different MCPAs on their surrounding areas, is conducted within the framework of the Strategic Partnership for the Mediterranean Large Marine Ecosystem (SPMLME), and receives support from the French Global Environment Fund (FGEF), as well as the French and Spanish development agencies (the AFD and AECID respectively).
The sites selected – the Cap de Creus Natural Park in Spain, the Sensitive Area of the Kuriat Islands in Tunisia, the Specially Protected Area of Kas Kekova in Turkey, the National Marine Park of Zakynthos in Greece, and the Mount Chenoua and Kouali Coves protection project in Algeria – are distributed on the North, East and Southern coasts of the Mediterranean.

PLAN BLEU PAPERS N° 13 06 I 07
Figure 1. Marine and Coastal Protected Areas in the Mediterranean
SPA: Specially Protected Area. SPAMI: Specially Protected Area of Mediterranean Interest.
Sources: MAPAMED, the database on Mediterranean Marine Protected Areas, MedPAN, RAC/SPA, 2012
This study was based on the case study reports for each of the sites, which the reader may refer to for more information. It should be noted that the data presented in this synthesis report was obtained from the case study reports provided by the consultants, and they are solely responsible for it.
The information available on the Tunisian, Spanish and Turkish sites was used to develop prospective scenarios for 2030 based on available past and current data and to establish a cost-benefit analysis which takes into account the main uses associated with the ecosystem services rendered. The benefit analysis examined the benefits from commercial and non-commercial fishing, tourism, recreational boating, diving, CO
2 sequestration and the operating costs of the body responsible for managing the MCPA and the surveillance and environmental education expenses for the incurred costs.
Less well-documented, the studies conducted on the Algerian site of Mont Chenoua-Kouali Coves, where the creation of an MCPA is still in the planning stages, and Zakynthos Island in Greece, due to the high uncertainty of the current economic national and international context, had to be limited to an overview and
retrospective analysis that nevertheless outlines likely trends for the tourism and commercial fishing industries.
The study tested the application of the Cost-Benefit Analysis (CBA) method on various MCPAs and established an order of magnitude for part of the local impacts. It does not aim to establish an exhaustive inventory of the costs and benefits associated with Mediterranean MCPAs, which would be impossible. It is recognised that there are many relationships between man and nature that are essential to well-being but that are also complex and poorly understood. However, emphasis is placed on the benefits stemming from ecosystem services that are visible on a local level through an economic and quantitative approach.
LIMITATION OF THE STUDYThe study is related to the difficulty of taking into account the uncertainty and complexity of marine and coastal ecosystems. These difficulties were heightened by the current context – the global economic crisis and the rapid political changes engendered by the Arab Spring movements.

ECONOMIC STUDY OF THE IMPACTS OF MARINE AND COASTAL PROTECTED AREAS IN THE MEDITERRANEAN
In addition, it was only possible to carry out quantitative assessment on the fraction of benefits stemming from the ecosystems and protective actions that are easiest to quantify because they are closest to the market. It is well-known that MCPAs are part of an ecological continuum. Within the scope of an economic approach, contributing to maintaining this continuum can be equated with producing a public good, beyond the borders of the MCPA and its sphere of influence. Although this dimension is essential in justifying MCPAs and determines their heritage value to a certain degree, it was not taken into account in this study, which focuses on local and easily quantifiable benefits.
Finally, the sites examined in the study vary greatly in terms of surface area, socio-economic profile and institutional context, etc. Without attempting to make comparisons, this study aims to broadly identify common messages and share experiences in order to promote dialogue between biodiversity conservation and sustainable uses of natural resources.

PLAN BLEU PAPERS N° 13 08 I 09
GENERAL APPROACH and salient points of the case studies
CONTEXT OF THE STUDYThe identification of links between biodiversity and services provided by ecosystems and their contributions to the economy and the well-being of users has seen numerous developments since the publication of the Millennium Ecosystem Assessment (MEA, 2005) which analysed the benefits of ecosystem services in terms of provision, regulation and culture for human development and well-being. The MEA presents scenarios concerning the potential futures of large global ecosystems while considering humans as an integral part of them. The Aichi targets adopted in Nagoya in 2010 include the awareness of the value of biological diversity and its integration into planning strategies at every level (targets 1 and 2), the sustainable management of natural marine resources based on an ecosystem-based approach (target 6) and the conservation of 10% of marine and coastal areas through a network of protected areas (target 11). The second version of The Economics of Ecosystems and Biodiversity(TEEB), directed by Pavan Sukhdev and published in 2010, sets out a method for economic evaluation of the services provided by ecosystems and ordinary biodiversity according to the ultimate objective and available resources. Ecosystems and biodiversity are considered as natural capital for which the flows are materialised by ecosystem service streams. By assigning an economic value to these flows, the respective impacts of protecting ecosystems and the cost of inaction can be compared.
For the marine environment, a study for the United Nations Environment Programme (UNEP) Regional Seas Programme on large global marine ecosystems, including those in the Mediterranean, developed a method for evaluating the sustainability of human activities on the marine environment. This work is part of an ecosystem approach (defined by the CBD as “a strategy for the integrated management of land, water and living resources that promotes conservation and sustainable use in an equitable way”) shared by the UNEP, the European Union, the United Nations Mediterranean Action Plan (MAP) and some MAP regional activity centres, particularly Plan Bleu and the Regional Activity Centre for Specially Protected Areas (RAC/SPA).
For the Mediterranean, during the Paris Summit (2012), the Parties to the Barcelona Convention called for the definition of guidelines for a blue economy for the Mediterranean, within the framework of the Mediterranean Sustainable Development Strategy created by the MAP in 2005. This report helps clarify the potential role of MCPAs in the blue economy and more specifically their effects on local development in their sphere of influence.
A recent study conducted by Plan Bleu3, which experimented with quantifying the sustainable benefits generated by marine ecosystems, particularly in terms of food production, recreational amenities and support, climate regulation, and erosion control came up with an order of magnitude of €26 billion for 2005. More than two thirds of these benefits stem from the supply of recreational amenities and support (tourism, residential), while benefits from fishing, CO2 sequestration and wastewater treatment represent approximately one tenth each, with benefits from erosion control less evident in the evaluation. As an extension of this work, the discussion on MCPAs is based on the services provided by ecosystems.
As a tool for reconciling multiple objectives (biodiversity conservation, sustainable management of extractive uses such as fishing, development of uses such as ecotourism or “soft” recreational activities, the specific need to protect an emblematic species, etc.), MCPAs contribute to supplying many services, from food production to climate regulation, including erosion control, greenhouse gas sequestration, the support of recreational activities and the supply of cultural amenities, etc. These ecosystem services all benefit anthropogenic activities carried out locally or contribute directly to the well-being of populations. Because of this, they are particularly suitable for economic evaluation on a local scale.
Mediterranean MCPAs are characterised by their wide diversity, size, ecological characteristics, the remarkable or ordinary ecosystems within them, the protection which they provide (from both a regulatory standpoint and in terms of application), their conservation, protection or management missions, as well as their local, regional, national and sometimes transnational status (such as for the Pelagos sanctuary, etc.)4. The wide diversity of Mediterranean MCPAs creates significant differences in the ways in which they are created and managed. The multiple experiences in the Mediterranean are showcased and shared by trans-border cooperation institutions. For instance, the MedPAN network, a project launched by the World Wildlife Fund (WWF) in 1990, has more than 40 members from 30 different MCPAs. The plurality of uses within Mediterranean MCPAs is also considerable and can contribute to exacerbating conflicts of interest between different users (fishermen, residents, tourism operators, etc.)5
The sites selected for study demonstrate this diversity. In terms of status, the Kas-Kekova site in Turkey and the Zakynthos (Greece) or Cap de Creus (Spain) parks have had MCPA status for a long time while the Kuriat islands (Tunisia) have a Sensitive Coastal
3 Mangos et al.,2010.4 Badalamenti et al., 2000.5 Chakour et Dahou, 2009.

ECONOMIC STUDY OF THE IMPACTS OF MARINE AND COASTAL PROTECTED AREAS IN THE MEDITERRANEAN
Area (SCA) status and are contenders for MCPA status, which is also being considered for the Mount Chenoua/Kouali Coves site (Algeria). The study sites differ in terms of surface area, population density, main uses associated with the ecosystem services provided, whether they are on islands or not, social acceptance of the protection, etc. Given the significant diversity of the sites, this study aims to broadly identify common messages and share experience in order to develop dialogue between biodiversity conservation and sustainable uses of natural resources.
EVALUATION METHODFor economic evaluation, in 2006, the RAC/SPA came up with a series of recommendations and methodological tools that can be applied to determining the costs and benefits for a Mediterranean MCPA6. The same year, the OECD also published a book on the application of Cost Benefit Analysis and the environment7. This initiative was followed up by a study coordinated by the FGEF on the economic evaluation of MCPAs8 to capitalise on the experiences of the FGEF with MCPA creation and management projects in 2010, which proposes applying the CBA methodology to Marine Protected Areas.
The idea of “demonstrating the economic value”, in the words of Pavan Sukhdev, of biodiversity and ecosystem services which it supports does not insinuate that economic arguments should replace cultural or moral arguments in favour of environmental protection, or that biodiversity should integrate a market. While economic evaluation cannot sum up alone the arguments put forward for nature conservation, it does have the advantage of being easily understood by civil society and policymakers, thus facilitating the consideration of environmental issues when allocating resources without being the only decision criterion. It also makes it possible to draw a parallel with other public sector policies by providing commensurability. Furthermore, the cost benefits from ecosystems are often distributed over time and between stakeholders who prefer to maximise their individual benefits in the short term to the detriment of the common good9 and the long term, hence the interest of quantifying them, of aggregating the different benefits obtained and discounting them. Despite the efforts to take into account all the benefits from the services provided by ecosystems, it is impossible to exhaustively show the complexity of the relationship between humans and nature.
The Total Economic Value (TEV) is one of the key elements of the framework for economic analysis of ecosystem services. It is typically presented as the sum of its components that are use values (direct, indirect) and non-use values (option, bequest, existence). The tangibility of these values decreases as the moves to the non-use values and to future uses. Conscious that the effort of completness would be vain or presumptuous, the study does not aim to estimate the Total Economic Value of ecosystems protected within MCPAs.
6 Becker, N. & Y. Choresh. 2006.7 Pearce et al. 2006.8 Clément et al., 2010.9 Hardin, 1968.
What is proposed here is to explore certain elements of the theoretical TEV to identify the economic order of magnitude of part of the ties that civil society maintains with ecosystems protected within MCPAs and the effect that MCPAs have on these ties as an argument for awareness and dialogue support.
There are several obstacles to overcome in the economic evaluation of services provided by ecosystems. Firstly, biodiversity is only evaluated with respect to the benefits from ecosystem services– from its functional aspect – and not a heritage standpoint. This approach is better applied to so-called “ordinary” biodiversity rather than “remarkable” biodiversity10, where the cultural, aesthetic, ethical, etc. importance justifies specific protection measures, particularly in certain cases where MCPAs are created. The rarity of certain remarkable species such as the Mediterranean monk seal (Monachus Monachus), gives them an inestimable value that cannot be taken into account and justifies their protection irrespective of any economic analysis.
Estimation attempts are also faced with the non-linearity of relationships between anthropogenic activities and ecosystems, which means that complex and poorly understood factors such as resilience or threshold effects must be taken into account. There are a wide range of services provided by coastal and marine ecosystems that sometimes compete against each other and that are often non-commercial (such as wastewater absorption or climate regulation) which makes them difficult to evaluate on an economic level. The absence of ownership rights, as is often the case for marine and coastal ecosystems, results in the non-remuneration of natural assets due to the free access to marine resources (fish stocks, sea beds in international waters).
The conceptual framework adopted in this study considers ecosystems as production factors that provide ecosystem services, which are also involved in the production of commercial or non-commercial goods and services which contribute to the well-being of individuals. Individuals are considered as rational agents seeking to maximise their utility, with the aim of society being to maximise the sum of its agents’ utilities. Improved well-being reveals the benefits generated by protected ecosystems. In other words, these benefits are constituted by the increase in value of private and collective benefits resulting from the existence of the MCPA, while costs derive from the effects of use restrictions resulting from the MCPA (private costs linked to the restriction of certain activities such as fishing, etc.) and the financial effort granted for the establishment and activity of the MCPA (such as operating costs or investments).
Since the benefits from ecosystem services sometimes compete with each other and the costs of some can represent the benefits of others (e.g. the operating costs of the MCPA represent a cost for the lending institutions but also income for employed personnel or suppliers), it is important to define a reference to determine what must be considered as costs or benefits for the current evaluation. In this exercise, the point of view adopted is that of the virtual public
10 Chevassus-au-Louis, 2010.

PLAN BLEU PAPERS N° 13 10 I 11
policymaking body responsible for the general economic good over the long term.
Estimating the economic value of the benefits from ecosystem services generally requires different evaluation methods that tend to measure the consent to pay (or receive) to access (or give up) an ecosystem service unit. Two types of methods are used; those based on revealed preferences and those based on declared preferences of individuals. If the benefits are commercial or the uses are near markets, the methods that rely on revealed preferences will be more suitable and more precise as they are based on observed behaviours. This position was adopted for this study given the ecosystem services involved. The benefits associated with the ecosystem services in the different case studies were evaluated based on the revenue generated from the use of ecosystem services or based on the costs of accessing or using the ecosystem services.
The analysis method selected for a given project depends on the targeted objective. In the environmental field, the most frequent evaluations are the following:• environmental impact studies, which evaluate the consequences
of a public or private project on surrounding ecosystems; they have been mandatory, for instance, in the European Union since 198511.
• multi-criteria analyses, which take into account preselected (and possibly weighted) criteria to obtain a solution that optimises the different constraint or priority levels.
• risk-benefit analyses, which compare the targeted benefits with the risks and their estimated likelihood, while indicating avenues for reducing the likelihood of risks at lowest possible cost.
• cost-efficiency analyses, where the conservation objective is already set and the aim of which is to optimise the resources necessary to achieve it12 (which are particularly appropriate after determining a restrictive political objective, such as reducing CO2 emissions below a certain level or increasing renewable energies to a certain share of the energy mix).
• cost-benefit analyses (CBA), which identify the commercial and non-commercial costs and benefits of a project by developing at least two scenarios; one with the project and the other without. Since an MCPA is considered beneficial for the local population due to the ecosystem services it preserves, but also often receives opposition from the same population due to the constraints that it creates, it is this method that was selected for this study. The comparison of the pros and cons for different categories of stakeholders sheds light on the debate between stakeholders on the relevance of a project and its anticipated effects among other factors as specified above.
Within this specific analysis framework, the MCPA is considered as a management tool representing an investment for which the legitimacy must be evaluated ex ante through an estimation of the share of ecosystem services tied to its existence by relying on simple modelling in this case. The populations implicated in the creation
11 Council Directive 85/337/EEC of 27 June 1985 on the assessment of the effects of certain public and private projects on the environment.12 Naidoo et al., 2004.
of an MCPA often consider it to have a negative impact on their activities because of the use restrictions that may be imposed or the financial burden which these structures represent. It is therefore important to compare these costs with the benefits that it brings, by evaluating the difference in value of the ecosystem services influenced by the MCPA with and without protection.
The conservation effect of MCPAs is considered to be three-fold: it acts on ecosystems, thus influencing the availability of the ecosystem services produced; but also on the range of authorised activities and the distribution of access rights that influence the distribution of benefits within the population, and finally on the number of visitors to the site and its notoriety along with nearby areas that influence the economic dynamic (the level of activity) of the area of influence.
APPLICATION OF THE COST BENEFIT ANALYSISCost-benefit analysis (CBA) is a tool that is often used in documents that deal with MCPAs evaluation13. It takes into account the commercial and non-commercial benefits and costs associated with MCPAs by developing alternative scenarios for the potential futures of the areas in question. Therefore in this study, in addition to a business-as-usual scenario based on a retrospective trend analysis and including actual projects, two other scenarios were developed; one built on the hypothesis of increasing protection and the other on decreasing protection. These two scenarios are deliberately very contrasting in order to widely encompass the field of possibilities using observations from the past on the dynamic of the areas being examined. .
Definition and comparison of prospective scenariosFor each study site, Plan Bleu committed a local consultant who is an expert in marine or coastal environmental economy to carry out the case studies and collect the relevant data available in existing literature and data bases. Each expert also interviewed local stakeholders who have good knowledge of the issues, particularly MCPA managers, local elected officials, administrative personnel and the various users of the MCPA (fishermen, tourism operators, etc.). Depending on the framework of the study which they were given, the experts first established an overview of the situation and then carried out a CBA or at least a prospective and differential analysis of the benefits from ecosystem services generated within MCPAs.
The aim of the overview phase is to characterise the interactions between the MCPAs and territories where they are located. An analysis of the ecological and socio-economic characteristics of the direct reciprocal region of influence similar to the analysis carried out by the RAC/SPA for El Kala National Park in Algeria14 helped identify the driving forces and conflicts of local development and the retrospective trends observed in an attempt to gain further
13 Pascal, 2011; Hockley & Razafindralambo, 2006; DEA 2005.14 Bouazouni, 2004.

ECONOMIC STUDY OF THE IMPACTS OF MARINE AND COASTAL PROTECTED AREAS IN THE MEDITERRANEAN
understanding of the recent context. Contextual variables such as local economic and demographic growth were used to support the development of scenarios by observing past trends. It should be noted that the prospectives proposed only implicitly integrate changes resulting from events such as the Arab Spring or the global economic crisis, based on the opinion of the stakeholders consulted, as the consequences are extremely unpredictable. The prospective scenarios are proposed for information purposes and not to establish forecasts.
The timeline for the scenarios is set for 10 to 20 years, depending on data availability and the degree of uncertainty deemed acceptable, in order to take into account the different phasing of benefits and costs over time. Agents’ preference for the present (meaning they value immediate benefits more than long-term benefits) is taken into account by discounting costs and benefits using a rate considered close to the interest rate at national level in the countries concerned15.The future benefits and costs are therefore discounted in order to be comparable with present benefits and costs.
The CBA framework generally proposes the calculation of three additional indicators: The net present value (NPV), the benefit-cost
15 In the case studies, it is assumed that the discount rate is equal to the average of the national interest rates observed during the retrospective period. This position is relatively standard and corresponds to the assumption that at general equilibrium, the discount rate equals the interest rate. In the perspective of carrying out work that focuses more on the environmental risk associated with degradation, it would be wise to explore other alternatives including changing rates.
ratio (BCR) and the internal return rate (IRR). The net present value (NPV) is equal to the aggregated value of the discounted benefits minus that of the costs: a positive NPV insinuates that the benefits are greater than the costs and consequently, the scenario is socially profitable for the entire period in question for the scenarios.
The benefit cost ratio (BCR) is the indicator that is used to classify the scenarios according to the benefits generated per cost unit16. It is calculated by dividing the discounted value of benefits by the discounted value of costs. It is an indicator of return.
Finally, the internal rate of return (IRR) is used to calculate the discount rate for which the NPV is zero, taking into account the timing of net profits. This is the first choice indicator of backers who is worried about profitability, but also about the availability of his capital to be invested elsewhere.
For this study, and according to the application condition attached to the various indicators17, the NPV was selected as the only relevant indicator because it best meets the expectation of a virtual public policymaker who is responsible for the general economic interest over the long term. The BCR and IRR indicators were found to be inappropriate in the context of this study, which aimed to compare scenarios for changes to the MCPAs after they have been set up, excluding the initial costs which, in some cases, had already been incurred in the past.
16 Brent, 1998.17 Pearce et al. 2006.
Business-as-usual scenario Increasing-protection scenario Decreasing-protection scenario
ARTISANAL FISHING
Kur
iat
Isla
nds
Tuni
sia
Average annual variation of 4% over the period 1999-2009. Rising benefits of 3% per year until 2020 because of the economic crisis. Then slow down with an increase of 2% per year due to environmental degradation resulting from non compliance of fishing behavior.
Rising benefits of 3% per year until 2020 and then accelerated with 4% per year since the fisheries shall more abundant and accessible.
Rising benefits of 4% per year until 2020 because fishing rules are removed. Then slow down to 2% per year due to the degradation of fish stocks and ecosystems rarifient resources.
PN
CC
S
pain
Catches linked to local population growth and benefits derived from the average local price assumed to be stable over the period.
Catches linked to local population growth and considering also an an increase in fishing efficiency of 3% per year.
Increase in catches of 4% per year until 2014, then decline to environmental degradation, accompanied by the release of some fishermen (-10% of catches per year until 2021, then -5% per year until 2024, and -3% per year until 2028 and stagnation).
Kas
Kek
ova
Turk
ey
Number of fishermen, catch volumes and revenues remain stable, at the same level as 2011 (no retrospective data).
Fishing management plan: gradual 30% decline in catches between 2012 and 2020. After 2012, 10% increase in catches and 3 additional fishermen each year up to a limit of 52 fishermen.
1% increase in catches per year for the first 10 years, followed by a 4% decrease per year and 1 fisherman stopping his activities each year.
Table 1. Hypotheses for the prospective quantitative analysis of the Kuriat Islands, Cap de Creus, and Kas Kekova sites

PLAN BLEU PAPERS N° 13 12 I 13
Business-as-usual scenario Increasing-protection scenario Decreasing-protection scenario
TOURISM
Kur
iat
Isla
nds
Tuni
sia
Trend increase in benefits of 4% per year (same as the retrospective period 2000-2010).
Rising benefits of 5% per year until 2020 and 6% per year due to the attractiveness of an ecotourism and more lucrative.
Rising benefits of 6% per year until 2020 due to the development of mass tourism with few spendings/capita. Then slow down to 3% profit per year due to environmental degradation resulting from over frequentation.
PN
CC
S
pain
Tourist numbers indexed to economic growth, expenditure per person and indirect benefits remain stable.
Same as scenario 1 with greater increase in tourist numbers from 2017 (doubled growth rate), following completion of the Punta de Cap de Creus development, improvements to the Cap de Creus strict nature reserve, and the adoption of the Sustainable Tourism Charter in 2017. As visitors are more respectful of the environment, increased numbers are still within carrying capacity.
Same as scenario 1 until 2020, then tourist numbers stagnate due to environmental degradation.
Kas
Kek
ova
Turk
ey
Benefit rise linked to economic growth. Gradual increase in tourist numbers, reaching a maximum carrying capacity of 250,000 visitors in 2030. Expenditure per person rises from 115 TRY to 175 TRY per day, due to improved site quality.
5% increase in tourist numbers per year. Expenditure per person falls from 115 TRY to 100 TRY per day and the length of stay falls from 5 to 3 nights, due to landscape degradation.
DIVING
Kur
iat
Isla
nds
Tuni
sia
Trend increase in benefits by 3% per year. Based on the perception of diving club working in the area.
Increase in benefits by 3% per year until 2020 and then accelerating to 5% per year due to the better attractiveness of the site because of its environmental quality.
Increase in benefits by 5% per year until 2020 due to high attendance and the cessation of menses and decrease of -1% per year due to environmental degradation.
PN
CC
S
pain
Commercial diving indexed to economic growth and non-commercial diving indexed to population. Organic waste benefits are detrimental to diving and are subtracted from this benefit.
Same as scenario 1 until 2013, then growth is 1.5 times that of scenario 1. (installation of an anchoring buoy that can receive 40 divers at a time, being studied at the PNCC).
Same as scenario 1 until 2020, then 5% decline in the number of divers per year due to environmental degradation.
Kas
Kek
ova
Turk
ey
Increase in diving indexed to tourist demand. Average price of €32 per dive (obtained from the clubs) remains stable.
More gradual increase in diving, reaching the carrying capacity of 120,000 dives per year in 2030. Increase in diving unit price from €32 to €45.
Permission to open an additional diving club, number of dives increases by 10% per year until 2020 before gradually declining to the estimated carrying capacity (120,000 dives) in 2030.
CO2 SEQUESTRATION
Kur
iat
Isla
nds
Tuni
sia
Stability of surfaces covered by Posidonia meadows and Maërl 's beds until 2020 then decreased by 1% per year due to deterioration due to non-compliant fishing behavior.
Stability of surfaces covered by Posidonia meadows and Maërl 's beds until 2020 then increase by 1% per year due to the improvement of environmental quality.
Lower surfaces covered by Posidonia meadows and Maërl 's beds 1% per year until 2020, then 3% per year, due to the acceleration of environmental degradation (weakened ecosystem).
PN
CC
S
pain
Surface area occupied by different ecosystems remains stable. Price per tonne of CO2 remains stable at the mean value from 2008 to 2010.
1% increase in forest cover and 2% increase in Posidonia cover per year. Price per tonne of CO2 remains stable at the mean value from 2008 to 2010.
2% decrease in forest cover and 1% decrease in Posidonia cover per year. Price per tonne of CO2 remains stable at the mean value from 2008 to 2010.
Kas
Kek
ova
Turk
ey
(No data for the marine area.) Surface area retains its 2010 level. Price per tonne of CO2 remains stable (mean value from 2008 to 2011).
(No data for the marine area.) Surface area occupied by ecosystems increases by 2% per year. Price per tonne of CO2 remains stable (mean value from 2008 to 2011).
(No data for the marine area.) Price per tonne of CO2 remains stable (mean value from 2008 to 2011). Surface area occupied by forest and scrubland ecosystems decreases by 1% per year.
Source: Plan Bleu

ECONOMIC STUDY OF THE IMPACTS OF MARINE AND COASTAL PROTECTED AREAS IN THE MEDITERRANEAN
Methods for estimating costs and benefitsThe benefits taken into account in the CBA concern the revenues or contribution to well-being provided by several ecosystem services generated within MCPAs: food production, evaluated by the benefits received by commercial and non-commercial fishermen – for mainly recreational purposes, the supply of tourism amenities and support for recreational activities through benefits made in diving and recreational boating activities, as well as a collective benefit by way of climate regulation through anthropogenic CO
2 sequestration.
The benefits linked with fishing are evaluated according to the volume of catches, the average market price of the fish and the method of activity. The added value created was selected as the indicator of the value of the contribution of the ecosystems, which are considered here as a production factor. When information was not available, the emphasis was placed on the benefits to the end user by using the sales turnover as a value indicator. For tourism and recreational activities, the approach that was used examines the spending of users, calculated according to the number of users or vistitors and average spending. The benefits associated with CO
2 sequestration were evaluated based on the average capacity of terrestrial and marine ecosystems to sequester CO2 according to the surface that they cover within the MCPA and the value per tonne of CO2 on the European quota exchange market.
In order to take into account the indirect benefits from ecosystem services within MCPAs for the fishing and tourism industries, for some case studies it was proposed that national accounting input-output tables be used and to apply a propagation coefficient for benefits from ecosystem services provided in the MCPAs.
Due to the lack of data concerning local treatment costs, absorption capacity of MCPAs and volumes and level of treatment of discharged wastewater, the benefits associated with wastewater absorption were not covered in the economic evaluation.
Two courses of reflection were nevertheless developed in the Spanish and Turkish case studies. The first consists in evaluating the treatment cost avoided through direct discharging and deducting this potential benefit from from benefits linked to diving activities as it is considered as one of the activities directly vulnerable to the direct discharging of wastewater. The second method seeks more to evaluate the maximum volume of wastewater an MCPA is able to absorb beyond which the benefits can no longer be supported. The volumes discharged without treatment beyond this threshold are valued according to the unit cost of treatment and considered as costs deducted from the aggregation of benefits taken in account.
The operating costs of MCPAs are easily identifiable and pertain to expenses for surveillance and environmental education, as well as the operating costs of the organisation that manages the MCPA. These expenses are evaluated according to the costs of equipment and required personnel, at local prices. For some study sites, the costs borne by partner organisations are also taken into account,
such as in Cap de Creus, where the body of rural agents is in charge of surveillance activities, or at Zakynthos, where the WWF funds a loggerhead sea turtle conservation campaign.
The costs related to use restrictions caused by MCPAs are reflected by commercial benefits that are generally lower in the short term in the increasing-protection scenario.
Identifying the stakeholders that bear the costs or benefit from the ecosystem services associated with MCPAs in the CBA is essential and is based on the qualitative analysis carried out in each case study.
CHARACTERISTICS OF THE MCPAS STUDIEDThe MCPAs studied are members of the MedPAN network, a network of Mediterranean MPA managers, except the Mount Chenoua-Kouali Coves protection project, which is still being created. Two of them, the Sensitive Coastal Area (SCA) of the Kuriat Islands and the Cap de Creus Natural Park (PNCC) also have SPAMI status (Specially Protected Areas of Mediterranean Importance), recognised by the SPA/BD protocol under the Barcelona Convention (Specially Protected Areas and Biological Diversity in the Mediterranean protocol).
Despite these characteristics for contributing to the protection of a Mediterranean common good and their regional recognition, as mentioned in the introduction, the diversity of the sites in question is obvious in terms of surface area, financial and human resources or history as a protected area, as well as the reasons why they were created. Therefore the varied panel of case studies proposed in this report is meant to illustrate an extremely diverse reality and does not aim to draw performance comparisons.
Thus the MCPA created in Zakynthos meets the need to protect a specific species with relatively low resources (approximately € 1,000 annually per km²) while the Mount Chenoua – Kouali Coves and Kuriat Islands sites anticipate environmental pressures resulting from increasing coastal development that can affect the ecosystems and services which they support. As for the MCPAs of Cap de Creus and Kas Kekova, they are more centred on sustaining booming tourism and environmental awareness.
SALIENT FEATURES OF THE CASE STUDIESDespite the diversity of the sites studied, some common salient features can be identified from the analyses carried out.
The MCPAs studied are located in dynamic territories with population socio-economic, wealth and education indicators that are generally above national averages. These territories are particularly attractive in terms of demographics compared to national growth rates. They attest to the coastal development affecting the entire Mediterranean Basin to varying degrees, even though the MCPA itself is characterised by indicators that are frequently below the regional average, which is not surprising considering that these sites have historically been isolated from development.

PLAN BLEU PAPERS N° 13 14 I 15
Another distinctive element is the presence of key species in the study sites. Posidonia seagrass meadows, used as marine biodiversity indicators in the Mediterranean18, are present on all the sites. Loggerhead turtles (Caretta Caretta) and Mediterranean monk seals (Monachus Monachus), which are on pointed by the IUCN red list and the list of endangered or threatened species of the Protocol Concerning Specially Protected Areas and Biological Diversity in the Mediterranean (SPA/BD Protocol, Appendix II), can be found in Zakynthos, as well as the Kuriat Islands and in Kas Kekova (the last sighting of a monk seal in Cap de Creus dates back to 1973). These species were frequently mentioned by managers in the 2012 Status of MPAs study led by MedPAN.
The main threats to the ecosystems to take into account include over-crowded beaches and the gradual anthropization of natural habitats of the land portion of MCPAs. The use of unauthorised fishing techniques is particularly harmful to marine ecosystems along with the discharging of liquid and solid waste that pollute land and marine environments.
Among the ecosystem services that depend on protected ecosystems, the supply of recreational amenities and support,
18 Plan Bleu, followed by the MSSD.
Sites Date created Main purposeSurface
area (km²)
Marine surface area
(km²)Population
GDP per person in 2010 (€)
MCPA management budget (€)
Social acceptance/acceptatbility of the
MCPA
Kur
iat
Isla
nds
(Tun
isia
) SCA created in 1995, plans for MCPA status
Preserve natural habitats and protect Caretta caretta turtles from disturbance and degradation
3 NA0 inhabitants but military occupation
NA 8,945
Low recognition. Negative for Monastir fishermen whose practices are restricted.
Cap
de
Cre
us
(Spa
in)
PNCC created in 1998
Preserve natural habitats from coastline urbanisation
139 31 approx. 33,000 27,919 1,509,410
Efficiency is recognised although the process behind the creation of the area is contested.
Kas
Kek
ova
(Tur
key)
SEPA created in 1990
Protect archaeological heritage and biodiversity
258 166 approx. 4,500 12,705 132,970
MCPA little notoriety, particularly the management organisation. Seen as restrictive for real estate expanding.
Zak
ynth
os
(Gre
ece)
NMPZ created in 1999
Protect Caretta Caretta turtles and natural habitats from coastline urbanisation and intense tourism activities
104 87
approx. 7,000
(double during the summer period)
25,536* 400,000
Mitigated recognition, tending towards improvement but still seen as hindering growth.
Mon
t C
heno
ua
(Alg
eria
)
Plans for MCPA status
Protect biodiversity from increased visitor numbers
20 NA approx. 36,000 NA NA
Proposition to implement a collaborative management mechanism to reduce resistance and define a suitable MCPA.
* Data only available for 2008; CAGR: Compound Annual Growth Rate; NA: data unavailableSource: Plan Bleu
Table 2. Characteristics of the MCPAs studied
which carries over to tourism, diving and recreational boating activities, is the service that generates the most substantial accounted benefits. These activities generate between 80% and over 90% of the benefits from ecosystem services taken into account, and even regardless of the prospective scenario adopted in the Cap de Creus and Kas Kekova sites. These results correspond with the observations made by the FGEF on the coral reefs of Saint Lucia19, where 95% of the benefits from ecosystem services resulted from tourism. On the Zakynthos site, taking into account benefits associated with the real estate sector, construction and retail somewhat modify this observation; however, real estate and construction also depend partially on the supply of amenities and aggregating all the benefits associated with this service gives a result ranging between 77 and 79% of the benefits accounted for. Due to the relative importance of commercial fishing around the Kuriat Islands, where tourism establishments are not located on the islands themselves, depending on the scenarios, tourism still accounts for 34 to 36% of the benefits taken into account. Because the Algerian site of Mount Chenoua – Kouali Coves is an
19 Clement et al., 2010.

ECONOMIC STUDY OF THE IMPACTS OF MARINE AND COASTAL PROTECTED AREAS IN THE MEDITERRANEAN
important location for the propagation of commercial fish species, it is possible that production services also have a greater influence.
Regulation services, taken into account in this study with CO2 storage, are not significantly affected by the different scenarios. The rates of change, whether positive or negative, for CO2 sequestration per surface unit covered by the various types of ecosystems are deliberately low due to a lack of available knowledge concerning the sites. Furthermore the CO2 absorption capacity of marine ecosystems involves a chemical pumping mechanism that depends little on the ecological state of ecosystems, which is much more significant than the biological mechanism taken into account.
The creation of an MCPA and the use restrictions put in place can be the cause of conflicts of interest that, for instance, affect the equilibrium between fishing and tourism. The assumptions developed by local experts show a reserve effect made possible by the delimitation of a no-take zone that allows fish stocks to regenerate over the medium or long term. However, this can result in a stagnation or even decrease in volumes caught in the short term due to fishing restrictions, as well as a sanctuary effect that affects catches in authorised areas. This effect creates hostility with fishermen in numerous cases where MCPAs are created, such as at Mount Chenoua – Kouali Coves. In addition, complying with a carrying capacity requiring that the number of visitors to an MCPA be limited can result in lost revenues for the tourism industry in the short term that can be compensated by extended stays and an increase in individual spending. Introducing mechanisms which compensate the changed distribution of benefits due to the establishment of an MCPA as well as dialoguing with the various stakeholders (tourism operators, fishing cooperatives, etc.) are avenues to be explored to resolve such conflicts. This observation should be tempered within the scope of the case studies carried out due to the multiple activities observed in the MCPAs studied (particularly in Zakynthos, the Kuriat Islands and Kas Kekova), where fishermen often take on the additional activity of tourism operators during the high season.
Furthermore, the low impact that the existence of an MCPA has on tourist numbers is a characteristic that applies for each study site as visitors are generally more attracted by the quality of landscapes and fauna (notably as seen with the development of turtle watching in Zakynthos) than the desire to discover an MCPA of which they are generally unaware. This is particularly striking on the Kuriat Islands, where a large majority of tourists are local or national, or in the case of Catalan or Spanish tourists visiting the Cap de Creus Natural Park. For the case studies and according to the observations made, it is more the notoriety of sites that attracts visitors to the MCPA rather than the MCPA that increases the notoriety of sites and thus the number of tourists and the dynamism of the region. There is generally a lack of awareness of MCPAs, their role and the stakeholders involved in protection. In Kas Kekova, WWF Turkey is believed to be the organisation that manages the MCPA. However in reality, a national general directorate (General Directorate for Natural Assets Protection -GNDAP) is responsible for it. The GDNAP is not
physically represented locally, while WWF Turkey is active in the field, which results in a lack of proximity with local development for the MCPA manager. Increasing the efficiency of managing organisations’ communication strategies as well as compatible environmental protection strategies are therefore avenues that should be explored to optimise their impact on tourism and simultaneously improve the image of MCPAs in the eyes of the locals. It appears that this trend is currently being followed at Cap de Creus Natural Park. The work of the managing organisation of an MCPA is therefore twofold: improving its proximity with the locals while promoting its image to attract tourists that are often from abroad. It should be noted that the foreign tourist segment is particularly large in Zakynthos and Kas Kekova.
Residents generally have a mixed perception of MCPAs. Despite the recognition of their utility, such as in the case of the Cap de Creus Natural Park, these instruments are often disputed in their assessments or in their operation. The residents of Kas Kekova thus consider that the ecological changes on the site have little to do with the MCPA. More involvement and dialogue with local stakeholders, effective participation in the management process and improved awareness and proximity of managing organisations are all avenues to be explored for future or existing MCPAs.
This also raises the question of environmental awareness, which is really only developed in the case of the Cap de Creus Natural Park, by a partner of the Park, and in the Zakynthos National Marine Park, particularly with the Sea Turtle Center. Work to inform the public of the benefits of an MCPA is essential in that those associated with conservation, which means an absence of change or a very gradual improvement of the natural environment, are long-term benefits that are less tangible than investments such as the creation of marinas or large hotel establishments where there are almost immediate repercussions on the economy, and environmental impacts are less obvious and often not taken into account.
The results of the three CBAs carried out contradict the perception of MCPAs as obstacles to development and show that, although the protection of marine and coastal ecosystems modified the redistribution of benefits within the area of influence, the effect is positive overall: the NPV of the increasing-protection scenarios is higher than that of the business-as-usual scenarios or decreasing-protection scenarios for the three study sites, which indicates that the protection of these sites generates more benefits than costs for 2030.
CONTRIBUTION AND LIMITS OF THE STUDYexploratory study concerns the concerted application of the CBA approach to several Mediterranean MCPAs, which yields certain insights into the limits, benefits and potential areas for improvement.
Applying the CBA to Mediterranean MCPAs leaves a substantial amount of room for uncertainty. In addition to the uncertainty inherent in any prospective exercise, exacerbated by the recent events that have deeply changed the Mediterranean context

PLAN BLEU PAPERS N° 13 16 I 17
(particularly the global economic crisis and the Arab Spring) the experts responsible for the case studies underline among other things, the lack of data (especially at the local level), and the difficulty in accessing existing data. The extrapolations that had to be made in order to develop the prospective scenarios call for caution, even though the main objective is not to predict a realistic view of the future of the study sites but present several voluntarily contrasting options. For the Mount Chenoua site, where the evaluation was carried out ex ante since the MCPA is still at the project stage, and the Zakynthos site, which is greatly affected by the economic crisis, it is particularly difficult to imagine the changes to protection and development policies and the quantitative hypotheses considered were deemed too fragile to be used and developed.
The evaluations carried out for all the study sites indicate differing changes for the various sectors of activity examined, depending on the scenarios. For instance, the increasing-protection scenario tends to be more favourable for fishing rather than tourism. The CBAs that were carried out provide a better idea of the distribution of
Tunisia - Kuriat Islands Spain - Cap de Creus Turkey - Kas Kekova
Busi
ness
as
usua
l sc
enar
io (
S1)
Incr
easi
ng
prot
ectio
n sc
enar
io
(S2)
Dec
reas
ing
prot
ectio
n sc
enar
io
(S3)
Busi
ness
as
usua
l sc
enar
io (
S1)
Incr
easi
ng
prot
ectio
n sc
enar
io
(S2)
Dec
reas
ing
prot
ectio
n sc
enar
io
(S3)
Busi
ness
as
usua
l sc
enar
io (
S1)
Incr
easi
ng
prot
ectio
n sc
enar
io
(S2)
Dec
reas
ing
prot
ectio
n sc
enar
io
(S3)
Pres
ent
valu
e of
ben
efits Commercial fishing 30,915 32,312 29,953 6,785 6,547 5,406 763 665 996
Recreational fishing 2,334 503 2,614 7,584 8,338 7,259 NA NA NA
Tourism 14,020 15,519 15,182 2,989,260 3,477,665 2,755,540 773,195 963,317 533,769
Scuba diving 440 460 446 27,387 30,050 24,180 7,291 10,416 10,409
Boat day trip NA NA NA NA NA NA 30,058 36,953 28,455
CO2 sequestration 2,809 2,913 2,600 11,878 11,977 11,739 92,004 108,009 85,421
Total 50,517 51,707 50,794 3,042,893 3,534,576 2,804,126 902,548 1,118,696 658,055
Pren
sent
val
ue o
f cos
ts Administartion budget 164 283 27 26,316 64,675 22,699 3,870 4,191 2,381
Surveillance expenses 0 193 0 2, 074 1,171 1,597 NA NA NA
Environmental education expenses
0 249 0 NA NA NA NA NA NA
Expenses of a partner (NGO, …)
NA NA NA NA NA NA 1,860 4,138 368
Total 164 726 27 28,391 65,846 24,296 5,730 8,329 2,749
Net Present Value 50,353 50,981 50 767 3,014,502 3,468,730 2,779,830 896,818 1,110,367 655,306
Rate of change from S1 to S2 1.2% 15.1% 23.8%
Rate of change from S1 to S3 0.8% -7.8% -26.9%
NA = not availableSource: Plan Bleu
benefits between the various ecosystem services and economic activities taken into account. However, due to the lack of data at the local level, the indirect effects linked to MCPAs could not be taken into account more precisely, nor was it
possible to estimate the distribution of benefits within the population - which would be an essential basis for considering potential compensatory measures in the event of significant disparities. Additional studies examining the equity of the effects of MCPAs in relation to the living strategies of residents or users of ecosystem services would be an interesting approach.
The definition of the components of the benefits and costs taken into account varies depending on the point of view adopted (e.g.: residents, public policymakers, lending institutions, overall well-being, etc.) because benefits for some can represent costs for others. This potential bias particularly proves the interest in creating greater dialogue with local stakeholders in order to forge a shared vision of the role of the MCPA and its integration in the local development dynamic.
Table 3. Present value of benefits and costs for the Spanish, Tunisian and Turkish sites (in thousands €)

ECONOMIC STUDY OF THE IMPACTS OF MARINE AND COASTAL PROTECTED AREAS IN THE MEDITERRANEAN
The decision to discount the costs and benefits associated with the protection of services provided by ecosystems is important: the relevance of discounting as well as the choice of rate have been written about extensively . Discounting results obviously has consequences on the results of the scenarios. For instance, a decreasing-protection scenario that includes rapid development of mass tourism and the neglect of MCPA conservation requirements (such as in the decreasing-protection scenario for the Kuriat Islands) can expect significant benefits and low costs in the short term, while there are fewer long-term benefits than in an increasing-protection scenario. Without going into the details of ethical considerations on the relative importance of the needs of present and future generations, and in consistency with the decision to consider the utility functions of rational agents that have a preference for the present, the discount rates selected were based on the average of national interest rates observed over the retrospective period (2000-2010), i.e. 4% for Cap de Creus and Kas Kekova, and 5% for the Kuriat Islands. This position is relatively standard and the discount rates applied are similar to rates generally recommended for investment projects in these countries. Within the framework of a study focussed on the risk associated with environmental degradation, it would have been wise to adopt another position, for instance considering changing discount rates that are more reflective of uncertainty and the growing utility of benefits provided by ecosystems.
The results obtained for the CBAs that were carried out in a uniform manner for the different types of benefits (whether for the Kuriat Islands, Cap de Creus and Kas-Kekova sites)show outcomes that generally favour increased protection since the NPV in the three cases is greater for the increasing-protection scenarios. The calculation of the two other indicators of decision support that are the BCR and IRR have proved inadequate and unenforceable against the elements taken into account in the study and the adopted point of view.
The lack of relevance of the BCR and IRR indicators in the studies conducted and the subjective nature of the point of view for identifying the costs and benefits also show that the results of quantitative evaluation of the benefits provided by ecosystems should be handled with caution, and the hypotheses and limits by which they are characterised must be provided. These evaluations must also fit within a qualitative framework in order to better demonstrate the complexity of the determining and underlying relationships and trends for the given situation.
In conclusion, it must be remembered that biodiversity protection is also and above all based on the one hand on biological knowledge and on the other hand on cultural and moral arguments. In particular, the presence of remarkable examples of biodiversity (such as loggerhead turtles or Mediterranean monk seals) on the sites studied justifies their protection beyond any economic evaluation on ordinary biodiversity. The economic evaluation of the effects of MCPAs on local development is an additional argument in favour of environmental protection aimed at sustainable development and the sustainable use of natural resources
REFERENCESAlban, F. Appéré, G & Boncoeur, J., 2006. Economic Analysis of Marine
Protected Areas. A Literature Review. EMPAFISH Project, Booklet no. 3. 51 pp
Arrow, K.J., W.R. Cline, K.-G. Maler, M. Munasinghe, R. Squitieri & J.E. Stiglitz, 1996, Intertemporal Equity, Discounting, and Economic Efficiency, in Bruce J.P.,H. Lee & E.F. Haites (Eds), Climate Change 1995 - Economic and Social Dimensions of Climate Change, Cambridge University Press, UK, 125-144
Badalamenti et al. (2000), “Cultural and socio-economic impacts of Mediterranean marine protected areas”, Environmental Conservation no. 27
Becker, N. & Y. Choresh. 2006. Economic Aspects of Marine Protected Areas (MPAs). Ed:UNEP-MAP RAC\SPA.Tunis.
Bouazouni, O. Parc national d’El Kala: Etude socio-économique du PNEK (El Kala National Park: Socio-Economic Study of the PNEK), UNEPMAP RAC-SPA, 2004
Brent, R.J. (1998): “Estimating the Effectiveness and Benefits of Alcohol Treatment Programs for Use in Economic Evaluations.” Applied Economics, 30: 217-226.
Chakour, SandDahou, T, “Gouverner une AMP, une affaire publique ? Exemples Sud-Méditerranéens” (Governing an MPA, a public affair? Southern Mediterranean examples), VertigO - Online environmental sciences magazine [Online], Special Issue 6 | November 2009
Calas, J Evaluation économique et calcul du taux de rentabilité interne des projets d’AMP (Economic evaluation and calculation of the internal return rate of MPA projects), 2010
Chevassus-au-Louis, B., J.M. Salles, J-M. and J.-L. Pujol (dirs). (2009). An economic approach to biodiversity and ecosystems services, Contribution to public decision-making. Paris: Strategic Analysis Centre, Reports and Documents (April).
Clement, T., Gabrie, C., Mercier, J.R. & You, H. 2010. Aires Marines Protégées - Capitalisation des expériences cofinancées par le FGEF Partie 2 – Rapport 8 - Evaluation économique et calcul du taux de rentabilité interne des projets d’AMP (Marine Protected Areas - Capitalisation of experiments co-financed by the FGEF Part 2 -Report 8 - Economic evaluation and calculation of the internal return rate of MPA projects)
Costanza et al. (1997). “The value of the world’s ecosystem services and natural capital.” http://www.uvm.edu/giee/publications/Nature_Paper.pdfNature 387 (6630): 253–260.
DEA Research Discussion Paper, Namibia’s protected areas: Their economic worth and the feasibility of their financing Jane Turpie, Glenn-Marie Lange, Rowan Martin, Richard Davies and Jon Barnes, 2005
Devillé, H. 2010, Economie et Politiques de l’Environnement, Principe de précaution, Critères de soutenabilité, Politiques environnementales, (Environmental Economy and Policy, Principle for Precaution, Sustainability Criteria, Environmental Policies) L’Harmattan
Fisher, A.C. & J.V. Krutilla, 1975, Resource Conservation, “Environmental Preservation, and the Rate of Discount”, Quarterly Journal of Economics, August,358-370
Hanley, N. & Spash, C. 1993 Cost-Benefits Analysis and the Environment, Edward Elgar Publishing,
Hannesson, R. (1993). Bioeconomic Analysis of Fisheries. Fishing News Books, Oxford.

PLAN BLEU PAPERS N° 13 18 I 19
Hardin, G. 1968,“The tragedy of the commons”. Science 162, 1243–1248.
Harremoes (2001). Late lessons from early warnings: the precautionary principle, 1896–2000, European Environment Agency
Hockley, N. J & Razafindralambo, R. 2006. A Social Cost-Benefit Analysis of Conserving the Ranomafana-Andringitra-Pic d’Ivohibe Corridor in Madagascar
Kokkali A (2010), Assessment of the tourism activity of the National Park of Zakynthos and its contribution to the spatial planning of the protected area
Mangos, A., Bassino, J-P., Sauzade, D. (2010). The economic value of sustainable benefits rendered by the Mediterranean marine ecosystems. Plan Bleu, Valbonne. (Blue Plan Papers 8).
MedPAN, 2012, Status of Marine Protected Areas in the Mediterranean Sea
Millennium Ecosystem Assessment, (2005). Ecosystems and Human Well-being: General Synthesis, Island Press, Washington, DC.
Naidoo R., A. Balmford, P.J. Ferraro, S. Polasky, T.H. Ricketts and M. Rouget 2006. Integrating economic costs into conservation planning. Trends in Ecology and Evolution 21, 681-687.
National Research Council. Valuing Ecosystem Services: Toward Better Environmental Decision-Making. Washington, DC: The National Academies Press, 2004.
Pascal, N. 2011.Cost-Benefit Analysis of community-based Marine Protected Areas: 5 case studies in Vanuatu, South Pacific. 107pp. Component 3A, Socio‐economic and coral reef ecosystems. CRISP Research reports. CRIOBE (EPHE/CNRS), Insular Research Center And Environment Observatory, Moorea, French Polynesia
Pearce, D. et al. (2006) – Cost Benefit Analysis and the Environment (Paris, OECD)
Philibert, C (2003) Discounting the future, International Energy Agency, Energy and Environment Division
TEEB (2010), The Economics of Ecosystems and Biodiversity: Ecological and Economic Foundations. Edited by Pushpam Kumar. Earthscan, London and Washington

ECONOMIC STUDY OF THE IMPACTS OF MARINE AND COASTAL PROTECTED AREAS IN THE MEDITERRANEAN
THE KURIAT ISLANDS biodiversity refuge at the heart of Monastir coast
This summary is based on the study report “Etude des impacts socioéconomiques d’aires marines Protégées méditerranéennes : le cas des îles Kuriat” (“Evaluing socio-economic impacts of Mediterranean Marine Protected Areas: the case of the Kuriat Islands”) by Mr Mounir Balloumi.
The Kuriat Islands are two small uninhabited islands (270 and 50 ha) though, the biggest is occupied by a military base. They are two kilometres away from each other, roughly sixteen kilometres off the North-eastern cape of Monastir, in Tunisia. This is one of the most dynamic regions in the country and has an extremely high urbanisation rate at nearly 100%. The rich ecological characteristics of the Kuriat Islands earned them the status of sensitive coastal
area (Zone Sensible Littoral - ZSL) and they are one of the areas currently being considered to be placed under the new Marine and Coastal Protected Area (MCPA) status.
The qualitative study of the interactions between the Kuriat Islands and the Monastir governorate presented here is followed by a quantitative analysis of the impacts of protecting the Kuriat Islands on local development using prospective scenarios.
INTEGRATION OF THE KURIAT ISLANDS PROTECTION IN THE SURROUNDING MOTIONThis section aims to better understand how the protection of Kuriat islands fits into the local development in order to give a solid basis for elaborating scenarios.
Monastir: a centre for local development The governorate of Monastir is a coastal region located in the centre east of Tunisia and has a surface area of 1,024 km², i.e. 0.6% of the country. To the south, it shares a border with the Governorate of Mahdia and to the north and west, with the governorate of Sousse. The coast of Monastir stretches over 64 km from the Hamdoun river to Bekalt.
A dynamic economy …Like other coastal regions, the governorate of Monastir shows higher socio-economic indicator than the rest of the country. In 2010, there were 515,300 people living in the governorate, i.e. 4.9% of the national population. The population density is 505 people per km² (and even reaches 707 people per km² for the coastal area), compared to 67 people per km² on average for Tunisia. The natural population growth rate of 2% in 2010 is also above the national growth rate of 1.05%, and is notably due to migration from the interior regions to the coast20. Life expectancy is 77 years, compared to 74.5 on a national level and the number of people living below the poverty line is less than 3% (whereas the national
20 Positive migratory balances of 6,539 and 16,877 respectively were recorded in two population censuses in 1994 and 2004 (INS, 2004).
Figure 2. Administrative map of Tunisia
Source: tunisieindustrie.nat.tn

PLAN BLEU PAPERS N° 13 20 I 21
average is 3.75%). The unemployment rate in the governorate of Monastir is 12% compared to 14% at the national level21.
The region is characterised by a dynamic economy mainly driven by industrial and tourism activities. The real average annual growth rate observed over the 2000-2010 period was in the region of 6%22. Monastir represents 12% of the industrial fabric of Tunisia and 12% of the country’s tourism capacity is concentrated in the governorate, which represented an added value of €198 million in 201023. The same year, agricultural activities generated an added value of €118 million, i.e. 5% of national production, 12% of which coming from seafood products24. In 2008, industry employed 51.6% of the working population, mainly in the textile industry, 42.8% were employed in the service sector (mainly oriented toward tourism) and 5.6% in agriculture (mainly market gardening and olive products)25.
The economy of the governorate of Monastir is divided into two zones: the interior zone, with an economy based mainly on industry and agriculture (notably ranked first nationally for greenhouse agriculture), and the coastal zone of Monastir, centred more on tourism and fishing. The 5 coastal delegations have a fishing port: Monastir, Bekalta, Tebolba, Ksibet El Mediouni, and Sayada-Lamta-Bouhjar. As a traditional activity and part of the region’s identity, fishing generates nearly €30 million in sales each year and employs approximately 3,800 people with a fleet of around a thousand fishing boats. The fleet has increased by 25% since 2000 despite the stagnation of fish catches at roughly 16,000 tonnes per year.
21 Central Bank of Tunisia, 2010.22 CGDR, 2010.23 Monetary values expressed in € are converted from their equivalent in dinars, according to the exchange rate issued by the Central Bank of Tunisia on 31/12/2010 (1 TND = EUR 0.533021). 24 CRDA Monastir, 2010.25 API, 2011.
Figure 3. Population concentration in the governorate of Monastir
Source: CGDR Monastir, 2010
Although there are about a hundred recreational fishermen, most of whom practice spear fishing, fishing is mainly professional and approximately 70% of fishermen fish at least 1.2 tonnes of fish around the Kuriat Islands each year. Tourism, based mainly on seaside and seasonal business, is also very important in the coastal area and generates 9,000 direct jobs for the entire governorate.
… that affects the environmentThis economic dynamism induces environmental externalities. The governorate of Monastir has intense urbanisation, with a rate that is close to 100%26, while the national rate is 65.7%. Facing this intense soil conversion, the uninhabited Kuriat Islands - although the large Kuriat is occupied by military servicemen - have specific ecological characteristics that are in contrast with the rest of the region and are arguments in favour of their conservation.
The altitude of the Kuriat Islands does not exceed 5 m. Their surface geology includes mainly sandy materials, beaches, dunes, sebkhas and chotts27, and tidal marshes. The shores are sandy and rocky. Some wetlands are located along the eastern and southern sides of the larger island and take up more than a third of its surface area but only cover two hectares of the smaller island.
The different species of terrestrial and marine fauna and flora identified are highly rare and vulnerable. The land biodiversity is characterised by a wide variety of halophytic, psammophilous and lignous vegetation, numerous avifauna species such as the Sardinian warbler (Sylvia melanocephala), the brambling (Fringilla montifringilla) and the Slender-billed Gull28 (Chroicocephalus genei), and migratory birds for which the Kuriat Islands are a nesting area and important migratory stopover point. .
The marine biodiversity is characterised by the habitats such as Posidonia seagrass meadows and maerl beds, and the presence of notable species such as the noble pen shell (Pinna nobilis), and the loggerhead turtle (Caretta caretta). The latter is classified as an endangered species by the IUCN and listed in Appendix II of the Protocol Concerning Specially Protected Areas and Biological Diversity in the Mediterranean29.
The presence of the loggerhead turtle is one of the major reasons for protecting the Kuriat Islands as they are one of the main nesting sites in the Mediterranean. Moreover, with a high foliar density of nearly 700 bundles per m², Posidonia meadows are areas that provide spawning, feeding and breeding grounds for numerous species of fish and contribute to the stability of sediments30, while maerl beds located at depths between 0.5 and 3 metres on rocky sea beds contribute to climate stability through CO2 capture31. Furthermore the beautiful scenery offered on the Kuriat islands and vulnerability of these ecosystems to coastal development and
26 Dahou et al., 2011.27 Salt lakes formed under the combined effect of sudden torrential rain and rapid runoff in arid landscapes.28 APAL/SCET-TUNISIE, 1999; Aguir, 2009.29 Appendix II of the Protocol Concerning Specially Protected Areas and Biological Diversity, making the list of endangered or threatened species in the Mediterranean.30 Mangos et al., 2010.31 Peres and Picard, 1964.

ECONOMIC STUDY OF THE IMPACTS OF MARINE AND COASTAL PROTECTED AREAS IN THE MEDITERRANEAN
uses carried help reinforce the need for protection of these islands to maintain both ecosystem services and biodiversity.
The land and marine ecosystems of the Kuriat Islands are currently in a very healthy state. The main threats that could alter this are commercial fishing, which uses intensive practices such as trawling that destroy Posidonia meadows and cause the accidental capture of loggerhead turtles. To a lesser degree, recreational fishing, which is a secondary source of income for roughly thirty regular fishermen, also contributes to decreased fish stocks. Mass tourism and nautical activities which help drive the region’s economy, also present an environmental pressure, particularly for marine turtle nesting.
Loggerhead sea turtle on the beach of the large Kuriat
… calling for suitable managementThe institutional framework for sustainable coastal management in Tunisia began in 1992 with the adoption of a coastal charter. The creation of the Agence de Protection et d’Aménagement du Littoral (APAL - Coastal Protection and Planning Agency) in 1995 is the follow-up to the countries’ commitments during the Rio Summit in 1992. Particular emphasis is placed on the marine environment as illustrated in Chapter 17 of the United Nations Agenda 21 and Agenda MED 21 for the Mediterranean (1994) dealing with the protection of oceans and all enclosed and semi-enclosed seas and coastal areas calling for the protection and rational use of their biological resources.
The APAL is the active body for Tunisian government policies in the area of coastal protection and planning, protection of the public maritime domain against encroachment and illicit activities. The APAL approves all development and equipment projects on the coast before they are carried out32.
32 Act 95-72, JORT, 1995.
The Kuriat Islands, natural capital in needs of preservationDespite its low local implantation, the decision-making level and the environmental protection section being located in Tunis, the APAL office in Tunis is responsible for the conservation of the islands Kuriat, and can affect the level of protection of the area in the extent of its resources. Although the ecological situation on the islands is not in a critical stage, the APAL is concerned by the weak measures taken until now regarding the increasing threats.
An attractive area that is poorly protected …Some regulations are already in place with the current status of the Kuriat Islands, however the lack of surveillance (except military presence on the largest island, which is not dedicated to the application of environmental regulation but still contributes to this end) and effective enforcement as well as the allure of the area contribute to pressures that weigh on the islands.
The Kuriat Islands attract approximately 50,000 visitors each year including all recreational uses (recreational fishing, diving, boat tours of the islands, etc.) 85% of these visitors are concentrated in the summer months (largely exceeding the authorised limit of 200 visitors per day), and concern especially the smaller Kuriat island since the larger is under military surveillance. This seasonality causes over-crowding of beaches and solid waste litter that is potentially dangerous for the local fauna.
Trawler, dragnet or Danish seine fishing are prohibited within depths of less than 50 m around the Kuriat Islands due to their impact on marine biodiversity and particularly Posidonia seagrasse meadows and loggerhead turtles. However without any surveillance or direct management of uses on the islands, these activities are often carried out, even at depths of ten metres.
According to the APAL, the lack of effectiveness in protecting the Kuriat Islands is both a material and legal problem. Firstly, management of the Kuriat Islands would require the creation of a reception centre on the islands to facilitate ecological monitoring, and for surveillance uses and provide information to the public. An engineer and two rangers (fishing and forestry advanced technicians) would also need to be hired to implement management objectives. Secondly, legislation in force does not specify the methods for the conservation of the site.
Conservation policy remains very centralised, without any real appropriation at the local level. There is very little cooperation between the central office of APAL, its local representatives, and local authorities. An illustration of this situation is the recent evaluation study of the MCPA project conducted which have been carried by the central office of the APAL with no involvement of local representatives.
… heading towards an increasing protection project Loggerhead turtles and Posidonia seagrass meadows receive special attention on the Kuriat Islands. Currently, the APAL and the

PLAN BLEU PAPERS N° 13
Figure 4. Proposed zoning for the MCPA
Source: Langar et al., 2011
22 I 23
INSTM– in charge of the ecological monitoring – are implementing protection measures that consist in delimiting the perimeter concerned by marine turtle nesting, prohibiting access within the perimeter, marking turtle nesting areas with information signs and reinforcing the protection of nests during summer season, being the laying season and at the same time the most frequented period of the year.
The intention of enlarging the protected area and reinforcing the level of protection of the site dates back to 2000, which gave rise to a management plan that was never implemented. The zoning proposed by the management plan at this time included all the Kuriat islands with a marine area of 3,946 hectares and favours the tourism sector to the detriment of fishing. A study realised in 2011 as prior to the definition of a new management plan for the upcoming MCPA33 proposes the definition of three areas: • a transition area visited by holiday-makers, where recreational
activities other than fishing and spearfishing would be authorised with a speed limit of 3 knots,
• a buffer area, where boating would be authorised with the same speed limit, no anchoring and compliance with organised ecological mooring areas, and
• a total protection area (1,280 ha) where all activities would be prohibited, with the exception of research and surveillance.
In order to limit the anthropogenic pressures on the Kuriat Islands, the MCPA management plan sets out to reduce the number of visitors, made up mostly of locals and nationals (according to local tourism operators, only 10% of visitors come from abroad) to 36,000 annually, and to prohibit additional development.
The aim of this MCPA project is to establish efficient protection of the Kuriat Islands while ensuring sustainable use of its natural resources and ecosystem services. The acceptability of the protection by the population of the governorate of Monastir depends on the balance of costs and benefits considered as linked to the MCPA. The following quantitative analysis, based on prospective scenarios, helps evaluating to what extent an increased in protection through the creation of an MCPA will affect local development.
WHAT IS THE OUTLOOK FOR PROTECTION OF THE KURIAT ISLANDS? L’objectif de cette partie est d'évaluer les bénéfices nets générés par trois scénarios de protection des îles Kuriat : un scénario tendanciel, un scénario de renforcement de la protection matérialisé par la création d’une AMCP, et un scénario d’abandon de la protection.
Compte tenu de la complexité du sujet, des contraintes de réalisation de l’étude, de la disponibilité des données et du degré d’incertitude, l’évaluation présentée ne vise pas l’exhaustivité. Elle est basée sur la prise en compte de cinq services écologiques majeurs, fournis par les écosystèmes caractéristiques des îles Kuriat et utilisés par la population locale par le biais de la pêche professionnelle, la pêche récréative, le tourisme, la plongée sous-marine, et la séquestration du dioxyde de carbone.
33 Langar et al. (2011).
10,988494 11,022115 11,055736
10,988494 11,022115 11,055736
35
,456192
35
,781360
35
,806528
35
,456192
35
,781360
35
,806528
0 1
Nautical miles
Barrier-Reef
Barrier-reef according to APAM-SPA/RAC(2010)
Core area = Protection zone
Transition area = Multi-use area
Buffer zone = Damping zone
Possible futures for the protection of the Kuriat IslandsThree prospective scenarios are developed for the timeline 2010-203034. They are based on various contextual variables available at the national or local level. The assumptions concerning economic growth, population trends, implementation of existing regulations and business-as-usual changes to local activities define a common socio-economic context, integrating diffusely uncertainties associated with the Arab Spring and global economic crisis.
With Tunisia’s policy for investment in interior regions, the natural population growth rate in the governorate of Monastir could slow and reach 1.7% during the first sub-period of 2011–2020 and 1.2% during the second sub-period of 2021–2030 following reduced migratory flow.
By using the average annual growth rate for the retrospective period of 2000–2010, which was approximately 4.5%, the assumed growth rate is 4% for the 2011-2020 period and 5% for the 2021-2030 period. The local GDP is also assumed to change in proportion to the national GDP, at a stable share of about 7%.
Firstly assumptions driving each scenario are presented first, in a second time the quantitative results are discussed.
The business-as-usual scenario In this scenario, the Kuriat Islands remain with the status of a sensitive protected area and the budget allocated for protection changes in line with average inflation over the retrospective period.
34 Given the date of completion of the study, when data for 2010 and 2011 were available, they were incorporated into the assessment.

ECONOMIC STUDY OF THE IMPACTS OF MARINE AND COASTAL PROTECTED AREAS IN THE MEDITERRANEAN
Due to the population growth of the governorate of Monastir, it is assumed that the level and use conditions of the various ecosystem services provided by the islands will continue until 2020 before a degradation phase from 2021 to 2030, which leads to a drop in some benefits due to unsustainable use level.
For fishing, the increased competition between fishermen who will seek to increase their income without thinking about the negative impacts of their fishing techniques on biodiversity and ecosystems, while catches stagnate until 2020, then drop annually by 1% until 2030. Despite this decline, the price of fish will remain stable as the drop in catch level will be compensated by aquaculture products.
The number of recreational fishermen increases according to the Monastir governorate population growth rate, with stable benefits until 2020, then an annual loss of 1% from 2021.
Figure 5. Evolution of benefits and costs from 2010 to 2030 - Scenario 1 (in thousands of €)
Benefits evolution
CO2 sequestration
Diving
Tourism
Recreational fishing
Commerical fishing
7,000
5,000
4,000
3,000
2,000
1,000
0
2010
2012
2014
2016
2018
2020
2022
2024
2026
2028
2030
6,000
Costs evolution
2010
2012
2014
2016
2018
2020
2022
2024
2026
2028
2030
0
40
100
140
160
180
20
60
80
120
Administration budget
Surveillance expenses= 0
Environmental educationexpenses = 0
Source: Plan Bleu,, based on case study’s data
It is assumed that the number of visitors to the Kuriat Islands increases by 4% per year for the entire period, and that growth for activities associated with diving continues to increase by 3% per year.
Growth in nautical recreational activities during the summer season means an increase in the number of tourism and pleasure boats that dock and anchor. This, together with the use of prohibited fishing techniques will harm the environment and in particular destroy Posidonia seagrass meadows and maerl beds, whose surface area would remain stable until 2020 and then diminish at a rate of 1% per year. This loss will affect the Carbone sequestration capacity of the area.
The increasing-protection scenario MCPA In this scenario, the sensitive coastal area of Kuriat Island would become a MCPA. The creation of an MCPA, governed by Tunisian Act 2009-49, according to the zoning plan proposed by Langar et al. (2011), would aim at increasing protection of species of heritage value through operational surveillance to limit anthropogenic impacts.
The creation of an MCPA following the proposed zoning would lead to the banning of certain activities such as spear fishing, sport fishing and the collection of invertebrates. In order to avoid overcrowding, only fishing and tourism boats already operating on the Kuriat Islands would be authorised.
In the scenario 2, the number of visitors is yet supposed to increase, more than in the business-as-usual scenario however environmental impacts would be lower due to behaviour improvement (resulting from information, environmental education, surveillance...).
Recreational activities are expected to increase by 5% per year until 2020, and by 6% per year since 2021. The creation of the AMCP also imply an increase in diving activities equivalent to the business as usual scenario of 3% per year by 2020 and 5% per year after 2021, because of the attractive increased level of protection.
This scenario includes substantial investments in terms of reception structure and signage on the Kuriat Islands and on the coast.
It is assumed that the surface covered by Posidonia seagrass meadows and maerl beds would remain stable until 2020, and improve by 1% per year starting from 2021, hence the increase in CO2 storage capacity.
The protection of certain areas of the islands is often seen in theory as negative for fishing as it results in the banning of catching in these areas. However, a recent study35 estimated that the increase in number and size of fish in the protected areas benefits surrounding areas (“spill-over effect”). We thus assume that fishing production remains stable until 2020, then increases by 1% per year from 2021, in proportion to fish stocks. The benefits increase by 3% per year during an initial sub-period, then by 4% per year from 2021.
35 Maresca et al., 2008.
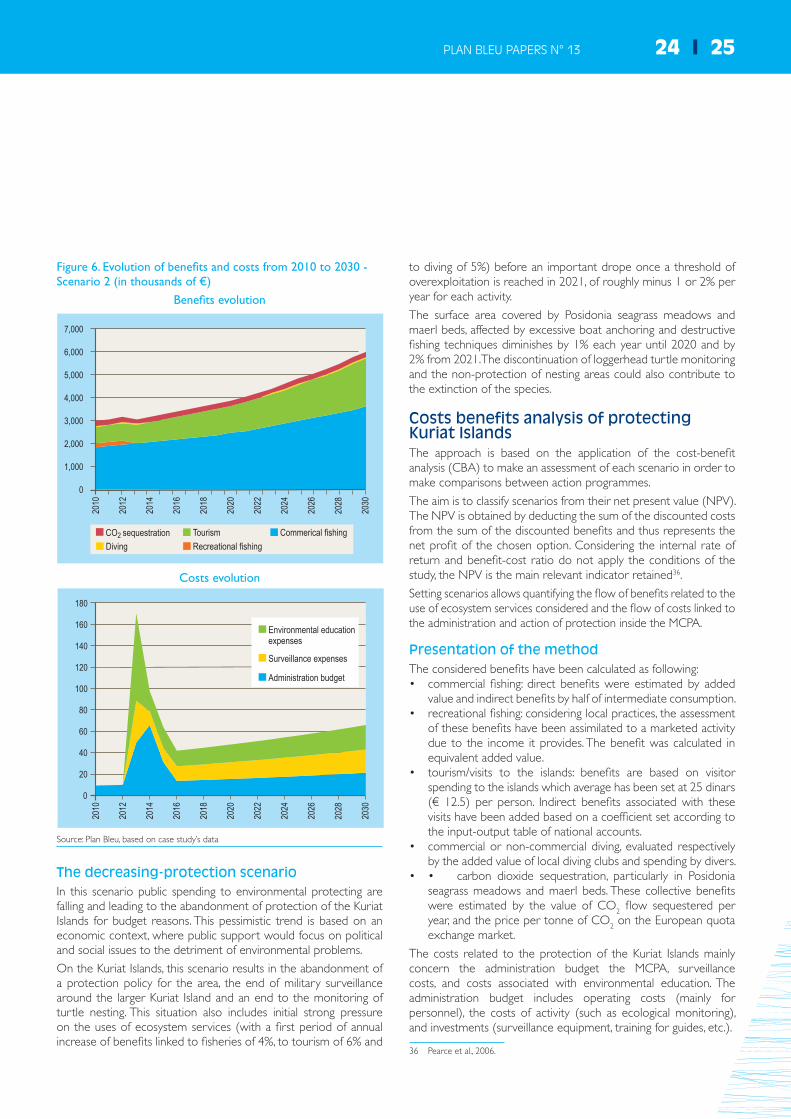
PLAN BLEU PAPERS N° 13 24 I 25
Figure 6. Evolution of benefits and costs from 2010 to 2030 - Scenario 2 (in thousands of €)
Benefits evolution
7,000
5,000
4,000
3,000
2,000
1,000
0
2010
2012
2014
2016
2018
2020
2022
2024
2026
2028
2030
6,000
CO2 sequestration
Diving
Tourism
Recreational fishing
Commerical fishing
Costs evolution
2010
2012
2014
2016
2018
2020
2022
2024
2026
2028
2030
0
20
40
60
80
100
140
180
160
120Administration budget
Surveillance expenses
Environmental educationexpenses
Source: Plan Bleu, based on case study’s data
The decreasing-protection scenarioIn this scenario public spending to environmental protecting are falling and leading to the abandonment of protection of the Kuriat Islands for budget reasons. This pessimistic trend is based on an economic context, where public support would focus on political and social issues to the detriment of environmental problems.
On the Kuriat Islands, this scenario results in the abandonment of a protection policy for the area, the end of military surveillance around the larger Kuriat Island and an end to the monitoring of turtle nesting. This situation also includes initial strong pressure on the uses of ecosystem services (with a first period of annual increase of benefits linked to fisheries of 4%, to tourism of 6% and
to diving of 5%) before an important drope once a threshold of overexploitation is reached in 2021, of roughly minus 1 or 2% per year for each activity.
The surface area covered by Posidonia seagrass meadows and maerl beds, affected by excessive boat anchoring and destructive fishing techniques diminishes by 1% each year until 2020 and by 2% from 2021. The discontinuation of loggerhead turtle monitoring and the non-protection of nesting areas could also contribute to the extinction of the species.
Costs benefits analysis of protecting Kuriat IslandsThe approach is based on the application of the cost-benefit analysis (CBA) to make an assessment of each scenario in order to make comparisons between action programmes.
The aim is to classify scenarios from their net present value (NPV). The NPV is obtained by deducting the sum of the discounted costs from the sum of the discounted benefits and thus represents the net profit of the chosen option. Considering the internal rate of return and benefit-cost ratio do not apply the conditions of the study, the NPV is the main relevant indicator retained36.
Setting scenarios allows quantifying the flow of benefits related to the use of ecosystem services considered and the flow of costs linked to the administration and action of protection inside the MCPA.
Presentation of the method The considered benefits have been calculated as following:• commercial fishing: direct benefits were estimated by added
value and indirect benefits by half of intermediate consumption.• recreational fishing: considering local practices, the assessment
of these benefits have been assimilated to a marketed activity due to the income it provides. The benefit was calculated in equivalent added value.
• tourism/visits to the islands: benefits are based on visitor spending to the islands which average has been set at 25 dinars (€ 12.5) per person. Indirect benefits associated with these visits have been added based on a coefficient set according to the input-output table of national accounts.
• commercial or non-commercial diving, evaluated respectively by the added value of local diving clubs and spending by divers.
• • carbon dioxide sequestration, particularly in Posidonia seagrass meadows and maerl beds. These collective benefits were estimated by the value of CO2 flow sequestered per year, and the price per tonne of CO2 on the European quota exchange market.
The costs related to the protection of the Kuriat Islands mainly concern the administration budget the MCPA, surveillance costs, and costs associated with environmental education. The administration budget includes operating costs (mainly for personnel), the costs of activity (such as ecological monitoring), and investments (surveillance equipment, training for guides, etc.).
36 Pearce et al., 2006.

ECONOMIC STUDY OF THE IMPACTS OF MARINE AND COASTAL PROTECTED AREAS IN THE MEDITERRANEAN
Présentation des résultats The main indicator for the comparison between the scenarios is the NPV. The discount rate used has been set at 5%, in consistence with national interest rates observed during the retrospective reference.
According to the criterion of NPV, the study shows that it would be better to opt for the MCPA project which would increase the protection of the Kuriat Islands (scenario 2), although costs would be higher, the present value of net profits in 2030 would be nearly up to 51 million €.
The NPV of Scenario 2 represents a gain of 1.2% compared to the NPV of Scenario 1. This small difference resulting from assumptions is also consistent with the insular nature of the study site which
Figure 7. Evolution of benefits and costs from 2010 to 2030 - Scenario 3 (in thousands of €)
Benefits evolution
6,000
4,000
2,000
0
2010
2012
2014
2016
2018
2020
2022
2024
2026
2028
2030
7,000
5,000
3,000
1,000
CO2 sequestration
Diving
Tourism
Recreational fishing
Commerical fishing
Costs evolution
2010
2012
2014
2016
2018
2020
2022
2024
2026
2028
2030
0
10
2
4
6
8
12
14
16
20
Administration budget
Surveillanceexpenses = 0
Environmental educationexpenses = 0
Source: Plan Bleu, based on case study’s data
confers de facto protection as any use of services rendered by ecosystems induces a substantial access cost. Thus the level of protection influences more uses externalities than the volume of usage which allows sustainable uses and maintenance of the level of benefits over time.
Table 4. Present value of benefits and costs from 2010 to 2030 (in thousands of €)
Scenario 1 Scenario 2 Scenario 3
Bene
fits
pres
ent
vlau
e
Commercial fishing 30,915 32,312 29,953Recreational fishing 2,334 503 2,614Tourism 14,020 15,519 15,182Scuba diving 440 460 446CO2 sequestration 2,809 2 913 2,600
Total 50,517 51,707 50,794
Cos
ts p
rese
nt v
alue Budget de
fonctionnement 164 283 27
Dépenses de surveillance 0 193 0
Dépenses d’éducation à l’environnement 0 249 0
Total 164 726 27
Net present value 50,353 50,981 50,767
Rate of change from S1 to S2 1.2 %
Rate of change from S1 to S3 0.8 %
Source: Plan Bleu, based on case study’s data
By 2030, the decreasing protection scenario (scenario 3) shows a better NPV than Scenario 1 trend (0.8% higher) because, in addition to the previously mentioned island effect, the scenario 3 induces the end of protection expenditure. In contrast, the comparative evolution of benefits shows that in 2030 - and since 2023 - the flows of benefits would be greater in the business as usual scenario (or scenario 1) than in the decreasing protection scenario (or scenario 3). This shows that protection is a complex choice in an uncertain environment and for which the timeline horizon represents a major question.
In further detail, in all three scenarios, the main benefit is generated by commercial fishing, followed by tourism. Distribution of benefits varies slightly depending on the scenario, except for recreational fishing which is banned in scenario 2 after 2012. Strengthening the protection of environment has a double impact on commercial fishing: on the one hand it involves limitations of activity, but on the other hand it can also benefit fishermen by positive effect on fish stocks currently over-fished37.
The positive effect of protection for fishing is supposed to happen if the protected area houses a significant minimum biomass level and that the behaviour of the species enables spillover effects38. However, fish stocks and ecological thresholds are difficult to
37 Clark, 1996; Lauck et al., 1998; Sumaila, 1998.38 Anderson, 2002.

PLAN BLEU PAPERS N° 13 26 I 27
assess while the mobility of species between the protected areas and the open areas is often poorly documented. The question of the benefits of MCPA for fishing is often reduced to questioning the questioning of the link between changes in catches and level of fishing effort in authorized area39.
The share of the present value of benefits from the provision of amenities (recreational fishing, tourism and diving) is between 32 and 36% depending on the scenario. People benefiting from this ecosystem service are visitors to the islands, mostly living in the coastal area.
39 Hannesson, 1998.
For non-extractive uses (tourism, diving and carbon sequestration), the creation of the MCPA would generate direct positive impacts, due to the improvement of environmental quality valued by visitors and divers40. Although the opposition between extractive and non-extractive uses should not be regarded as absolute; too many visitors would adversely affect the marine environment, especially if their activity does not comply with use regulation (no picking, no waste etc.) and properly controlled41.
Abandoning protection - Scenario 3 - would first benefit recreational fishermen and visitors to the islands. However, in the long term, environmental degradation would negatively affect fish stocks, biodiversity and landscapes.
40 Alcala, 1988; Rudd et Tupper, 2002.41 Davis et al., 1995.
Figure 8. Compared evolution of benefits and costs from 2010 to 2030 (in thousands of €)
Compared evolution of benefits
Scenario 3Scenario 2Scenario 1
4,000
2,000
0
2010
2012
2014
2016
2018
2020
2022
2024
2026
2028
2030
7,000
6,000
3,000
1,000
5,000
Compared evolution of costs
Scenario 3Scenario 2Scenario 1
80
40
0
2010
2012
2014
2016
2018
2020
2022
2024
2026
2028
2030
180
140
60
20
100
160
120
Source: Plan Bleu, based on case study’s data
Figure 9. Present value of benefits linked to extractive uses (in thousands of €)
20
10
0
35
15
5
25
30
Commercial fishing Recreational fishing
Scenario 3
Scenario 2
Scenario 1
Source: Plan Bleu
Figure 10. Present value of benefits linked to non extractive uses (in thousand of €)
12
8
0
18
10
4
14
16
Tourism Diving
Scenario 3
Scenario 2
Scenario 1
6
2
CO2 sequestration
Source: Plan Bleu, based on case study’s data

ECONOMIC STUDY OF THE IMPACTS OF MARINE AND COASTAL PROTECTED AREAS IN THE MEDITERRANEAN
Regarding costs, Scenario 2 would call a financing three times higher than in Scenario 1. In this budget administration costs of the MCPA would cover almost 40% of costs, followed by expenses for environmental education (almost 34%) and expenses surveillance (27%). This cost increase is justified by the fact than the creation of a MCPA would call for the implementation of a management plan with objectives and appropriate means to achieve them, including ecological monitoring, surveillance purposes and environmental public awareness.
In scenario 1, the costs are only represented by administrative costs of the sensitive coastal area (or ZSL status) and the ecological monitoring carried out by the Tunisian Maritime Institute (INSTM), while for scenario 3, costs would be zero starting from 2013 following the end of the ZSL status.
It is necessary to remember that this study is an exploratory study that applies to a small part of the potential benefits and costs associated with a MCPA. Moreover, this study relies on a set of estimations and assumptions helping overpassing the complexity of the subject, the lack of data and the limited resources.
CONCLUSIONThis exploratory study provides an initial economic assessment of some benefits related to ecosystem services delivered by the Kuriat islands. These figures help to highlight the significance of environmental protection regarding better provision of ecosystem services and people well-being.
Kuriat islands are uninhabited areas that stand out by the presence of a sensitive biodiversity that is still unspoiled in the heart of a socioeconomically dynamic area that is the governorate of Monastir. Their rich biodiversity and the ecosystem services they provide directly impact the well-being of local people. The uses of ecosystem services are marked by the dominance of commercial fishing and tourism.
The cost-benefit analysis carried out is based on three contrasted scenarios on a timeline 2010-2030. It shows that benefits derived from an increase in protection by creating a MCPA would be better than a decrease in protection or the maintenance of the current level of protection (being a sensitive coastal area or ZSL status). Indeed, in the increasing protection scenario the net present value would be the highest up to nearly € 51 million.
To overcome the important lack of data, including especially quantitative data, the study also relies on qualitative data collection (from interviews, observations...). Estimates, transfers and assumptions that were made are described in the full study report.
The difficulty in carrying out this study due to the lack of information highlights the need to better understand the ecological mechanisms, but also socio-economic issues underpinning the relationship between the context, the MCPA, ecosystem services and people well-being. Further studies on these elements would be useful both in natural sciences and social sciences.

PLAN BLEU PAPERS N° 13 28 I 29
CAP DE CREUSthe longest natural coastline of the Costa Brava
This summary is based on the study report “Etude des impacts du Parc naturel de Cap de Creus sur le développement du territoire” (Evaluating the impact of the Cap de Creus Natural Park on local development) written by consultant Laura Martinez Rubio.
The Cap de Creus peninsula is the easternmost point of the Iberian Peninsula and the last spur of the Pyrenees on the Mediterranean side. Created in 1998, the Natural park of de Cap de Creus (NNPCC), was Catalonia’s first terrestrial and marine natural park. It is located in the district of Alt Empordà, in the north-east of the province of Girona. It covers 10% of the district’s surface area and includes eight municipalities, four of which are on the coast (Roses, Cadaqués, El Port de la Selva and Llançà) and four of which are inland (Vilajuïga, Palau-savardera, Pau and La Selva de Mar). In 2010, the park had a population of 32,930.
Figure 11. Alt Empordà district, province of Girona, autonomous community of Catalonia, Spain
Source: Wikipédia
The NPCC is at the heart of an area where tourism is on of the most dynamic activity facing traditional activities, and the diversity of its habitats is strongly associated with the local orographic and climatic conditions of Alt Empordà. The combination of an alluvial plain, a coastline and mountainous areas over a relatively small surface area (13,854 hectares, of which 20% are coastal waters),
provides this region with rich biodiversity (320 species counted, including 200 species of birds and 75% of all mammalian species found in Catalonia).
Quantification of the costs and benefits associated with this Marine and Coastal Protected Area (MCPA), based on a retrospective analysis of the interactions between the NPCC and the Alt Empordà district, is a useful tool for consultations, in the context of a global economic crisis that is severely affecting Spain and the 2011 classification of the NPCC as a Specially Protected Area of Mediterranean Importance (SPAMI). The NPCC’s development and outlook are considered using three distinct scenarios: a business-as-usual scenario, an increasing-protection scenario, and a decreasing-protection scenario.
INTEGRATION OF THE NPCC INTO THE ALT EMPORDÀ DISTRICT
Tourism and construction: two drivers of the Alt Empordà economy severaly affected by the crisis Despite having half the population density of the rest of Catalonia (103 people per km2 compared with 235 people per km2), Alt Empordà is a demographically attractive area: the population rose by 44% from 1998 (double the Catalan average), reaching over 140,200 by 2010, of which 23% live in the NPCC. However, the district’s 68 municipalities have highly varied demographic trends, with high growth in coastal municipalities and the district capital Figueres, and moderate or even negative growth, in rural areas. The two phenomena that best characterise the district are therefore periurban growth and coastal development.
Alt Empordà’s economic growth is similar to that of Catalonia or of Spain as a whole, with a growth rate of 3 to 5% between 2000 and 2007, with annual per-capita income rising from €14,700 in 2000 to €21,900 in 2008. Following a recession of 4% in 2009 due to the 2008 crisis (compared with 3.7% for Spain as a whole), the Catalan economy stabilised in 2010 and 2011, with growth

ECONOMIC STUDY OF THE IMPACTS OF MARINE AND COASTAL PROTECTED AREAS IN THE MEDITERRANEAN
of between zero and 1%. However, forecasts for 2012 and 2013 predict a probable recession.
The breakdown of Alt Empordà’s GDP is slightly different from that of Catalonia as a whole: industry is much less significant (despite the recent surge in the energy sector, which has seen 3% annual growth), while agriculture and construction are more developed. Construction is the second largest employer after tourism, in particular due to the strong demand for second homes42. The primary sector has recently declined slightly due to the decline in fishing (-17.6%43) and pig farming (-6%), partially compensated by the 10% rise in cereal production. The service sector has remained stable overall, while property and construction have declined by 1.2% and 8.8% respectively, which has led to a 34% reduction in the number of people paying social security contributions in the construction sector (compared with 16% in industry and 5% in the service sector).
Figure 12. Per-sector breakdown of GDP in 2010
Source: Caixa Catalunya, 2011
The employment rate in the NPCC (38%) is notably lower than that of the Alt Empordà district as a whole (43%), which is itself lower than the Catalan average (56%); however, unemployment rates are similar (18%). The tertiary sector is the main employer, representing 67% of employment inside the NPCC, with most jobs being tourism related despite a significant fall in activity leading to an increase in unemployment and job insecurity, with more seasonal or short-term contracts. A lack of qualified jobs in the district (only 9% of the population have had a university education, compared with 13% in the rest of Catalonia), and a youth unemployment rate of more than 20%, is leading to huge migration mainly to neighbouring provinces.
The growing threat of urban development on ecosystemsWith regard to land use, the Alt Empordà district has seen significant anthropization since the 1960s, with urban expansion fuelled by property speculation, mass tourism and the development of a road
42 Nearly two-thirds of properties are second homes. Source: Gabinet d’estudis econòmics S.A.43 This is a long-term trend, as the catch almost halved between 2007 and 2010 (from 6,505,975 kg to 3,419,744 kg). The number of fishermen is also declining.
Catalunya Alt Empordà
Primary sector ServicesConstructionIndustry
0%
10%
20%
30%
40%
50%
60%
70%
80%
network that promotes growth and the extension of industrial and retail zones44. The pace of this anthropization has been maintained over recent years (with 6% of the surface area under development in 2006 compared with 4% in 2002), with notable expansion of industrial zones, whose surface area increased twelve-fold between 1987 and 200245. The coastal zone was particularly affected, notably to the detriment of agricultural land.
The NPCC itself is characterised by a coastline with cliffs, where the most significant marine ecosystems in terms of ecosystem services are Posidonia meadows (105 hectares) and coralligenous areas (268 hectares), which play a major role in carbon sequestration, contribute to oxygenating the water and, in the case of Posidonia, stabilise sediments. The other shallow-water habitats are pre-coralligenous areas, rocky bottoms with photophilic algae, detritic sediments and maerl beds, which also have a role in carbon sequestration. The many caves and an underwater canyon, which is a kilometre deep and located less than two nautical miles from the coast, bear witness to significant ecological richness, in particular harbouring vulnerable species such as white coral.
The terrestrial part of the NPCC is characterised by a large expanse (over 8,600 hectares) of maquis shrubland. Currently, there are 420 hectares of crop and vine cultivation, and 1,000 hectares of grassland, along with small forest clusters of pine, holly oak and cork oak (275 hectares).
In total, over 50,000 hectares in Alt Empordà are protected under one of two Catalan systems, Pla d’espais d’interès natural (PEIN46, plan for areas of natural interest) – a network of nature areas with basic protection – and Espais natural de protecció especial (ENPE, natural areas with special protection), which offer different levels of protection: national parks, areas of national interest, strict nature reserves, partial nature reserves, natural parks and wildlife nature reserves. Each level of protection is defined by a framework document..
Institutional structures in placeThe general development plan for Catalonia (Pla territorial general de Catalunya) specifies the objectives for balanced land-use in the public interest. This plan is worked out via six partial development plans, two of which apply to Alt Empordà: • The partial development plan for the districts of Girona (pla
territorial parcial de les Comarques Gironines), which sets out province-level guidelines to facilitate the production of socio-economic objectives and specifies areas that should promote local integration. It covers the issues of sanitation and waste disposal, transport, telecommunications, hydrology, energy, forestry policy and protection of natural areas.
44 Land development records. Agenda 21 Alt Empordà.45 Land-use map from Centre de Recerca Ecològica i Aplicacions Forestals (CREAF, Catalan ecology research centre).46 The main objectives of PEINs are to produce a network of natural areas that are representative of the richness of the Catalan landscape and the biodiversity of its natural systems, and to establish the measures required for the basic protection of these natural areas.

PLAN BLEU PAPERS N° 13 30 I 31
• The Alt Empordà development guidelines (Pla director territorial de l’Empordà), which aims to protect the landscape as part of the area’s identity, in particular by limiting new second homes, promoting alternative economic activities in the tourist sector and combating property speculation..
Furthermore, the Catalan Act 2/2002 obliges Catalan municipalities to produce a urban development plan (called POUM).
With the NPCC, land-use planning and management must follow the special plan for the protection of the environment and landscape (Pla especial de proteccío del medi natural i del paisatge) which was voted into force in 2006. Its function is to develop the overall objectives of the legal and management structure implemented for Cap de Creus, and to produce a plan governing use and management (Pla rector d’us i gestío, so called PRUG), whose function is to regulate maritime activities such as artisanal and recreational fishing, boating, diving and red coral harvesting.
Implementation of use surveillance in ne NPCCThe main objective of the park’s management is to preserve (or restore where necessary) the NPCC’s terrestrial and marine ecosystems, as well as geological, botanical, wildlife and ecological assets, aspects of cultural interest and the integrity of its landscape. It is also responsible for setting the guidelines and general standards for scheduling, use and management, thereby supervising human activities in the park in a way that ensures compatibility with the conservation objective.
Environmental threats within the NPCCThe first use that could impact the park is tourism, to the extent that visitors to the NPCC – at least 212,000 in 201047 – lead to externalities such as: trampling, noise, inappropriate behaviour (picking, etc..), waste production and an increase in water consumption, etc. Furthermore, high frequentation of the calanques and beaches in the summer can lead to degradation of coastal ecosystems. These phenomena are accentuated by the construction of second homes in the area.
Fishing inside the NPCC is limited to artisanal activities that employ around 12 people (excluding the 145 fishing boats of the coastal municipalities) and recreational fishing, which involves approximately 500 people annually. Fishing also has an impact on around 40 fish species, of which 18 are vulnerable. The catches often involve large, brood-stock fish, hereby limiting the reproduction capacity of species.
The large number of dives, estimated at approximately 70,000 per year, concentrated at certain specific points on the coast, contribute to erosion of the coralligenous areas and destruction of the seabed, in particular due to first-dive experiences and the anchoring of boats. This observation also applies to recreational
47 The main objectives of PEINs are to produce a network of natural areas that are representative of the richness of the Catalan landscape and the biodiversity of its natural systems, and to establish the measures required for the basic protection of these natural areas.
boating. Finally, the illegal harvesting of red coral, practiced by others than the thirteen authorised professionals, is a lucrative activity that threatens this species and habitat of high-commercial-value species.
On the terrestrial part of the NPCC, the high fire risk associated with environmental impacts due to livestock rearing (overgrazing, organic wastes,...) and from hunting (an activity that, since 1993, has affected 650,000 animals) put also pressure on the ecosystems.
NPCC resourcesManagement of the NPCC is provided by a team of nine. Field activities within the park rely on two organisations: The TerraMar Natura i Cultura company for visitor information and environmental education, and the Corps d’Agents Rurals (CAR, local environmental gendarmerie) of the Generalitat de Catalunya (government of Catalonia) to enforce compliance with regulations (prevention, surveillance and sanctioning). However, the CAR does not have sufficient staff numbers for effective surveillance, especially for the marine part of the NPCC.
In the context of an integration-into-work programme, the NPCC also benefits, via Catalonia’s employment plans, from temporary staff from the “La Caixa” Foundation for cleaning beaches or forestry work, and also sometimes receives Catalan government workers in the summer. The monitoring of the park’s natural heritage is performed in collaboration with the universities of Barcelona (UB), Girona (UdG) and Lleida (UdL). The NPCC is also a member of the MedPAN Network of Managers of Marine Protected Areas in the Mediterranean.
The NPCC is overseen by the “Protected Areas” service of the Government of Catalonia’s Department of Agriculture, Livestock, Fishing, Food and Environment, which is its main source of funding. Since 2006, the park management’s activities have represented a cost of approximately €1,867,000 per year. A governing body, bringing together members of government bodies at various levels – municipality, district, province, autonomous region and state –, and a management body in association with the various relevant government bodies, meet once a year. Per-sector meetings allow for a certain level of local stakeholder participation and coordination of actions with such stakeholders, despite the absence of the cooperative body envisaged by the law. Such a body was tried, and then abandoned in favour of per-sector meetings, which were considered more effective.
Le zonage du PNCCBoth the terrestrial and marine parts of the NPCC are divided into three types of zone, which have specific levels of protection. The only activities permitted in the reserva natural integral (RNI, strict nature reserves) of Cap Gros-Cap de Creus and Punta Falconera-Cap Norfeu are scientific activities and those aimed at spreading ecological and cultural values. Access to the island of S’Encalladora requires authorisation from the management body, based on explicitly communicated itineraries.

ECONOMIC STUDY OF THE IMPACTS OF MARINE AND COASTAL PROTECTED AREAS IN THE MEDITERRANEAN
In the three protected zones of national interest (Cap Gros-Cap de Creus, Punta Falconera-Cap Norfeu, and Serra de Rodes), activities that degrade the natural orography of the land are prohibited, as is the building of infrastructure, unless this is compatible with the conservation objectives.
The five special development zones of Cala Monjoi, Cala Joncols, Perafita, Pineda de Guillola and S’Agulla-Es Camell comprise the third terrestrial zone of the NPCC.
In the park as a whole, only traditional agricultural activities are authorised, and a ban on the lighting of fires aims to protect terrestrial ecosystems, in particular forests. Camping outside authorised sites, throwing litter and introducing non-indigenous species are also prohibited; hunting is controlled.
Figure 13. Zoning of the Natural Park of Cap de Creus
Source: PNCC
In the marine part of the NPCC, boating and diving are authorised, while artisanal and recreational fishing are subject to special regulations. Trawling and encircling-net fishing are prohibited, as are fishing competitions and the construction of aquaculture facilities, or any other water facility, except those exclusively designed for fishermen and park services. In the three reserva natural partial (RNP, partial nature reserves) of Farallons (between Brescó and La Punta de Los Tres Frares), Cap de Creus (between the island of Culleró and La Cala Jugadora) and Cap Norfeu, artisanal fishing for
fish and shellfish, recreational surface fishing and nautical activities are authorised, pending specific regulations from the PRUG, but recreational spearfishing is prohibited. In contrast, all nautical activity is prohibited in the S’Encalladora strict nature reserve.
The regulations implemented by the NPCC aim to protect it from the threats present in the area, but the minimal means at its disposal limit its effectiveness. Local stakeholders recognise the merits of the natural park for environmental protection, in particular with regard to large urban development projects and tourism pressures on municipalities. However, the lack of consultation and participation in the process of its creation, which was not subject to any public debate, has been strongly criticised and remain problematic more than ten year after. Conflicts of interests appear, in particular due to the restrictions on fishing activities, which are more severe than those that apply to recreational activities. Local people call for bottom-up involvement of civil society, to complement the top-down flow of information that already exists and is appreciated.
The implementation of a participatory process is seen as a mean to enrich the information link and to help protection decision-making more effective as approved by users - thus reducing surveillance costs.
WHAT IS THE OULOOK FOR THE NPCC?Analysis of past interactions between the NPCC and its surrounding area makes it possible to imagine the future effects of the protection depending on the specific management option followed by the MCPA (business-as-usual, increasing-protection or decreasing-protection), given a common context. The benefits of the services supplied by the park’s ecosystems and the costs associated with management of the MCPA are then taken into account for each MCPA management scenario, to produce a cost-benefit analysis.
Possible futures for the NPCCThe socio-economic context, which is common to the three scenarios, takes into account on the one hand the observations pointed in the retrospective analysis and on the other hand the impact of the economic crisis in the Alt Empordà district. It has been assumed that the population evolves annually by 3.5% (which is the average of the last three years, when one perceives a slight slowdown in the municipalities of NCCP), while GDP is supposed to follow the forecasts OECD until 2014 and then observe a growth improving gradually until 2024 after which growth would stabilizes at a rate of 4%, corresponding to the average over the retrospective period.
In each scenario the benefits taken into account are generated by uses ecological services that are fishing, professional and recreational, tourism, diving and CO2 sequestration. The observed costs are related to the NCCP budget, plus surveillance activities conducted by the CRA inside the PNCC.

PLAN BLEU PAPERS N° 13 32 I 33
Business as usual scenario In the business as usual scenario or scenario 1, tourism evolves corollary to growth. Because of the depressed economic conditions, tourists spending are assumed to be stable as well as indirect revenues.
Catches of artisanal fisheries are related to the local demography, to meet local demand. Although the number of fishermen declines, it is assumed that that the efficiency will increase, because the level of fishing is sustainable and an increase in demand (due to population) can be supported sustainable manner. The number of recreational fishermen is also proportional to the population within the NPCC, with fishing effort and individual spending stable over time.
Meanwhile, on the cost side, we consider that the budgets of the NCCP and of the CAR are dependent to GDP, assuming a link between economic growth / spending / NCCP budget. This relative stability of resources results in maintaining the current level of action and surveillance, the latter being low to very low offshore.
The increasing-protection scenarioScenario 2 is based on some elements of enhancing the protection in the PNCC which have been started but their effectivness remains uncertain. So in 2014, it is assumed that the use of the maritime area would be regulated by the approval of the PRUG: diving, boating, recreational fishing and artisanal mining and coral. In 2015, the Marine Reserve of Cap de Creus Canyon would be created next to the PNCC by the Spanish state. In 2020, the transborder Marine Park, including the NCCP, the marine reserve of Cap de Creus canyon, and the Parc Naturel Marin of the Gulf of Lion would be created. The supervisory authority would require the NCCP to include social actors in its top body and formalize the collaborating body. Dialogue with the NP of Aiguamolls and the protected area of Albera would help create a joint information office.
In this context, benefits associated with tourism develop as in the business-as-usual scenario up to 2017, then the growth rate doubles following completion of the Punta de Cap de Creus infrastructures development, the improvements to the Cap de Creus strict nature reserve, and the park management’s adoption of the Sustainable Tourism Charter in that year. As the visitors are more respectful of the environment and the infrastructure more adapted, the increased numbers of visitors are still within the carrying capacity.
Meanwhile, as in scenario 1, one can observe a gradual reduction in the number of artisanal fishermen But this reduction is accompanied by an increase in catch efficiency of 3% per year, made possible thanks to stock recovery and limited access for resource exploitation, following especially the creation of the marine reserve of Cap de Creus Canyon in 2015 and the transboundary Marine Park in 2020. This increasing protection its environmental effects would also attracts recreational fishermen. There would be compliance with restrictions on catch per person and fishing techniques due to understanding of the shared issues, communication from the MCPA, and surveillance. Consequently,
Figure 14. Evolution of benefits and costs - Scenario 1 (in thousands of €)
Benefits evolution
500,000
400,000
300,000
200,000
100,000
0
2010
2012
2014
2016
2018
2020
2022
2024
2026
2028
2030
CO2 sequestration
Diving
Tourism
Recreational fishing
Commerical fishing
Costs evolution
2010
2012
2014
2016
2018
2020
2022
2024
2026
2028
2030
0
2,000
4,000
6,000
8,000
10,000
14,000
12,000
Administration budget
Surveillance expenses
Source: Plan Bleu, based on case study’s data
total catch would rise less quickly than the number of recreational fishermen.
From 2013, approval of the PRUG management plan leads to the installation of 40 anchoring buoys that can receive 40 divers at a time, leading to an increase in the numbers of commercial and non-commercial dives (at a rate 1.5 times greater than under the business-as-usual scenario) without exceeding carrying capacity as there is compliance with the usage regulations (such as no first-dive experiences in certain areas and no harvesting).
An increase in forest cover of 1% per year and of Posidonia cover of 2% per year, due to effective preservation actions, provides an increase in carbon sequestration capacity.

ECONOMIC STUDY OF THE IMPACTS OF MARINE AND COASTAL PROTECTED AREAS IN THE MEDITERRANEAN
As in scenario 1, the NPCC’s budget increases in proportion to GDP, and it also benefits from EU aid for protecting the park (accounting for 10% of its budget up to 2020 and 7% up to 2030). An increase in the CAR’s budget is also assumed, leading to better surveillance, especially for the marine part. In 2020, the park’s management also takes over some responsibility for surveillance, with terrestrial and maritime team, on the ground daily, the year round.
Decreasing-protection scenarioThe third scenario assumes a decreasing protection due to the declining budget of the NPCC and of the CAR. The benefits
Figure 15. Evolution of benefits and costs - Scenario 2 (in thousands of €)
Benefits evolution
500,000
400,000
300,000
200,000
100,000
0
2010
2012
2014
2016
2018
2020
2022
2024
2026
2028
2030
CO2 sequestration
Diving
Tourism
Recreational fishing
Commerical fishing
Costs evolution
2010
2012
2014
2016
2018
2020
2022
2024
2026
2028
2030
0
2,000
4,000
6,000
8,000
10,000
14,000
12,000
Administration budget
Surveillance expenses
Source: Plan Bleu, based on case study’s data
associated with tourism would increase as for the business-as-usual scenario until 2020, but the degradation of the environment associated with poor surveillance, lax regulations and insufficient work within the park, would led to the slowdown of visitors after that date.
With regard to artisanal fishing, it is assumed that from 2015 there would be a decrease in total catch, associated with the overfishing of certain species due to a reduction in the surveillance of fishing, and degradation of the marine environment in general, caused by inadequate marine regulation. For this reason, certain fishermen would have to change profession due to a lack of profitability. It is assumed that there would be an increase in the number of recreational fishermen in proportion to local population and an increase in catch per person up to 2015, followed by a decline in catch per person due to overfishing starting in 2020. After this point, the number of fishermen would starts to decline while the catch per person would remains below the 2010 level.
The assumption made for diving is an increase in diving clubs and non-commercial dives up to 2020 (as in Scenario 2), until when the environmental degradation due to lack of regulation in the marine part of the NPCC would leads to a 5% per year reduction in dive numbers.
Carbon sequestration would decline due to a reduction in forest cover (of 2% per year) and Posidonia meadows (1% per year) due to conversion or destruction.
The NPCC’s budget increases more slowly than GDP, assuming that the economic crisis in Spain decreases the share of public expenditure allocated to environmental protection. It is assumed that the NCCP budget breakdown would follow the following trends: a slowdown of 1% per year for operating costs and 2% per year for activities and investments up to 2020, and 4% up to 2030. Projects awaiting approval (such as the PRUG and the La Punta development) are scrapped, which accentuates environmental degradation. With this declining budget, the NPCC still provides ecological monitoring and some environmental education activities. The CAR’s budget increases but less quickly than GDP. This would lead to a relative reduction in surveillance generating an increase of non compliant behaviour and illegal activities.
The park’s reduced budget affects mainly meetings of the governing body, which become less frequent, leading to a reduction in collaboration with the municipalities. This also affects meetings with users of the park (such as hunters, farmers and fishermen), which leads to an increase in conflicts and non compliance of behavior with rules.
Cost-benefit analysis of the effects of the NPCCSetting the parameters for the various scenarios enables to estimates parts of the costs and benefits of each situation, so that they can be compared and the option most favourable for local development determined.

PLAN BLEU PAPERS N° 13 34 I 35
Presentation of the methodWithout aiming at being exhaustive and as the benefits associated with the services provided by NPCC ecosystems are not fully taken into account , it has been find important to take in account a collective and non marketed benefit which is carbon sequestration by ecosystems.
Benefits associated with carbon sequestration in the NPCC were assessed on the basis of the ecosystems’ capacity for carbon sequestration (the the storage capacity of each type of ecosystem was taken into account based on its surface area in the NPCC), and on the basis of the changes in the value assigned to a tonne of CO2 in Spain.
Figure 16. Evolution of benefits and costs - Scenario 3 (in thousands of €)
Evolution of benefits
500,000
400,000
300,000
200,000
100,000
0
2010
2012
2014
2016
2018
2020
2022
2024
2026
2028
2030
CO2 sequestration
Diving
Tourism
Recreational fishing
Commerical fishing
Evolution of costs
2010
2012
2014
2016
2018
2020
2022
2024
2026
2028
2030
0
2,000
4,000
6,000
8,000
10,000
14,000
12,000
Administration budget
Surveillance expenses
Source: Plan Bleu, based on case study’s data
Benefits associated with the provision of fish within the NPCC, which involves both artisanal and recreational fishing, were estimated on the basis of fish catch. The calculation is made using total catch in the NPCC and the added value of local fishing, estimated at 50% of revenues. Indirect benefits were assessed on the basis of an input-output table, which was available for Catalonia as a whole.
The benefits associated with NPCC ecosystem services that support recreational activities and park amenities concern tourism and diving. The benefits were assessed on the basis of value added per-activity (estimated at 50% of revenue or expenditures), and indirect benefits.
Costs associated with the NPCC were calculated on the basis of the NPCC’s budget (divided into operating costs, activities and investments) and expenses associated with surveillance by the CAR within the NPCC.
The discount rate, which can be used to compare costs and benefits over time, was set at 4%, based on the average of interest rates edited by the Bank of Spain during the retrospective period (from 1998 to 2011).
The indicators used for the analysis were: Net Present Value (NPV), calculated by subtracting the present values of the costs from the present values of the benefits. Beside this main indicator, the cost benefit ratio, which shows the strategy that has the highest benefit per unit cost; and Internal Rate of Return (IRR), a classic decision-making tool for investments, that measures the rate of return on capital can be used. Here, considering the conditions and the factors taken into account in the study only the NPV can be taken as a relevant indicator48.
Presentation of the resultsRegarding the present value of benefits and costs and for each scenario from 2010 to 2030 shows taht the NPV of the increasing-protection scenario is the best for local development.
Table 5. Present value of benefits and costs from 2010 to 2030Scenario 1 Scenario 2 Scenario 3
Bene
fits
pres
ent
valu
e
Commercial fishing 6,785 6,547 5 406Recreational fishing 7,584 8,338 7 259Tourism 2,989,260 3,477,665 2 755 540Scuba diving 27,387 30,050 24 180CO2 Stockage 11,878 11,977 11 739Total 3,042,893 3,534,576 2 804 126
Cos
ts
pres
ent
valu
e Administration budget 26,316 64,675 22,699
Surveillance expenses 2,074 1,171 1,597Total 28,391 65,846 24,296
Net present value 3,014,502 3,468,730 2,779,830
Rate of change from S1 and S2 15.1%Rate of change from S1 and S3 -7.8%
Source: Plan Bleu, based on case study’s data
48 Pearce et al., 2006.

ECONOMIC STUDY OF THE IMPACTS OF MARINE AND COASTAL PROTECTED AREAS IN THE MEDITERRANEAN
However, it is also the most expensive scenario and therefore the least likely in a context of economic austerity.
In the business-as-usual scenario, the net benefits of the ecosystem services that the NPCC is estimated to provide total €3bn for the period 2010-2030, i.e. over €150m per year, by maintaining the current level of protection. If the park’s protection were enhanced (Scenario 2), the net benefits would rise to over €3.5bn, meaning an increase of 15,1%. On the other hand, if environmental protection was degraded (Scenario 3), the net benefits would be less than €3bn, leading to a drop of 7,8% from the scenario 1 level .
The evolution of annual flows of benefits shows that the business as usual scenario (1) implies, at first instance and in most cases,
better levels in scenario 1 compared to scenario 2, but then the level of profits falls below the level benefits generated by scenario 2. Meanwhile, scenario 3 is characterized by a decline of different types of benefits even if in the very short term, there may be an increase due to an unsustainable increase of uses.
Tourism is by far the activity that shows the greatest benefits associated with ecosystem services provided by the NPCC, ranging from €2.5bn to €3.5bn present value, depending on the scenario. Diving and carbon sequestration follow, with between €25m and €30m and over €10m respectively. The benefits of fishing are set back, between 5.5 and 7 million €. This observation reveals a prevalence of non-extractive uses, and more specifically services that support recreational activities and park amenities,
Figure 17. Comparative costs evolution (in thousands of €)
Scenario 3Scenario 2Scenario 1
8,000
4,000
0
2010
2012
2014
2016
2018
2020
2022
2024
2026
2028
2030
14,000
12,000
6,000
2,000
10,000
Source: Plan Bleu, based on case study’s data
Figure 18. Comparative benefits evolution ((in thousands of €)
Scenario 3Scenario 2Scenario 1
250,000
150,000
50,000
2010
2012
2014
2016
2018
2020
2022
2024
2026
2028
2030
500,000
400,000
200,000
100,000
300,000
450,000
350,000
0
Source: Plan Bleu, based on case study’s data
Figure 19. Present value of benefits linked to tourism ((in thousands of €)
Scenario 3Scenario 2Scenario 1
2,000,000
1,000,000
0
4,000,000
2,500,000
1,500,000
500,000
3,000,000
3,500,000
Source: Plan Bleu, based on case study’s data
Figure 20. Present value of other benetifts ((in thousands of €)
Scenario 3Scenario 2Scenario 1
20,000
10,000
0
35,000
25,000
15,000
5,000
Commercialfishing
DivingRecreationalfishing
CO2 sequestration
30,000
Source: Plan Bleu, based on case study’s data

PLAN BLEU PAPERS N° 13 36 I 37
which represent 99% of total benefits. In a study performed by Plan Bleu in 201049 for the Mediterranean as a whole, the support to recreational activities and amenities this last service was assessed as linked to two-thirds of annual benefits produced. The NPCC is therefore a specially favoured location for this type of benefit, which demands further thought on the role of Mediterranean MCPAs.
The increasing-protection scenario provided the greatest long-term annual benefits for each ecosystem service, except for fishing where the business as usual scenario is slightly above the increasing protection scenario, the latter two being significantly higher than the decreasing protection scenario.
CONCLUSIONThis exploratory study provides an initial assessment of some economic benefits related to ecosystem services delivered within the NPCC. These figures contribute showing the importance of environmental protection with respect to the supply of better quality of ecosystem services, and the well being of population.
The study shows that the NPCC influences the development especially local level planning and activities based on the provision of ecosystem services. This link is not necessarily used to its full potential users and local representatives call for strengthening these links to go beyond the current information link.
The prospective and quantitative part of the study, which is limited to the assessment of some costs and benefits generated by the NPCC, shows that the increasing protection scenario would be preferable to the decreasing protection scenario or business as usual scenario.
To overcome the important lack of data, including especially quantitative data, the study also relies on qualitative data collection (from interviews, observations...). Estimates, transfers and assumptions that were made are described in the full study report.
The difficulty in carrying out this study due to the lack of information highlights the need to better understand the ecological mechanisms, but also socio-economic issues underpinning the relationship between the context, the MCPA, ecosystem services and people well-being. Further studies on these elements would be useful both in natural sciences and social sciences.
49 Mangos et al., 2010.

ECONOMIC STUDY OF THE IMPACTS OF MARINE AND COASTAL PROTECTED AREAS IN THE MEDITERRANEAN
KAS-KEKOVAarcheological and natural heritage to be preserved
This summary is based on the study report entitled “Economic assessment of Kas-Kekova Marine Protected Area’s effects on the sustainability of local development” written by Ms Esra Basak.
In the south east of Turkey, at the east of Antalya province, the Special Environmental Protection Area (SEPA) of Kas Kekova was created in 1990. It covers over 258 km2, 166 km² in marine areas and 92 km² in land-based areas, encompassing the districts of Kasand Demre. It includes the villages of Kale-Üçagız, Çevreli and Kapaklı in the Demre district.
Figure 21. The SEPA of Kas-Kekova
Source: Case study
Kas-Kekova is an area characterised by its agricultural activity. It has partially benefited from Antalya’s economic growth whose tourism sector is booming. The SEPA was originally protected for the archaeological riches situated in its eastern parts and now on only included land use regulations. Nevertheless, thanks to its rich marine biodiversity, protection was extended in 2006 to the marine area around Kas after an initiative by WWF Turkey and the scientists responsible for producing marine inventories. The plan to propose marine zoning with marine use regulations as well as the initial land zoning were revised in 2011 and are still awaiting approval.
KAS-KEKOVA ON THE EDGE OF ANTALYA PROVINCEAntalya is one of the nation’s fastest-growing provinces with above-average economic indicators. Nevertheless, the districts of Kas
and Demre are remote and only partially benefit the economic dynamic of the province’s capital. The two capitals of the districts of Kas and Demre are not included in the protected area but they do influence the SEPA, therefore these districts are the most relevant administrative level at which to study the socio-economic profile of the SEPA.
A developing area where tourism is gaining ground on agricultureEconomic growth and employment in Kas-KekovaAntalya Province saw its population grow by 15% between 2000 and 2010 and this trend is partially reflected in the districts of Kas and Demre with respective growth rates of 10% and 14%. These two districts currently count together a population of 22,940. Over the same period, demographic trends in the protected area were diverse with extensive growth in the extreme north of the SEPA and a slight increase in the rest of the area. Nevertheless, population density remains low in the villages (18 people per km2) compared to the average in the districts (25 people per km2 in Demre and 59 people per km2 in Kas) and to the average in Antalya Province or in Turkey in general (93 and 94 people per km2 respectively).
The economy of the Western Mediterranean Region in Turkey, including the provinces of Antalya, Burdur and Isparta,is primarily centred on services which employ 52.2% of the population (including 27.5% in retail), compared to approximately 34% of the population in agriculture and only 14% in industry. However, agriculture is the most important activity in the SEPA, followed by tourism, retail and then fishing. According to a field survey, average income per capita is lower inside the SEPA than in the rest of the district.
The longevity of traditional activitiesThe agricultural activities of the three villages within the SEPA are primarily focused on greenhouse agriculture, practiced by 95% of households in Çevreli, 7.5% in Üçagiz, and 70% in Kapaklı in order to grow non-seasonal vegetables, especially green peppers. In Kapaklı, around twenty households also rear animals.

PLAN BLEU PAPERS N° 13 38 I 39
fishing is a marginal activity along Turkey’s Mediterranean coast (326 tonnes per year for Antalya Province, representing 15% of Turkish fish catches in the Mediterranean and only 6% of Turkey’s fishing yields50), the village of Kas nevertheless has 20 registered fishing boats and 32 members in the Kas Fishing Cooperative. Over 23 tonnes of fish and other marine produce was caught in the district in 2011, with revenues of around €135 million. In July 2011, a ban on catching swordfish and bluefin tuna, large fish representing a significant percentage of catches led to a change in practice.
A specific aspect of Kas Kekova is its highly flexible employment structure with many fishermen working as tourism operators or diving instructors during the summer period.
The rise of tourism driven by the demand for recreational activitiesTourism is booming thanks to improved infrastructure, the 1982 Tourism Encouragement Law, the country’s political stability and affordable prices. It is an extremely important activity in the region and Antalya Province welcomes 30% of the 28.6 million foreign visitors to Turkey. Furthermore, 80% of the active population of Kas is employed in this sector and the population of Kas varies from 7,000 to 20,000 during the high season.
Day boat trips are an especially common recreational activity and are often run by family businesses. The offer currently consists of around one hundred boats in Kekova and thirty in Kas but a new Marina that opened in May 2011 with a capacity of 470 yachts could have an impact on the quantity and geographical distribution of these day trips in the coming years.
Diving can be considered as being the main driver of local tourism, with 18 diving clubs in Kas in 2011 generating between €1.6 and €2.25 million annually and employing around fifty people. Given the magnitude of this activity and given the kind of tourism in this area, it can be argued that a large part of the future tourism in Kas and Demer iwill be closely linked to the quality of the environment and landscapes.
The economic significance of the cultural and natural heritageThe development of tourism has given new value to the conservation of sites in terms of local economic development. The SEPA was created first and foremost to protect the Lycian ruins of the ancient sunken city of Apollonia (Dolchiste) which was partially destroyed by an earthquake in the 2nd century.
Biodiversity is the reason for the extension of the protected area and the strengthening of protection. On land, the 107 km of coastline is typical of the Lycian coast, with rocky cliffs up to 550 m altitude. More than 90% of the land cover is natural that 82.4% of forest cover with various species of pine and dense vegetation characteristic of the maquis.272 plant species can be found here (belonging to 51 families, 26 of which are endemic to Turkey), 20
50 Turkish Statistical Institute, 2010.
species of mammal (including the Capra aegagrus aegagrus wild goat which has been classified as a vulnerable species by the IUCN), 96 species of bird, 16 species of reptile and 4 species of amphibian, including the Lyciasalamandra luschani which is endemic to Turkey and classified as a vulnerable species by the IUCN.
Les ruines de Dolchiste
Source: geo.fr
Lyciasalamandra luschani
Source: European Field Herping Community 2008
As for the marine environment, 117 species of fish, 14 of which are under threat, and 160 species of seaweed, two of which are under threat, have been identified, along with 33 species listed by CITES or in the Bern and Barcelona conventions (Appendix II of the SPA/BD protocol), such as the Mediterranean monk seal (Monachus monachus) and Caretta Caretta and Chelonia mydas turtles.
The SEPA aims to protect all of these species and the natural balance of the environments where they belong in light of the pressures they face.

ECONOMIC STUDY OF THE IMPACTS OF MARINE AND COASTAL PROTECTED AREAS IN THE MEDITERRANEAN
Capra aegagrus aegagrus
Source: Wikipedia
Although the level of chemical pollution recorded in the Western part of the SEPA is within acceptable limits51, rapid urbanisation along with the deficiencies of the Kas wastewater treatment system (especially in Çukurbag Peninsula and in the Üçagız-Kale area), require the application of precautionary measures.
Diving, boating/sailing (including recreational boating and tourist transport) and the villages of Kale and Üçagız have a high impact on Kekova island’s interior bay whose shallow seabed is particularly
51 Demir, 2011.
sensitive to pollution and damages.The Posidonia seagrass meadows, which is a key habitat fo many species and have an important ecologic function, have lost 5% to 10% of cover since 2006.
Fish stocks are overexploited and subject to illegal practices such as blast fishing or spearfishing, which is difficult to control due to a lack of surveillance resources.
In addition to use-related pressures (landuse, natural resources use, pollution and damages), these ecosystems are also exposed to the arrival of invasive species from the Red Sea, such as the Lagocephalus suezensis puffer fish, to the detriment of native species.
The development of the institutional protection schemes Kas-Kekova represents 0.63% of Turkey’s protected areas which cover more than 4 million hectares (6% of the national area) and have different conservation status. Of the 8,330 km of coastline, 1,177 km are included in the ten sites with SEPA status. Until summer 2011, these areas were under the management of the Environmental Protection Agency for Special Areas (EPASA), before ministerial restructuring placed them under the authority of the General Directorate for Natural Assets Protection (GDNAP) itself being under the guidance of the Ministry of Environment and Urbanisation (MoEU). Some stakeholders deplore this restructuring which has sometimes been seen as weakening the effort for environmental conservation, pointing out that protected areas need a management policy that focuses on sustainable use of resources rather than biodiversity conservation as such. .
The GDNAP is responsible for managing Kas Kekova but each sectorial management (fishing, tourism, etc.) is supervised by the relevant competent authority. In the field, WWF Turkey ensures cooperation between local stakeholders and public authorities and the SEPA’s membership of the MedPAN network facilitates interaction with the other Mediterranean MCPAs. The SEPA steering committee meets twice a year and also includes the districts of Kas and Demre, the Ministry of Culture and Tourism, local NGOs, the WWF and local diving and fishing associations.
Some important action have been s carried out, including the preparation of an Environmental Map on a scale of 1/25,000 in 1991, which was revised in 2011, an assessment of marine biodiversity in 2002 and of land-based biodiversity in 2010, and a socio-economic study in 2011, a study of Kekova’s carrying capacity in 2011. It is currently preparing a management plan for the marine part of the site.
Nevertheless, genuine conservation remains difficult, as one coastguard confirms, saying that coordination is so poor that the conviction of some policymakers is not enough to overcome the problem of the current non-sustainable fishing practices. Overall, the protected area is seen more as a tool which has prevented a collaps of the site’s ecological status rather than a real instrument for conserving biodiversity.
Figure22. Number of protected marine species during monitoring of the Western part of the SEPA
Source: Demir 2011
PLAN BLEU PAPERS N° 13 40 I 41
The issued in strengthening protectionIt is in this context that the question of the impact of greater usage limitations inherent in a new management plan arises. In Kas Kekova’s terrestrial area, the only use rules in force are due to Kas Kekova’s archaeological and cultural heritage and concern construction: permission is required to build but also to carry out repair and renovation works, which can often be very restrictive. Residents therefore often see protected areas in a fairly negative light. The only current regulation in place in the marine area is a ban on trawler fishing and diving on very specific sites. For the time being, the marine protected area is therefore scarcely different to the surrounding area.
The lack of counting points or physical barriers around the SEPA, make it difficult to estimate the number of visitors but it is assumed that visitor numbers have not significantly changed since the area received SEPA status. Field surveys show that few people are aware of the existence of a protected area around these sites and communication about the SEPA has been poor. A 2010 study52 estimated that around 400,000 people visited the SEPA that year, but this figure should probably be revised downwards due to a lack of transparency in counting methods. According to the data provided by recreational activity providers, at least 200,000 people use recreational services offered by the SEPA’s ecosystems. They also believe that the area’s natural characteristics are important in attracting visitors.
Current plans for zoning and a management plan aim to implement a ban on recreational and commercial fishing in certain areas, create regulation recreational fishing areas, introduce a ban on diving in certain areas and set up regulated anchoring areas where mooring buoys will be installed to prevent damage to seagrass beds by ship anchors.
Overall, local stakeholders currently have an indifferent or even negative view of the SEPA. Economic and ecological changes which have taken place since its creation are considered to have occurred independently of the creation of the SEPA. The SEPA is little known as the GDNAP has no local representative and few people are aware of its management role, confusing it sometimes with local or national conservation NGOs, which are better known by local people.
Due to rapidly growing tourist numbers in the districts of Kas and Demre and limited acceptance of the Kas Kekova SEPA, it is even more necessary to provide information for local residents about the advantages and disadvantages of the management plan awaiting approval and about the level of protection that is planned for coming years.
WHAT IS THE OUTLOOK FOR KAS KEKOVA SEPA?This part of the study aims at evaluating the net benefits generated by different protection scenarios of the SEPA of Kas-Kekovas.
52 The Optimar Danısmanlık socio-economic study (2010).
The characteristics of the districts of Kas and Demre and the relationships that this area has with the SEPA provide a starting point for developing different prospective scenarios regarding possible future outcomes.
Given the complexity of the topic, the constraints of the study, the availability of data and the degree of uncertainty, the study presented here does not aim to be exhaustive. It is based on the consideration of four major ecosystem services delivered inside the SEPA and used by the local population through commercial fishing, tourism, scuba diving, and sequestration of carbon dioxide.
Possible futures for the Kas-Kekova SEPAThree prospective scenarios are developed for the timeline 2010-203053. They are based on various contextual variables available at the national or local level. The assumptions concerning economic growth, population trends, implementation of existing regulations and business-as-usual changes to local activities define a common socio-economic context, integrating diffusely uncertainties associated with global economic crisis.
The three scenarios for 2030 have deliberately been chosen in order to provide strongly different prospects: a business-as-usual scenario which follows trends observed during retrospective analysis, an increasing-protection scenario where the management plan expected late 2012 is adopted, and a decreasing-protection scenario due to the lack of management and surveillance.
These three scenarios are based on a common economic and demographic context where GDP per capita in the SEPA rises by 13% per year until 2015, followed by a progressive decline of up to 7% per year from 2021 to 2030. The natural growth rate within the SEPA has been fixed according to forecasts by the Western Mediterranean Development Agency and is estimated at 0.86% per year until 2013.
Business as usual scenarioIn this scenario 1 it is assumed that the management plan which is currently under deliberation is not approved, however the existing use restrictions are maintained, but without increasing means or goal. In other words, the continuity of the costs and benefits observed in the retrospective period is assumed..
Given the absence of retrospective data concerning fishing, the number of fishermen and the volume of catches is considered to remain stable, at the same level observed throughout 2011. Tourist spending within the SEPA is assumed to change in line with GDP per capita.
The number of dives in the SEPA would depend on changes in tourist demand and price for diving would remain stable at approximately €32 per dive.
53 Given the date of completion of the study, when data for 2010 and 2011 were available, they were incorporated into the assessment.

ECONOMIC STUDY OF THE IMPACTS OF MARINE AND COASTAL PROTECTED AREAS IN THE MEDITERRANEAN
The same approach (stable price and demand indexed to tourism demand) is used to assess the benefits of boat day trips in the area.
The climate regulation ecosystem service through Carbone sequestration is taken into account for the terrestrial part of the SEPA. Surface areas covered by each type of ecosystem are still (at their 2010 level) as well as the value of a tonne of CO2 sequestrated.
The costs include the administration budget allocated to the SEPA, which is presumed to increase by 8% per year (in line with increasing expenditure on protected areas) whereas the expenditure of SEPA’s current partner, WWF Turkey, is presumed to remain constant.
Increasing-protection scenarioThis scenario 2 implies that the new management plan is approved, leading to more efficient measures for Kas-Kekova site conservation.
This management plan may include measures to limit fishing (particularly no-take zones), which would explain an assumed decline in catches of around 30% between 2012 and 2020. After 2020, it is estimated that the reserve effect would lead to an increase in catches of 10% per year with an additional 3 fishermen each year up to a limit of 52 fishermen due to carrying capacity.
As for tourism, a progressive increase in the number of visitors up to an estimated carrying capacity of 250,000 people per year in 2030 is assumed. Better site conservation improves the
Figure 23. Evolution of benefits and costs - Scenario 1 (in thousands of €)
Benefits evolution
120,000
80,000
60,000
40,000
20,000
0
2010
2012
2014
2016
2018
2020
2022
2024
2026
2028
2030
100,000
CO2 sequestration Diving
TourismBoat excursion
Fishing
Costs evolution
2010
2012
2014
2016
2018
2020
2022
2024
2026
2028
2030
0
200
400
600
800
1,000
1,600
1,200
1,400
SEPA administration budget
NGO expenditures inside the SEPA
Source: Plan Bleu, based on case study’s data
Figure 24. Evolution of benefts and costs - Scenario 2 (in thousands of €)
Evolution des autres bénéfices
120,000
80,000
60,000
40,000
20,000
0
2010
2012
2014
2016
2018
2020
2022
2024
2026
2028
2030
100,000
CO2 sequestration Diving
TourismBoat excursion
Fishing
Costs evolution
2010
2012
2014
2016
2018
2020
2022
2024
2026
2028
2030
0
200
400
600
800
1,000
1,600
1,200
1,400
SEPA administration budget
NGO expenditures inside the SEPA
Source: Plan Bleu, based on case study’s data

PLAN BLEU PAPERS N° 13 42 I 43
site’s ecological characteristics and leads to an increase in tourist expenditure from €46 to €70 per day, per person.
The same logic applies to diving with a progressive increase in the number of dives, reaching 120,000 dives per year in 2030, and an increase in the unit price of €32 to €45 per dive.
Day boat trips also follow this trend, reaching an estimated carrying capacity of 250,000 per year in 2030, and the price per trip rises from €14 to €21.
As for CO2 sequestration services, the price per tonne is considered stable (€15.61) here also, but the areas covered by natural terrestrial ecosystems grows by 2% each year.
The costs associated with increasing protection of the SEPA suppose an increase in annual budget devoted to protection. Thus it is assumed that public expenditure as well as WWF Turkey expenditures for this site would increase by 10% per year..
Decreasing protection scenarioThis scenario 3 is based on the assumption of an environmental decline of the Kas-Kekova site due to lack of management and surveillance.
The decreasing-protection scenario assumes an initial period of increasing fish catch by 1% per year until 2021 and then, in a second time this overexploitation of fish stocks would lead to a decrease of 4% per year in catch and to the demise of a fisherman per year..
The number of tourists is assumed to rise rapidly by 5% per year until 2020, followed by a gradual return to the carrying capacity estimated at 250,000 people. Due to a decline in ecosystems and landscapes, daily expenditure falls from €46 to €40 per day, and the average length of stay on the sites falls from 5 to 3 days.
Permission to open an additional diving club would also lead to rapid growth in diving. The number of dives would increase by 10% per year until 2020 before a gradual decline to the estimated carrying capacity of 120,000 dives per year. The price per dive is assumed to remain stable at €32.
The number of boat day trips would increase to 300,000 per year in 2020, but a decline in landscapes, fauna and flora could to lead to a reduction in price from €14 to €12 as early as 2015. After 2020, the number of trips would fall to the estimated carrying capacity of 250,000 trips in 2030.
As for carbon sequestration services, the price per tonne is considered stable as for the scenarios 1 and 2. The area covered by terrestrial forest ecosystems is assumed to decrease by 1% per year and agricultural land area will increase by 1% per year.
According to this scenario, the SEPA’s administration budget would rise less quickly than GDP, at a rate of 2% per year. It is assumed that the WWF would withdraw from 2012.
Cost-benfit analysis of the Kas-Kekova SEPAThe approach is based on the application of the cost-benefit analysis (CBA) to make an assessment of each scenario in order to make comparisons between action programmes.
The aim is to classify scenarios from their net present value (NPV). The NPV is obtained by deducting the sum of the discounted costs from the sum of the discounted benefits and thus represents the net profit of the chosen option. Considering the internal rate of return and benefit-cost ratio do not apply the conditions of the study, the NPV is the main relevant indicator retained54.
Setting scenarios allows quantifying the flow of benefits related to the use of ecosystem services considered and the flow of costs linked to the administration and action of protection inside the SEPA.
54 Pearce et al., 2006.
Figure 25. Evolution of benefts and costs - Scenario 3 (in thousands of €)
Benefits evolution
120,000
80,000
60,000
40,000
20,000
0
2010
2012
2014
2016
2018
2020
2022
2024
2026
2028
2030
100,000
CO2 sequestration Diving
TourismBoat excursion
Fishing
Costs evolution
2010
2012
2014
2016
2018
2020
2022
2024
2026
2028
2030
0
200
400
600
800
1,000
1,600
1,200
1,400
SEPA administration budget
NGO expenditures inside the SEPA
Source: Plan Bleu, based on case study’s data
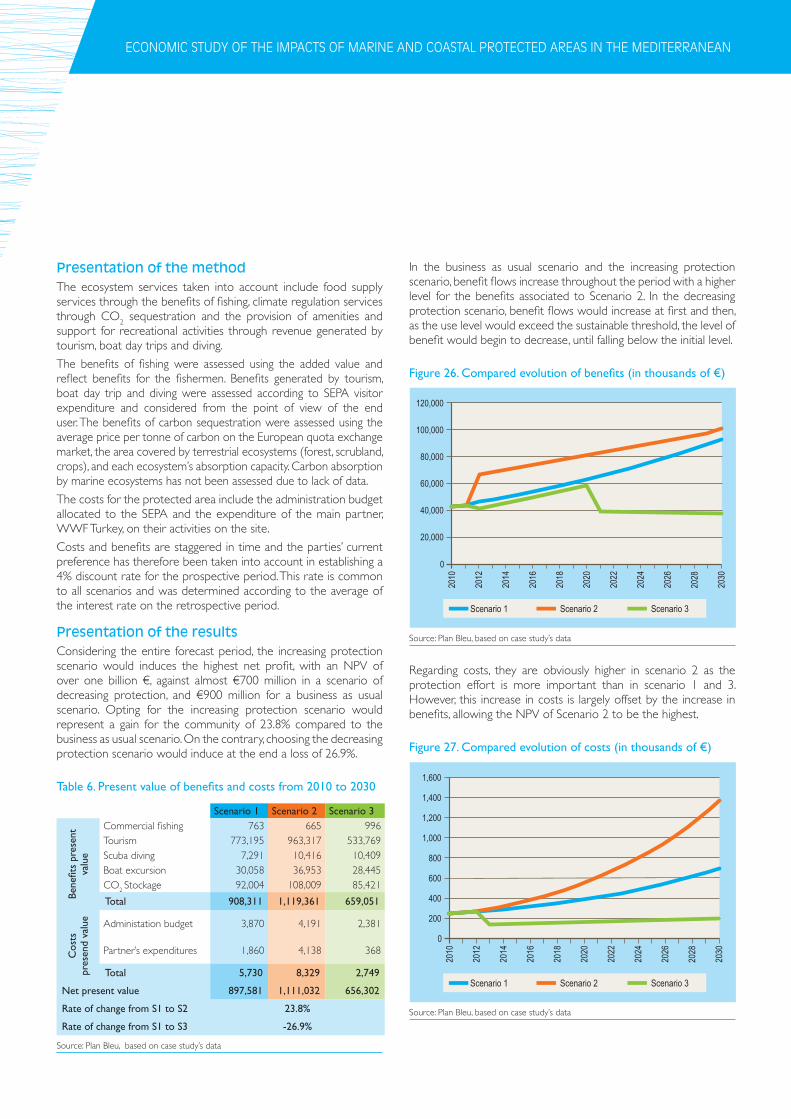
ECONOMIC STUDY OF THE IMPACTS OF MARINE AND COASTAL PROTECTED AREAS IN THE MEDITERRANEAN
Presentation of the method The ecosystem services taken into account include food supply services through the benefits of fishing, climate regulation services through CO2 sequestration and the provision of amenities and support for recreational activities through revenue generated by tourism, boat day trips and diving.
The benefits of fishing were assessed using the added value and reflect benefits for the fishermen. Benefits generated by tourism, boat day trip and diving were assessed according to SEPA visitor expenditure and considered from the point of view of the end user. The benefits of carbon sequestration were assessed using the average price per tonne of carbon on the European quota exchange market, the area covered by terrestrial ecosystems (forest, scrubland, crops), and each ecosystem’s absorption capacity. Carbon absorption by marine ecosystems has not been assessed due to lack of data.
The costs for the protected area include the administration budget allocated to the SEPA and the expenditure of the main partner, WWF Turkey, on their activities on the site.
Costs and benefits are staggered in time and the parties’ current preference has therefore been taken into account in establishing a 4% discount rate for the prospective period. This rate is common to all scenarios and was determined according to the average of the interest rate on the retrospective period.
Presentation of the results Considering the entire forecast period, the increasing protection scenario would induces the highest net profit, with an NPV of over one billion €, against almost €700 million in a scenario of decreasing protection, and €900 million for a business as usual scenario. Opting for the increasing protection scenario would represent a gain for the community of 23.8% compared to the business as usual scenario. On the contrary, choosing the decreasing protection scenario would induce at the end a loss of 26.9%.
Table 6. Present value of benefits and costs from 2010 to 2030
Scenario 1 Scenario 2 Scenario 3
Bene
fits
pres
ent
valu
e
Commercial fishing 763 665 996Tourism 773,195 963,317 533,769Scuba diving 7,291 10,416 10,409Boat excursion 30,058 36,953 28,445CO2 Stockage 92,004 108,009 85,421
Total 908,311 1,119,361 659,051
Cos
ts
pres
end
valu
e Administation budget 3,870 4,191 2,381
Partner’s expenditures 1,860 4,138 368
Total 5,730 8,329 2,749
Net present value 897,581 1,111,032 656,302
Rate of change from S1 to S2 23.8%
Rate of change from S1 to S3 -26.9%
Source: Plan Bleu, based on case study’s data
In the business as usual scenario and the increasing protection scenario, benefit flows increase throughout the period with a higher level for the benefits associated to Scenario 2. In the decreasing protection scenario, benefit flows would increase at first and then, as the use level would exceed the sustainable threshold, the level of benefit would begin to decrease, until falling below the initial level.
Figure 26. Compared evolution of benefits (in thousands of €)
Scenario 3Scenario 2Scenario 1
80,000
40,000
0
2010
2012
2014
2016
2018
2020
2022
2024
2026
2028
2030
120,000
100,000
60,000
20,000
Source: Plan Bleu, based on case study’s data
Regarding costs, they are obviously higher in scenario 2 as the protection effort is more important than in scenario 1 and 3. However, this increase in costs is largely offset by the increase in benefits, allowing the NPV of Scenario 2 to be the highest.
Figure 27. Compared evolution of costs (in thousands of €)
Scenario 3Scenario 2Scenario 1
800
400
0
2010
2012
2014
2016
2018
2020
2022
2024
2026
2028
2030
1,200
1,000
600
200
1,400
1,600
Source: Plan Bleu, based on case study’s data
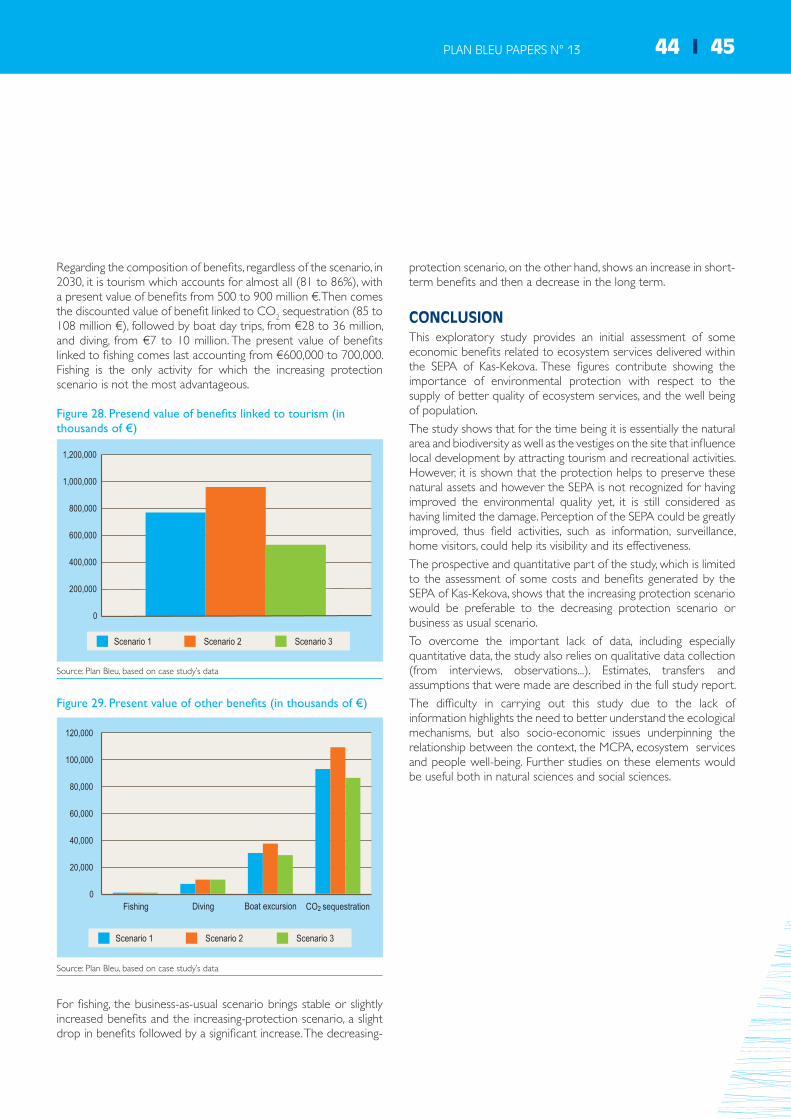
PLAN BLEU PAPERS N° 13
Regarding the composition of benefits, regardless of the scenario, in 2030, it is tourism which accounts for almost all (81 to 86%), with a present value of benefits from 500 to 900 million €. Then comes the discounted value of benefit linked to CO2 sequestration (85 to 108 million €), followed by boat day trips, from €28 to 36 million, and diving, from €7 to 10 million. The present value of benefits linked to fishing comes last accounting from €600,000 to 700,000. Fishing is the only activity for which the increasing protection scenario is not the most advantageous.
Figure 28. Presend value of benefits linked to tourism (in thousands of €)
800,000
400,000
0
1,200,000
1,000,000
600,000
200,000
Scenario 3Scenario 2Scenario 1
Source: Plan Bleu, based on case study’s data
Figure 29. Present value of other benefits (in thousands of €)
80,000
40,000
0
120,000
100,000
60,000
20,000
Fishing Diving Boat excursion CO2 sequestration
Scenario 3Scenario 2Scenario 1
Source: Plan Bleu, based on case study’s data
For fishing, the business-as-usual scenario brings stable or slightly increased benefits and the increasing-protection scenario, a slight drop in benefits followed by a significant increase. The decreasing-
protection scenario, on the other hand, shows an increase in short-term benefits and then a decrease in the long term.
CONCLUSIONThis exploratory study provides an initial assessment of some economic benefits related to ecosystem services delivered within the SEPA of Kas-Kekova. These figures contribute showing the importance of environmental protection with respect to the supply of better quality of ecosystem services, and the well being of population.
The study shows that for the time being it is essentially the natural area and biodiversity as well as the vestiges on the site that influence local development by attracting tourism and recreational activities. However, it is shown that the protection helps to preserve these natural assets and however the SEPA is not recognized for having improved the environmental quality yet, it is still considered as having limited the damage. Perception of the SEPA could be greatly improved, thus field activities, such as information, surveillance, home visitors, could help its visibility and its effectiveness.
The prospective and quantitative part of the study, which is limited to the assessment of some costs and benefits generated by the SEPA of Kas-Kekova, shows that the increasing protection scenario would be preferable to the decreasing protection scenario or business as usual scenario.
To overcome the important lack of data, including especially quantitative data, the study also relies on qualitative data collection (from interviews, observations...). Estimates, transfers and assumptions that were made are described in the full study report.
The difficulty in carrying out this study due to the lack of information highlights the need to better understand the ecological mechanisms, but also socio-economic issues underpinning the relationship between the context, the MCPA, ecosystem services and people well-being. Further studies on these elements would be useful both in natural sciences and social sciences.
44 I 45

ECONOMIC STUDY OF THE IMPACTS OF MARINE AND COASTAL PROTECTED AREAS IN THE MEDITERRANEAN
THE ISLAND OF ZAKYNTHOSa heaven for tourists and loggerhead turtles
This summary is based on the study report “Economic assessment of a Marine Protected Area’s effects on the sustainable development in the Mediterranean – Case study of Zakynthos in Greece” written by Mr Ioannis Spilanis.
Zakynthos is a Greek island in the Ionian archipelago, located 20 km west of the Peloponnese and 14 km south of the island of Cephalonia. With a surface area of 406 km², it accounts for 0.3% of the national territory. Home to the largest known colony of Caretta Caretta turtles in the Mediterranean, the southern part of the island – including the Gulf of Laganas – was declared a National Marine Park in 1999.
The island of Zakynthos is divided between a semi-mountainous north-west, covering 55% of the territory, and the plains of the south-east, where the majority of human activities are concentrated. Laganas Bay, which averages less than 30 m in depth, experiences substantial water exchanges with the Ionian Sea. Arable land accounts for 61.2% of the island’s surface area, with 36.2% covered by forests and semi-natural areas, and only 2.5% developed55.
Zakynthos is home to 32 of Greece’s 116 species of mammal, in addition to many reptiles and amphibians. Mediterranean maquis is the most common terrestrial ecosystem in the western part of the bay. On the islet of Marathonisi, resuspension of sediments caused by wind and waves prevents the growth of all vegetation on a 20 to 30 m strip of coastline. In addition to the broom plantations that are present in the eastern part of Zakynthos, vineyards and olive groves occupy a considerable part of the island.
The impressive growth in tourism since the 1980s has intensified the pressure on Zakynthos’ rich natural habitats, which are home to hundreds of terrestrial and marine species, including several that are particularly vulnerable (such as the Caretta Caretta turtle, the Monachus Monachus monk seal, or the Pancratium maritimum sea daffodil).
The National Marine Park of Zakynthos (NMPZ), covering a land area of 45.4 km² (including a 14.2 km² “core protected area”) and a marine area of 89.9 km², was created to meet the need to protect these vulnerable species. In the process, it was perceived by inhabitants of the island as an impediment to local development, generating high opportunity costs due to the limitations that it places on tourism and recreational activities. The issue of costs and benefits generated for local people was already at the heart of concerns.
55 2000 survey.
Figure 30. Zakynthos island
Source: zakynthos.net.gr
INTEGRATION OF THE NMPZ INTO THE LOCAL DEVELOPMENT OF ZAKYNTHOS
A low contribution of growth to local developmentThe island of Zakynthos is demographically attractive: in the context of a downward population trend for the Ionian Islands and Greece in general, its number of inhabitants rose by 4.5% during the last decade, totalling 40,650 in 2011, equivalent to 0.4% of the Greek population. The population is more cosmopolitan than the rest of the country, with 13.2% foreigners compared to 7% nationally. The island has a population density of 100 people per km², which is higher than the national average of 82 people per km² (30% of the population is concentrated in the city of Zakynthos, the department capital). Life expectancy in Zakynthos is one of the best in Greece, with 82.8 years for women and 78.7 years for men.
In 2008, the GDP amounted to 0.4% of Zakynthos national GDP.The economy has been thriving for several decades. The GDP

PLAN BLEU PAPERS N° 13 46 I 47
per capita for the department of Zakynthos has shown greater economic vitality than rest of the country, rising from 91% of the national average in 1990 to 121% in 2008 which demonstrates a more dynamic economy than the rest of the country. In contrast, the average income per capita in 2008 was €12,489, i.e. only 74.9% of the national average. Youth inactivity is more pronounced than in the rest of the country, with 15.72% of young people not in education, employment or training.
Tourism activities: high importance and environmental pressuresThe local economy is based mainly on tourism, and in particular on the hotels/restaurants/cafes sector (HORECA), which alone accounts for between 25% and 30% of GDP depending on the year, and on the many recreational activities available to tourists, such as canoeing, diving, pedalo or recreational boating. Public services represent about 17% of GDP, retail 15% and the financial, real estate and Business services, which are structurally related to tourism, 13.9%. Construction, at 7.5%, is currently in decline, as is the primary sector, which represents only 3.4% of GDP compared to 9.5% in 2000. Within this sector, fishing plays only a marginal role in the region (0.5% of local GDP56), while olive and grape cultivation remains a fundamental component of the island’s identity.
Figure 31. Zakynthos GDP breakdown per branch
4%4%
7%
54%
14%
17%Primary sector
Secondary sector(except construction)
Construction
Trade, HORECA,transport andcommunications
Financial intermediation,reas estate and business
Public service, socialsecurity, education, healthand other services
Data source: El Stat 2010.
A sector analysis of employment reveals a slightly different distribution, with 27.8% of the population working in the primary sector (only 0.5% being accounted for by fishing); 33.7% in retail, the HORECA sector, transport and communications; 18.1% in the secondary sector, including 12.8% in construction; and 12% in other services.
These differences may be explained by widespread multiple job-holding, linked to the many family Businesses and to highly seasonal activities. The unemployment rate of 8.7% is above the national average (7.7%) and is particularly marked among young people
56 El.Stat, 2010.
under the age of 25 (28.7%). Zakynthos’ economy is therefore at the same time dynamic and fragile because of its dependence on tourism.
In the early 1980s, the main visitors to Zakynthos were Greek, but the sharp increase in the island’s tourist capacity, driven by government incentives such as the opening of Zakynthos airport to international traffic in 1981, attracted more tourists from a wider variety of countries. In 2009, there were 2.5 million overnight stays on the island, or 4% of all overnight stays in Greece.
Zakynthos’ tourism potential is high, as evidenced by various recreational activities related to tourism, such asf daily turtle-spotting excursions around Laganas and Keri, which account for 34.9% of the island’s tourist activities. Loggerhead turtle is a true emblem for the island, with a significant development of turtle spotting which is not really exploited by the NMPZ which yet contributes significantly to maintaining the presence of this species in the island. Broadly speaking, NMPZ itself and its effects are not well known. If less than 10% of visitors to Zakynthos are directly attracted by the existence of NMPZ57, the main reasons declared are attractive beaches and other landscapes, that the NMPZ is indeed also responsible for maintaining. In addition, one study showed that 81% of visitors declared willing to pay for access to the beaches and inside the NMPZ up to the average of €5.
Tourism generates three types of pressure on the ecosystems of Zakynthos: • The first is a significant increase in built-up areas, due to the
conversion of forested or agricultural land to developed land. The restrictive construction rules in the NMPZ laid down has limited this trend, but illegal construction continues.
• The second is an increased demand for water and energy during the summer, which has not been addressed by current policies and leads to illegal drilling.
• The third pressure arises from an increase in waste and wastewater. While a wastewater treatment structure is in place to help reduce untreated discharge, the solid waste problem is facing the inefficiency of the collection and recycling system.
The use of land and natural resources and more broadly speaking, human activities in general, contribute to environmental damage and degradation in the quality of the ecosystem services provided. Uncontrolled construction due to permissive legislation and a lack of land-use planning has combined with solid waste system failures in contributing to the deterioration of the landscape. Marine pollution, however, generally remains below acceptable thresholds. The increasing salinization of aquifers, especially on the south coast, is problematic for drinking water supply, especially when the island population doubles in the summer due to the influx of tourists.
Based on the DPSIR analytical framework developed by the OECD, the diagram below illustrates the relationship of environmental pressures, their causes (driving forces) and the effect of these pressures (states) of different components well-being of local people and local development
57 Kokkali, 2010.
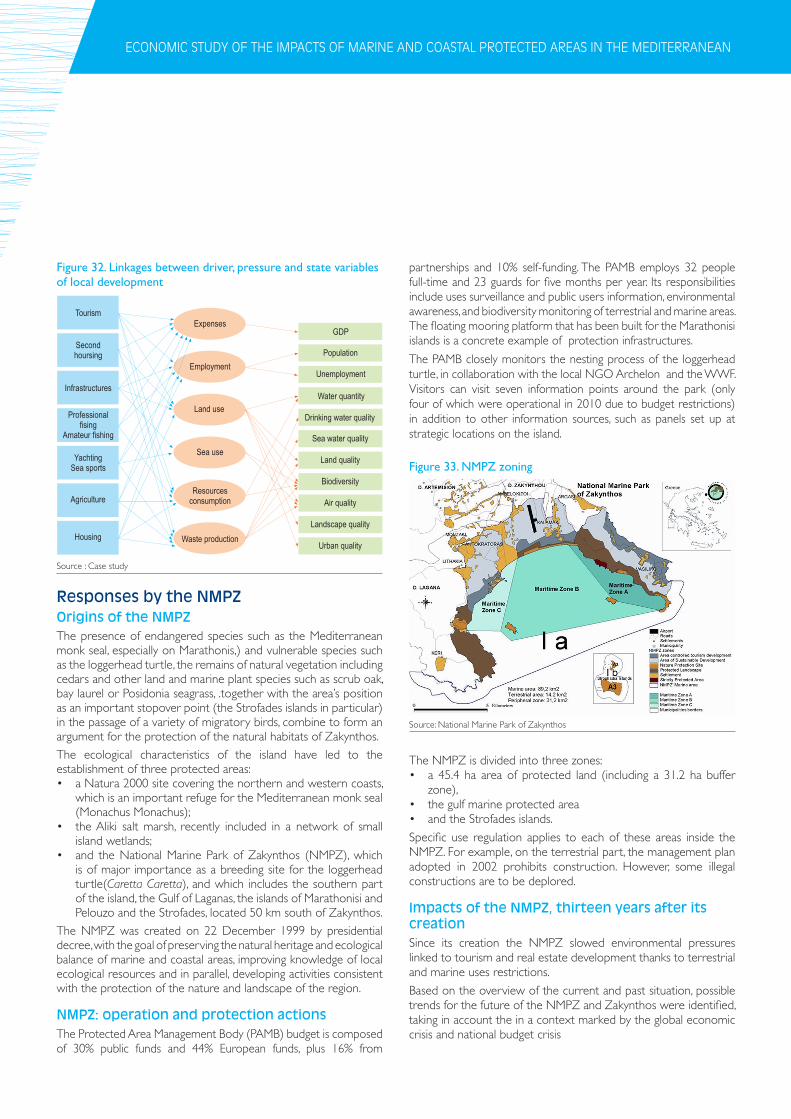
ECONOMIC STUDY OF THE IMPACTS OF MARINE AND COASTAL PROTECTED AREAS IN THE MEDITERRANEAN
Figure 32. Linkages between driver, pressure and state variables of local development
Source : Case study
Responses by the NMPZOrigins of the NMPZThe presence of endangered species such as the Mediterranean monk seal, especially on Marathonis,) and vulnerable species such as the loggerhead turtle, the remains of natural vegetation including cedars and other land and marine plant species such as scrub oak, bay laurel or Posidonia seagrass, .together with the area’s position as an important stopover point (the Strofades islands in particular) in the passage of a variety of migratory birds, combine to form an argument for the protection of the natural habitats of Zakynthos.
The ecological characteristics of the island have led to the establishment of three protected areas: • a Natura 2000 site covering the northern and western coasts,
which is an important refuge for the Mediterranean monk seal (Monachus Monachus);
• the Aliki salt marsh, recently included in a network of small island wetlands;
• and the National Marine Park of Zakynthos (NMPZ), which is of major importance as a breeding site for the loggerhead turtle(Caretta Caretta), and which includes the southern part of the island, the Gulf of Laganas, the islands of Marathonisi and Pelouzo and the Strofades, located 50 km south of Zakynthos.
The NMPZ was created on 22 December 1999 by presidential decree, with the goal of preserving the natural heritage and ecological balance of marine and coastal areas, improving knowledge of local ecological resources and in parallel, developing activities consistent with the protection of the nature and landscape of the region.
NMPZ: operation and protection actionsThe Protected Area Management Body (PAMB) budget is composed of 30% public funds and 44% European funds, plus 16% from
Tourism
Secondhoursing
Infrastructures
Professionalfising
Amateur fishing
YachtingSea sports
Agriculture
Housing
Expenses
Employment
Land use
Sea use
Resourcesconsumption
Waste production
GDP
Population
Unemployment
Water quantity
Drinking water quality
Sea water quality
Land quality
Biodiversity
Air quality
Landscape quality
Urban quality
partnerships and 10% self-funding. The PAMB employs 32 people full-time and 23 guards for five months per year. Its responsibilities include uses surveillance and public users information, environmental awareness, and biodiversity monitoring of terrestrial and marine areas. The floating mooring platform that has been built for the Marathonisi islands is a concrete example of protection infrastructures.
The PAMB closely monitors the nesting process of the loggerhead turtle, in collaboration with the local NGO Archelon and the WWF. Visitors can visit seven information points around the park (only four of which were operational in 2010 due to budget restrictions) in addition to other information sources, such as panels set up at strategic locations on the island.
Figure 33. NMPZ zoning
Source: National Marine Park of Zakynthos
The NMPZ is divided into three zones:• a 45.4 ha area of protected land (including a 31.2 ha buffer
zone), • the gulf marine protected area • and the Strofades islands.
Specific use regulation applies to each of these areas inside the NMPZ. For example, on the terrestrial part, the management plan adopted in 2002 prohibits construction. However, some illegal constructions are to be deplored.
Impacts of the NMPZ, thirteen years after its creationSince its creation the NMPZ slowed environmental pressures linked to tourism and real estate development thanks to terrestrial and marine uses restrictions.
Based on the overview of the current and past situation, possible trends for the future of the NMPZ and Zakynthos were identified, taking in account the in a context marked by the global economic crisis and national budget crisis
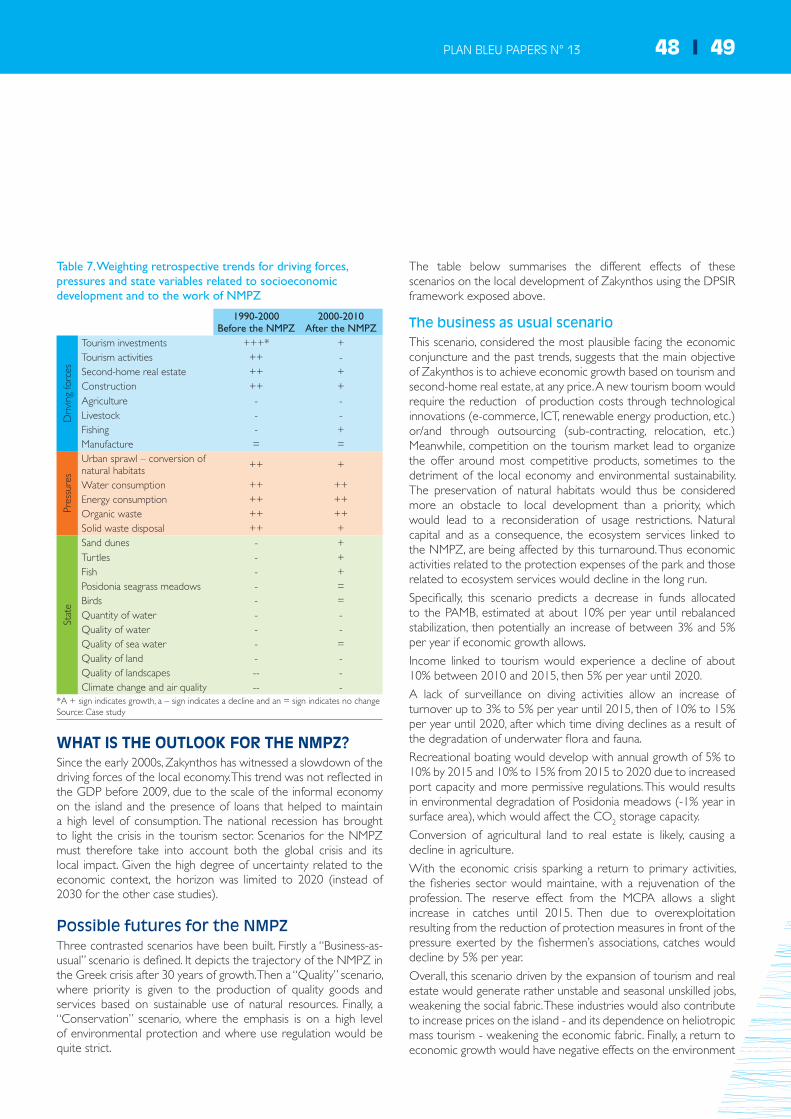
PLAN BLEU PAPERS N° 13 48 I 49
Table 7. Weighting retrospective trends for driving forces, pressures and state variables related to socioeconomic development and to the work of NMPZ
1990-2000Before the NMPZ
2000-2010After the NMPZ
Driv
ing
forc
es
Tourism investments +++* +Tourism activities ++ -Second-home real estate ++ +Construction ++ +Agriculture - -Livestock - -Fishing - +Manufacture = =
Pres
sure
s
Urban sprawl – conversion of natural habitats ++ +
Water consumption ++ ++Energy consumption ++ ++Organic waste ++ ++Solid waste disposal ++ +
Stat
e
Sand dunes - +Turtles - +Fish - +Posidonia seagrass meadows - =Birds - =Quantity of water - -Quality of water - -Quality of sea water - =Quality of land - -Quality of landscapes -- -Climate change and air quality -- -
*A + sign indicates growth, a – sign indicates a decline and an = sign indicates no changeSource: Case study
WHAT IS THE OUTLOOK FOR THE NMPZ?Since the early 2000s, Zakynthos has witnessed a slowdown of the driving forces of the local economy. This trend was not reflected in the GDP before 2009, due to the scale of the informal economy on the island and the presence of loans that helped to maintain a high level of consumption. The national recession has brought to light the crisis in the tourism sector. Scenarios for the NMPZ must therefore take into account both the global crisis and its local impact. Given the high degree of uncertainty related to the economic context, the horizon was limited to 2020 (instead of 2030 for the other case studies).
Possible futures for the NMPZThree contrasted scenarios have been built. Firstly a “Business-as-usual” scenario is defined. It depicts the trajectory of the NMPZ in the Greek crisis after 30 years of growth. Then a “Quality” scenario, where priority is given to the production of quality goods and services based on sustainable use of natural resources. Finally, a “Conservation” scenario, where the emphasis is on a high level of environmental protection and where use regulation would be quite strict.
The table below summarises the different effects of these scenarios on the local development of Zakynthos using the DPSIR framework exposed above.
The business as usual scenarioThis scenario, considered the most plausible facing the economic conjuncture and the past trends, suggests that the main objective of Zakynthos is to achieve economic growth based on tourism and second-home real estate, at any price. A new tourism boom would require the reduction of production costs through technological innovations (e-commerce, ICT, renewable energy production, etc.) or/and through outsourcing (sub-contracting, relocation, etc.) Meanwhile, competition on the tourism market lead to organize the offer around most competitive products, sometimes to the detriment of the local economy and environmental sustainability. The preservation of natural habitats would thus be considered more an obstacle to local development than a priority, which would lead to a reconsideration of usage restrictions. Natural capital and as a consequence, the ecosystem services linked to the NMPZ, are being affected by this turnaround. Thus economic activities related to the protection expenses of the park and those related to ecosystem services would decline in the long run.
Specifically, this scenario predicts a decrease in funds allocated to the PAMB, estimated at about 10% per year until rebalanced stabilization, then potentially an increase of between 3% and 5% per year if economic growth allows.
Income linked to tourism would experience a decline of about 10% between 2010 and 2015, then 5% per year until 2020.
A lack of surveillance on diving activities allow an increase of turnover up to 3% to 5% per year until 2015, then of 10% to 15% per year until 2020, after which time diving declines as a result of the degradation of underwater flora and fauna.
Recreational boating would develop with annual growth of 5% to 10% by 2015 and 10% to 15% from 2015 to 2020 due to increased port capacity and more permissive regulations. This would results in environmental degradation of Posidonia meadows (-1% year in surface area), which would affect the CO2 storage capacity.
Conversion of agricultural land to real estate is likely, causing a decline in agriculture.
With the economic crisis sparking a return to primary activities, the fisheries sector would maintaine, with a rejuvenation of the profession. The reserve effect from the MCPA allows a slight increase in catches until 2015. Then due to overexploitation resulting from the reduction of protection measures in front of the pressure exerted by the fishermen’s associations, catches would decline by 5% per year.
Overall, this scenario driven by the expansion of tourism and real estate would generate rather unstable and seasonal unskilled jobs, weakening the social fabric. These industries would also contribute to increase prices on the island - and its dependence on heliotropic mass tourism - weakening the economic fabric. Finally, a return to economic growth would have negative effects on the environment

ECONOMIC STUDY OF THE IMPACTS OF MARINE AND COASTAL PROTECTED AREAS IN THE MEDITERRANEAN
increasing pressures (increased consumption of water and energy, as well as waste production, population density exceeding with a summer population density exceeding 250 people per km²).
The quaity scenarioThis scenario is based on a decision to switch to a model that would place local development within the concept of green economy, with controlled exploitation of natural capital.
Specifically one essential prerequisite is a shift in growth patterns, with the decline of the in construction and second-home real estate industry.
Tourism product diversification involves developing agriculture and local crafts, as well as enhancing the cultural heritage of the island (including museums and monuments). Urban planning is governed by the development of an Agenda 21-type plan.
Current usage restrictions are maintained, to the extent that the preservation of the NMPZ becomes crucial for the attractiveness of Zakynthos and an integral part of its development strategy. In this context, natural capital will be maintained or improved, with a consequent positive impact on ecosystem services and linked benefits.
Aware of the issues, the different NMPZ actors work to cooperate and seek to reduce the environmental impact of their activities inside and outside the park boundaries, resulting in the maintenance or improvement of the current quality of ecosystem services.
Until 2013, the budget allocated to the NMPZ is maintained at the 2011 level, before increasing due to additional contributions from local stakeholders, aware of the role of the MCPA in renewing tourism and achieving sustainable development of the island. This stimulates economic activity related to the expenditure of the PAMB and local environmental NGOs.
The time required for regeneration entails a reduction in tourism until 2015, after which date new products can be developed and benefits once again begin to rise.
Preservation of the NMPZ’s marine ecosystems leads to a 3% to 5% per year increase in diving until 2015, followed by 10% per year until 2020.
The renovation of the port of Zakynthos increases recreational boating by 5% to 10% until 2015, after which point it stabilises in order to respect the port’s carrying capacity.
Table 8. Weighting prospective trends of the driving forces, pressures and state variables related to socioeconomic development and to the action of NMPZ, for three scenarios
Business as usual scenario Quality scenario Conservation scenario
MCPA Outside MCPA MCPA Outside
MCPA MCPA Outside MCPA
Dri
ving
forc
es
Tourism investments + ++ + + - =Tourism activities - = ++ ++ - +Second-home real estate ++ +++ = + -- +Construction ++ +++ + + -- -Agriculture -- --- + + = -Livestock -- --- + + = -Fishing -- --- + + = -Manufacture - --- + + = =
Pres
sure
s
Urban sprawl – conversion of natural habitats ++ +++ + + = +Water consumption ++ +++ = - - +Energy consumption ++ +++ = - - +Organic waste ++ +++ = - - +Solid waste disposal ++ +++ = - - +
Stat
e
Sand dunes -- --- + = ++ +Turtles -- -- + = ++ +Fish -- --- + = ++ +Posidonia seagrass meadows -- -- = = ++ +Birds -- -- = = ++ +Quantity of water -- --- = = ++ +Quality of water -- --- = = ++ +Quality of sea water -- --- = = ++ +Quality of land -- --- = = ++ +Quality of landscapes -- --- + = ++ +Climate change and air quality -- --- + + ++ +
Source: Case study

PLAN BLEU PAPERS N° 13 50 I 51
Agricultural land is maintained or increased, and activity increases due to rising demand for local products. This opportunity, together with the economic crisis, leads to an increase in the number of farmers. Maintenance of land-based and marine ecosystems stabilises the CO
2 storage capacity.
As in the Business-as-usual scenario, the number of fishermen remains stable and the average age of the profession drops. Catch volumes are maintained or slightly increased due to the effect of protective measures, while incomes rise.
The benefits generated by this scenario are guaranteed in the medium and long term partly by the diversification of tourism products, which reduces Zakynthos’ dependence on mass 3S tourism. The jobs created are more skilled and less seasonal than in the Business-as-usual scenario. Environmental pressures stabilise, despite maintaining a high summer population density, due to planned expansion of urban development and the corresponding water and energy requirements.
The conservation scenarioIn the conservation scenario – the least plausible given the current economic crisis context – the maintenance of ecosystem services and the natural capital on which they depend is a priority, regardless of its effects on socio-economic development. The current level of resource use is maintained or reduced so as not to exceed the sustainability threshold.
The NMPZ is expanded to include the western and north-western coasts, in order to better protect monk seals and their natural habitat. Land and sea use surveillance are more stringent and compliance with rules is better. The activities developed on the island are in line with the objectives of the NMPZ.
The budget allocated to the NMPZ is maintained until 2013 and then increases to allow the PAMB to expand its functions. Protection activities are strengthened in the coming years, and better ecosystem services benefit the local economy and people.
Tourism capacity decreases, due to the closure of establishments that are old or too close to protected areas. The average length of stay of tourists increases, but the number of visitors drops until 2015, causing a decline in profits which is only partially offset by the surge of visitors after 2015.
The number of dives increases from 3% to 5% per year until 2015 and then stabilises due to strengthened usage legislation. The quality of marine ecosystems increases added value of 3% to 5%.
The economic crisis and the demand for local products cause an increase in the land area devoted to agriculture, a recovery of abandoned land. The preservation contributes to increasing ecosystem coverage and thus generates an increase in CO
2 storage capacity.
The number of fishermen remains the same but the increase in marine resources as a result of the reserve effect boosts catches by around 5%.
This scenario leads to short-term losses, because of the restrictions and investment involved. At the same time, it reduces the dependence of the island to a unique form of tourism and especially guarantees the quality of natural capital, and thus secures the level of benefit linked to ecosystem services. The jobs created are skilled and non-seasonal and environmental pressures - summer population density, water and energy consumption, waste production, disturbance of biodiversity - are reduced. The development of the island is driven by the exploitation of local natural and cultural resources, and takes place in a constant concern of sustainability, while observing especially the carrying capacity of the ecosystems according to the different uses.
Comparison of costs and benefits associated with the various scenariosFrom the perspective of local populations, the operating budget NMPZ, largely funded by national and European public expenditures, is a benefit and not a cost because this money is injected into the local economy. In fact, jobs are funded; local Businesses provide goods or services to NMPZ, etc. Thus, the abandonment of NMPZ as an extreme outcome of the Business-as-usual scenario would cause a loss to the local development estimated at about ten million € per year, due to the decrease in the budget of the PAMB. On this point, the Quality scenario would not see significant change while the preserving scenario would increase its spending, leading to increased expenses related to NMPZ.
Figure 34. Evolution of the NMPZ management budget (in €)
600,000
100,000
0
700,000
300,000
Scenario 3Scenario 2Scenario 1
500,000
2006
2008
2010
2012
2014
2016
2018
2020
2007
2009
2011
2013
2015
2017
2019
400,000
200,000
Source: Plan Bleu, based on case study’s data
The sector generating by far the highest profits is tourism, making between €130 and €200 million per year depending on the scenario. This is followed by real estate, construction and retail, then agriculture and finally fishing, lagging far behind.
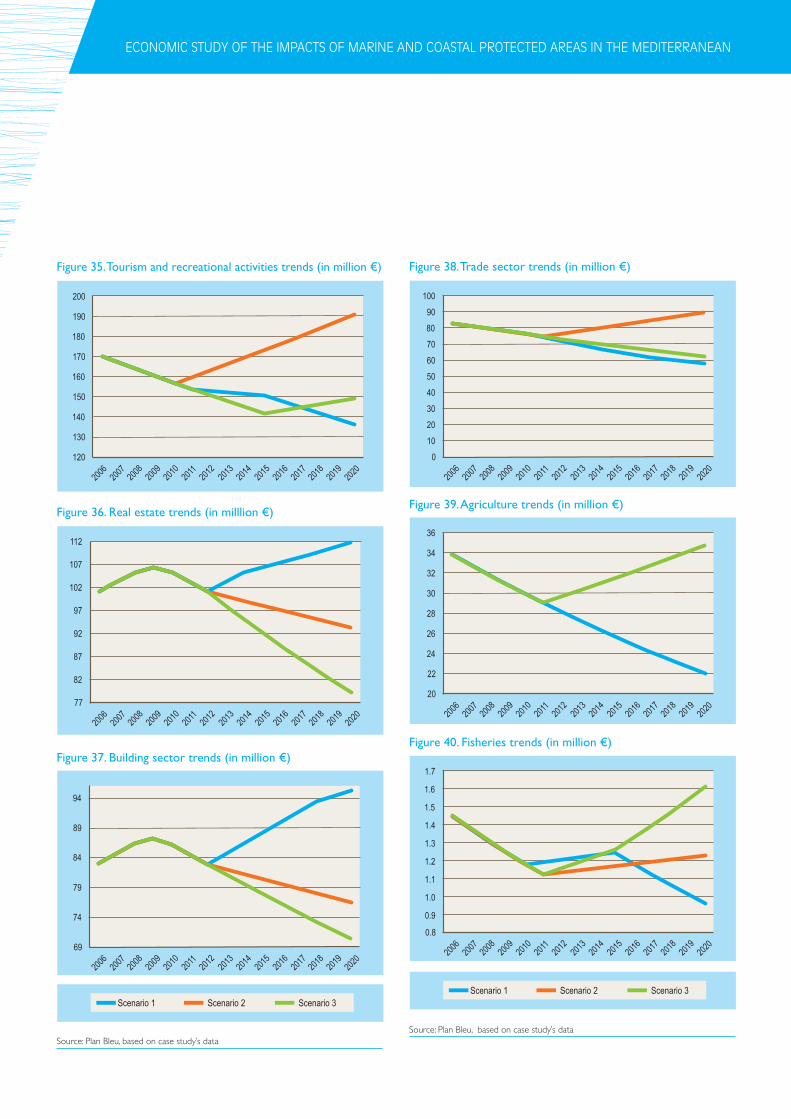
ECONOMIC STUDY OF THE IMPACTS OF MARINE AND COASTAL PROTECTED AREAS IN THE MEDITERRANEAN
Figure 35. Tourism and recreational activities trends (in million €)
Scenario 3Scenario 2Scenario 1
180
140
120
200
160
2006
2008
2010
2012
2014
2016
2018
2020
2007
2009
2011
2013
2015
2017
2019
190
170
150
130
Figure 36. Real estate trends (in milllion €)
Scenario 3Scenario 2Scenario 1
97
77
112
87
2006
2008
2010
2012
2014
2016
2018
2020
2007
2009
2011
2013
2015
2017
2019
107
102
92
82
Figure 37. Building sector trends (in million €)
Scenario 3Scenario 2Scenario 1
89
74
69
94
79
84
2006
2008
2010
2012
2014
2016
2018
2020
2007
2009
2011
2013
2015
2017
2019
Scenario 3Scenario 2Scenario 1
Source: Plan Bleu, based on case study’s data
Figure 38. Trade sector trends (in million €)
80
20
0
100
40
Scenario 3Scenario 2Scenario 1
60
2006
2008
2010
2012
2014
2016
2018
2020
2007
2009
2011
2013
2015
2017
2019
10
30
50
70
90
Figure 39. Agriculture trends (in million €)
Scenarios 2 and 3Scenario 1
34
24
20
36
30
22
26
32
28
2006
2008
2010
2012
2014
2016
2018
2020
2007
2009
2011
2013
2015
2017
2019
Figure 40. Fisheries trends (in million €)
1.6
1.0
0.8
1.7
1.2
Scenario 3Scenario 2Scenario 1
1.4
2006
2008
2010
2012
2014
2016
2018
2020
2007
2009
2011
2013
2015
2017
2019
1.5
1.3
1.1
0.9
Scenario 3Scenario 2Scenario 1
Source: Plan Bleu, based on case study’s data

PLAN BLEU PAPERS N° 13
Scenario 1 (Business-as-usual) generates the most benefits associated with real estate and construction, while Scenario 2 (Quality) encourages the benefits linked to tourism, retail and agriculture like the Conservation scenario does. The latter would also help fishing generating the maximum benefits in the long run. Thus, depending on which option is chosen, the different local stakeholder categories will be more or less advantaged. This may generate conflicts and encourage the implementation of compensatory measures.
For the Business-as-usual scenario, the damaged one is the environment and forwards all the people. However, the latter belong to the future generations and are therefore silent and intangible stakeholders. What compensation can be considered in these circumstances? Will capital accumulation (especially technical capital) be enough?
The following table presents the gains and losses of the quality and Conservation scenarios compared to the Business-as-usual scenario. A positive balance represents a gain compared to the Business-as-usual scenario, and a negative balance, a loss.
According to this prospective study over the period 2011-2020, the Quality scenario could represent a gain of more than €300 million compared to the Business-as-usual scenario, while the Conservation scenario would imply a loss of about €175 million. These gains and losses are linked to the proportion of economic activities related to NMPZ and taken into account in the study.
The Quality scenario seems to be the one that would generate the most profit for a slightly higher cost to the current cost (from
52 I 53
approximately €400,000 to €600,000). This is consistent with the current vision of the MCPAs as tools for rational management of resources. Conversely, the scenario of preservation that would be imposing strict regulation to economic considerations would be both the most expensive and the one that would generate the lowest profit. The Busines-as-usual scenario would imply lower environmental regulation than today inside and outside the NMPZ, which would allow a return to short-term growth.
CONCLUSIONDetermining the impact of the NMPZ on the development of the island of Zakynthos is a task that involves many scientific fields in which knowledge is incomplete and methodologies are still being developed. The exploratory study presents, in a first step, an overview of relations between local development and protection actions by observing specifically the use of ecosystem services provided in the NMPZ. In second time, prospective scenarios are proposed in order to enlighten the spread of these linkages in different circumstances. The figures given to illustrate the scenarios are estimations of what might happen but neither goals nor forecasts..
In 1999, the creation of the NMPZ in the middle of an area undergoing major tourist development has led to conflicts between supporters of “classic” development generating short-term benefits, and advocates of alternative development, the benefits of which are sustainable over the long term, and which involves the protection of ecosystems in general and the Caretta Caretta turtle in particular.
Table 9. Comparison of the Quality and Conservation scenarios to the Business-as-usual scenario (in million €)
Year
s
Benefits linked to fisheries
Benefits linked to agriculture
Benefits linked to tourism & recreational
activities
Benefits linked to the building sectot
Benefits linked to the trade sector
Benefits linked to real estate Total
Qua
lity
scen
ario
Con
serv
atio
n sc
enar
io
Qua
lity
scen
ario
Con
serv
atio
n sc
enar
io
Qua
lity
scen
ario
Con
serv
atio
n sc
enar
io
Qua
lity
scen
ario
Con
serv
atio
n sc
enar
io
Qua
lity
scen
ario
Con
serv
atio
n sc
enar
io
Qua
lity
scen
ario
Con
serv
atio
n sc
enar
io
Qua
lity
scen
ario
Con
serv
atio
n sc
enar
io
2011 -0.07 -0.07 0.00 0.00 6.28 0.00 0.00 0.00 0.76 0.76 0.00 0.00 6.97 0.692012 -0.07 -0.05 1.45 1.45 10.10 -2.46 0.00 0.00 4.48 1.49 0.00 0.00 15.95 0.432013 -0.07 -0.03 2.89 2.89 13.98 -4.86 -2.49 -3.32 8.15 2.17 -3.04 -5.06 19.42 -8.202014 -0.07 0.00 4.31 4.31 17.93 -7.20 -5.00 -6.63 11.80 2.83 -6.10 -10.07 22.86 -16.772015 -0.07 0.02 5.72 5.72 22.56 -8.87 -7.54 -9.95 15.41 3.45 -8.14 -13.97 27.93 -23.612016 0.00 0.15 7.11 7.11 29.04 -4.43 -10.10 -13.27 18.99 4.03 -10.19 -17.81 34.86 -24.21
2017 0.07 0.27 8.50 8.50 35.53 -0.04 -12.69 -16.59 22.54 4.59 -12.23 -21.57 41.72 -24.842018 0.14 0.40 9.88 9.88 42.03 4.30 -15.31 -19.92 25.46 4.49 -14.28 -25.26 47.92 -26.112019 0.20 0.52 11.25 11.25 48.55 8.60 -17.02 -22.32 28.38 4.40 -16.33 -28.88 55.04 -26.432020 0.27 0.65 12.61 12.61 55.09 12.86 -18.74 -24.70 31.32 4.32 -18.38 -32.44 62.17 -26.71
Total 0.32 1.86 63.72 63.72 281.08 -2.11 -88.87 -116.69 167.29 32.53 -88.69 -155.06 334.84 -175.75
Source: Plan Bleu, based on case study’s data

ECONOMIC STUDY OF THE IMPACTS OF MARINE AND COASTAL PROTECTED AREAS IN THE MEDITERRANEAN
The development model that has prevailed on the island since the 1980s was characterised by strong growth in GDP, employment and demographics, but also in environmental pressures. The creation of the NMPZ slowed these trends within the MCPA, in particular through usage restrictions and planning tools. Protection also improved the quality of tourism products provided in Zakynthos.
Nonetheless, since the early 2000s the tourism industry is falling, with stagnation of the overnight stays in Zakynthos and a decrease in tourism revenues. This decline shows that it is time to shift the touristic paradigm to regain growth.
Therefore, some praise the environmental assets of the island for tourism. In this perspective, the NMPZ would be an ally for development. The Quality scenario illustrates this possibility.
However, the current economic crisis favors options requiring the least investment and allowing the maximum short-term profit. In this perspective, the use restrictions imposed by inside the NMPZ would be an obstacle to development since it would in particular constrain resource exploitation, limit frequentation of some areas and prohibits some practices. The Business-as-usual scenario illustrates this perspective assuming that the environment would be degraded due to lower expenditure on environmental protection and to lowering the regulation of uses within the NMPZ.However, the preservation of the environment is an important issue that involves some important stakeholders. In the event that these stakeholders would succeed in imposing themsleves, the Conservation scenario illustrates _ certain trends that could happen.
The different scenarios – Business-as-usual, quality and conservation – are deliberately starkly contrasting.. The comparison of the scenarios in terms of net benefits shows that the the Quality scenario would be the most profitable to the local economy, although this option is less likely to happend tahn the Business-as-usual scenario as the formar involves higher costs.
The uncertainties, particularly those related to the lack of available data and the reliability of the data that does exist, prevent a true cost-benefit analysis from being conducted, and have led to reduce the prospective timeline up to 2020.
Obtaining more data on site usage and natural characteristics (marine ecosystems, fish stocks, carrying capacity, waste absorption capacity, etc.) would strengthen this exploratory study.

PLAN BLEU PAPERS N° 13 54 I 55
MOUNT CHENOUA-KOUALI COVESa potentiel MCPA
This summary is based on the study report, “Projet d’Aire Marine Protégée sur le site du Mont Chénoua et des Anses de Kouali : étude des effets potentiels sur le développement du territoire” produced by Mr. Saïd Chakour.
After creating its first MCPA in the Habibas islands in 2003, Algeria selected another five sites eligible for this status, as part of a massive coastal management project. One of these sites is Mount Chenoua-Kouali Coves, situated in the province (wilaya) of Tipaza, to the north of the central Algerian Tell and adjoining the wilaya of Algiers. Tipaza comprises ten daïra (counties) and 28 municipalities, spread over an area of 1,707 km² and 123 km of coastline. Tipaza province is traversed by four mountain chains that include the Blida Atlas, the Dahra and Zaccar mountains and Mount Chenoua. The Mazafran, El-Hachem, Djer and Damous rivers form an extensive water network on the Mitidja plain.
Figure 41. Geographical and natural features of Tipaza Province
Source: Coastal Area Management Plan, CAMP, MATE, 2006.
Agriculture is an important activity in the whilaya of Tipaza and fishing is also a major occupation. Furthermore the natural and cultural features of the province, by the sea and near the mountains and the presence of roman ruins, represent considerable potential for tourism.
The proposed site for the creation of the MCPA is in the Bay of Bou Ismail, Tipaza, 70 km west of Algiers, covering a land area of 8,000 ha and a marine area of 2,000 ha. This area is currently still relatively untouched by pollution and environmental degradation, however, these pressures are likely to increase due to the increase in tourists, attracted by the diversity of environmental assets and landscapes. In addition to the topographic and climatic characteristics, this
tourist attractivness is also based on the presence of endemic, rare or protected species, such as Posidonia oceanica seagrass beds and Vermetid reefs (endemic to Sicily, Palestine and Algeria).
Economic development is not planned in Tipaza and environmental pressures are not addressed. The creation of a MCPA would provide guidance to local development towards more sustainability. The study carried out is based on the analysis of current and past trends in the area, to provide a prospective analysis building on the potential costs and benefits generated by the creation of the MCPA for local development.
THE MCPA, A MANAGEMENT TOOL FOR SUSTAINABLE RESOURCE USE AND TOURISM
The demographic and economic growth of the wilaya of TipasaIn 2010, the population of Tipaza Province was estimated at 610,285 inhabitants by its own Department of Health and Population (DSPT), with an average rate of natural growth between the last two censuses58.of 1.6 % per year. This demographic trend is accompanied by a marked increase in human activity throughout
58 RGPH (Population and Habitat Census) 1998 and RGPH 2008.
Figure 42. Administrative map of Tipaza Wilaya
Source: Wikipedia, http://fr.wikipedia.org/wiki/Wilaya_de_Tipaza

ECONOMIC STUDY OF THE IMPACTS OF MARINE AND COASTAL PROTECTED AREAS IN THE MEDITERRANEAN
the province. The population density has risen from 296 people per km² in 1998 to 357 people per km² in 2010, an increase of 20% in twelve years.
The population is rather young with 66% people aged under 3559. Tipaza province is attractive and experiences a large positive migration flows compared to other provinces in the country. The population is urban in the majority, with 58% living in the urban area of the capital city and 19.6% in secondary towns. The population growth in the urban areas of the province is particularly marked in coastal locations, while rural areas are declining.
The unemployment rate in the province is lower than the national average (respectively 7.4% and 9.7%). Nevertheless, many jobs remain precarious, being temporary or seasonal, mainly linked to tourism. In fact, only 26% of jobs are permanent, according to the province’s Department of Labour. The main employer is the building and public works sector with 45% of employment in the province. Agriculture is in second place, with 19% of jobs and the service sector comes in third, with 15%.
The province has around 16,000 economic entities of which approximately 9,000 (or 56%) are in retail and 5,000 (or 31%) in the service sector60, which is high nationally, yet relatively low for the particularly dynamic North-Central region. In 2007, Tipaza totalled 1.7% of national GDP, or 1,8 billion €.
Attention is drawn on the fact that the municipalities included in the potential MCPA have a population density six times higher than the rest of the province, or about 1800 inhab. / Km². This high density shows the need of limiting the human impact on the area while balancing environmental protection and well-being. In order to develop efficient ways to meet these objectives, it should be advocate for the inclusion of a terrestrial part within the future MCPA.
Three key activities: tourism, agriculture and fishingBesides the coast and the mountains, Tipaza province possesses a wide variety of historical sites and remains as well as a renowned artisanal tradition, all of which helps to promote tourism61, resulting in a considerable influx recorded each year. During the 2010 summer season,more than 21 million visits were counted, according to the Department of Tourism, including about 430,000 visits to the proposed MCPA site. Tipaza has an extremely varied landscape: while tourism is focused primarily on seaside resorts (with 52 beaches, of which 43 are open for swimming), other types of tourism, such as mountain tourism or more generally, nature tourism, are increasing their market share.
Due to the low tourist capacity, with less than 3,000 beds in hotels and less than 7000 beds in campings, rental informal renting of private accommodation during the summer season is a widespread practice.
59 Statistical Yearbook, DPSB, 2010.60 National Statistics Office, 2011.61 Traditional pottery, ceramic art, basketry, rugs, embroidery, wood carving, copper processing, etc.
With 5 ports and 593 boats, fishing is also an important economic activity for Tipaza province. Despite the boost in fishing activities between 2005 and 2011 and an increase of over 50% in registered seafarers between 1999 and 2010, fish production fell. Between 2005 and 2011, catch level was about 10,000 tonnes, currently totalling about 6,700 tonnes. This decrease may reflect that the sustainable threshold of fish catch has been exceeded which limit the renewal ability of the stock. This phenomenon is an argument for rational management of resources in order to return fish stocks to a good state and maintain healthy catch volumes over the long term.
Figure 43. Fish catch (in tons)
2005 2006 2007 2008 2009 2010 2011
Fish catchs 10,743 16,944 13,503 10,108 9,224 4,934 6,674
18,000
16,000
14,000
12,000
10,000
8,000
6,000
4,000
2,000
0
Tons
(t)
Data source: DPRH, Tipaza 2011
With regard to agriculture, cereal and market gardening dominate the local production system and together occupy nearly half of the usable agricultural area (UAA), covering about 24% each. The agricultural system is based on three major agro-climatic zones: the Sahel, which encompasses the entire coastline’s UAA, dedicated essentially to market gardening, the Mitidja plain, characterised by intensive agriculture supported by the establishment of a 14,000 ha irrigated area with the potential to develop a dairy industry, and the mountains of Dahra, Zeccar and Chenoua, which are particularly well-suited to rural tree crops as well as local cattle and goat raising.
The MCPA project, a response to the risk of environmental degradationWith an area of 40,315 ha, forests and maquis occupy 24% of the territory of Tipaza province. Sixty-eight percent of the forests are concentrated in the west, where the predominant species are Holm oak and Aleppo pine, whose value in terms of ecological regulation services is important62, while maquis scrub occupies 17% of the forest area.
62 In addition to CO2 sequestration services and their effect on the “oxygen footprint”, the Aleppo pine and Holm oak play a key role in creating a microclimate that promotes rainfall, which is so essential to the local ecosystem and conducive to economic activities such as agriculture, fishing and tourism.

PLAN BLEU PAPERS N° 13 56 I 57
The coastline offers a variety of landscapes like beaches, coves, bays and cliffs. The seabed is highly diverse, both in terms of sediment and biology, including the presence of many Posidonia seagrass meadows.
The area which may be protected under the proposed MCPA is known as being a propagation and reproduction area for hundreds of species including endangered species, some of which are threatened with extinction and present both on the IUCN Red List and in Appendix II of the Protocol on Specially Protected Areas. Regarding marine biodiversity in particular, the presence of vermetid reefs, bio-constructions reaching an average width of one metre, as well as outcrops of coralline algae (Corallina elongata) characteristic of good water quality. Key species such as Posidonia and Grouper are also present and contribute in particular to the provision of amenity and recreational support by ensuring their ecological functions (as habitat function, biological control ...). They also offer valuable underwater landscape positive for diving and tourism in general. In addition, the presence of these species is a good biological indicator of the marine environment while being also highly vulnerable.
According to the Environment Directorate of Tipaza province, rapid urbanisation has resulted in a reduction of agricultural land, overexploitation of water resources and contributes to erosion. It also induces degradation of natural environments trhough high tourist frequentation especially on as beaches. Urban pollution from untreated sewage and a proliferation of solid waste create additional pressures on the coastline. There is also damage from discharges of untreated wastewater from the municipalities of Chaiba, Atatba and Kolea.. According to these observations, it seems that the state of the environment is better in the west part of the potential MCPA.
The degradation of the dune belt due to illegal mining of sand is also causing serious damage on the coastline. Whereas the overuse of water increase the risk of salinization of groundwater dedicated to private and agricultural uses, and threatens many coastal ecosystem’s equilibrium.
Some abusive fishing practices also pose a danger to marine ecosystems; trawling particularly threatens the sustainability of artisanal fisheries.
In the context of the emergence of a environmental protection policy of the Algerian coast the pressures on the Bay of Bou Ismail and the increase of these threats are the reason for the selection of this site as an MCPA project.
The MCPA project demonstrating the emergence of Algerian coastal protectionThe outcome of a long institutional journeyIn the Mediterranean, the aim of widespread protection of marine areas falls within the legal and policy framework of the Barcelona Convention and the UN Convention on Biodiversity, signed in 1992. At national level, in its economic stimulus plan, Algeria refers to “environmental investments, particularly along the coastlines, given
the strong demographic and economic growth that characterises these areas63”.
Algeria is in fact entering a phase of implementation of international policies for the conservation of coastal areas. National legislation has evolved in recent years to integrate sustainable development criteria into the management of coastal and marine areas, as evidenced by the promulgation of the 2001 law on land use, together with coastal law 02-02 of 5 February 2002, followed by the Costal Area Management Programmes (CAMPs)64 and law 11-02 of 17 February 2011 on protected areas. These laws also extend legal provisions to marine areas in order to guarantee their conservation, and combate accidental pollution of the marine environment. In addition, presidential decrees define specific conservation objectives.
The national action plan for the creation of MCPA identifies the outlines and main orientations of the protection process initiated in the mid-1990s. This MCPA creation policy counts with the prospect of expanding some Natioanl Parks or Natural Reserves to the adjacent marine environment, particularly in the centre and east of the country65 and with the creation of new protected areas.
The body in charge of the protection of the coastline (Commisariat National du Littoral - CNL) proposes to the Ministry of Land Planning, Environment and Tourism (MATET), the different MCPA to create, as a management tool for sustainable development in sensitive coastal territories. The Mount Chenoua-Kouali Coves MCPA project fits into this framework for the province of Tipaza.. In this context, a mechanism involving the CNL, local authorities and administrations and the public (NGOs), aims to develop collaborative management.
The strategy defined by the CNL and the MATET ensures that conservation and enhancement of natural environments and sites will be the first goal of the MCPA, while balancing the protection with the various activities practiced. The project also aims to strengthen MATET’s institutional capacities for protecting coastal areas, their biodiversity and natural resources. The project is also seeking to define, test and implement strategies and methods of protection and integrated management of coastal areas for improving quality of life, job creation and preservation of natural and cultural capital, thus promoting the emergence of new national capacities for development and protected areas.
The protection of the Mount Chenoua and the Kouali CovesThe study area supposed to become a MCPA is a breeding ground for commercial species that contributes to the fishing economy due to the fish stocks that are made available, especially for the fishermen of Bou Haroun. Creating a reserve in this area would,
63 Chakour et al 2010.64 The CAMP is a coastal territorial planning instrument initiated by the Ministry of Land Planning, Environment and Tourism (MATET) that is led by the Department for the Environment in each coastal wilaya – Algerian Coastal development Act, 2003.65 Reflected in the laws on national parks and nature reserves (Algerian Act no. 83-03 for the protection of the environment, 5 February 1983 - Decree no. 83-458 on the status of national parks, 23 July 1983).

ECONOMIC STUDY OF THE IMPACTS OF MARINE AND COASTAL PROTECTED AREAS IN THE MEDITERRANEAN
Table 10. Summary of the major MCPA creation projects in Algeria
of future impacts of the MCPA on fishing and tourism, two different approaches have been developed. For the fisheries sector, two scenarios have been defined, one with the establishment of MCPA status and the other without. Using data from and interviews with local fishermen scenarios have been set and highlighted two contrasting trends.
For tourism, field surveys conducted among visitors were carried to estimate the willingness to pay (WTP) depending on the state of the biodiversity. The level of WTP represents the cost level that visitors are ready to assume for benefiting from a particular level of environmental quality. The variation of the environmental quality is supposed to be linked to the existence and activities of the MCPA. Thus three states of biodiversity have been defined: • A first scenario involving biodiversity “in very good condition”
with the existence of a MCPA deploying a important protection,• a second scenario with biodiversity “in good condition”
corresponding to a MCPA more moderated than previously • and a third scenario without the creation of a MCPA and
consequently, with biodiversity in “bad condition”.
Regarding fisheries, the current level of catches is about 6700 tons, and the average price is 450Da/kg - about € 4.50 - representing a turnover of around € 30 million. The creation of a MCPA as envisaged would induce the establishment of a no-take zone in order to increase the biomass inside in the scope of the MCPA and outside by spillover (or reserve effect). In the short run, the prohibition of fishing in this area could result in a loss for fishermen, but in the long run it could guarantee their income at the same level or above. Thus it seems that the involvement of local stakeholders in the process of creation of the MCPA would be important. It is in fact called by them.
Regarding now tourism, the current number of visits to the Bay of Bou Ismail is estimated at about 430,000 per year, and spending per visits 2,000 Da – about €20, which represents of around €8.6 million. In the conducted survey visitors declared willing to pay 10% more if biodiversity was well preserved, and 5% less if it was not, i.e. a variation of €1.7 million considering each visitor comes only once and the number of visits remains constant. This humble estimation thus argues for the protection of the bay, which would generate additional income for inhabitants.
CONCLUSIONAt the heart of the province of in Tipaza which urban area are booming especially in coastal areas , the site of Mount Chenoua-
Name El Kala National Park (PNEK)
Gouraya National Park (PNG)
Taza National Park (PNT) Rechgou Island Mount Chenoua-Kouali
Coves MCPAResponsible authority/ administration Forestry Department Forestry
Department Forestry Department Ministry of Land Planning and Environment (MATE)
Ministry of Land Planning and Environment (MATE)
Managing body El Kala National Park Gouraya National Park Taza National Park Commissariat National du
Littoral (CNL)Commissariat National du Littoral (CNL)
Source: Chakour et al., 201166 .
according to the CAMP 2006 report, contribute to the sustainable management of fisheries resources and to restocking areas under pressure, particularly for demersal species.
The MCPA project would be count three areas: • a totally protected area (zone I) with for example the ban of
picking, fishing and hunting, ban of recreational activities, strictly controlled access, limited anchoring for emergencies, etc.);
• a buffer zone (zone II) with medium high level of protection, where excractive used could be banned and recreational activities regulated by some restrictions;
• and a peripheral zone (zone III) with a lower level of protection.
Table 11. Geographical zones of the MCPA
Zone Area BoundaryZone I Chenoua Chenoua Point – MatarèsZone II Tipaza Tipaza marine area (bounded on the east side
by Kouali Cove and on the west by Matarès)Zone III Kouali Kouali Coves
Source: CAMP 2006
PROSPECTIVE ANALYSIS FOR FISHING AND TOURISMConsidering local economic activities, the MCPA project for the Mount Chenoua-Kouali Coves MCPA is supposed to eventually influence local development in Tipaza through fishing and tourism.
Insofar as very little data is available locally and the Mount Chenoua-Kouali Coves MCPA is still only in the planning phase, a decision was made not to undertake a cost-benefit analysis, which was considered too ambitious for an ex ante analysis and instead, to conduct merely an analysis of the impact of the MCPA on the two variables assumed to have the greatest impact: fishing and tourism. However, despite local data collection efforts and given the uncertainty of the assumptions underlying the analysis presented here, the results of the study are presented as a guide. Further work would be needed for a better analysis of the linkages between the MCPA and local development..
The analysis of the linkages between MCPA one hand and fishing and tourism on the other hand, is established in the first instance on a retrospective study trying to determine the strength these likages. Then, in order to provide prospective trends and magnitude
66 Chakour et al, 2011. Economics of (MPAs) and Coastal Environmental Governance in the Western Mediterranean. EMECS: Environmental Management for Enclosed Coastal Seas Global Summit on Coastal Seas August 28-31, 2011 Baltimore, Maryland, USA.

PLAN BLEU PAPERS N° 13 58 I 59
Kouali Coves counts remarkable natural and cultural features. Facing the intense development of the area, particularly tourism, and the importance of fishing in local economy and facing the lack of infrastructure to manage reduce and mitigate environmental damages resulting there from, the implementation of a MCPA would be a tool for the sustainable development of the area.
The project of creating a MCPA on the site of Mount Chenoua- Kouali Coves would be a key element of the land planning and conservation policy of the Algerian coast. However, despite the important ecological incentives for this protection, this project is also called to contribute to local development and well-being.
This ex-ante exploratory study aims to clarify the local socio-economic dynamics and its links with the environmental state to determine the desirability of a MCPA and highlight the potential benefits that the MCPA could provide, regarding especially fishing and tourism.

ECONOMIC STUDY OF THE IMPACTS OF MARINE AND COASTAL PROTECTED AREAS IN THE MEDITERRANEAN
TABLE OF ILLUSTRATIONS
LIST OF FIGURESFigure 1. Marine and Coastal Protected Areas in the Mediterranean .........................................................................................................................................................................................................7
Figure 2. Administrative map of Tunisia .......................................................................................................................................................................................................................................................................20
Figure 3. Population concentration in the governorate of Monastir ........................................................................................................................................................................................................21
Figure 4. Proposed zoning for the MCPA .................................................................................................................................................................................................................................................................23
Figure 5. Evolution of benefits and costs from 2010 to 2030 - Scenario 1 (in thousands of €) ..............................................................................................................................................24
Figure 6. Evolution of benefits and costs from 2010 to 2030 - Scenario 2 (in thousands of €) ..............................................................................................................................................25
Figure 7. Evolution of benefits and costs from 2010 to 2030 - Scenario 3 (in thousands of €) ..............................................................................................................................................26
Figure 8. Compared evolution of benefits and costs from 2010 to 2030 (in thousands of €) .................................................................................................................................................27
Figure 9. Present value of benefits linked to extractive uses (in thousands of €) .............................................................................................................................................................................27
Figure 10. Present value of benefits linked to non extractive uses (in thousand of €) ..................................................................................................................................................................27
Figure 11. Alt Empordà district, province of Girona, autonomous community of Catalonia, Spain .........................................................................................................................................29
Figure 12. Per-sector breakdown of GDP in 2010 ..............................................................................................................................................................................................................................................30
Figure 13. Zoning of the Natural Park of Cap de Creus .................................................................................................................................................................................................................................32
Figure 14. Evolution of benefits and costs - Scenario 1 (in thousands of €) ........................................................................................................................................................................................33
Figure 15. Evolution of benefits and costs - Scenario 2 (in thousands of €) ........................................................................................................................................................................................34
Figure 16. Evolution of benefits and costs - Scenario 3 (in thousands of €) ........................................................................................................................................................................................35
Figure 17. Comparative costs evolution (in thousands of €).........................................................................................................................................................................................................................36
Figure 18. Comparative benefits evolution (in thousands of €) ..................................................................................................................................................................................................................36
Figure 19. Presend value of benefits linked to tourism (in thousands of €) .........................................................................................................................................................................................36
Figure 20. Present value of other benefits (in thousands of €) ....................................................................................................................................................................................................................36
Figure 21. The SEPA of Kas-Kekova .............................................................................................................................................................................................................................................................................38
Figure22. Number of protected marine species during monitoring of the Western part of the SEPA ...........................................................................................................................40
Figure 23. Evolution of benefits and costs - Scenario 1 (in thousands of €) ........................................................................................................................................................................................42
Figure 24. Evolution of benefits and costs - Scenario 2 (in thousands of €) ........................................................................................................................................................................................42
Figure 25. Evolution of benefts and costs - Scenario 3 (in thousands of €) .........................................................................................................................................................................................43
Figure 26. Compared evolution of benefits (in thousands of €) .................................................................................................................................................................................................................44
Figure 27. Compared evolution of costs (in thousands of €) .......................................................................................................................................................................................................................44
Figure 28. Presend value of benefits linked to tourism (in thousands of €) .........................................................................................................................................................................................45
Figure 29. Present value of other benefits (in thousands of €) ....................................................................................................................................................................................................................45
Figure 30. Zakynthos island ...............................................................................................................................................................................................................................................................................................46
Figure 31. Zakynthos GDP breakdown per branch ............................................................................................................................................................................................................................................47
Figure 32. Linkages between driver, pressure and state variables of local development ...............................................................................................................................................................48
Figure 33. NMPZ zoning .....................................................................................................................................................................................................................................................................................................48
Figure 34. Evolution of the NMPZ management budget (in €) ...................................................................................................................................................................................................................51
Figure 35. Tourism and recreational activities trends (in million €) ............................................................................................................................................................................................................52
Figure 36. Real estate trends (in milllion €) .............................................................................................................................................................................................................................................................52
Figure 37. Building sector trends (in million €) ......................................................................................................................................................................................................................................................52
Figure 38. Trade sector trends (in million €) ...........................................................................................................................................................................................................................................................52
Figure 39. Agriculture trends (in million €) ..............................................................................................................................................................................................................................................................52
Figure 40. Fisheries trends (in million €) ....................................................................................................................................................................................................................................................................52
Figure 41. Geographical and natural features of Tipaza Province ................................................................................................................................................................................................................55
Figure 42. Administrative map ofTipaza Wilaya .....................................................................................................................................................................................................................................................55
Figure 43. Fish catch (in tons) ..........................................................................................................................................................................................................................................................................................56

PLAN BLEU PAPERS N° 13 60 I 61
LIST OF TABLESTable 1. Hypotheses for the prospective quantitative analysis of the Kuriat Islands, Cap de Creus, and Kas Kekova sites .....................................................................................12
Table 2. Characteristics of the MCPAs studied ......................................................................................................................................................................................................................................................15
Table 3. Present value of benefits and costs for the Spanish, Tunisian and Turkish sites (in thousands €) ...........................................................................................................................17
Table 4. Present value of benefits and costs from 2010 to 2030 (in thousands of €) ...................................................................................................................................................................26
Table 5. Present value of benefits and costs from 2010 to 2030 ...............................................................................................................................................................................................................35
Table 6. Present value of benefits and costs from 2010 to 2030 ...............................................................................................................................................................................................................44
Table 7. Weighting retrospective trends for driving forces, pressures and state variables related to socioeconomic development and to the work of NMPZ .......49
Table 8. Weighting prospective trends of the driving forces, pressures and state variables related to socioeconomic development and to the action of NMPZ, for three scenarios ............................................................................................................................................................................................................................................................................................................50
Table 9. Comparison of the Quality and Conservation scenarios to the Business-as-usual scenario (in million €) ......................................................................................................53
Table 10. Summary of the major MCPA creation projects in Algeria .......................................................................................................................................................................................................58
Table 11. Geographical zones of the MCPA ............................................................................................................................................................................................................................................................58
Plan Bleu pour l’environnement et le développement en Méditerranée15, rue Beethoven, Sophia Antipolis, 06560 Valbonne
+33 (0)492 387 130 - www.planbleu.org
ISBN 978-2-912081-37-7