marine biological survey pinellas county shore … · pinellas county shore protection project...
TRANSCRIPT

Marine Biological SurveyPinellas County Shore Protection Project
Comprehensive Borrow Area Study
February 2002
Prepared for:Jacksonville District
U.S. Army Corps of Engineers400 West Bay Street
Jacksonville, FL 32202
Prepared by:Dial Cordy and Associates Inc.
490 Osceola AvenueJacksonville Beach, FL 32250

Final Marine Biological Survey, Pinellas County SPP Dial Cordy and Associates Inc.February 26, 2002
ii
EXECUTIVE SUMMARY
Dial Cordy and Associates, Inc. (DC&A) was contracted by the U.S. Army Corps ofEngineers (USACE) to conduct a biological survey of proposed borrow areas in conjunctionwith the Pinellas County Shore Protection Project. The barrier island beaches of PinellasCounty, Florida have had serious problems with shoreline erosion and a lowered beach profilecaused by storms, wave action, and currents. To accommodate future nourishment projects,nine offshore borrow areas and four ebb tidal shoals have been identified for consideration asprobable borrow sites. Two nearshore areas for use as potential breakwater areas were alsoidentified and mapped for marine resources.
Prior side-scan mapping showed extensive areas of consolidated material within each of theproposed borrow areas (2,309 acres). This survey was used to map and characterize the extentof marine resources in relation to the previous side-scan survey. In total over 15,000 acres ofseafloor were mapped using towed video, diver surveys and integrated GIS mapping. Habitatsidentified with towed video mapping were further characterized by diver surveys. Duringdiver and video surveys living hardbottom resources were characterized by percent coverageand relief. Dominant fishes and invertebrates were also documented. An additional 1,519.6acres (3,828.6 acres total) of live-bottom habitats were identified and mapped within thisstudy. Within the offshore borrow areas, over 75 percent of the habitat surveyed was opensand (10,000.4 acres) while the remaining 3,828.6 acres consisted of hardbottom habitats.The ebb tidal shoal areas of John's Pass, Blind Pass, Pass-A-Grille, and Egmont Channel allconsisted of only open sand habitats.

Final Marine Biological Survey, Pinellas County SPP Dial Cordy and Associates Inc.February 26, 2002
iii
TABLE OF CONTENTS
Page
EXECUTIVE SUMMARY ....................................................................................................... II
LIST OF PHOTOGRAPHS.......................................................................................................V
LIST OF TABLES .....................................................................................................................V
LIST OF FIGURES...................................................................................................................VI
1.0 INTRODUCTION ...............................................................................................................1
1.1 Purpose and Need ...........................................................................................................11.2 Location ..........................................................................................................................1
2.0 TECHINCAL APPROACH ................................................................................................6
2.1 Towed Video Survey and Mapping ................................................................................62.2 Diver Survey and Characterization ...............................................................................14
3.0 MARINE RESOURCE CHARACTERIZATION ............................................................15
3.1 Overview of Marine Resources ....................................................................................153.1.1 Marine Algae............................................................................................................153.1.2 Invertebrates..........................................................................................................153.1.3 Fishes ....................................................................................................................173.1.4 Other Vertebrates ..................................................................................................19
3.1.4.1 Sea Turtles ........................................................................................................193.1.4.2 Marine Mammals ..............................................................................................20
3.2 Offshore Borrow Areas.................................................................................................203.2.1 Area A...................................................................................................................20
3.2.1.1 Habitat Description ...........................................................................................203.2.2 Borrow Area B......................................................................................................22
3.2.2.1 Habitat Description ...........................................................................................223.2.3 Borrow Area C......................................................................................................25
3.2.3.1 Habitat Description ...........................................................................................253.2.4 Borrow Area D......................................................................................................27
3.2.4.1 Habitat Description ...........................................................................................273.2.5 Borrow Area E ......................................................................................................27
3.2.5.1 Habitat Description ...........................................................................................30

Final Marine Biological Survey, Pinellas County SPP Dial Cordy and Associates Inc.February 26, 2002
iv
3.2.6 Borrow Area F ......................................................................................................303.2.6.1 Habitat Description ...........................................................................................30
3.2.7 Borrow Area G......................................................................................................333.2.7.1 Habitat Description ...........................................................................................33
3.2.8 Borrow Area H......................................................................................................333.2.8.1 Habitat Description ...........................................................................................35
3.2.9 Borrow Area I .......................................................................................................353.2.9.1 Habitat Description ...........................................................................................35
3.3 Ebb Shoal Borrow Areas ..............................................................................................383.4 Nearshore Breakwater Areas ........................................................................................38
3.4.1 North Reddington Beach Breakwater Area...........................................................383.4.1.1 Habitat Description ...........................................................................................38
3.4.2 Indian Rocks Beach Breakwater Area ..................................................................433.4.2.1 Habitat Description ...........................................................................................43
4.0 REFERENCES ..................................................................................................................44

Final Marine Biological Survey, Pinellas County SPP Dial Cordy and Associates Inc.February 26, 2002
v
LIST OF PHOTOGRAPHS
PagePhotograph 1 Area A scattered medium relief hardbottom ...............................................22
Photograph 2 Area of scattered low relief hardbottom in Area B .....................................25
Photograph 3 Sand diver (Synodus intermedius) in Area C ..............................................25
Photograph 4 Area C hardbottom with relief shown .........................................................25
Photograph 5 Large sponges with relief shown in Area D ................................................27
Photograph 6 Typical scattered low relief hardbottom in Area E......................................27
Photograph 7 Octocoral community within Area E...........................................................30
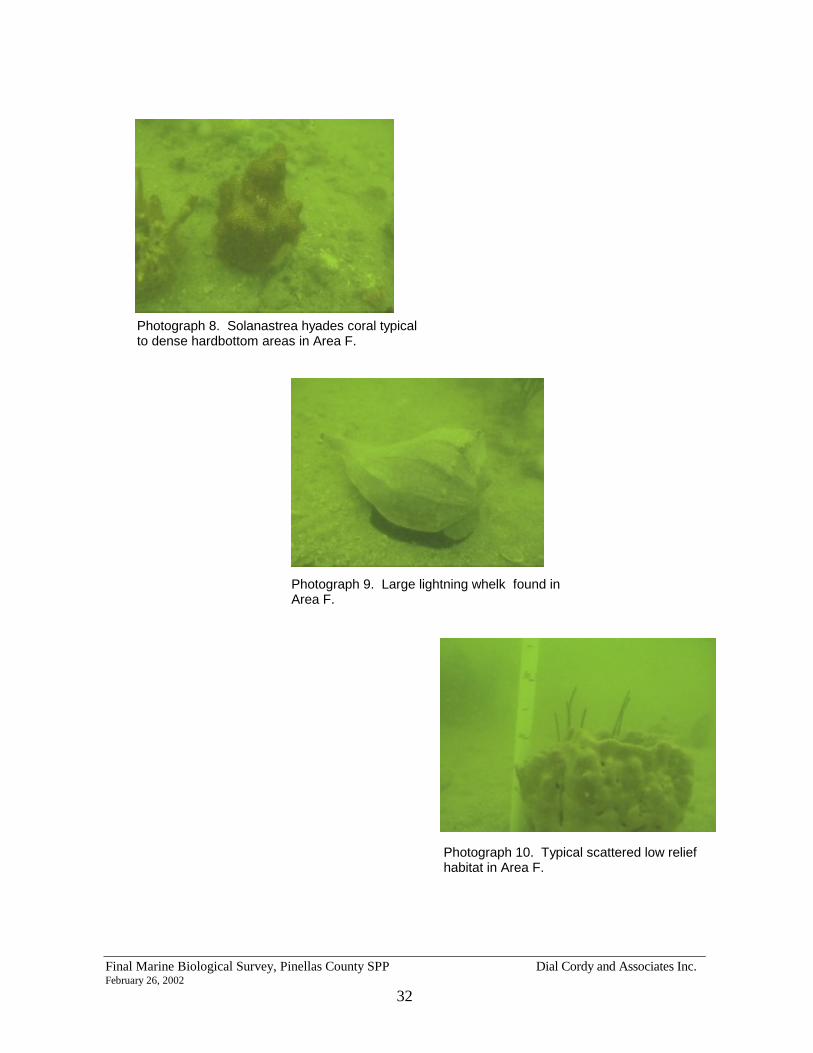
Photograph 8 Solanastrea hyades coral typical to dense hardbottom areas in Area F .......32
Photograph 9 Large lightning whelk found in Area F .......................................................32
Photograph 10 Typical scattered low relief habitat in Area G.............................................32
Photograph 11 Typical relief of scattered medium relief habitat in Area G........................33
Photograph 12 Typical relief of hardbottom in Area H.......................................................35
Photograph 13 Hard coral assemblage typical to Area I......................................................35
LIST OF TABLES
PageTable 1 Hardbottom Coverage Classifications Used to Map Marine Resources......................6
Table 2 Hardbottom Relief Classifications Used to Map Marine Resources ...........................6
Table 3 Dominant Invertebrate Species Observed During Borrow Area Surveys..................16
Table 4 Fishes Observed Within Borrow Area During Diving Surveys.................................18
Table 5 Summary of Loggerhead Sea Turtle Nesting from 1988-2000..................................19
Table 6 Summary of Marine Resource Cover Types Within Each Area Surveyed ...............23
Final Marine Biological Survey, Pinellas County SPP Dial Cordy and Associates Inc.February 26, 2002
vi
LIST OF FIGURES
PageFigure 1 Location Map.............................................................................................................2
Figure 2 Offshore Borrow Areas .............................................................................................3
Figure 3 Ebb Tidal Shoal Borrow Areas..................................................................................4
Figure 4 Nearshore Breakwater Areas .....................................................................................5
Figure 5 Borrow Areas A, B, C Transect Survey Lines...........................................................7
Figure 6 Borrow Areas D and I Transect Survey Lines ...........................................................8
Figure 7 Borrow Areas E, F, and G Transect Survey Lines.....................................................9
Figure 8 Borrow Area H Transect Survey Lines....................................................................10
Figure 9 Ebb Tidal Shoal Transect Survey Lines ..................................................................11
Figure 10 North Reddington Breakwater Transect Survey Lines ............................................12
Figure 11 Indian Rocks Beach Transect Survey Lines ............................................................13
Figure 12 Borrow Area A Marine Resource Map....................................................................21
Figure 13 Borrow Area B Marine Resource Map....................................................................24
Figure 14 Borrow Area C Marine Resource Map....................................................................26
Figure 15 Borrow Area D Marine Resource Map....................................................................28
Figure 16 Borrow Area E Marine Resource Map ....................................................................29
Figure 17 Borrow Area F Marine Resource Map ....................................................................31
Figure 18 Borrow Area G Marine Resource Map....................................................................34
Figure 19 Borrow Area H Marine Resource Map....................................................................36
Figure 20 Borrow Area I Marine Resource Map .....................................................................37
Figure 21 Ebb Tidal Shoals - North Resource Map.................................................................39
Figure 22 Ebb Tidal Shoals - South Resource Map.................................................................40
Figure 23 North Redington Beach Breakwater Marine Resource Map ...................................41
Figure 24 Indian Rocks Beach Breakwater Marine Resource Map .........................................42

Final Marine Biological Survey, Pinellas County SPP Dial Cordy and Associates Inc.February 26, 2002
1
1.0 INTRODUCTION
Dial Cordy and Associates, Inc. (DC&A) was contracted by the U.S. Army Corps ofEngineers (USACE) to conduct a biological survey of proposed borrow areas in conjunctionwith the Pinellas County Shore Protection Project. This work was conducted under contractNo. DACW17-01-F-0060.
1.1 Purpose and Need
The barrier island beaches of Pinellas County, Florida have had serious problems withshoreline erosion and a lowered beach profile caused by storms, wave action, and currents.As a means of controlling this erosion and increasing storm protection to the island, fillmaterial has been placed along the shoreline. Recent fill projects have included ClearwaterBeach, Mullet Key, Treasure Island, Sand Key, and Long Key. Traditionally, the material forthese and other beach nourishment projects for the Pinellas County Shore Protection Projectwas obtained from Egmont Channel Shoal. However, in order to utilize the sand fromEgmont Shoal for nourishment of Pinellas County beaches it must be moved a long distance(11-25 miles). This is not always cost effective. To accommodate future nourishmentprojects, nine offshore borrow areas and four ebb tidal shoals have been identified forconsideration as probable borrow sites. These sites were surveyed and the results discussedherein.
1.2 Location
The project area surveyed is located off the Gulf of Mexico coast of Florida, Pinellas CountyFlorida (Figure 1). Specifically, the investigation included nine potential offshore borrowareas (Figure 2) and five ebb tidal shoals (Figure 3). Additionally, two potential nearshorebreakwater areas were also surveyed along North Reddington Beach and Indian Rocks Beach(Figure 4).

Location Map
Preliminary Draft Marine Biological SurveyPinellas County SPP
Scale: 1" = 5 milesDate: December, 2001
Drawn By: MR
J01-493Figure 1
Area H
Area D
Area A
Area F
Area G
Area C
Area B
Area I
Area E
Egmont
Pass-A-Grille S
Pass-A-Grille N
Johns Pass
Blind Pass
North Reddington
Indian Rocks Beach
5 0 5 10 Miles
100 0 100 200 Miles
Pinellas County Marine Biological Survey Areas
Pinellas Co., FL

Offshore Borrow Areas
Preliminary Draft Marine Biological SurveyPinellas County SPP
Scale: 1" = 2 milesDate: December, 2001
Drawn By: MR
J01-493Figure 2
1 0 1 2 3 4 5 Miles
Area H
Area D
Area A
Area F
Area G
Area CArea B
Area I
Area E

Ebb Tidal Shoal Borrow Areas
Preliminary Draft Marine Biological SurveyPinellas County SPP
Scale: 1" = 2 milesDate: December, 2001
Drawn By: MR
J01-493Figure 3
1 0 1 2 3 4 5 Miles
Egmont
Pass-A-Grille S
Pass-A-Grille N
Johns Pass
Blind Pass

Nearshore Breakwater Areas
Preliminary Draft Marine Biological SurveyPinellas County SPP
Scale: 1" = 1 mileDate: December, 2001
Drawn By: MR
J01-493Figure 4
1 0 1 2 3 Miles
North Reddington Beach
Indian Rocks Beach

Final Marine Biological Survey, Pinellas County SPP Dial Cordy and Associates Inc.February 26, 2002
6
2.0 TECHINCAL APPROACH
DC&A conducted field investigations to locate, delineate, and characterize existinghardground and/or other benthic community resources within the proposed borrow areas.Marine resources were mapped and documented with underwater still and video photography.The field survey was conducted during July-September 2001.
This purpose of this survey was to verify and groundtruth existing side-scan records(SeaSystems 1996). Prior side-scan mapping showed extensive areas of consolidated materialwithin each of the proposed borrow areas (2,309 acres). This survey was used to map andcharacterize the extent of marine resources in relation to the previous side-scan survey. Theaccompanying CD-ROM provides a comparison of the hardbottom coverage verified by thissurvey to the previous side-scan effort. An additional 1,519.6 acres (3,828.6 acres total) oflive-bottom habitats were identified and mapped within this study.
2.1 Towed Video Survey and Mapping
To identify and delineate any marine resources present within the proposed borrow areas, atowed video survey was conducted. A towed video camera, in conjunction with DifferentialGlobal Positioning System (DGPS) and HYPACKMAXTM navigation software, was utilized.Real time position of the camera was overlaid on the digitally recorded survey record.Transects were established within each borrow area at 500-foot intervals. In total, over 350nautical miles of transect lines encompassing over 13,800 acres were surveyed (Figures 5-11).
The point at which each transect crossed a change in marine habitat (i.e. hardbottom, sand,etc.) was determined from video analysis. The points were then incorporated into a databaseand ArcView GISTM was used to generate resource maps. Hardbottom was classified bypercent of coverage and also vertical relief. Hardbottom classifications are shown in Tables 1and 2.
Table 1 Hardbottom Coverage Classifications Used to Map Marine Resources
Classification Percent CoveragePatchy < 20% coverage
Scattered 20-75% coverageDense >75% coverage
Table 2 Hardbottom Relief Classifications Used to Map Marine Resources
Classification Relief (cm)Low Relief <30 cm
Medium Relief 30-100 cmHigh Relief >100 cm

Borrow Areas "A", "B", and "C" Transect Survey Lines
Preliminary Draft Marine Biological SurveyPinellas County SPP
Scale: 1" = 4,000'Date: December, 2001
Drawn By: MR
J01-493Figure 5
4000 0 4000 8000 12000 Feet
Area A
Area C
Area B
Offshore Borrow AreasTransect Survey Lines

Borrow Areas "D" and "I" Transect Survey LinesPreliminary Draft Marine Biological Survey
Pinellas County SPPScale: 1" = 4,000'Date: December, 2001
Drawn By: MR
J01-493Figure 6
4000 0 4000 8000 12000 Feet
Area D
Area I
Offshore Borrow AreasTransect Survey Lines

Borrow Areas "E", "F", and "G" Transect Survey Lines
Preliminary Draft Marine Biological SurveyPinellas County SPP
Scale: 1" = 4,000'Date: December, 2001
Drawn By: MR
J01-493Figure 7
4000 0 4000 8000 12000 Feet
Area F
Area G
Area E
Offshore Borrow AreasTransect Survey Lines

Borrow Area "H" Transect Survey LinesPreliminary Draft Marine Biological Survey
Pinellas County SPPScale: 1" = 4,000'Date: December, 2001
Drawn By: MR
J01-493Figure 8
4000 0 4000 8000 12000 Feet
Area H
Area G
Offshore Borrow AreasTransect Survey Lines

Ebb Tidal Shoal Transect Survey Lines
Preliminary Draft Marine Biological SurveyPinellas County SPP
Scale: 1" = 8,000'Date: December, 2001
Drawn By: MR
J01-493Figure 9
8000 0 8000 16000 Feet
Egmont
Pass-A-Grille S
Pass-A-Grille N
Johns Pass
Blind Pass
Ebb Tidal Shoals AreasTransect Survey Lines

North Reddington Transect Survey LinesPreliminary Draft Marine Biological Survey
Pinellas County SPPScale: 1" = 1,000'Date: December, 2001
Drawn By: MR
J01-493Figure 10
1000 0 1000 2000 Feet
North Reddington
Breakwater AreaTransect Survey Lines

Indian Rocks Beach Transect Survey LinesPreliminary Draft Marine Biological Survey
Pinellas County SPPScale: 1" = 1,000'Date: December, 2001
Drawn By: MR
J01-493Figure 11
1000 0 1000 2000 Feet
Indian Rocks Beach
Breakwater AreaTransect Survey Lines

Final Marine Biological Survey, Pinellas County SPP Dial Cordy and Associates Inc.February 26, 2002
14
2.2 Diver Survey and Characterization
In addition to the towed video survey, diver characterizations of existing habitats were alsoconducted. Representative habitat types, as determined from video analysis, were located anddivers deployed to document the dominant invertebrate, fish, marine algae, and coralcommunities present within each of the nine borrow areas. Still photographs and hand heldvideo were also used to document the type and extent of living cover, as well as vertical reliefand overall quality within these areas.
All diving operations conformed to the requirements of the U.S. Army Corps of EngineersSafety and Health Manual EM 386-1-1, September 3, 1996, OSHA, 29 CFR, Subpart T, andACOE, Jacksonville District, Safety and Occupational Health Program. Personnel acceptedby the District Diving Coordinator (DDC) and approved in the dive plan submitted prior to thefield survey performed all diving operations.

Final Marine Biological Survey, Pinellas County SPP Dial Cordy and Associates Inc.February 26, 2002
15
3.0 MARINE RESOURCE CHARACTERIZATION
This section summarizes the results of the comprehensive survey conducted as well as areview of pertinent literature.
3.1 Overview of Marine Resources
The area surveyed included areas offshore of Pinellas County, FL. These potential borrowareas exist in water depths from seven to ten meters. Lyons and Collard (1974) describe thesecommunities as areas of moderate wave energy with quartz sand and shell fragment sedimentsextending offshore. Large temperate mollusks and echinoderms tend be the dominant faunalelements. In areas over 10 meters in depth, exposed rock substrate allows for theestablishment of scleractinian, molluscan, crustacean, tunicates, and other species morecommon to shallower waters of south Florida (Smith 1974, Lyons and Collard 1974). Quartzsands, with biologically influenced carbonates present, also dominate the sediments withinthis area.
3.1.1 Marine Algae
The marine algae present within the areas offshore of Pinellas County are extremely diverse.Phillips et al. (1960) identified ninety-five taxa of algae within areas of similar depth in thisarea. Dominant algal species observed during this and other studies includes Caulerpa sp.,Halimeda sp., Udotea flabellum, Sargassum sp., and Rhipocephalus phoenix (Phillips et al.1960, EPA 1981, CZR 1991).
3.1.2 Invertebrates
Benthic invertebrates associated with live bottom habitats along the eastern Gulf of Mexicoinclude scleractinian, molluscan, crustacean, tunicates, octocoral, echinoderm, and poriferaspecies. Many of these species are similar to species found in the more tropical waters of theCaribbean and south Florida reef tract. Lyons and Collard (1974) characterize the shallowshelf habitat offshore of Pinellas County as an area with sediments dominated by quartz sandand biogenically derived carbonates with exposed rock substrate. This substrate provideshabitat for scleractinian, molluscan, crustacean and other invertebrate species.
Previous studies have identified species common to habitats offshore of Pinellas County (EPA1981; CZR 1991; Child 1992; Posey et. al 1996). The species listed in these previous studiescompares closely to species observed during this survey (Table 3). In total over 40 dominantinvertebrates species were observed from the diver and video surveys. There are many morecryptic and less obvious species present within these complex habitats.

Final Marine Biological Survey, Pinellas County SPP Dial Cordy and Associates Inc.February 26, 2002
16
Table 3 Dominant Invertebrate Species Observed During Borrow Area SurveysScientific Name Common Name
EchinodermsLinckia guildingii Common Comet StarAstropecten articulatus Beaded Sea StarEchinaster spinulosus Orange-Ridged Sea StarLuidia clathara Striped Sea StarLuidia sp. Sea StarLuidia alternata Banded Sea StarEchinometra lucunter Rock-boring UrchinLytechinus variegates Variegated UrchinMollusksPinna carnea PenshellCharonia variegata Tritons TrumpetBusycon contrarium Lightning WhelkPleuroploca gigantean Florida Horse ConchScleractin CoralsCladocora arbuscula Tube CoralStephanocoenia mitchelinii Blushing Star CoralIsophyllia sinuosa Cactus CoralSiderastrea sp. Starlet CoralSolenastrea hyades Knobby Star CoralScolymia lacera Mushroom CoralPhyllangia americana Hidden Cup CoralManicina aereolata Rose CoralMontastrea annularis Boulder Star CoralOculina robusta Robust Ivory Tree CoralMillepora alcicornis Branching Fire CoralOctocoralsEunicea succinea Shelf-knob Sea rodEunicea calyculata Warty Sea RodPlexaurella nutans Giant Slit-Pore Sea RodMuricea laxa Delicate Spiny Sea RodMuricea elongata Orange Spiny Sea RodPseudoterogorgia sp. Sea PlumePterogorgia citrina Yellow Sea WhipLeptogorgia virgulata Colorful Sea WhipSpongesCribrochalina vasculum Brown Bowl SpongeXestospongia muta Giant Barrel SpongeSpheciospongia vesparium Loggerhead SpongeIrcinia sp. Ball SpongeCalyx podatypa Dark Volcano SpongeAnthosigmella varians Brown Variable SpongeAmphimedon compressa Erect Rope SpongePseudoceratina crassa Branching Tube SpongeCrustaceansMenippe mercenaria Florida Stone CrabTunicatesClavelina sp. Colonial tunicatesFamily Didemnidae Overgrowing TunicatesEudistoma sp. Condiminium Tunciate

Final Marine Biological Survey, Pinellas County SPP Dial Cordy and Associates Inc.February 26, 2002
17
The most obvious feature of the hardbottom habitats in the eastern Gulf of Mexico include theoctocorals, sponges, and scleractinian corals. Eight species of octocoral were observed (e.g.Eunicea succinea, Eunicea calyculata, Pterogorgia citrina etc.), as well as, eleven species ofscleractinian (hard) corals (e.g. Cladocora arbuscula, Solenastrea hyades, etc.) (Table 3).Poriferian species are also one of the dominant phyla present within the hardbottom habitats.Eight species of sponges were identified within the study area and of these the loggerhead(Spheciospongia vesparium ) and barrel sponges (Xestospongia muta)were the most obvious.Other sponges common to these hardbottom habitats included Ircinia sp., Cribrochalinavasculum, and Anthosigmella varians.
Typical epifaunal species observed during this survey included Astropecten articulatus,Luidia clathara, Busycon contrarium, and Pleuroploca gigantean. CZR (1991) and EPA(1981) also found these species to be some of the most common encountered. Sedimentswithin the area consist of sand to shelly sand that support benthic invertebrate communities.In the EPA (1981) study, dominant species in these habitats included sand dollars (Encopeemarginata), Luidia sp., and Enchinocardium cordatum. Similar species were observedduring this study. Benthic sampling conducted during past surveys also shows thatpolychaetes, oligochaetes, pycnogonids, bivalves, and arthropods are the dominant taxacollected in these habitats (CZR 1991; Child 1992; Posey et al. 1996).
3.1.3 Fishes
Fishes off of the Pinellas County coast are comprised of both reef and pelagic species. Manyof the species present within this area are of commercial importance and addressed under theNational Marine Fisheries Service (NMFS) Gulf of Mexico Fishery Management Council(GMFMC) Management Plan (GMFMC 1998). The fish assemblages in the area offshore ofPinellas County Florida and the Gulf of Mexico have been studied many times in the past.These studies have included reports which characterize the offshore and nearshoreassemblages of fishes (Moe and Martin 1965; Saloman and Naughton 1979), cold stress offishes on reef areas (Gilmore et al. 1978; Bullock et al. 1979), growth and reproduction(Shirripa and Burns 1997; Bullock et. al 1996), and the impacts of fishing activities andpredation (Pierce et al. 1998; Nelson and Bortone 1996), as well as many other subjects.
Moe and Martin (1965) collected over 2,300 individual fishes from 41 species duringsampling conducted at nine separate locations offshore of Pinellas County. The mostcommon fishes collected during this survey included sand perch (Diplectrum fromosum),pigfish (Orthopristus chrysopterus), silver perch (Bairdiella chrysura), spot (Leiostomusxanthurus), and pinfish (Lagodon rhomboides). Other species collected in this study includedsearobins (Prionotus tribulus crassiceps and Prionotus scitulus latfirons), and three species offlounder (Etropus rimosus, Etropus crossotus atlanticus, and Syacium papillosum).
Fishes of commercial and recreational importance within the eastern Gulf of Mexico includegroupers and snappers. These species are included in the GMFMC Snapper-Grouper

Final Marine Biological Survey, Pinellas County SPP Dial Cordy and Associates Inc.February 26, 2002
18
Complex fisheries management plan (1998). Species common to the area include yellowedgegrouper (Epinephelus flavolimbatus) (Bullock et al. 1996), gag (Mycteroperca microlepis) andred grouper (Epinephelus morio) (Schirripa and Burns 1997). Many of these species havebeen subjected to overfishing and stocks within the area have declined. This include redporgy (Pargus pargus), vermillion snapper (Rhomboplites aurobens), and other grouperspecies (Epinephelus sp.) (Roberts et al. 1995).
Pelagic species also occur throughout the Gulf of Mexico in the nearshore and offshorewaters. Major coastal pelagic families include Rachycentridae (cobia), Mugilidae (mullets),Pomatomidae (bluefish), Caranagidae (jacks), Scombridae (tunas and mackerels), Engraulidae(anchovies), and Carahahinidae (requiem sharks). Many of these pelagic species form largeschools (e.g. jacks, mullet, mackerel, etc.), while others travel singly or in small groups (e.g.cobia). Distribution of these species can vary seasonally and usually depends on watercolumn attributes that vary seasonally.
Fishes observed during diver and video surveys in this study are shown in Table 4. In total 17species from 15 families were observed. Most species observed included small demersalspecies common to hardbottom areas. The most common species observed were wrasses(Labridae); in particular the slippery dick (Halichoeres bivittatus). Other common fishesincluded searobins (Prionotus sp.), and menhaden (Brevoortia sp.). Anecdotal observationsof pelagic fishes during the survey included large schools of baitfish (Engraulidae andClupeidae), sharks (Carahahinidae), mackerel (Scombridae), and a nurse shark(Ginglymostoma cirratum).
Table 4 Fishes Observed Within Borrow Area During Diving Surveys
Scientific Name Common NameHaemulon sp. Juv. Grunt
Equetus umbrosus Juv. HighhatSynodus intermedius Sand Diver
Opsanus beta ToadfishMonocanthus sp. Filefish
Halichoeres bivittatus Slippery DickDiplectrum fromosum Sand Perch
Archosargus probatocephalus SheepsheadCalamus sp. Porgy
Parablennius marmoreus Seaweed BlennyDiplodus holbrooki Spotfin Pinfish
Brevoortia sp. MenhadenPrionous sp. Sea Robin
Echeneis naucrates SharksuckerCentropristis striata Black Sea Bass
Gymnothorax saxicola Honeycomb MoraySerranus subligarius Belted Sandfish

Final Marine Biological Survey, Pinellas County SPP Dial Cordy and Associates Inc.February 26, 2002
19
3.1.4 Other Vertebrates
Other vertebrate species, which utilize these offshore habitats, include many threatened andendangered species. The Gulf of Mexico is within the range of five species of sea turtle, theWest Indian manatee (Trichechus manatus), and up to 28 cetacean species. Of these, fourspecies of sea turtle, the manatee, and one cetacean, the bottlenose dolphin (Tursiopstruncatus) occur within the study area.
3.1.4.1 Sea Turtles
Four species of sea turtle commonly occur within the area around Pinellas County (Meylan etal. 1999; EPA 1981). These are the loggerhead (Caretta caretta), green (Chelonia mydas),Kemp's ridley (Lepidochelys kempii), and the hawksbill (Eretmochelys imbricata). Theloggerhead is listed as threatened and the other three species are listed as endangered.Loggerhead turtles represent most of the sea turtles present in the Tampa Bay area. Datacollected on sea turtle nesting in the area shows that the majority of the nests within this areaconsist of loggerhead nests (Table 5). Of the 279 nests observed on Pinellas County beachesin 2000, 278 were loggerhead nests. The only other nesting activity reported was one greenturtle nest. All turtles observed during this survey were loggerhead turtles which were seenwith regular consistency while conducting the survey. Stranding records within the PinellasCounty area also confirmed that loggerhead turtles are the most numerous species. During thissurvey a dead loggerhead was discovered and reported to the FMRI stranding network.
Table 5 Summary of Loggerhead Sea Turtle Nesting from 1988-2000
Year Beach Length Surveyed Number of Nests1988 69.5 561989 63.2 921990 62.1 1441991 67.3 1751992 63.3 1421993 42.7 1051994 52.6 1381995 58.8 2291996 49.1 2231997 58.8 1811998 52.3 2331999 62.6 1722000 62.6 279
Source: Florida Marine Research Institute 2001

Final Marine Biological Survey, Pinellas County SPP Dial Cordy and Associates Inc.February 26, 2002
20
3.1.4.2 Marine Mammals
Marine mammals commonly present within the waters nearshore and offshore the study areainclude manatee and bottlenose dolphin. Bottlenose dolphins were commonly observed whileconducting this survey. As many as 15 dolphins were observed at one time in the areasadjacent to the offshore borrow areas. Weigle (1990) documented that at least three distinctherds of dolphin are common within the Lower Tampa Bay area. This includes as many as246 individual animals. Many of the dolphins observed may have been transient in nature.However, 75 individuals were observed on more than one occasion.
West Indian manatees also utilize habitats within the study area. Manatees inhabit both freshand saltwater and may be encountered in canals, rivers, esturaries, bays, and on occasion havebeen observed as far as 6 km off the Florida Gulf coast (USFWS, 1996). Aerial surveysindicate that as many as 190 manatees may use Tampa Bay (Ackerman , 1995). Surveys showthat over 900 manatees inhabit the west coast of Florida. The highest concentrations ofmanatees along Florida's Gulf coast exists in Citrus, Levy, Lee, and Collier Counties. Datasuggest that of the manatees living in the Tampa Bay area, most occur within the bay wherewater temperatures are more stable year round. During aerial surveys in 1992, only 15manatees were surveyed in the eastern portion of Tampa Bay (Akcerman, 1995).Examination of the manatee mortality data for Pinellas and Hillsborough Counties shows thatfrom January 2000-October 2001 a total of 27 manatee deaths were reported. The majority ofthese deaths involved perinatal, cold stress, or other natural causes.
3.2 Offshore Borrow Areas
In total, nine offshore borrow areas were surveyed. These nine areas entail a total area of13,829 acres. Within these areas, over 75 percent of the habitat surveyed was open sand(10,000.4 acres) while the remaining 3,828.6 acres consisted of hardbottom habitats.
3.2.1 Area A
Offshore Borrow Area A lies six miles offshore of Indian Rocks Beach, Florida. Borrow AreaA encompasses 2,030 acres in approximately 25 feet of water. Of these 2,030 acres, 1,153acres are sand, while 877 acres of area is exposed hardbottom habitat (Figure 12).
3.2.1.1 Habitat Description
Borrow Area A has the most exposed hardbottom areas of all of the areas mapped. Most ofthe 880 acres of hardbottom within Area A consists of scattered medium relief habitats. Intotal 390 acres of the hardbottom habitat is scattered medium relief hardbottom, 126 acres of

Borrow Area "A" Marine Resource MapPreliminary Draft Marine Biological Survey
Pinellas County SPPScale: 1" = 2,000'Date: December, 2001
Drawn By: MR
J01-493Figure 12
2000 0 2000 4000 Feet
#
30
2
2
2
2
2
2
2
2
22
4
4
4
4
4
4
4
6
6
6
AREA A
COE-94-4
4
4
4
4
6
X= 187444 EY=1302534 N
X= 182696 EY=1296114 N
X= 196321 EY=1295970 N
X= 191573 EY=1289550 N
N
0
600
600
1200FT
300 SCALE: 1''= 1200'
0 SEDIMENT ISOPACH - EXPOSED HARDGROUNDS
2
4
0
0
0
0
0
0
0
0
0
0
0
0
0
0
0
0
0
0
0
2
2
4
4
2
22
2
4
22
2
4
4
30
30
30
30
30
BATHYMETRY CONTOURS
SEDIMENT ISOPACH CONTOURS
BORING X Y
CB-SK96-A1
CB-SK96-A10
CB-SK96-A11CB-SK96-A12
CB-SK96-A13CB-SK96-A14
CB-SK96-A15
CB-SK96-A2
CB-SK96-A3
CB-SK96-A4
CB-SK96-A5
CB-SK96-A6
CB-SK96-A7
CB-SK96-A8
CB-SK96-A9
Pinellas Borrow Area Bottom Classification MapDense Hardbottom (>75% Cover), High Relief (>100 cm)Dense Hardbottom (>75% Cover), Medium Relief (30cm-100cm)Scattered Hardbottom (20% - 75% Cover), Medium Relief (30cm-100cm)Scattered Hardbottom (20% - 75%, Cover), Low Relief (<30cm)Patchy Hardbottom (<20% Cover), Low Relief (<30cm)Sand

Final Marine Biological Survey, Pinellas County SPP Dial Cordy and Associates Inc.February 26, 2002
22
Photograph 1. Area A scattered mediumrelief hardbottom.
scattered low relief hardbottom, with the remaining 249 acres being dense medium/high reliefhabitat (Table 6). Relief within Area A averages 32 cm and is predominately low-lyingsponges, gorgonians, and hard corals. Photograph 1 shows a typical area of exposedhardbottom with relief. Hardbottom in Area A is dominated by gorgonian and sponge species.In particular, Muricea sp., and Pseudopterogonia sp. tended to be dominant. Echinometralucunter and Luidia sp. were the most common motile invertebrates encountered. Overall,hardbottom habitats within Area A tended to be of medium quality. In areas that diversurveys were conducted there tended to be a high degree of siltation present with many coralsand sponges slightly covered. Gorgonian species, with a higher relief when compared to thelow lying rock, tended to be the healthiest species present. Fish species encountered withinArea A included Equetus umbrosus and Opsanus beta.
3.2.2 Borrow Area B
Borrow Area B is a 703.8 acre block located 5.6 nautical miles offshore of Bellair Beach, FL.Figure 6 shows the relative layout of sand and exposed hardbottom. Within Area B there are210.3 acres of hardbottom compared to 493.5 acres of open sand habitat.
3.2.2.1 Habitat Description
Hardbottom habitats within Area B consist of predominately low relief features (Figure 13).Dense medium relief hardbottom was the dominant cover type, occupying over 154 acres.Some areas had small ledge features that had vertical relief in excess of 50 cm. Algae,sponges, and tunicates dominated exposed rock cover within Area B. In particular, Udotea

Final Marine Biological Survey, Pinellas County SPP Dial Cordy and Associates Inc.February 26, 2002
23
Table 6 Summary of Marine Resource Cover Types Within Each Area Surveyed
Acres
Survey Area TotalSize
SandPatchy
LowRelief
ScatteredLow
Relief
ScatteredMedium
Relief
DenseMedium
Relief
DenseHighRelief
Area A 2,030.0 1,153.9 10.8 126.1 390.2 275.2 74.7
Area B 703.8 493.5 5.1 0.7 41.6 154.2 9.1
Area C 1,363.7 1,055.7 5.6 142.3 12.4 82.8 10.4
Area D 2,653.7 1,819.2 8.4 47.7 236.8 529.6 ---
Area E 592.7 390.9 30.8 3.6 131.3 12.3 23.8
Area F 1,410.5 1,095.6 27.6 16.5 82.3 21.8 166.8
Area G 1,344.4 1,142.5 --- 15.8 97.5 15.9 72.7
Area H 3,202.1 2,533.8 59.0 89.7 353.0 119.5 47.3
Area I 527.3 315.3 5.6 --- 121.3 85.2 ---
John's Pass 152.1 152.1 --- --- --- --- ---
Blind Pass 38.5 38.5 --- --- --- --- ---
Pass-a-grille North 249.5 249.5 --- --- --- --- ---
Pass-a-grille South 298.0 298.0 --- --- --- --- ---
Egmont Channel 831.9 831.9 --- --- --- --- ---
North ReddingtonBeach Breakwater 28.3 23.5 --- --- 3.7 --- 1.1
Indian RocksBeach Breakwater 16.3 14.0 --- 2.0 --- --- 0.3

Borrow Area "B" Marine Resource MapPreliminary Draft Marine Biological Survey
Pinellas County SPPScale: 1" = 1,500'Date: December, 2001
Drawn By: MR
J01-493Figure 13
1500 0 1500 3000 Feet
#
#
AREA B
X= 191546 EY=1313643 N
X= 197742 EY=1309795 N
X= 189351 EY=1310109 N
X= 195547 EY=1306261 N
0
0
0
0
0
0
0
0
2
2
2
2
2
2
2
2
2
2
2
2
2
4
4
4
4
44
4
44
4
4
4
6
6
6
6
6
30
30
30
30
COE-94-1
BATHYMETRY CONTOURS
SEDIMENT ISOPACH CONTOURS
0 SEDIMENT ISOPACH - EXPOSED HARDGROUNDS
BORING X Y
COE-94-2
AREA
X= 192159 EY=1313865 N
0
0
0
2
2
2
2
2
2
2
2
2
2
2
2
4
4
4
4
4
4
4
4
4
44
4
4
6
6
6
6
6
6
6
8
30
N
0
600
600
1200FT
300 SCALE: 1''= 1200'
0 SEDIMENT ISOPACH - EXPOSED HARDGROUNDS
SEDIMENT ISOPACH CONTOURS
BATHYMETRY CONTOURS
N
0
300
300
600FT
SCALE: 1''= 600'
150
CB-SK96-B1
CB-SK96-B10CB-SK96-B11
CB-SK96-B12
CB-SK96-B2
CB-SK96-B3
CB-SK96-B4
CB-SK96-B5
CB-SK96-B6
CB-SK96-B7
CB-SK96-B8
CB-SK96-B9
CB-SK96-C10CB-SK96-C11
CB-SK96-C12
CB-SK96-C13
CB-SK96-C14
CB-SK96-C15
CB-SK96-C16
CB-SK96-C2
CB-SK96-C3
CB-SK96 C
CB-SK96-C5
CB-SK96-C6
CB-SK96-C7CB-SK96-C8
CB-SK96-C9
Pinellas Borrow Area Bottom Classification MapDense Hardbottom (>75% Cover), High Relief (>100 cm)Dense Hardbottom (>75% Cover), Medium Relief (30cm-100cm)Scattered Hardbottom (20% - 75% Cover), Medium Relief (30cm-100cm)Scattered Hardbottom (20% - 75%, Cover), Low Relief (<30cm)Patchy Hardbottom (<20% Cover), Low Relief (<30cm)Sand

FF
flabellum, and Sargassum sp. were the most visible
3
Fow
3
DtcOms(whsciws(w(h(st
inal Marine Biological Survey, Pinellas County SPPebruary 26, 2002
25
Photograph 3. Sand Diver (Synodusintermedius) in Area C.
Photograph 2. Area of scattered low relief hardbottom in Area B.
algal species. Sponges in the area included Irciniasp. and Cribrochalina vasculum. One noticeablefeature of the areas where SCUBA reconnaissancewas conducted in Area B was the lack of gorgonianspecies in these hardbottom areas. Invertebratespecies common to the area included Luidia sp, andthe whelk, Busycon contrarium. Photograph 2shows typical hardbottom coverage in Area B withvertical relief shown.
.2.3 Borrow Area C
ive miles west of Bellair Beach is Borrow Area C. Area C lies in approximately 20-25 feetf water and has a total area of 1363.7 acres. Within this area, 1,055.7 acres is open sand,hile the remaining 308 acres is composed of exposed rock/live bottom habitat (Figure 14).
.2.3.1 Habitat Description
ense hardbottom habitats within Area C tendedo have a relatively higher quality and diversity inomparison to other offshore areas surveyed.verall there was a total of 93.2 acrea of denseedium/high relief hardbottom and 154.5 acres of
cattered low/medium relief hardbottom in Area CTable 6). Of particular note within this area, thereere colonies of the hard corals Solenastreayades and Oculina robusta and also barrelponges (Xestospongia muta). Fishes were moreommon in this area with sand divers (Synodusntermedius), toadfish, and slipperly dicks alongith schools of menhaden (Brevoortia sp) and
potfin pinfish (Diplodus holbrooki) observedPhotograph 3). Also observed within this areaas the commercially important stone crab
Menippe mercenaria). Typical relief ofardbottom within Area C was 20 cmPhotograph 4). In some areas, where gorgonianpecies such as Pterogorgia anceps were present,he relief was as high as 40 cm, however.
Photograph 4. Area C Hardbottom withRelief Shown
Dial Cordy and Associates Inc.

Borrow Area "C" Marine Resource MapPreliminary Draft Marine Biological Survey
Pinellas County SPPScale: 1" = 2,000'Date: December, 2001
Drawn By: MR
J01-493Figure 14
1500 0 1500 3000 Feet
#
#
COE-94
AREA B
X= 191546 EY=1313643 N
X= 197742 EY=1309795 N
X= 195547 EY=1306261 N
0
0
0
0
0
0
0
0
2
2
2
2
2
2
2
2
2
2
2
2
2
4
4
4
4
44
4
44
4
4
4
6
6
6
6
6
30
30
30
30
COE-94-1
BORING X Y
COE-94-3
COE-94-2
AREA C
X= 194970 EY=1318260 N
X= 192159 EY=1313865 N
X= 204132 EY=1312400 N
X= 201326 EY=1308013 N
0
0
0
0
0
0
0
0
0
2
2
2
2
2
2
2
2
2
2
2
2
2
2
2
2
2
22
4
4
4
4
4
4
4
4
4
4
4
4
4
4
44
4
44
4
4 4
6
6
6
6
6
6
6
6
6 6
8
8
30
30
30
N
0
600
600
1200FT
300 SCALE: 1''= 1200'
0 SEDIMENT ISOPACH - EXPOSED HARDGROUNDS
SEDIMENT ISOPACH CONTOURS
BATHYMETRY CONTOURS
BORING X Y
X= 203364 EY=1311279 N
0
2
2
18
N
0
1200FT
SCALE: 1''= 1200'
300
600
6000 SEDIMENT ISOPACH - EXPOSED HARDGROUNDS
SEDIMENT ISOPACH CONTOURS
BATHYMETRY CONTOURSCB-SK96-B1
CB-SK96-B10CB-SK96-B11
CB-SK96-B12
CB-SK96-B2
CB-SK96-B3
SK96-B4
CB-SK96-B5
CB-SK96-B6
CB-SK96-B7
CB-SK96-B8
CB-SK96-B9
CB-SK96-C1
CB-SK96-C10CB-SK96-C11
CB-SK96-C12
CB-SK96-C13
CB-SK96-C14
CB-SK96-C15
CB-SK96-C16
CB-SK96-C17
CB-SK96-C18
CB-SK96-C19
CB-SK96-C2
CB-SK96-C20
CB-SK96-C21
CB-SK96-C22
CB-SK96-C23
CB-SK96-C24CB-SK96-C25
CB-SK96-C3
CB-SK96-C4
CB-SK96-C5
CB-SK96-C6
CB-SK96-C7CB-SK96-C8
CB-SK96-C9
Pinellas Borrow Area Bottom Classification MapDense Hardbottom (>75% Cover), High Relief (>100 cm)Dense Hardbottom (>75% Cover), Medium Relief (30cm-100cm)Scattered Hardbottom (20% - 75% Cover), Medium Relief (30cm-100cm)Scattered Hardbottom (20% - 75%, Cover), Low Relief (<30cm)Patchy Hardbottom (<20% Cover), Low Relief (<30cm)Sand

Final Marine Biological Survey, Pinellas County SPPFebruary 26, 2002
27
Photograph 5. Large sponges with reliefshown in Area D
Ph
3.2.4 Borrow Area D
Borrow Area D lies 2.8 nautical miles offshore of Bellair Beach in the northern portion of thestudy area (Figure 2). Area D contains 2,653.7 acres of bottom with 1,819.2 acres of sand and834.5 acres of hardbottom habitats (Figure 15) (Table 6). Area D has the second mostavailable acres of open sand habitat of the nine offshore borrow areas surveyed.
3.2.4.1 Habitat Description
Borrow Area D has 529 acres of dense mediumrelief hardbottom areas dominated by largesponges and gorgonians. Many large spongessuch as Spheciospongia vesparium andCribrochalina vasculum were present within thearea (Photograph 5). In addition there were alsosome large gorgonian species. These spongesand gorgonians in areas had relief of over 70 cm.Overall within Area D the relief of the
hardbottom features averaged 36 cm, with 292.9acres of low/medium relief patchy and scatteredhabitat. Photograph 6 depicts typical hardbottomfeatures in Area D with relief shown. Fishes werealso common in the hardbottom areas within AreaD, and included sand divers, juvenile grunts,blennies, and sheepshead (Archosargusprobatocephalus) were observed within the area.A large sharksucker (Echeneis naucrates) wasalso seen in the area.
3.2.5 Borrow Area E
Offshore Borrow Area E is the second smallest arWithin this area, the survey revealed 201.8 acres oopen sand habitat. Borrow Area E is 2.5 miles west
Dial Cordy and Associates Inc.
hotograph 6. Typical scattered low reliefardbottom in Area E.
ea surveyed at 592.7 acres (Figure 16).f hardbottom habitat and 390.9 acres of
of Indian Rocks Beach.

Borrow Area "D" Marine Resource MapPreliminary Draft Marine Biological Survey
Pinellas County SPPScale: 1" = 2,000'Date: December, 2001
Drawn By: MR
J01-493Figure 15
2000 0 2000 4000 Feet
#
#
COE-94-21
04132 E400 N
AREA D
X= 207900 EY=1317930 N
X= 203364 EY=1311279 N
X= 219588 EY=1309960 N
X= 215052 EY=1303309 N
0
0
0
0
00
0
0
0
0
0
0
0
0
0
0
0
0
0
2
22
2
2
2
2
2
2
2
22
2
2
2
2
2
2
2
22
2
2
2
2
2
4
4
4
4
4
4
4 4
4
4
4
4
4
4
4
44
4
4
4
4
4
4
4
4
4
4
4
4
4
4
4
4
4
4
4
4
4 4
4
4
4
4
4
4
4
4
4
6
6
6
6
6
6
66
6
6
6
6
66
8
8
18
18
18
18
18
18
18
18
18
18
18
18
18
18
18
COE-94-6
COE-94-8COE-94-13
COE-94-16
COE-94-18
N
0
1200FT
SCALE: 1''= 1200'
300
600
6000 SEDIMENT ISOPACH - EXPOSED HARDGROUNDS
SEDIMENT ISOPACH CONTOURS
BATHYMETRY CONTOURS
BORING X Y
X= 219933 E
Y=1318637 N
X= 217685 E
Y=1317189 N
0
0
0
2
2
2 4
18
N
0
300
300
600FT
SCALE: 1''= 600'
150
BATHYMETRY CONTOURS
SEDIMENT ISOPACH CONTOURS
0 SEDIMENT ISOPACH - EXPOSED HARDGROUNDS
BORING X Y
CB-SK96-D1
CB-SK96-D10
CB-SK96-D11
CB-SK96-D12
CB-SK96-D13
CB-SK96-D14
CB-SK96-D15
CB-SK96-D16
CB-SK96-D17
CB-SK96-D18
CB-SK96-D19
CB-SK96-D2
CB-SK96-D20
CB-SK96-D21
CB-SK96-D22
CB-SK96-D23
CB-SK96-D24
CB-SK96-D25
CB-SK96-D26
CB-SK96-D27
CB-SK96-D28
CB-SK96-D3
CB-SK96-D4
CB-SK96-D5
CB-SK96-D6
CB-SK96-D7
CB-SK96-D8
CB-SK96-D9
CB-SK96-I6
X= 219933 E
Y=1318637 N
X= 217685 E
Y=1317189 N
Pinellas Borrow Area Bottom Classification MapDense Hardbottom (>75% Cover), High Relief (>100 cm)Dense Hardbottom (>75% Cover), Medium Relief (30cm-100cm)Scattered Hardbottom (20% - 75% Cover), Medium Relief (30cm-100cm)Scattered Hardbottom (20% - 75%, Cover), Low Relief (<30cm)Patchy Hardbottom (<20% Cover), Low Relief (<30cm)Sand

Borrow Area "E" Marine Resource MapPreliminary Draft Marine Biological Survey
Pinellas County SPPScale: 1" = 1,500'Date: December, 2001
Drawn By: MR
J01-493Figure 16
1500 0 1500 3000 Feet
#
18
COE-94-10
AREA E
X= 207087 EY=1296203 N
X= 206482 EY=1291831 N
X= 212872 EY=1295403 N
X= 212267 EY=1291031 N
0
0
0
0
0
00
0
0
0
2
2
2
2
2
2
2
2
2
2
22
2
2
2
2
2
2
4
4
4
4
4
4
4
4
4
44
4
4
4
46
6
6
6
8
8
18
18
18
18
18
18
18
18
COE-94-9
N
0 300
300600FT SCALE: 1''= 600'
150
0 SEDIMENT ISOPACH - EXPOSED HARDGROUNDS
SEDIMENT ISOPACH CONTOURS
BATHYMETRY CONTOURS
BORING X Y
AREA F
X= 205700 EY=1291562 N
X= 2Y=12
00
00
0
0
0
0
0
2
2
2
22
22
2
2
2
2
2
4
4 4
4
4
4
4
4
4
66
6
6
1818
18
18COE-94-22
BORING X Y
CB-SK96-E1
CB-SK96-E2
CB-SK96-E3
CB-SK96-E4
CB-SK96-E5CB-SK96-E6
CB-SK96-E7
CB-SK96-E8
CB-SK96-F1
CB-SK96-F12
CB-SK96-F2
CB-SK96-F24CB-SK96-F3 CB-SK96-F4 CB-SK96-F5
CB-SK96-F6CB-SK96-F7
CB-SK96-F8CB-SK96-F9
Pinellas Borrow Area Bottom Classification MapDense Hardbottom (>75% Cover), High Relief (>100 cm)Dense Hardbottom (>75% Cover), Medium Relief (30cm-100cm)Scattered Hardbottom (20% - 75% Cover), Medium Relief (30cm-100cm)Scattered Hardbottom (20% - 75%, Cover), Low Relief (<30cm)Patchy Hardbottom (<20% Cover), Low Relief (<30cm)Sand

Final Marine Biological Survey, Pinellas County SPP Dial Cordy and Associates Inc.February 26, 2002
30
Photograph 7. Octocoral community withinArea E
3.2.5.1 Habitat Description
Marine resources in Area E werepredominately comprised of low/mediumrelief exposed rock features (Figure 16)(Table 6). In total, 134.9 acres of habitat werescattered low/medium relief hardbottom. Inmost areas the hardbottom features weremerely scattered rock/rubble with associatedsponges, algae, and coral (Photograph 6).Large areas adjacent to and among theserubble areas consisted of large octocorals(Pseudoterogorgia sp., Plexaurella nutansetc.) (Photograph 7). Within these areas ofdense gorgonians, the relief averaged over 50cm. The surrounding rock features in the areahad average relief of less than 20 cm.
3.2.6 Borrow Area F
Directly south of Area E is 1,410.5-acre Area F (Figure 2). Habitat distribution within thisarea was a total of 315 acres of hardbottom habitat and 1,095.6 acres of open sand (Figure 17).
3.2.6.1 Habitat Description
Borrow Area F has over 187 acres of high quality dense medium/high relief hardbottomhabitat (Table 6). Hardbottom areas within Area F are comprised of scleractinian species suchas Solenastrea hyades (Photograph 8), as well as a variety of gorgonian species. Also presentwithin this area were large overgrowing tunicates (Family Didemnidae). Fishes observedwithin these hardbottom habitats included numerous sea robins (Prionous sp.), moray eels(Gymnothorax sp.), and juvenile grunts. Invertebrate species encountered included the verycommon Luidia clathara, Lytechinus variegates, and Echinometra lucunter, as well as a verylarge specimen of the lightning whelk, Busycon contrarium (Photograph 9). Another 100acres of scattered low/medium relief also occurs within this area. A typical view of this reliefis shown in Photograph 10.

Borrow Area "F" Marine Resource MapPreliminary Draft Marine Biological Survey
Pinellas County SPPScale: 1" = 1,500'Date: December, 2001
Drawn By: MR
J01-493Figure 17
1500 0 1500 3000 Feet
#
#
COE-94-10
X= 206482 EY=1291831 N
X= 212267 EY=1291031 N
0
0
00
0
0
0
2
2
2
2
2
22
2
2
2
2
2
4
4
4
4
4
4
4
44
4
4
4
46
68
18
18
18
18
18
N
0 300
300600FT SCALE: 1''= 600'
150
0 SEDIMENT ISOPACH - EXPOSED HARDGROUNDS
SEDIMENT ISOPACH CONTOURS
BATHYMETRY CONTOURS
BORING X Y
AREA F
X= 205700 EY=1291562 N
X= 204859 EY=1285262 N
X= 213053 EY=1284168 N
X= 213417 EY=1286888 N X= 215796 EY=1286570 N
X= 216274 EY=1290150 N
00
00
0
0
0
0
0
0
0
0
00
0
2
2
2
2
2
22
2
2
2
2
2
2
2
2
2
44
4
4 4
4
4
4
4
4
4
4
4
4
4
4
4
66
6
6
66
6
6
6
18
18
18
1818
18
18COE-94-22
N
0 600
6001200FT
300
SCALE: 1''= 1200'
0 SEDIMENT ISOPACH - EXPOSED HARDGROUNDS
SEDIMENT ISOPACH CONTOURS
BATHYMETRY CONTOURS
BORING X Y
AREA G(1 of 2)
X= 210937 EY=1283626 N
0
0
0
2
2
2
18
18
18
CB-SK96-E4
CB-SK96-E5CB-SK96-E6
CB-SK96-E7
CB-SK96-E8
CB-SK96-F1
CB-SK96-F10
CB-SK96-F11
CB-SK96-F12
CB-SK96-F13
CB-SK96-F14
CB-SK96-F15
CB-SK96-F16
CB-SK96-F17
CB-SK96-F18CB-SK96-F19
CB-SK96-F2
CB-SK96-F20CB-SK96-F21
CB-SK96-F22
CB-SK96-F23
CB-SK96-F24CB-SK96-F3 CB-SK96-F4 CB-SK96-F5
CB-SK96-F6CB-SK96-F7
CB-SK96-F8CB-SK96-F9
Pinellas Borrow Area Bottom Classification MapDense Hardbottom (>75% Cover), High Relief (>100 cm)Dense Hardbottom (>75% Cover), Medium Relief (30cm-100cm)Scattered Hardbottom (20% - 75% Cover), Medium Relief (30cm-100cm)Scattered Hardbottom (20% - 75%, Cover), Low Relief (<30cm)Patchy Hardbottom (<20% Cover), Low Relief (<30cm)Sand
Final Marine Biological Survey, Pinellas County SPPFebruary 26, 2002
32
Photograph 8. Solanastrea hyades coral typicalto dense hardbottom areas in Area F.
Photograph 9. Large lightning whelk found inArea F.
Dial Cordy and Associates Inc.
Photograph 10. Typical scattered low reliefhabitat in Area F.

3.2.7 Borrow Area G
Borrow Area G is the closest to shore of all the borrow areas (1.8 nm) and also has a largepercentage of sand available (1,142.5.0 acres, 85 percent). Hardbottom areas within Area Gonly totaled 15 percent (201.9) of the total 1,344.4 acres surveyed. Most of these hardbottomareas were small distinct patches low/medium relief hardbottom scattered throughout the area.These patches ranged in size from 1.3 acres to over 17 acres. The remainder of thehardbottom present within the area was found along the western and northern ends of theborrow area and included areas of dense hardbottom (Figure 18).
3.2.7.1 Habitat Description
Final Marine Biological Survey, Pinellas County SPP Dial Cordy and Associates Inc.February 26, 2002
33
Photograph 11. Typical relief of scatteredmedium relief habitat in Area G.
With a vertical relief of 35 cm, the scatteredmedium relief hardbottom present within Area Grepresented some of the highest quality hardbottomencountered during the survey. Large gorgonianspecies interspersed with large sponges and hardcorals typified the area. Photograph 11 showssome of the typical relief within the area. Someareas within Area G had a relief of over 50 cm.Ircinia sp., Cribrochalina vasculum, andSpheciospongia vesparium were the most commonporifera species encountered. The gorgonian,Leptogorgia virgulata, was also common withinthe area.
3.2.8 Borrow Area H
The largest borrow area surveyed was Area H (Figure 19). In total, Area H encircles 3,202.1acres of seafloor, 2.8 miles offshore of Sand Key. Within this area there was a total of 2533.8acres of open sand habitat, the largest of all areas surveyed. This represents 80 percent of thetotal acreage within Area H. Hardbottom habitats within this potential borrow area covered668.3 acres.

Borrow Area "G" Marine Resource MapPreliminary Draft Marine Biological Survey
Pinellas County SPPScale: 1" = 2,000'Date: December, 2001
Drawn By: MR
J01-493Figure 18
2000 0 2000 4000 Feet
#
#
X= 213053 EY=1284168 N
00
2
2
2 4
4
6
6
18
MATCH LINEMATCH LINE
AREA G(1 of 2)
X= 210937 EY=1283626 N
X= 221097 EY=1282481 N
0
0
0
0
0
0
2
2
2
2
2
2
2
4
4
4
444
4
6
66
6
8
12
18
18
18
18
18
18
COE-94-19
N
0 600
600 1200FT
300
SCALE: 1''= 1200'
0 SEDIMENT ISOPACH - EXPOSED HARDGROUNDSSEDIMENT ISOPACH CONTOURSBATHYMETRY CONTOURS
BORING X Y
AREA G(2 of 2)
X= 220821 EY=1270988 N
0
0
2
2
2
2
4
4
18
18
N
1200FT0
600 600
300
SCALE: 1''= 1200'
0 SEDIMENT ISOPACH - EXPOSED HARDGROUNDSSEDIMENT ISOPACH CONTOURSBATHYMETRY CONTOURS
BORING X Y
CB-SK96-F21
CB-SK96-F22
CB-SK96-F23
CB-SK96-G1
CB-SK96-G10
CB-SK96-G11
CB-SK96-G2
CB-SK96-G3
CB-SK96-G4 CB-SK96-G5
CB-SK96-G6
CB-SK96-G7CB-SK96-G8 CB-SK96-G9
NO WORK ZONE
Pinellas Borrow Area Bottom Classification MapDense Hardbottom (>75% Cover), High Relief (>100 cm)Dense Hardbottom (>75% Cover), Medium Relief (30cm-100cm)Scattered Hardbottom (20% - 75% Cover), Medium Relief (30cm-100cm)Scattered Hardbottom (20% - 75%, Cover), Low Relief (<30cm)Patchy Hardbottom (<20% Cover), Low Relief (<30cm)Sand

Final Marine Biological Survey, Pinellas County SPP Dial Cordy and Associates Inc.February 26, 2002
35
Photograph 12. Typical relief of hardbottom inArea H.
Photograph 13. Hard coral assemblagetypical to Area I.
3.2.8.1 Habitat Description
Habitat distributions varied across Area H. Inthe western half of the borrow area, randomlydistributed patches of scattered medium reliefhardbottom were typical (Figure 19). Theseareas vary in size from small areas (< 1.0 acre)to large tracts of hardbottom (70 acres). In theeastern half of Area H, the northeast section iscomposed of a large area of open sand habitat.This area encompasses over 2,500 acres of area.Vertical relief of resources within Area Haveraged just over 30 cm (Photograph 12).Marine resources here were similar to thosefound in other areas, with large sponges andgorgonians being the dominant species. Numerous sea robins were also seen on the sandareas interspersed between hardbottom areas.
3.2.9 Borrow Area I
The northern most offshore area surveyed in Borrow Area I, located 3.0 nm offshore ofClearwater Pass (Figure 2). Area I is also the smallest area surveyed at only 527.3 acres.Within Area I a total of 212.3 acres of hardbottom resources were mapped. The remaining315.3 acres consisted of open sand habitat (Figure 20).
3.2.9.1 Habitat Description
Hardbottom resources within Area I can be separated into two large areas. Along the northernedge of the area is a 61.9-acre area of hardbottom. In addition to this, a 56.9-acre area runs
along the eastern edge (Figure 20). Throughout themiddle of borrow area lies 375.7 acres of unvegetatedsand habitat. Much of the hardbottom present in thesetwo areas is scattered medium relief. Average relief inthis area averaged 32 cm, with a few gorgonianspecies approaching 100 cm in height. Exposed rockwithin this area was covered with a combination ofsponges, Sargassum sp., colonial tunicates (Clavelinasp.), and hard corals (Photograph 13). The sand perch(Diplectrum fromosum) was common in the area, anda triton's trumpet (Charonia variegata) was alsoobserved.

Borrow Area "H" Marine Resource MapPreliminary Draft Marine Biological Survey
Pinellas County SPPScale: 1" = 3,000'Date: December, 2001
Drawn By: MR
J01-493Figure 19
3000 0 3000 6000 Feet
#
##
#
18
AREA H(1 of 2)
MATC
H LIN
E MATCH LINE
X= 212190 EY=1268243 N
X= 209838 EY=1261745 N
0
0
0
0
0
0
2 2
2
2
2
2
2
2
2
2
2
4
4
4
4
4
4
4
6
18
18
18
18 18
18
18
18
18
18
18
18
18
18
1818
18
18
12
COE-94-11
COE-94-14
N
0
600
600
1200FT
300
SCALE: 1''= 1200'
0 SEDIMENT ISOPACH - EXPOSED HARDGROUNDS
SEDIMENT ISOPACH CONTOURS
BATHYMETRY CONTOURS
BORING X Y
4
AREA H(2 of 2)
X= 231154 EY=1261378 N
X= 228802 EY=1254881 N
00
0
0
0
0
00
0
00
0
0
0
2
2
22
2
2
2
2
2
2
2
2
2
2
2
2
2
2
22
2
22
4
44
4
4
4
4
4
44
4
4
4
6
6
6
6
8
8
18
18
18 18
18
18
18
18
18
1212
COE-94-12
COE-94-17
N
0
600
600
1200FT
300
SCALE: 1''= 1200'
0 SEDIMENT ISOPACH - EXPOSED HARDGROUNDS
SEDIMENT ISOPACH CONTOURS
BATHYMETRY CONTOURS
BORING X Y
X= 220821 EY=1270988 N
24
18
N
CB-SK96-G11
CB-SK96-H1
CB-SK96-H10
CB-SK96-H11
CB-SK96-H12 CB-SK96-H13
CB-SK96-H14CB-SK96-H15
CB-SK96-H16
CB-SK96-H17
CB-SK96-H2
CB-SK96-H3CB-SK96-H4
CB-SK96-H5
CB-SK96-H6
CB-SK96-H7
CB-SK96-H8CB-SK96-H9
NO WORK ZONE
AREA H
Pinellas Borrow Area Bottom Classification MapDense Hardbottom (>75% Cover), High Relief (>100 cm)Dense Hardbottom (>75% Cover), Medium Relief (30cm-100cm)Scattered Hardbottom (20% - 75% Cover), Medium Relief (30cm-100cm)Scattered Hardbottom (20% - 75%, Cover), Low Relief (<30cm)Patchy Hardbottom (<20% Cover), Low Relief (<30cm)Sand

Borrow Area "I" Marine Resource MapPreliminary Draft Marine Biological Survey
Pinellas County SPPScale: 1" = 1,500'Date: December, 2001
Drawn By: MR
J01-493Figure 20
1500 0 1500 3000 Feet
#
#
AREA I
(1 of 2)
MATCH LINE MATCH LINE
X= 215284 E
Y=1325858 N
X= 213036 E
Y=1324411 N
0
00
0
0
0
0
0
00
2
2
2
2
2
2
2
2
2
2
2
4
4
4
4
4
44
4
4
2
6
6
18
18
18
18
18
18
18
1818
N
0
300
300
600FT
SCALE: 1''= 600'
150
BATHYMETRY CONTOURS
SEDIMENT ISOPACH CONTOURS
0 SEDIMENT ISOPACH - EXPOSED HARDGROUNDS
BORING X Y
AREA I
(2 of 2)
X= 219933 E
Y=1318637 N
X= 217685 E
Y=1317189 N
0
0
0
0
00
0
2
22
2
2
2
2
4
46
18
18
N
0
300
300
600FT
SCALE: 1''= 600'
150
BATHYMETRY CONTOURS
SEDIMENT ISOPACH CONTOURS
0 SEDIMENT ISOPACH - EXPOSED HARDGROUNDS
BORING X Y
CB-SK96-I1
CB-SK96-I2
CB-SK96-I3
CB-SK96-I4
CB-SK96-I5
CB-SK96-I6
X= 215284 E
Y=1325858 N
X= 213036 E
Y=1324411 N
X= 219933 E
Y=1318637 N
X= 217685 E
Y=1317189 N
Pinellas Borrow Area Bottom Classification MapDense Hardbottom (>75% Cover), High Relief (>100 cm)Dense Hardbottom (>75% Cover), Medium Relief (30cm-100cm)Scattered Hardbottom (20% - 75% Cover), Medium Relief (30cm-100cm)Scattered Hardbottom (20% - 75%, Cover), Low Relief (<30cm)Patchy Hardbottom (<20% Cover), Low Relief (<30cm)Sand
Final Marine Biological Survey, Pinellas County SPP Dial Cordy and Associates Inc.February 26, 2002
38
3.3 Ebb Shoal Borrow Areas
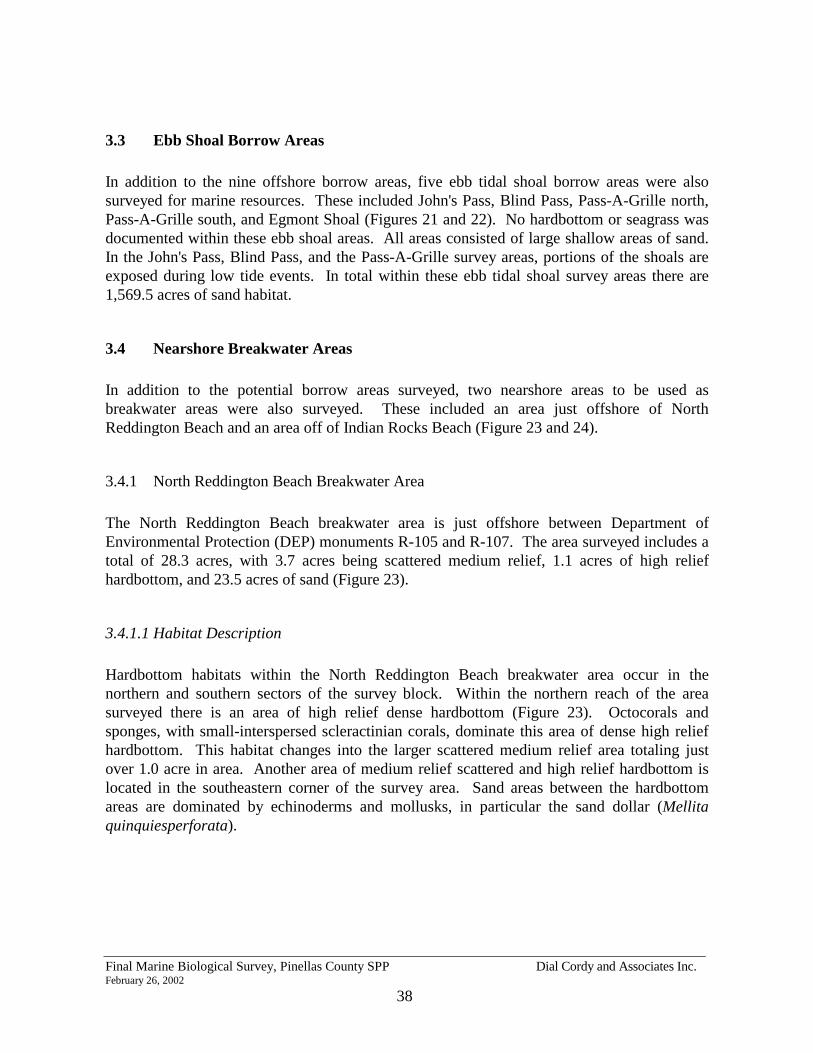
In addition to the nine offshore borrow areas, five ebb tidal shoal borrow areas were alsosurveyed for marine resources. These included John's Pass, Blind Pass, Pass-A-Grille north,Pass-A-Grille south, and Egmont Shoal (Figures 21 and 22). No hardbottom or seagrass wasdocumented within these ebb shoal areas. All areas consisted of large shallow areas of sand.In the John's Pass, Blind Pass, and the Pass-A-Grille survey areas, portions of the shoals areexposed during low tide events. In total within these ebb tidal shoal survey areas there are1,569.5 acres of sand habitat.
3.4 Nearshore Breakwater Areas
In addition to the potential borrow areas surveyed, two nearshore areas to be used asbreakwater areas were also surveyed. These included an area just offshore of NorthReddington Beach and an area off of Indian Rocks Beach (Figure 23 and 24).
3.4.1 North Reddington Beach Breakwater Area
The North Reddington Beach breakwater area is just offshore between Department ofEnvironmental Protection (DEP) monuments R-105 and R-107. The area surveyed includes atotal of 28.3 acres, with 3.7 acres being scattered medium relief, 1.1 acres of high reliefhardbottom, and 23.5 acres of sand (Figure 23).
3.4.1.1 Habitat Description
Hardbottom habitats within the North Reddington Beach breakwater area occur in thenorthern and southern sectors of the survey block. Within the northern reach of the areasurveyed there is an area of high relief dense hardbottom (Figure 23). Octocorals andsponges, with small-interspersed scleractinian corals, dominate this area of dense high reliefhardbottom. This habitat changes into the larger scattered medium relief area totaling justover 1.0 acre in area. Another area of medium relief scattered and high relief hardbottom islocated in the southeastern corner of the survey area. Sand areas between the hardbottomareas are dominated by echinoderms and mollusks, in particular the sand dollar (Mellitaquinquiesperforata).
Ebb Tidal Shoals - North Resource MapPreliminary Draft Marine Biological Survey
Pinellas County SPPScale: 1" = 4,000'Date: December, 2001
Drawn By: MR
J01-493Figure 21
4000 0 4000 8000 Feet
Ebb Tidal Shoals Bottom Classification MapSand

Ebb Tidal Shoals - South Resource MapPreliminary Draft Marine Biological Survey
Pinellas County SPPScale: 1" = 4,000'Date: December, 2001
Drawn By: MR
J01-493Figure 22
4000 0 4000 8000 Feet
Ebb Tidal Shoals Bottom Classification MapSand

North Reddington Beach Breakwater Marine Resource MapPreliminary Draft Marine Biological Survey
Pinellas County SPPScale: 1" = 500'Date: December, 2001
Drawn By: MR
J01-493Figure 23
500 0 500 1000 Feet
$Z
$Z
$Z
$Z
R104
R105
R106
R107
Pinellas Nearshore Bottom Classification MapDense Hardbottom (>75% Cover), High Relief (>100cm)Scattered Hardbottom (20-75% Cover), Medium Relief (30-100cm)Sand
$Z FDNR Range Monument

Indian Rocks Beach Breakwater Marine Resource MapPreliminary Draft Marine Biological Survey
Pinellas County SPPScale: 1" = 500'Date: December, 2001
Drawn By: MR
J01-493Figure 24
500 0 500 1000 Feet
$Z
$Z
$Z
$Z
R071
R072
R073
R074
Pinellas Nearshore Bottom Classification MapDense Hardbottom (>75% Cover), High Relief (>100cm)Scattered Hardbottom (20-75% Cover), Medium Relief (30-100cm)Sand
$Z FDNR Range Monument

Final Marine Biological Survey, Pinellas County SPP Dial Cordy and Associates Inc.February 26, 2002
43
3.4.2 Indian Rocks Beach Breakwater Area
The breakwater survey area off of Indian Rocks Beach (DEP monuments R-71 to R-73) is a28.3-acre block with a small area of hardbottom present (Figure 24). Overall, there are 3.7acres of scattered medium relief hardbottom habitat and a 1.1-acre area of high reliefhardbottom habitat.
3.4.2.1 Habitat Description
Hardbottom habitat within the Indian Rocks Beach breakwater survey block included 2.3acres of scattered medium relief habitat in the northern section of the survey area. A smallarea (0.3 acres) of high relief dense hardbottom habitat is also found in the northeast corner ofthe survey block. This area exhibits more exposed rock area and larger gorgonian and spongespecies. The majority of the area surveyed within this area was open sand habitat (14.0 acres).

Final Marine Biological Survey, Pinellas County SPP Dial Cordy and Associates Inc.February 26, 2002
44
4.0 REFERENCES
Ackerman, B.B. 1995. Aerial surveys of manatees: A summary and progress report. InO'shea, T.J., Ackerman, B.B., and Percival, H.F. Population Biology of the FloridaManatee. 13-33 pp.
Bullock, L.H, Godcharles, M.F., and Crabtree, R.E. 1996. Reproduction of yellowedgegrouper, Epinephelus flavolimbatus, from the eastern Gulf of Mexico. Bull. Mar. Sci.59(1): 216-224.
Coastal Zone Resources, Inc. 1991. Indian Shores beach nourishment project side-scanmosaic and biological report. Prepared for Pinellas County Board of CountyCommissioners, Clearwater, FL.
Child, C.A. 1992. Shallow water Pychnogonida of the Gulf of Mexico. Mem. HourglassCruises 9(1): 86 pp.
Gilmore, R.G., Bullock, L.H, and Berry, F.H. 1978. Hypothermal mortality in marine fishesof south-central Florida January 1977. Northeast Gulf Science 2(2): 77-97.
Environmental Protection Agency. 1981. Marine sampling and measurement program offnorthern Pinellas County, Florida. A Technical Report, S. Mahadevan, ed. Vol. 1:306 pp.
Gulf of Mexico Fishery Management Council. 1998. Generic Amendment for AddressingEssential Fish Habitat Requirements of the Gulf of Mexico. 237 pp.
Lyons, W.G., and Collard, S.B. 1974. Benthic invertebrate communities of the eastern Gulfof Mexico. In R.E. Smith, ed. Proceedings of marine environmental implications ofoffshore drilling in the eastern Gulf of Mexico. State Univ. Syst. FL. Inst. Oceanogr.,St. Petersburg, FL. 157-166 pp.
Meylan, A., Redlow, A. Mosier, A., Moody, K., Foley, A. 1999. Occurrence and distributionof sea turtles in Tampa Bay, FL. In J.R. Pribble, A. J. Janicki, and H. Greening , eds.Baywide environmental monitoring report, 1993-1998, Tampa Bay, FL. Tampa BayEstuary Program, Technical Publication 07-99. St. Petersburg, FL. Chapter 13, 13-1-13-15 pp.
Moe, M.A., and Martin, G. T. 1965. Fishes taken in monthly trawl samples offshore ofPinellas County, Florida, with new additions to the fish fauna of the Tampa Bay area.Tulane Studies in Zoology. 12(4): 129-151.

Final Marine Biological Survey, Pinellas County SPP Dial Cordy and Associates Inc.February 26, 2002
45
Nelson, B. D., and Bortone, S.A. 1996. Feeding guilds among artificial-reef fishes in thenorthern Gulf of Mexico. Gulf of Mexico Science. 1996(2): 66-80.
Phillips, R.C. and Springer, V.G. 1960. Observations on the Offshore Benthic Flora in theGulf of Mexico off Pinellas County, Florida. The Amer. Midland Nat. 64(2): 362-381.
Pierce, D.J., Wallin, J.E., and Mahmoudi, B. 1998. Spatial and temporal variations in thespecies composition of bycatch collected during a striped mullet (Mugil cephalus)survey. Gulf of Mexico Science 1998(1): 15-27 pp.
Posey, M., Lindberg, W.J., Alphin, T., and Vose, F. 1996. Influence of storm disturbance ofan offshore benthic community. Bull. Mar. Sci. 59(3): 523-529.
Roberts, C., Ballantine, W.J., Buxton, C.D., Dayton, P., Crowder, L.B., Milon W., Orback,M.K., Pauly, D., Trexler, J. and Walters, C.J. 1995. Review of the use of marinefishery reserves in the U.S. southeastern Atlantic. NOAA Technical MemorandumNMFS-SEFSC-376. 31pp.
Saloman, C.H., and Naughton, S.P. 1979. Fishes of the littoral zone, Pinellas County,Florida. Florida Sci. 42(2):85-93.
Schirripa, M. J., and Burns, K. M. 1997. Growth estimates for three species of reef fish in theeastern Gulf of Mexico. Bull. Mar. Sci. 61(3): 581-591.
U.S. Fish and Wildlife Service. 1996. Florida Manatee Recovery Plan (Trichechus manatuslatirostris), Second Revision. Prepared by the Florida Manatee Recovery Team for thesoutheast region, U.S. Fish and Wildlife Service, Atlanta, GA.
Weigle, B.L., 1990. Abundance, distribution and movements of bottlenose dolphins (Tursiopstrucncatus) in lower Tamps Bay, Florida. In P.S. Hammond, S. A. Mizorch, and G.P.Donovan, eds. Individual recognition of cetaceans: use of photo-identification andother techniques to estimate population parameters. Rep. Int. Whaling Comm. Spec.Issue 12. 195-201 pp.
\\DCI01\DATA\Jobs-Jax\451-500\01-493\Report\Report8Final(Photos).docFebruary 26, 2002