marin community college district …trackprop30.ca.gov/auditreport/ccd/2015...marin community...
TRANSCRIPT

MARIN COMMUNITY COLLEGE DISTRICT
FINANCIAL STATEMENTSJune 30, 2015

MARIN COMMUNITY COLLEGE DISTRICT
FINANCIAL STATEMENTSWITH SUPPLEMENTARY INFORMATION
For the Year Ended June 30, 2015
TABLE OF CONTENTS
Page
Independent Auditor's Report 1
Management's Discussion and Analysis 4
Basic Financial Statements:
Statement of Net Position 14
Statement of Revenues, Expenses and Change in Net Position 15
Statement of Cash Flows 16
Statement of Fiduciary Net Position 18
Statement of Change in Fiduciary Net Position 19
Notes to the Financial Statements 20
Required Supplementary Information:
Schedule of Other Postemployment Benefits (OPEB) Funding Progress 53
Schedule of Employer Contributions 54
Schedule of the District's Proportionate Share of the Net Pension Liability 55
Schedule of the District's Contributions 57
Note to Required Supplementary Information 59
Supplementary Information:
Organization - Unaudited 60
Schedule of Expenditures of Federal Awards 61
Schedule of State Financial Awards 62
Schedule of Workload Measures for State General Apportionment 63

MARIN COMMUNITY COLLEGE DISTRICT
FINANCIAL STATEMENTSWITH SUPPLEMENTARY INFORMATION
For the Year Ended June 30, 2015
TABLE OF CONTENTS(Continued)
Page
Supplementary Information: (Continued)
Reconciliation of Annual Financial and Budget Report (CCFS-311) with Audited Basic Financial Statements 64
Reconciliation of ECS 84362 (50 Percent Law) Calculation 65
Prop 30 EPA Expenditure Report 67
Note to Supplementary Information 68
Independent Auditor's Report on State Compliance Requirements 69
Independent Auditor's Report on Internal Control over FinancialReporting and on Compliance and Other Matters Based on an Audit of Financial Statements Performed in Accordance with Government Auditing Standards 71
Independent Auditor's Report on Compliance For Each MajorFederal Program and Report on Internal Control Over Compliance 73
Findings and Recommendations:
Schedule of Audit Findings and Questioned Costs 75
Status of Prior Year Findings and Recommendations 80

INDEPENDENT AUDITOR'S REPORT
Board of TrusteesMarin Community College DistrictKentfield, California
Report on the Financial Statements
We have audited the accompanying financial statements of the business-type activities and fiduciaryactivities of Marin Community College District, as of and for the year ended June 30, 2015, and therelated notes to the financial statements, which collectively comprise Marin Community College District’sbasic financial statements as listed in the table of contents.
Management’s Responsibility for the Financial Statements
Management is responsible for the preparation and fair presentation of these financial statements inaccordance with accounting principles generally accepted in the United States of America; this includesthe design, implementation, and maintenance of internal control relevant to the preparation and fairpresentation of financial statements that are free from material misstatement, whether due to fraud orerror.
Auditor’s Responsibility
Our responsibility is to express opinions on these financial statements based on our audit. We conductedour audit in accordance with auditing standards generally accepted in the United States of America andthe standards applicable to financial audits contained in Government Auditing Standards, issued by theComptroller General of the United States. Those standards require that we plan and perform the audit toobtain reasonable assurance about whether the financial statements are free from material misstatement.
An audit involves performing procedures to obtain audit evidence about the amounts and disclosures inthe financial statements. The procedures selected depend on the auditor’s judgment, including theassessment of the risks of material misstatement of the financial statements, whether due to fraud orerror. In making those risk assessments, the auditor considers internal control relevant to the entity’spreparation and fair presentation of the financial statements in order to design audit procedures that areappropriate in the circumstances, but not for the purpose of expressing an opinion on the effectiveness ofthe entity’s internal control. Accordingly, we express no such opinion. An audit also includes evaluatingthe appropriateness of accounting policies used and the reasonableness of significant accountingestimates made by management, as well as evaluating the overall presentation of the financialstatements.
We believe that the audit evidence we have obtained is sufficient and appropriate to provide a basis forour audit opinions.
Opinions
In our opinion, the financial statements referred to above present fairly, in all material respects, therespective financial position of the business-type activities and fiduciary activities of Marin CommunityCollege District, as of June 30, 2015, and the respective changes in its financial position and, whereapplicable, cash flows thereof for the year then ended in accordance with accounting principles generallyaccepted in the United States of America.

Emphasis of Matter
As discussed in Note 1 to the financial statements, in June 2012 the Governmental Accounting StandardsBoard (GASB) issued GASB Statement No. 68, “Accounting and Financial Reporting for Pensions.” Also,in November 2013 the GASB issued GASB Statement No. 71, “Pension Transition for ContributionsMade Subsequent to the Measurement Date”. As discussed in notes 9 and 10, GASB Statements No. 68and No. 71 are effective for the District’s fiscal year ending June 30, 2015. These Statements replace therequirements of GASB Statement No. 27, “Accounting for Pensions by State and Local GovernmentalEmployers” and GASB Statement No. 50, “Pension Disclosures.” GASB Statements No. 68 and No. 71establish standards for measuring and recognizing liabilities, deferred outflows of resources, deferredinflows of resources and expenses as well as identifies the methods and assumptions that should beused to project benefit payments, discount projected benefit payments to their actuarial present value andattribute that present value to periods of employee service. Note disclosures and required supplementaryinformation (RSI) requirements about pensions are also addressed. Our opinion is not modified withrespect to this matter.
Other Matters
Required Supplementary Information
Accounting principles generally accepted in the United States of America require that the Management’sDiscussion and Analysis on pages 4 to 13 and the Schedule of Other Postemployment Benefits (OPEB)Funding Progress, the Schedule of Employer Contributions, the Schedule of the District's ProportionateShare of the Net Pension Liability, and the Schedule of the District's Contributions on pages 53 to 58 bepresented to supplement the basic financial statements. Such information, although not a part of thebasic financial statements, is required by Governmental Accounting Standards Board who considers it tobe an essential part of financial reporting for placing the basic financial statements in an appropriateoperational, economic, or historical context. We have applied certain limited procedures to the requiredsupplementary information in accordance with auditing standards generally accepted in the United Statesof America, which consisted of inquiries of management about the methods of preparing the informationand comparing the information for consistency with management’s responses to our inquiries, the basicfinancial statements, and other knowledge we obtained during our audit of the basic financial statements.We do not express an opinion or provide any assurance on the information because the limitedprocedures do not provide us with sufficient evidence to express an opinion or provide any assurance.
Supplementary Information
Our audit was conducted for the purpose of forming opinions on the financial statements that collectivelycomprise Marin Community College District’s basic financial statements. The accompanying schedule ofexpenditure of federal awards as required by U.S. Office of Management and Budget Circular A-133,Audits of States, Local Governments, and Non-Profit Organizations and other supplementary informationlisted in the table of contents are presented for purposes of additional analysis and are not a required partof the basic financial statements.
The schedule of expenditure of federal awards and other supplementary information as listed in the tableof contents are the responsibility of management and were derived from and relate directly to theunderlying accounting and other records used to prepare the basic financial statements. Suchinformation, except for the Organization disclosure, has been subjected to the auditing proceduresapplied in the audit of the basic financial statements and certain additional procedures, includingcomparing and reconciling such information directly to the underlying accounting and other records usedto prepare the basic financial statements or to the basic financial statements themselves, and otheradditional procedures in accordance with auditing standards generally accepted in the United States ofAmerica. In our opinion, the schedule of expenditure of federal awards and other supplementaryinformation as listed in the table of contents, except for the Organization disclosure, are fairly stated, in allmaterial respects, in relation to the basic financial statements as a whole.
The Organization disclosure has not been subjected to the auditing procedures applied in the audit of thebasic financial statements, and accordingly, we do not express an opinion or provide any assurance on it.

Other Reporting Required by Government Auditing Standards
In accordance with Government Auditing Standards, we have also issued our report dated December 2,2015 on our consideration of Marin Community College District’s internal control over financial reportingand on our tests of its compliance with certain provisions of laws, regulations, contracts, and grantagreements and other matters. The purpose of that report is to describe the scope of our testing ofinternal control over financial reporting and compliance and the results of that testing, and not to providean opinion on internal control over financial reporting or on compliance. That report is an integral part ofan audit performed in accordance with Government Auditing Standards in considering Marin CommunityCollege District’s internal control over financial reporting and compliance.
Crowe Horwath LLP
Sacramento, CaliforniaDecember 2, 2015

4
MANAGEMENT’S DISCUSSION AND ANALYSIS
Fiscal Year Ending June 30, 2015
Governmental Accounting Standards Board (GASB) Statement 34/35 Marin Community College District (the District) prepares financial reports in accordance with GASB Statements No. 34/35, “Basic Financial Statements and Management’s Discussion and Analysis for Public Colleges and Universities,” issued in November 1999. The following discussion and analysis provides an overview of the District’s financial activities for the fiscal year ended June 30, 2015 and the intent of this discussion and analysis is to look at the District’s financial performance as a whole. To provide a complete understanding of the District’s financial standing, this analysis should be read in conjunction with the entire Independent Auditor’s Report, particularly the District’s financial statements beginning on page 14, and the notes to the financial statements beginning on page 20. The California Community College Chancellor’s Office, through its Fiscal and Accountability Standards Committee, has recommended the Business Type Activity (BTA) model for financial reporting and the District has adopted the BTA reporting model for these financial statements. As required, the annual report consists of three basic financial statements that provide information on the District as a whole:
Statement of Net Position Statement of Revenues, Expenses and Change in Net Position Statement of Cash Flows

5
MANAGEMENT’S DISCUSSION AND ANALYSIS (Continued)
Fiscal Year Ending June 30, 2015
Financial Highlights
Marin County property values appear to have recovered to pre-recession values. The District continues to maintain its “Basic Aid” status because the receipts from local property taxes and enrollment fees exceeded the State’s computational revenues under SB 361 for 2014-15 by about $21.6 million. SB 361, enacted as part of the 2006 Budget Act, implemented major reforms to improve the equity and transparency of the California Community Colleges funding model. SB 361 further established a funding model that would provide growth funding for credit courses at a uniform rate across the CCC system, thereby ensuring that funding remained equalized in the future. The funding model starts with a college/district’s base allocation, but its primary basis for calculating the revenue limit remains the Full-Time Equivalent Students (FTES).
FTES totaled 3,833 representing a 12.2% decrease over the prior fiscal year. The recent decline in enrollment is attributable to a convergence of factors including changes in state policy on course repeatability, implementation of a “pay-as-you-go” policy to reduce the amount of student debt, compliance with federal regulations that allow financial aid only for those students making satisfactory academic progress, and an improved economy. Creating strong future enrollment remains a strategic priority for the District. Outreach and marketing efforts are well underway. The District has been collaborating with K-12 and business partners to develop new career technical education programs in high-demand fields such as biotechnology, agri-tourism, and information and communication technology. The District’s K-12 connections also include expansion of concurrent enrollment opportunities for high school students, including offering select courses at high school sites; Summer Bridge program which is dramatically reducing the remedial needs of incoming students; and COMPASS (College of Marin Providing Access and Supporting Success).
FTES Statistics
2006/07 – 2014/15

6
MANAGEMENT’S DISCUSSION AND ANALYSIS (Continued)
Fiscal Year Ending June 30, 2015
Financial Highlights (continued)
Fiscal year 2014-15 net position ended higher than originally budgeted due to higher than anticipated revenues offset by lower spending. Unrestricted revenues were about $1.9 million higher, primarily due to “On-Behalf” payments made by the state for STRS contributions, property taxes and long-term financing for the LED lighting capital project. Unrestricted expenditures were approximately $465 thousand lower than budget primarily due to lower than anticipated salaries, benefits (despite the increase resulting from the state “On-Behalf” payments) and operating costs, offset by higher capital outlay and other outgo. The year ended with reserve levels at 13.5%.
Net costs for employee compensation decreased about 2.5% compared to the prior year
actual expenditures. The slight decrease was primarily attributable to not filling vacant positions and the related benefit cost savings. Faculty salaries decreased by 2.0% attributable primarily to a Supplemental Employee Retirement Plan offered by the District. Classified salaries decreased 8.3% due to vacant positions not being filled. Administrators’ salaries decreased 13.1% due to vacancies.
The Board directed funding the retiree healthcare obligation (other post-employment
benefits or “OPEB”) in advance rather than on the prior “pay as you go” basis. Between Fiscal Years 2005-06 and 2009-10, the District pre-funded the obligation transferring $2,000,000 out of the General Fund into the Retiree Unfunded Medical Benefits Liability Fund. This pre-funding accumulated interest earnings in the amount of $164,078. In June 2013, the District established an irrevocable OPEB trust fund with CalPERS, formally named the California Employers’ Retiree Benefit Trust (CERBT) fund, and transferred the $2,164,078 fund balance from the previous Retiree Unfunded Medical Benefits Liability Fund to the irrevocable OPEB Trust fund. In December 2014, the District’s Board of Trustees approved a $250,000 contribution to the irrevocable trust fund. The FY 2015-16 Adoption Budget includes a $500,000 contribution to the irrevocable trust fund. This contribution should then allow the District to begin receiving “pay-as-you-go” reimbursements from the trust fund for its retiree medical and dental premium payments. As of June 30, 2015, the most recent actuarial valuation date, the District’s Actuarial Accrued Liability for OPEB was $3.6 million. The actuarial value of plan assets in the OPEB trust as of June 30, 2015 is $2.8 million. A new actuarial study will be completed in FY 2016-17 for the period ending June 30, 2017.

7
MANAGEMENT’S DISCUSSION AND ANALYSIS
(Continued) Fiscal Year Ending June 30, 2015
Capital Asset and Debt Administration
On November 2, 2004 the voters of Marin County overwhelmingly passed Measure C, a $249.5 million bond for facilities maintenance, job training and safety, passing with more than 60 percent of the vote, easily surpassing the required 55 percent. With the bond, the College has been able to modernize science labs, classrooms, and libraries; provide modern computer technology; upgrade fire safety, campus security, disabled access, energy conservation systems and electrical wiring for computer technology; and repair, construct, acquire, and/or equip classrooms, labs, sites and facilities. The College retained the services of Swinerton Management & Consulting, Inc. as its Measure C program and construction management provider through the end of 2012. Beginning January 1, 2013, the College retained Jacobs Project Management Co. to assume the role of program and construction management and to continue to work with the District’s faculty, staff and students to implement the Measure C work in accordance with the Facilities Development and Master Plan.
In April 2005, $75 million in bonds were sold pursuant to the terms of a public sale. An
additional $75 million in bonds were sold in February 2009, and another $52.505 million in bonds were sold in June 2011. In December 2012, the balance of the bonds, $46.995 million were sold. All proceeds were delivered to the Marin County Treasury for credit of College of Marin into its building fund.
In June 2015, the District took advantage of low interest rates and refinanced previously-issued general obligation bonds. This refinancing is also known as “refunding.” In this bond refunding, the District deposited refunding bond proceeds of $32,055,000 and related net premium of $4,471,615 into the Measure C Bond Redemption Fund. In addition, the District placed $36,190,524 into a refunded bond escrow trust account to pay for the refunded bonds. The refunding bond transaction incurred $102,576 underwriting costs and $233,515 issuance costs. In total, the 2015 bond refinancing transaction represents a net present value savings to the taxpayers of $2.35 million over the life of the bonds. The District previously closed another bond refunding in December 2012, which saved taxpayers approximately $6.36 million over of the life of the refunded bonds.
Major milestones achieved in the District’s Capital Improvement and Modernization Program (2014-15) included:
Academic Center (formerly Gateway) - construction complete in summer 2015. Fine Arts Weatherization - construction complete. Kentfield Accessibility Barrier Removal – construction complete. Learning Resources Center voluntary seismic – project deferred. IVC Accessibility Barrier Removal –design and bidding 100% complete. Austin Demolition & related – 25% construction complete.
The 2015-16 budget outlines approximately $10.6 million in facilities renewal and
modernization costs, including construction, architectural and civil, geotechnical and MEP engineering services, plus landscape architect, industrial hygienist, CEQA and energy consultants. Construction and modernization plans outlined for the upcoming fiscal year include the demolition of the old Austin science building and start of construction on the IVC accessibility project.
8
MANAGEMENT’S DISCUSSION AND ANALYSIS
(Continued) Fiscal Year Ending June 30, 2015
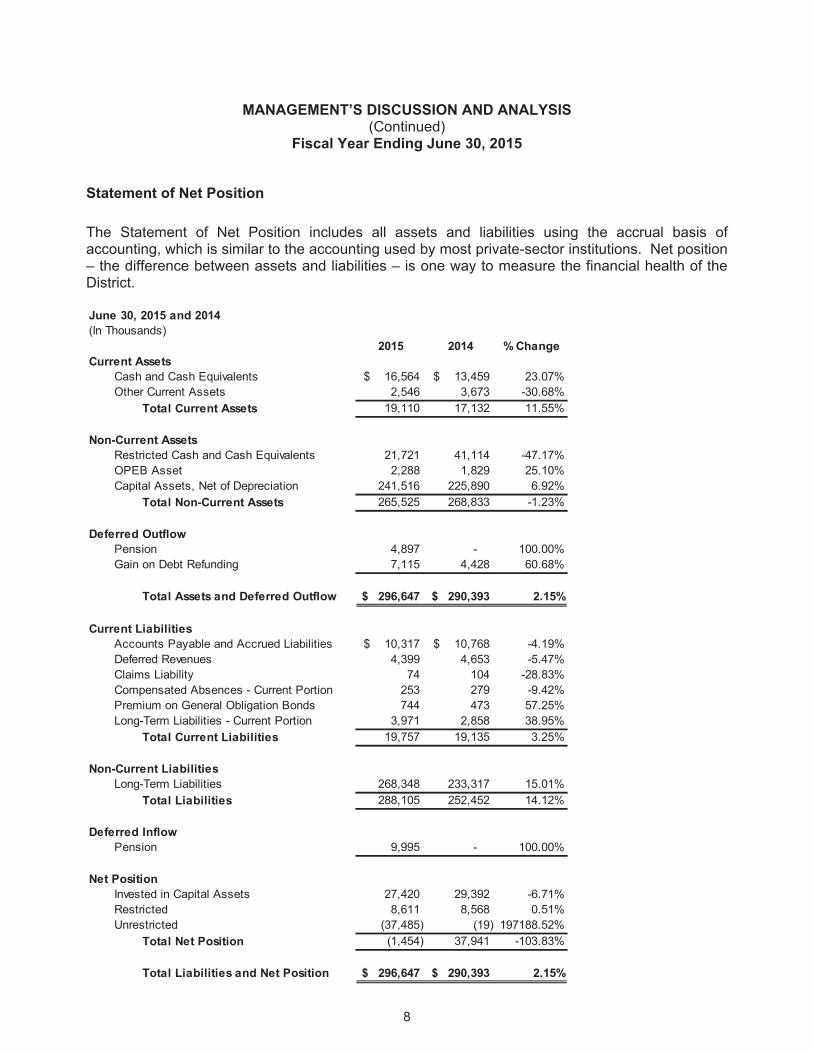
Statement of Net Position The Statement of Net Position includes all assets and liabilities using the accrual basis of accounting, which is similar to the accounting used by most private-sector institutions. Net position – the difference between assets and liabilities – is one way to measure the financial health of the District.
2015 2014 % Change
16,564$ 13,459$ 23.07%2,546 3,673 -30.68%
Total Current Assets 19,110 17,132 11.55%
21,721 41,114 -47.17%OPEB Asset 2,288 1,829 25.10%
241,516 225,890 6.92%Total Non-Current Assets 265,525 268,833 -1.23%
Deferred OutflowPension 4,897 - 100.00%Gain on Debt Refunding 7,115 4,428 60.68%
Total Assets and Deferred Outflow 296,647$ 290,393$ 2.15%
10,317$ 10,768$ -4.19%4,399 4,653 -5.47%
74 104 -28.83%Compensated Absences - Current Portion 253 279 -9.42%Premium on General Obligation Bonds 744 473 57.25%
3,971 2,858 38.95%Total Current Liabilities 19,757 19,135 3.25%
268,348 233,317 15.01%Total Liabilities 288,105 252,452 14.12%
Deferred InflowPension 9,995 - 100.00%
27,420 29,392 -6.71%Restricted 8,611 8,568 0.51%
(37,485) (19) 197188.52%Total Net Position (1,454) 37,941 -103.83%
Total Liabilities and Net Position 296,647$ 290,393$ 2.15%
June 30, 2015 and 2014(In Thousands)
Current AssetsCash and Cash EquivalentsOther Current Assets
Non-Current AssetsRestricted Cash and Cash Equivalents
Capital Assets, Net of Depreciation
Current LiabilitiesAccounts Payable and Accrued LiabilitiesDeferred RevenuesClaims Liability
Invested in Capital Assets
Unrestricted
Long-Term Liabilities - Current Portion
Non-Current LiabilitiesLong-Term Liabilities
Net Position

9
MANAGEMENT’S DISCUSSION AND ANALYSIS (Continued)
Fiscal Year Ending June 30, 2015
Statement of Net Position (continued) The $2.0 million net increase in “Total Current Assets” is due to increases primarily in
general fund unrestricted cash and receivables. The net decrease in restricted cash of $19.4 million relates primarily to the Measure C bond
construction spending.
The net increase in capital assets of $15.6 million represents additions to depreciable assets, net of actual depreciation of $6.0 million for 2014-15. Included in this category are the net values of buildings, land and equipment. The capitalization threshold was established at $5,000 or higher (original acquisition cost).
The $452 thousand net decrease in Accounts Payable and Accrued Liabilities relates to
more timely receipt and payment of invoices.
An increase in the current portion of long-term liabilities relates to higher upcoming debt repayments of the underlying bond indenture, and other liabilities.
Long-term liabilities increased $35 million primarily due to the net pension liability of $35.2 million added under GASB 68 offset by $134 thousand from bond repayments.
Net Position includes the value of all capital assets (net of accumulated depreciation).

10
MANAGEMENT’S DISCUSSION AND ANALYSIS (Continued)
Fiscal Year Ending June 30, 2015
Statement of Revenues, Expenses and Change in Net Position The Statement of Revenues, Expenses and Change in Net Position presents the operating results of the District, as well as the non-operating revenues and expenses.
2015 2014 % Change
4,325$ 4,963$ -12.86%7,101 8,887 -20.10%
11,426 13,850 -17.50%
47,316 44,110 7.27%8,436 7,759 8.73%
Student Financial Aid 7,049 11,609 -39.28%5,969 6,197 -3.68%
68,770 69,675 -1.30%(57,344) (55,825) 2.72%
189 189 0.00%45,242 42,271 7.03%2,563 1,107 131.53%4,226 5,875 -28.07%
Investment income 64 56 14.29%Interest expense on capital asset related debt (7,332) (7,601) -3.54%
2,033 2,850 -28.67%46,985 44,747 5.00%
- 3 -100.00%11,668 12,263 -4.85%
1,309$ 1,188$ 10.19%
State and local capital income
Change in Net Position
Other nonoperating revenuesTotal Nonoperating Revenues
Capital Revenues
Property taxes
Property taxesState revenues
Total Operating ExpensesLoss from Operations
Nonoperating Revenues and (Expenses)State apportionment
Grants and contractsTotal Operating Revenues
Salaries and benefitsSupplies and maintenance
Depreciation
Operating Expenses
Pell grants and direct loans
For the Years Ended June 30, 2015 and 2014(In Thousands)
Operating RevenuesTuition and fees

11
Revenues
Property taxes
Grants and contracts
Tuition and fees
State revenues
Pell grants and loans
Other
Expenses
Salaries and benefits
Supplies and maintenance
Student financial aid
Depreciation
Interest expense
12
MANAGEMENT’S DISCUSSION AND ANALYSIS
(Continued) Fiscal Year Ending June 30, 2015
Statement of Revenues, Expenses and Change in Net Position (continued)
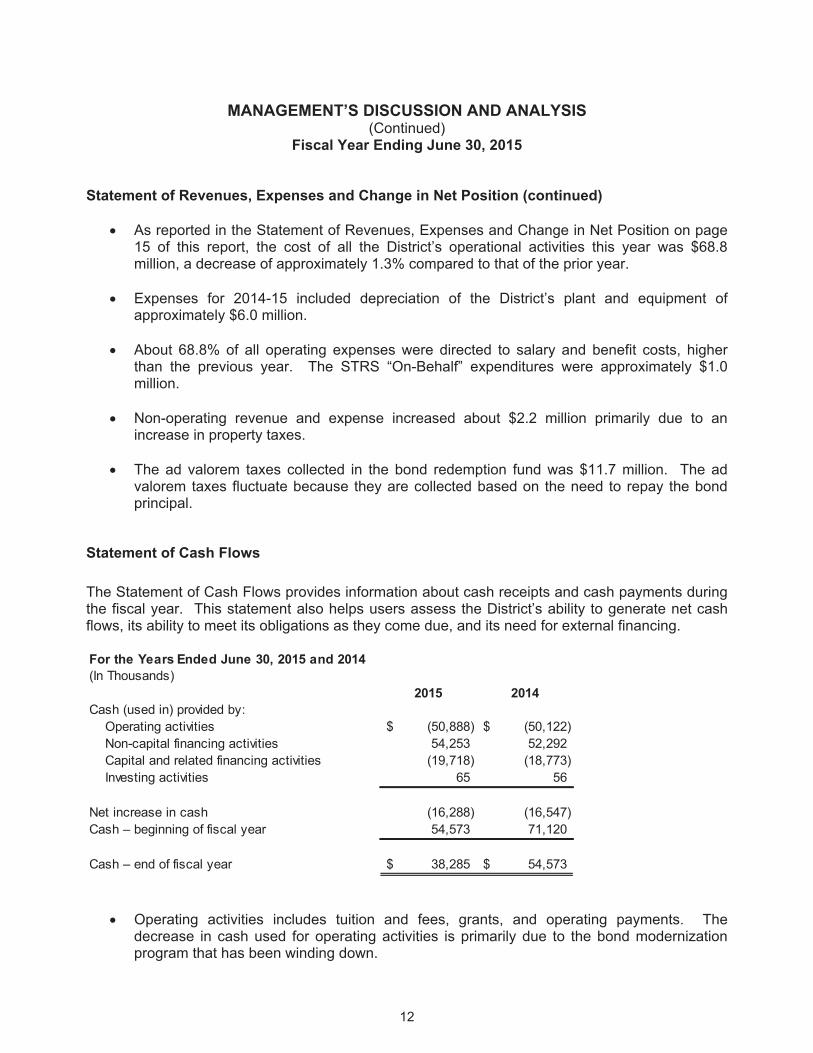
As reported in the Statement of Revenues, Expenses and Change in Net Position on page 15 of this report, the cost of all the District’s operational activities this year was $68.8 million, a decrease of approximately 1.3% compared to that of the prior year.
Expenses for 2014-15 included depreciation of the District’s plant and equipment of
approximately $6.0 million.
About 68.8% of all operating expenses were directed to salary and benefit costs, higher than the previous year. The STRS “On-Behalf” expenditures were approximately $1.0 million.
Non-operating revenue and expense increased about $2.2 million primarily due to an increase in property taxes.
The ad valorem taxes collected in the bond redemption fund was $11.7 million. The ad valorem taxes fluctuate because they are collected based on the need to repay the bond principal.
Statement of Cash Flows The Statement of Cash Flows provides information about cash receipts and cash payments during the fiscal year. This statement also helps users assess the District’s ability to generate net cash flows, its ability to meet its obligations as they come due, and its need for external financing.
2015 2014Cash (used in) provided by: Operating activities (50,888)$ (50,122)$ Non-capital financing activities 54,253 52,292 Capital and related financing activities (19,718) (18,773) Investing activities 65 56
Net increase in cash (16,288) (16,547) Cash – beginning of fiscal year 54,573 71,120
Cash – end of fiscal year 38,285$ 54,573$
For the Years Ended June 30, 2015 and 2014(In Thousands)
Operating activities includes tuition and fees, grants, and operating payments. The decrease in cash used for operating activities is primarily due to the bond modernization program that has been winding down.

13
MANAGEMENT’S DISCUSSION AND ANALYSIS
(Continued) Fiscal Year Ending June 30, 2015
Statement of Cash Flows (continued)
Representing the largest cash in-flow, non-capital financing activities includes property taxes, enrollment fees, State apportionments, and local revenues; property taxes being the largest contributor.
Construction projects and capital debt are reported in capital and related financing activities. Capital related financing activities correlate to bond issuances and redemptions.
Cash flow is adequate for a small district; the District participates in Marin County Treasurer’s Office investment pool to maximize interest earnings on excess cash.
Factors That May Affect the Future Forecasts for 2015-16 anticipate a 2.0% increase in property taxes with the California
Consumer Price Index at 1.998%, however escalating salaries and pension costs are causing a deficit. The District is benefiting from increased state funding (EPA, Prop 39, categorical programs, etc.) and hopes that the state can continue with the increased funding levels. The District has also joined SISC (Self-Insured Schools of California) in an effort to control its health care costs.
Pension Reform may help as employees new to the pension systems are required to pay their own share of pension expense, however, CalSTRS (California State Teachers’ Retirement System) and CalPERS (California Public Employees’ Retirement System) are both projecting annual increases for several years into the future to help with the unfunded liability of those plans.
The current economy, slight reductions in unemployment, and changes in financial aid
regulations and repeatability have caused a decline in enrollment. Also, unemployed workers who came back to school for training in a new vocation or to upgrade their skills have left to seek employment.
Reserves are budgeted at 8.3% of General Fund Unrestricted expenditures in the 2015-16
Adoption Budget. Reserves are expected to remain flat or increase slightly over the next few years as the District is in the process of overcoming a structural deficit. The District will again strive to align reserve levels in accordance with Board goals to increase reserve levels to 17%.
MARIN COMMUNITY COLLEGE DISTRICT
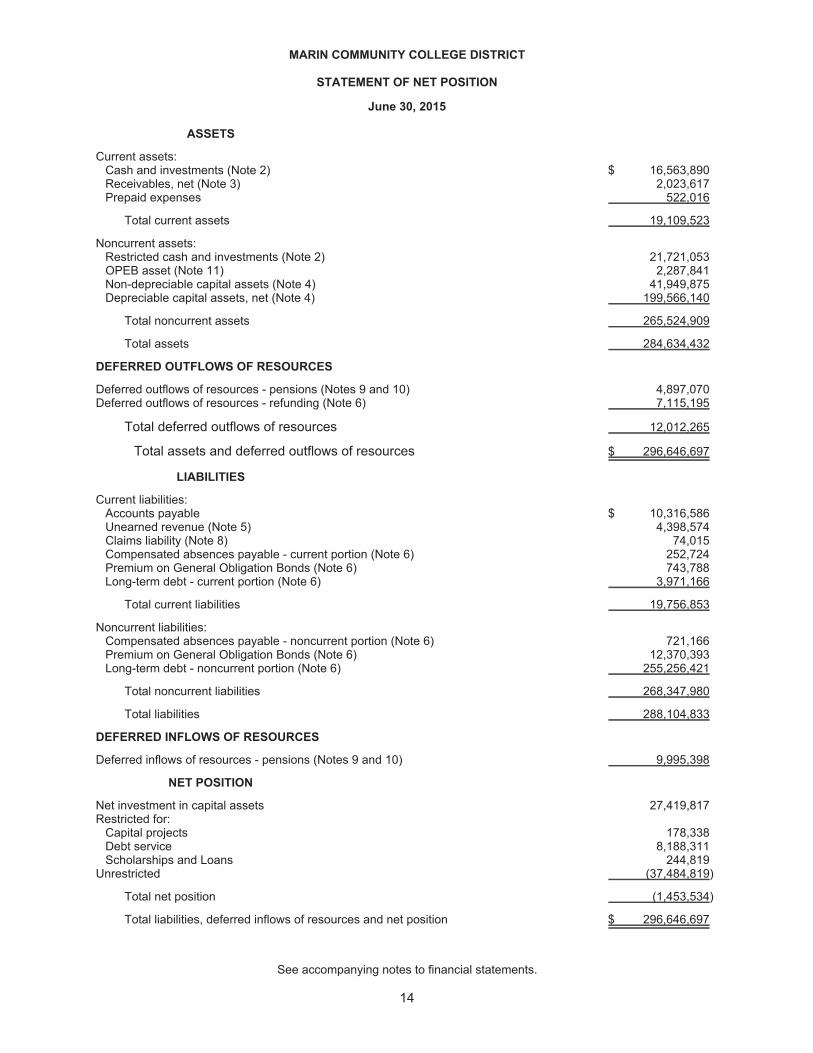
STATEMENT OF NET POSITION
June 30, 2015
ASSETS
Current assets:Cash and investments (Note 2) $ 16,563,890Receivables, net (Note 3) 2,023,617Prepaid expenses 522,016
Total current assets 19,109,523
Noncurrent assets:Restricted cash and investments (Note 2) 21,721,053OPEB asset (Note 11) 2,287,841Non-depreciable capital assets (Note 4) 41,949,875Depreciable capital assets, net (Note 4) 199,566,140
Total noncurrent assets 265,524,909
Total assets 284,634,432
DEFERRED OUTFLOWS OF RESOURCES
Deferred outflows of resources - pensions (Notes 9 and 10) 4,897,070Deferred outflows of resources - refunding (Note 6) 7,115,195
Total deferred outflows of resources 12,012,265
Total assets and deferred outflows of resources $ 296,646,697
LIABILITIES
Current liabilities:Accounts payable $ 10,316,586Unearned revenue (Note 5) 4,398,574Claims liability (Note 8) 74,015Compensated absences payable - current portion (Note 6) 252,724Premium on General Obligation Bonds (Note 6) 743,788Long-term debt - current portion (Note 6) 3,971,166
Total current liabilities 19,756,853
Noncurrent liabilities:Compensated absences payable - noncurrent portion (Note 6) 721,166Premium on General Obligation Bonds (Note 6) 12,370,393Long-term debt - noncurrent portion (Note 6) 255,256,421
Total noncurrent liabilities 268,347,980
Total liabilities 288,104,833
DEFERRED INFLOWS OF RESOURCES
Deferred inflows of resources - pensions (Notes 9 and 10) 9,995,398
NET POSITION
Net investment in capital assets 27,419,817Restricted for:
Capital projects 178,338Debt service 8,188,311Scholarships and Loans 244,819
Unrestricted (37,484,819)
Total net position (1,453,534)
Total liabilities, deferred inflows of resources and net position $ 296,646,697
See accompanying notes to financial statements.
14
MARIN COMMUNITY COLLEGE DISTRICT
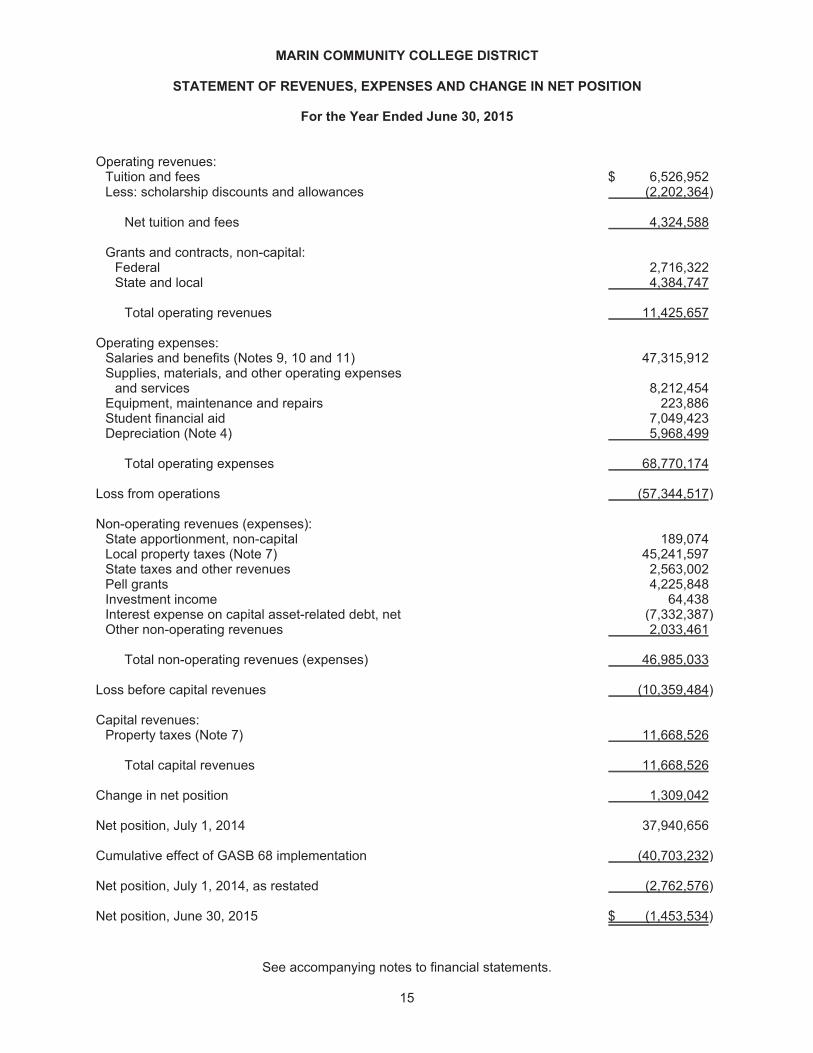
STATEMENT OF REVENUES, EXPENSES AND CHANGE IN NET POSITION
For the Year Ended June 30, 2015
Operating revenues:Tuition and fees $ 6,526,952Less: scholarship discounts and allowances (2,202,364)
Net tuition and fees 4,324,588
Grants and contracts, non-capital:Federal 2,716,322State and local 4,384,747
Total operating revenues 11,425,657
Operating expenses:Salaries and benefits (Notes 9, 10 and 11) 47,315,912Supplies, materials, and other operating expenses
and services 8,212,454Equipment, maintenance and repairs 223,886Student financial aid 7,049,423Depreciation (Note 4) 5,968,499
Total operating expenses 68,770,174
Loss from operations (57,344,517)
Non-operating revenues (expenses):State apportionment, non-capital 189,074Local property taxes (Note 7) 45,241,597State taxes and other revenues 2,563,002Pell grants 4,225,848Investment income 64,438Interest expense on capital asset-related debt, net (7,332,387)Other non-operating revenues 2,033,461
Total non-operating revenues (expenses) 46,985,033
Loss before capital revenues (10,359,484)
Capital revenues:Property taxes (Note 7) 11,668,526
Total capital revenues 11,668,526
Change in net position 1,309,042
Net position, July 1, 2014 37,940,656
Cumulative effect of GASB 68 implementation (40,703,232)
Net position, July 1, 2014, as restated (2,762,576)
Net position, June 30, 2015 $ (1,453,534)
See accompanying notes to financial statements.
15

MARIN COMMUNITY COLLEGE DISTRICT
STATEMENT OF CASH FLOWS
For the Year Ended June 30, 2015
Cash flows from operating activities:Tuition and fees $ 4,607,494Federal grants and contracts 2,823,042State and local grants and contracts 4,536,574
Payments to employees (47,802,677)Payments to students, suppliers and vendors (15,052,580)
Net cash used in operating activities (50,888,147)
Cash flows from noncapital financing activities:State appropriations 189,074Local property taxes 45,241,597State taxes and other revenues 2,563,002Other non-operating revenues 2,033,461Pell grants 4,225,848
Net cash provided by noncapital financing activities 54,252,982
Cash flows from capital and related financing activities:Local property taxes, capital purposes 11,668,526Proceeds from new debt 457,463Principal paid on capital debt (2,869,854)Purchase of capital assets (20,139,583)Interest paid on capital debt, net (8,834,183)
Net cash used in capital and related financing activities (19,717,631)
Cash flows provided by investing activities:Interest income 64,438
Net decrease in cash and investments (16,288,358)
Cash and investments, beginning of year 54,573,301
Cash and investments, end of year $ 38,284,943
(Continued)
16

MARIN COMMUNITY COLLEGE DISTRICT
STATEMENT OF CASH FLOWS(Continued)
For the Year Ended June 30, 2015
Reconciliation of loss from operations to net cash used inoperating activities:
Loss from operations $ (57,344,517)Adjustments to reconcile loss from operations to net cash
used in operating activities:Depreciation expense 5,968,499Changes in assets and liabilities:
Receivables, net 931,753Prepaid expenses 194,902Deferred outflows of resources - pension (1,999,653)Accounts payable 351,360Unearned revenue (254,206)Claims liability (30,503)SERP liability 346,098Compensated absences (153,612)Net pension liability (8,435,524)Deferred inflows of resources - pension 9,995,398Other postemployment benefits (458,142)
Net cash used in operating activities $ (50,888,147)
Noncash capital and related financing activities:Additions to capital assets - increase in accounts payable $ 74,219Amortization of loss on refunding 419,805Amortization of premiums on capital debt 1,625,672
Total noncash capital and related financing activities $ 2,119,696
During the year ended June 30, 2015, the District issued general obligation refunding bonds to refundexisting debt outstanding. The proceeds from refunding issuance totaled $36,526,615 for the futuredefeasance of $31,930,000 of previously outstanding general obligation bonds.
See accompanying notes to financial statements.
17

MARIN COMMUNITY COLLEGE DISTRICT
STATEMENT OF FIDUCIARY NET POSITION
June 30, 2015
Agency Fund Trust Funds Associated Invest-Students of mentCollege of OPEB Trust
Marin Trust Fund
ASSETS
Cash and investments (Note 2):Cash $ 342,973 $ - $ 1,005,143Investments held by
Fiscal Agent - CalPERS 111,051 2,742,977 -Receivables 43,248 - 8,038
Total assets $ 497,272 $ 2,742,977 $ 1,013,181
LIABILITIES
Accounts payable $ 102,586 $ - $ 52Amount held for others 394,686 - -
Total liabilities 497,272 - 52
NET POSITION
Restricted net position - 2,742,977 1,013,129
Total liabilities and restricted net position $ 497,272 $ 2,742,977 $ 1,013,181
See accompanying notes to financial statements.
18

MARIN COMMUNITY COLLEGE DISTRICT
STATEMENT OF CHANGE IN FIDUCIARY NET POSITION
For the Year Ended June 30, 2015
InvestmentOPEB TrustTrust Fund
Additions:Employer contributions $ 250,000 $ -Other local sources - 3,270
Total additions 250,000 3,270
Deductions:Administrative fees 8,815 -
Total deductions 8,815 -
Change in net position 241,185 3,270
Net position - held in trust, July 1, 2014 2,501,792 1,009,859
Net position - held in trust, June 30, 2015 $ 2,742,977 $ 1,013,129
See accompanying notes to financial statements.
19

MARIN COMMUNITY COLLEGE DISTRICT
NOTES TO FINANCIAL STATEMENTS
1. SUMMARY OF SIGNIFICANT ACCOUNTING POLICIES
Reporting Entity
Marin Community College District (the "District") is a political subdivision of the State of Californiaand provides educational services to the local residents of the surrounding area. While theDistrict is a political subdivision of the State, it is not a component unit of the State in accordancewith the provisions of Governmental Accounting Standards Board (GASB) Codification Section(Cod. Sec.) 2100.101. The District is classified as a state instrumentality under Internal RevenueCode Section 115 and is therefore exempt from federal taxes.
Basis of Presentation and Accounting
For financial reporting purposes, the District is considered a special-purpose governmentengaged only in business-type activities as defined by GASB. Under this model, the District'sfinancial statements provide a comprehensive entity-wide perspective look at the District'sfinancial position and activities. Accordingly, the District's financial statements have beenpresented using the economic resources measurement focus and the accrual basis ofaccounting. Under the accrual basis, revenues are recognized when earned, and expenses arerecorded when the obligation has been incurred. All significant intra-agency transactions havebeen eliminated.
Fiduciary funds for which the District acts only as an agent or trustee are not included in thebusiness-type activities of the District. These funds are reported in the Statement of Fiduciary NetPosition and the Statement of Change in Fiduciary Net Position at the fund financial statementlevel.
The District records revenues when earned and expenses when a liability is incurred regardlessof the timing of the related cash flow. The budgetary and financial accounts of the District arerecorded and maintained in accordance with the Chancellor's Office's Budget and AccountingManual.
Cash and Cash Equivalents
For the purposes of the financial statements, cash equivalents are defined as financialinstruments with an original maturity of three months or less. Funds invested in the Marin CountyTreasury are considered cash equivalents.
Restricted Cash, Cash Equivalents and Investments
Cash that is externally restricted to make debt service payments, maintain sinking or reservefunds, or to purchase or construct capital or other noncurrent assets, is classified as non currentassets in the statement of net position.
20

MARIN COMMUNITY COLLEGE DISTRICT
NOTES TO FINANCIAL STATEMENTS(Continued)
1. SUMMARY OF SIGNIFICANT ACCOUNTING POLICIES (Continued)
Fair Value of Investments
The District records its investment in Marin County Treasury at fair value. Changes in fair valueare reported as revenue in the Statement of Revenues, Expenses and Change in Net Position.The fair value of investments, including the Marin County Treasury external investment pool, atJune 30, 2015 approximated their carrying value. Fair values of investments in the Countyinvestment pool are determined by the pool sponsor.
Receivables
Receivables consist of tuition and fee charges to students. Receivables also include amountsdue from the federal government, state and local governments, or private sources, in connectionwith reimbursement of allowable expenditures made pursuant to the District's grants andcontracts. The District maintains an allowance for doubtful accounts at an amount whichmanagement considers sufficient to fully reserve and provide for the possible uncollectibility ofother receivable balances.
Capital Assets
Capital assets are recorded at cost at the date of acquisition, or fair value at the date of donationin the case of gifts. For equipment, the District's capitalization policy included all items with a unitcost of $5,000 or higher, and estimated useful life of greater than one year. Renovations tobuildings, infrastructure, and land improvements that significantly increase the value or extendthe useful life of the structure are capitalized. Routine repairs and maintenance are charged tooperating expense in the year in which the expense was incurred.
Depreciation is computed using the straight-line method over the estimated useful lives of theassets, generally 50 years for buildings, 15 years for land improvements, and 5 years for mostmachinery and equipment.
The District capitalizes interest costs as a component of construction in progress, based oninterest costs of borrowing, net of interest earned on investments acquired with the proceeds ofthe borrowing. At June 30, 2015, the amount of interest expense on capital asset-related debttotaled $9,269,175, which is net of interest capitalized of $1,380,838.
Deferred Outflows/Inflows of Resources
In addition to assets, the statement of net position includes a separate section for deferredoutflows of resources. This separate financial statement element, deferred outflows of resources,represents a consumption of net position that applies to a future period(s), and as such will not berecognized as an outflow of resources (expense/expenditures) until then. The District hasrecognized a deferred loss on refunding reported which is in the statement of net position. Adeferred loss on refunding results from the difference in the carrying value of refunded debt andits reacquisition price. This amount is deferred and amortized over the shortened life of therefunded or refunding debt. Amortization for the year ended June 30, 2015 totaled $419,805.Additionally, the District has recognized a deferred outflow of resources related to the paymentsmade subsequent to the measurement date for the pensions and changes in its proportionateshare.
21

MARIN COMMUNITY COLLEGE DISTRICT
NOTES TO FINANCIAL STATEMENTS(Continued)
1. SUMMARY OF SIGNIFICANT ACCOUNTING POLICIES (Continued)
Deferred Outflows/Inflows of Resources (Continued)
In addition to liabilities, the statement of net position reports a separate section for deferredinflows of resources. This separate financial statement element, deferred inflows of resources,represents an acquisition of net position that applies to a future period(s) and as such, will not berecognized as an inflow of resources (revenue) until that time. The District has recognized adeferred inflow of resources related to the recognition of the pension liability reported which is inthe statement of net position.
Pensions
For purposes of measuring the net pension liability, deferred outflows of resources and deferredinflows of resources related to pensions, and pension expense, information about the fiduciarynet position of the State Teachers’ Retirement Plan (STRP) and Public Employers RetirementFund B (PERF B) and additions to/deductions from STRP’s and PERF B’s fiduciary net positionhave been determined on the same basis as they are reported by STRP and PERF B. For thispurpose, benefit payments (including refunds of employee contributions) are recognized whendue and payable in accordance with the benefit terms. Investments are reported at fair value. Thefollowing is a summary of pension amounts in aggregate:
STRP PERF B Total
Deferred outflows of resources $ 1,594,920 $ 3,302,150 $ 4,897,070Deferred inflows of resources $ 5,088,000 $ 4,907,398 $ 9,995,398Net pension liability $ 20,662,000 $ 14,503,125 $ 35,165,125Pension expense $ 2,087,232 $ 1,725,059 $ 3,812,291
Compensated Absences
Compensated absence costs are accrued when earned by employees. Accumulated unpaidemployee vacation benefits are recognized at year end as liabilities of the District. The Districthas recognized a deferred inflow of resources related to the recognition of the pension liabilityreported which is in the statement of net position.
Sick leave benefits are not recognized as liabilities of the District. The District's policy is to recordsick leave as an operating expenditure or expense in the period taken since such benefits do notvest nor is payment probable; however, unused sick leave is added to the creditable serviceperiod for calculation of retirement benefits for certain California State Teachers RetirementSystem and California Public Employees' Retirement System, when the employee retires.
Unearned Revenue
Revenue from federal, state and local special projects and programs is recognized when qualifiedexpenditures have been incurred. Other funds, including tuition and student fees, received butnot earned are recorded as unearned revenue until earned.
22

MARIN COMMUNITY COLLEGE DISTRICT
NOTES TO FINANCIAL STATEMENTS(Continued)
1. SUMMARY OF SIGNIFICANT ACCOUNTING POLICIES (Continued)
Net Position
The District's net position are classified as follows:
Net investment in capital assets: This represents the District's total investment in capital assets,net of associated outstanding debt obligations related to those capital assets. To the extent debthas been incurred but not yet expended for capital assets, such amounts are not included as acomponent of net investment in capital assets.
Restricted net position: Restricted expendable net position include resources in which the Districtis legally or contractually obligated to spend in accordance with restrictions imposed by externalthird parties. Nonexpendable restricted net position consist of endowment and similar type fundsin which donors or other outside sources have stipulated, as a condition of the gift instrument,that the principal is to be maintained inviolate and in perpetuity, and invested for the purpose ofproducing present and future income, which may either be expended or added to principal.
Unrestricted net position: Unrestricted net position represent resources derived from studenttuition and fees, State apportionments, and sales and services of educational departments andauxiliary enterprises. These resources are used for transactions relating to the educational andgeneral operations of the District, and may be used at the discretion of the governing board tomeet current expenses for any purpose.
When an expense is incurred that can be paid using either restricted or unrestricted resources,the District typically first applies the expense toward restricted resources, then to unrestrictedresources. This practice ensures fully utilizing restricted funding each fiscal year.
Risk Management
As more fully described in Note 8, the District is partially self-insured with regard to dental andvision claims and certain other risks. The amount of the outstanding liability at June 30, 2015 fordental and vision claims includes estimates of future claim payments for known cases as well asprovisions for incurred but not reported claims and adverse development on known cases whichoccurred through that date. Outstanding claims which are expected to become due and payablewithin the subsequent fiscal year are reflected as a claims liability on the District's Statement ofNet Position.
State Apportionments
Certain current year apportionments from the state are based on various financial and statisticalinformation of the previous year. Any prior year corrections due to the recalculation will berecorded in the year completed by the State.
Classification of Revenues and Expenses
The District has classified its revenues as either operating or nonoperating revenues. Certainsignificant revenue streams relied upon for operations are recorded as nonoperating revenues,as defined by GASB Cod. Sec. C05.101 including State appropriations, local property taxes, Pellgrants and investment income. Nearly all the District's expenses are from exchangetransactions. Revenues and expenses are classified according to the following criteria:
Operating revenues and expenses: Operating revenues include activities that have thecharacteristics of exchange transactions, such as (1) student tuition and fees, net of scholarshipdiscounts and allowances, and (2) most Federal, State and local grants and contracts andFederal appropriations. All expenses are considered operating expenses except for interestexpense on capital related debt.
23

MARIN COMMUNITY COLLEGE DISTRICT
NOTES TO FINANCIAL STATEMENTS(Continued)
1. SUMMARY OF SIGNIFICANT ACCOUNTING POLICIES (Continued)
Classification of Revenues and Expenses (Continued)
Nonoperating revenues and expenses: Nonoperating revenues include activities that have thecharacteristics of nonexchange transactions, such as gifts and contributions, and other revenuesources described in GASB Cod. Sec. C05.101, such as State appropriations, Pell grants andinvestment income. Interest expense on capital related debt is the only nonoperating expense.
Scholarship Discounts and Allowances
Student tuition and fee revenue are reported net of scholarship discounts and allowances in thestatement of revenues, expenses and change in net position. Scholarship discounts andallowances represent the difference between stated charges for goods and services provided bythe District and the amount that is paid by students and/or third parties making payments on thestudents' behalf. Certain governmental grants, and other federal, state and nongovernmentalprograms, are recorded as operating revenues, while Federal Pell Grants are classified as non-operating revenues in the District's financial statements. To the extent that revenues from suchprograms are used to satisfy tuition and fees and other student charges, the District has recordeda scholarship discount and allowance.
Estimates
The preparation of financial statements in conformity with accounting principles generallyaccepted in the United States of America requires management to make estimates andassumptions. These estimates and assumptions affect the reported amounts of assets andliabilities and disclosure of contingent assets and liabilities at the date of the financial statementsand the reported amounts of revenues and expenditures during the reporting period.Accordingly, actual results may differ from those estimates.
New Accounting Pronouncements
In June 2012, the GASB issued GASB Statement No. 68, Accounting and Financial Reporting forPensions. This Statement replaces the requirements of GASB Statement No. 27, Accounting forPensions by State and Local Governmental Employers and GASB Statement No. 50, PensionDisclosures, as they relate to governments that provide pensions through pension plansadministered as trusts or similar arrangements that meet certain criteria. GASB StatementNo. 68 requires governments providing defined benefit pensions to recognize their long-term obligation for pension benefits as a liability for the first time, and to more comprehensivelyand comparably measure the annual costs of pension benefits. The Statement also enhancesaccountability and transparency through revised and new note disclosures and requiredsupplementary information (RSI). This Statement is effective for the District’s financial periodbeginning July 1, 2014. Based on the implementation of GASB Statement No. 68, the District’sJuly 1, 2014 net position was restated by $40,703,232 because of the recognition of the netpension liability and deferred outflows of resources.
24

MARIN COMMUNITY COLLEGE DISTRICT
NOTES TO FINANCIAL STATEMENTS(Continued)
1. SUMMARY OF SIGNIFICANT ACCOUNTING POLICIES (Continued)
New Accounting Pronouncements (Continued)
In November 2013, the GASB issued GASB Statement No. 71, Pension Transition forContributions Made Subsequent to the Measurement Date. The objective of this Statement is toaddress an issue regarding application of the transition provisions of GASB Statement No. 68.The issue relates to amounts associated with contributions, if any, made by a state or localgovernment employer or nonemployer contributing entity to a defined benefit pension plan afterthe measurement date of the government’s beginning net pension liability. This Statementamends paragraph 137 of GASB Statement No. 68 to require that, at transition, a governmentrecognize a beginning deferred outflow of resources for its pension contributions, if any, madesubsequent to the measurement date of the beginning net pension liability. GASB Statement No.68, as amended, continues to require that beginning balances for other deferred outflows ofresources and deferred inflows of resources related to pensions be reported at transition only if itis practical to determine all such amounts. The provisions of this Statement are required to beapplied simultaneously with the provisions of GASB Statement No. 68 and are effective for theDistrict’s fiscal year ending June 30, 2015. Based on the implementation of GASB Statement No.71, the District established a deferred outflow category to report the payments made subsequentto the measurement date of the pensions as well as deferred inflow category to report the netdifferences between projected and actual earnings on investments of the pensions in thestatement of net position.
In February 2015, the GASB issued its final standard on accounting and financial reporting issuesrelated to fair value measurements, applicable primarily to investments made by state and localgovernments. GASB Statement No. 72, Fair Value Measurement and Application, defines fairvalue and describes how fair value should be measured, what assets and liabilities should bemeasured at fair value, and what information about fair value should be disclosed in the notes tothe financial statements. Under GASB Statement No. 72, fair value is defined as the price thatwould be received to sell an asset or paid to transfer a liability in an orderly transaction betweenmarket participants at the measurement date. Investments, which generally are measured at fairvalue, are defined as a security or other asset that governments hold primarily for the purpose ofincome or profit and the present service capacity of which are based solely on their ability togenerate cash or to be sold to generate cash. Before the issuance of GASB Statement No. 72,state and local governments have been required to disclose how they arrived at their measuresof fair value if not based on quoted market prices. Under the new guidance, those disclosureshave been expanded to categorize fair values according to their relative reliability and to describepositions held in many alternative investments. This statement is effective for the District’s fiscalyear ending June 30, 2016. Management has not determined what impact this statement willhave on its financial statements.
25

MARIN COMMUNITY COLLEGE DISTRICT
NOTES TO FINANCIAL STATEMENTS(Continued)
1. SUMMARY OF SIGNIFICANT ACCOUNTING POLICIES (Continued)
New Accounting Pronouncements (Continued)
In June 2015, the GASB issued GASB Statement No. 73, Accounting and Financial Reporting forPensions and Related Assets That Are Not within the Scope of GASB No. Statement 68, andAmendments to Certain Provisions of GASB Statements No. 67 and 68, completes the suite ofpension standards. GASB Statement No. 73 establishes requirements for those pensions andpension plans that are not administered through a trust meeting specified criteria (in other words,those not covered by GASB Statements No. 67 and 68). The requirements in GASB StatementNo. 73 for reporting pensions generally are the same as in GASB Statement No. 68. However,the lack of a pension plan that is administered through a trust that meets specified criteria isreflected in the measurements. The provisions in GASB Statement No. 73 are effective for fiscalyears beginning after June 15, 2015, except those provisions that address employers andgovernmental nonemployer contributing entities for pensions that are not within the scope ofGASB Statement No. 68, which are effective for fiscal years beginning after June 15, 2016.Management has not determined what impact this statement will have on its financial statements.
In June 2015, the GASB issued GASB Statement No. 74, Financial Reporting forPostemployment Benefit Plans Other Than Pension Plans, which replaces GASB StatementNo. 43, Financial Reporting for Postemployment Benefit Plans Other Than Pension Plans. GASBStatement No. 74 addresses the financial reports of defined benefit OPEB plans that areadministered through trusts that meet specified criteria. The GASB Statement follows theframework for financial reporting of defined benefit OPEB plans in GASB Statement No. 45 byrequiring a statement of fiduciary net position and a statement of changes in fiduciary netposition. The Statement requires more extensive note disclosures and RSI related to themeasurement of the OPEB liabilities for which assets have been accumulated, includinginformation about the annual money-weighted rates of return on plan investments. GASBStatement No. 74 also sets forth note disclosure requirements for defined contribution OPEBplans. This statement is effective for the District’s fiscal year ending June 30, 2017. Managementhas not determined what impact this statement will have on its financial statements.
26

MARIN COMMUNITY COLLEGE DISTRICT
NOTES TO FINANCIAL STATEMENTS(Continued)
1. SUMMARY OF SIGNIFICANT ACCOUNTING POLICIES (Continued)
New Accounting Pronouncements (Continued)
In June 2015, the GASB has issued GASB Statement No. 75, Accounting and FinancialReporting for Postemployment Benefits Other Than Pensions, which replaces the requirementsof GASB Statement No. 45, Accounting and Financial Reporting by Employers forPostemployment Benefits Other Than Pensions. GASB Statement No. 75 requires governmentsto report a liability on the face of the financial statements for the OPEB that they provide.Governments that are responsible only for OPEB liabilities related to their own employees andthat provide OPEB through a defined benefit OPEB plan administered through a trust that meetsspecified criteria will report a net OPEB liability, which is the difference between the total OPEBliability and assets accumulated in the trust and restricted to making benefit payments.Governments that participate in a cost-sharing OPEB plan that is administered through a trustthat meets the specified criteria will report a liability equal to their proportionate share of thecollective OPEB liability for all entities participating in the cost-sharing plan. Governments that donot provide OPEB through a trust that meets specified criteria will report the total OPEB liabilityrelated to their employees. GASB Statement No. 75 carries forward from GASB Statement No.45 the option to use a specified alternative measurement method in place of an actuarialvaluation for purposes of determining the total OPEB liability for benefits provided through OPEBplans in which there are fewer than 100 plan members (active and inactive). This option wasretained in order to reduce costs for smaller governments. GASB Statement No. 75 requiresgovernments in all types of OPEB plans to present more extensive note disclosures and requiredsupplementary information (RSI) about their OPEB liabilities. Among the new note disclosures isa description of the effect on the reported OPEB liability of using a discount rate and a healthcarecost trend rate that are one percentage point higher and one percentage point lower thanassumed by the government. The new RSI includes a schedule showing the causes of increasesand decreases in the OPEB liability and a schedule comparing a government’s actual OPEBcontributions to its contribution requirements. Some governments are legally responsible to makecontributions directly to an OPEB plan or make benefit payments directly as OPEB comes due foremployees of other governments. In certain circumstances (called special funding situations)GASB Statement No. 75 requires these governments to recognize in their financial statements ashare of the other government’s net OPEB liability. The provisions in GASB Statement No. 75 areeffective for fiscal years beginning after June 15, 2017. Earlier application is encouraged.Management has not determined what impact this GASB statement will have on its financialstatements, however it is expected to be significant.
27

MARIN COMMUNITY COLLEGE DISTRICT
NOTES TO FINANCIAL STATEMENTS(Continued)
1. SUMMARY OF SIGNIFICANT ACCOUNTING POLICIES (Continued)
New Accounting Pronouncements (Continued)
In June 2015, the GASB has issued GASB Statement No. 76, The Hierarchy of GenerallyAccepted Accounting Principles for State and Local Governments, which reduces the GAAPhierarchy to two categories of authoritative GAAP from the four categories under GASBStatement No. 55, The Hierarchy of Generally Accepted Accounting Principles for State andLocal Governments. The first category of authoritative GAAP consists of GASB Statements ofGovernmental Accounting Standards. The second category comprises GASB Technical Bulletinsand Implementation Guides, as well as guidance from the AICPA that is cleared by the GASB.The Statement also addresses the use of authoritative and nonauthoritative literature in the eventthat the accounting treatment for a transaction or other event is not specified within a source ofauthoritative GAAP. These changes are intended to improve financial reporting for governmentsby establishing a framework for the evaluation of accounting guidance that will result ingovernments applying that guidance with less variation. That will improve the usefulness offinancial statement information for making decisions and assessing accountability and enhancethe comparability of financial statement information among governments. The Statement also isintended to improve implementation guidance by elevating its authoritative status to a level thatrequires it be exposed for a period of broad public comment prior to issuance, as is done forother GASB pronouncements. In connection with GASB Statement No. 76, the GASB alsorecently cleared Implementation Guide No. 2015-1, which incorporates changes resulting fromfeedback received during the public exposure of all of implementation guidance previouslyissued. This statement is effective for the District’s fiscal year ending June 30, 2016.Management has not determined what impact this GASB statement will have on its financialstatements.
2. CASH AND INVESTMENTS
District cash and investments at June 30, 2015, consisted of the following:
Agency TrustDistrict Fund Funds
Pooled Funds:Cash in County Treasury $ 37,586,297 $ - $ 1,011,664
Deposits:Cash on hand and in banks 465,208 342,973 (6,521)Revolving fund 20,000 - -
Cash held by Fiscal Agent 213,438 - -Investment held by Fiscal Agent - PERS - 111,051 2,742,977
Total cash and investments 38,284,943 454,024 3,748,120
Less: restricted cash and investments: (21,721,053) - (2,742,977)
Net cash and investments $ 16,563,890 $ 454,024 $ 1,005,143
28

MARIN COMMUNITY COLLEGE DISTRICT
NOTES TO FINANCIAL STATEMENTS(Continued)
2. CASH AND INVESTMENTS (Continued)
Cash in County Treasury
In accordance with Education Code Section 41001, the District maintains substantially all of itscash in the Marin County Treasury. The County pools and invests the cash. Those pooled fundsare carried at fair value, which approximates cost.
Because the District's deposits are maintained in a recognized pooled investment fund under thecare of a third party and the District's share of the pool does not consist of specific, identifiableinvestment securities owned by the District, no disclosure of the individual deposits andinvestments or related custodial risk classifications is required.
The District's deposits in the fund are considered to be highly liquid. Interest earned is depositedquarterly into participating funds. Any investment losses are proportionately shared by all fundsin the pool. The Marin County Treasurer has indicated that there are no derivatives in the pool asof June 30, 2015.
Restricted Cash and Investments
Restricted cash of $21,721,053 represents amounts held in the District's name with third partycustodians for future construction projects and repayment of long-term liabilities.
Restricted investments of $2,743,263 represents the investments held by California PublicEmployees Retirement System (CalPERS) for the District's irrevocable trust account for otherpostemployment benefits.
Custodial Credit Risk
The California Government Code requires California banks and savings and loan associations tosecure the District's deposits by pledging government securities as collateral. The fair value ofpledged securities must equal 110 percent of an agency's deposits. California law also allowsfinancial institutions to secure an agency's deposits by pledging first trust deed mortgage noteshaving a value of 150 percent of an agency's total deposits and collateral is considered to be heldin the name of the District. All cash held by financial institutions is entirely insured orcollateralized.
The District limits custodial credit risk by ensuring uninsured balances are collateralized by therespective financial institution. Cash balances held in banks are insured up to $250,000 by theFederal Deposit Insurance Corporation (FDIC) and are collateralized by the respective financialinstitution. At June 30, 2015, the carrying amount of the District's accounts was $1,145,949 andthe bank balance was $2,046,002. $584,506 of the bank balance was FDIC insured and$1,461,496 remained uninsured.
Credit Risk
Under provision of the District's policies and in accordance with Sections 53601 and 53602 of theCalifornia Government code, the District may invest in the following types of investments:
Local agency bonds, notes or warrants within the stateSecurities of the U.S. Government or its agenciesCertificates of Deposit with commercial banksCommercial paperRepurchase Agreements
29
MARIN COMMUNITY COLLEGE DISTRICT
NOTES TO FINANCIAL STATEMENTS(Continued)
2. CASH AND INVESTMENTS (Continued)
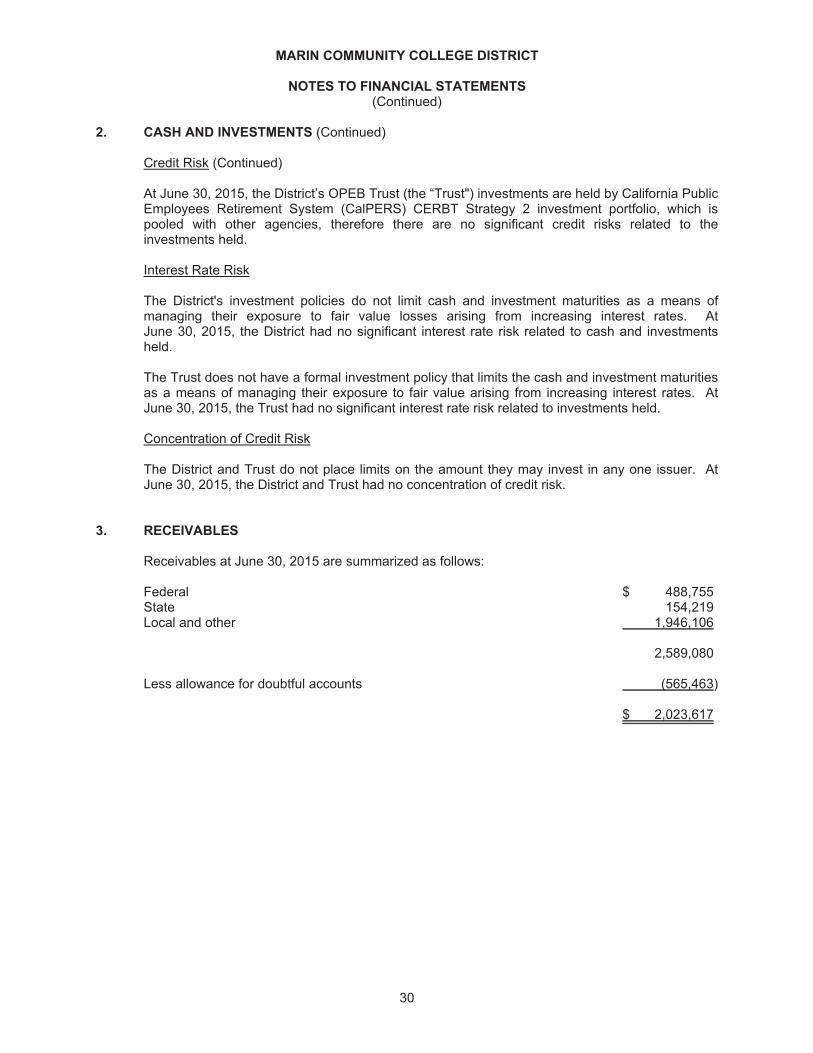
Credit Risk (Continued)
At June 30, 2015, the District’s OPEB Trust (the “Trust") investments are held by California PublicEmployees Retirement System (CalPERS) CERBT Strategy 2 investment portfolio, which ispooled with other agencies, therefore there are no significant credit risks related to theinvestments held.
Interest Rate Risk
The District's investment policies do not limit cash and investment maturities as a means ofmanaging their exposure to fair value losses arising from increasing interest rates. AtJune 30, 2015, the District had no significant interest rate risk related to cash and investmentsheld.
The Trust does not have a formal investment policy that limits the cash and investment maturitiesas a means of managing their exposure to fair value arising from increasing interest rates. AtJune 30, 2015, the Trust had no significant interest rate risk related to investments held.
Concentration of Credit Risk
The District and Trust do not place limits on the amount they may invest in any one issuer. AtJune 30, 2015, the District and Trust had no concentration of credit risk.
3. RECEIVABLES
Receivables at June 30, 2015 are summarized as follows:
Federal $ 488,755State 154,219Local and other 1,946,106
2,589,080
Less allowance for doubtful accounts (565,463)
$ 2,023,617
30

MARIN COMMUNITY COLLEGE DISTRICT
NOTES TO FINANCIAL STATEMENTS(Continued)
4. CAPITAL ASSETS
Capital asset activity consists of the following:
Balance BalanceJuly 1, June 30,2014 Additions Deductions 2015
Non-depreciable:Land $ 3,119,170 $ - $ - $ 3,119,170Construction in progress 23,688,968 15,141,737 - 38,830,705
Depreciable:Land improvements 26,418,988 122,436 - 26,541,424Building improvements 201,601,845 4,418,837 - 206,020,682Machinery and equipment 19,536,195 1,911,630 (800,321) 20,647,504
Total 274,365,166 21,594,640 (800,321) 295,159,485
Less accumulated depreciation:Land improvements 6,482,798 1,040,035 - 7,522,833Building improvements 31,112,325 4,264,572 - 35,376,897Machinery and equipment 10,880,169 663,892 (800,321) 10,743,740
Total 48,475,292 5,968,499 (800,321) 53,643,470
Capital assets, net $ 225,889,874 $ 15,626,141 $ - $ 241,516,015
At June 30, 2015, the District had capital assets acquired from capital leases with an original costof $288,103 and accumulated depreciation totaling $69,198.
5. UNEARNED REVENUE
Unearned revenue for the District consisted of the following:
Unearned Federal and State revenue $ 1,602,542Unearned tuition and student fees 802,589Unearned local revenue 1,993,443
Total unearned revenue $ 4,398,574
6. LONG-TERM LIABILITIES
General Obligation Bonds
In April 2005, the District issued Series A, 2004 General Obligation Bonds aggregating$75,000,000. In June 2015, the District issued General Obligation Refunding Bonds of which$6,485,000 were used to refund the Series A, 2004 General Obligation Bonds. The bonds maturethrough August 2016 and bear interest at a rate of 3%. The proceeds from the issuance will beused to finance the acquisition, construction and modernization of certain District property andfacilities. Resulting from the bond issuance, the District received a premium of $3,015,265 andpaid issuance costs of $559,158. The premium is amortized over the life of the bond repayment.At June 30, 2015, the District has unamortized premiums of $58,563.
31

MARIN COMMUNITY COLLEGE DISTRICT
NOTES TO FINANCIAL STATEMENTS(Continued)
6. LONG-TERM LIABILITIES (Continued)
General Obligation Bonds (Continued)
The annual payments required to amortize the Series A, 2004 General Obligation Bondsoutstanding as of June 30, 2015, are as follows:
Year EndingJune 30, Principal Interest Total
2016 $ 1,345,000 $ 33,625 $ 1,378,625
In March 2009, the District issued Series B, 2004 General Obligation Bonds aggregating$75,000,000. The bonds mature through August 2038 and bear interest at rates ranging from 3%to 5%. The proceeds from the issuance will be used to finance the acquisition, construction andmodernization of certain District property and facilities. Resulting from the bond issuance, theDistrict received a premium of $1,982,513 and paid issuance costs of $1,148,198. The premiumis amortized over the life of the bond repayment. At June 30, 2015, the District has unamortizedpremiums of $1,005,698.
The annual payments required to amortize the Series B, 2004 General Obligation Bondsoutstanding as of June 30, 2015, are as follows:
Year EndingJune 30, Principal Interest Total
2016 $ 1,000,000 $ 2,051,538 $ 3,051,5382017 1,090,000 2,020,188 3,110,1882018 1,185,000 1,986,063 3,171,0632019 1,285,000 1,936,163 3,221,1632020 1,395,000 1,869,163 3,264,163
2021-2025 - 9,171,438 9,171,4382026-2030 - 9,171,438 9,171,4382031-2035 16,285,000 7,674,594 23,959,5942036-2039 21,215,000 2,215,625 23,430,625
$ 43,455,000 $ 38,096,210 $ 81,551,210
32

MARIN COMMUNITY COLLEGE DISTRICT
NOTES TO FINANCIAL STATEMENTS(Continued)
6. LONG-TERM LIABILITIES (Continued)
General Obligation Bonds (Continued)
In May 2011, the District issued Series C, 2004 General Obligation Bonds aggregating$52,505,000. The bonds mature through August 2034 and bear interest at rates ranging from 3%to 5%. The proceeds from the issuance will be used to finance the acquisition, construction andmodernization of certain District property and facilities. Resulting from the bond issuance, theDistrict received a premium of $767,032 and paid issuance costs of $285,719. The premium isamortized over the life of the bond repayment. At June 30, 2015, the District has unamortizedpremiums of $678,980.
Year EndingJune 30, Principal Interest Total
2016 $ 85,000 $ 2,381,863 $ 2,466,8632017 35,000 2,379,463 2,414,4632018 40,000 2,377,963 2,417,9632019 35,000 2,376,463 2,411,4632020 285,000 2,370,063 2,655,063
2021-2025 3,425,000 11,499,363 14,924,3632026-2030 7,330,000 10,381,481 17,711,4812031-2035 40,045,000 5,699,313 45,744,313
$ 51,280,000 $ 39,465,972 $ 90,745,972
33

MARIN COMMUNITY COLLEGE DISTRICT
NOTES TO FINANCIAL STATEMENTS(Continued)
6. LONG-TERM LIABILITIES (Continued)
General Obligation Bonds (Continued)
In November 2012, the District issued Series D, 2004 General Obligation Bonds aggregating$46,995,000. The bonds mature through August 2036 and bear interest at rates ranging from 3%to 3.25%. The proceeds from the issuance will be used to finance the acquisition, constructionand modernization of certain District property and facilities and pay the costs of issuing Series DBonds. Resulting from the bond issuance, the District received a premium of $401,662 and paidissuance costs of $120,809. The premium is amortized over the life of the bond repayment. AtJune 30, 2015, the District has unamortized premiums of $371,699.
Year EndingJune 30, Principal Interest Total
2016 $ - $ 1,487,500 $ 1,487,5002017 - 1,487,500 1,487,5002018 - 1,487,500 1,487,5002019 - 1,487,500 1,487,5002020 - 1,487,500 1,487,500
2021-2025 - 7,437,500 7,437,5002026-2030 - 7,437,500 7,437,5002031-2035 15,935,000 5,955,725 21,890,7252036-2037 31,060,000 1,027,813 32,087,813
$ 46,995,000 $ 29,296,038 $ 76,291,038
In November 2012, the District issued 2012 General Obligation Refunding Bonds aggregating$44,380,000. The bonds mature through August 2028 and bear interest at rates ranging from2.5% to 4%. The proceeds from the issuance will be used to advance refund a portion of theDistrict's outstanding Election 2004 General Obligation Bonds, Series A and pay the cost ofissuing the Refunding Bonds. Resulting from the bond issuance, the District received a premiumof $7,445,473 and paid issuance costs of $425,765. The premium is amortized over the life ofthe bond repayment. At June 30, 2015, the District has unamortized premiums of $6,566,954.
The annual payments required to amortize the 2012 General Obligation Refunding Bonds as ofJune 30, 2015, are as follows:
Year EndingJune 30, Principal Interest Total
2016 $ - $ 1,670,250 $ 1,670,2502017 1,435,000 1,648,725 3,083,7252018 1,630,000 1,594,600 3,224,6002019 1,945,000 1,523,100 3,468,1002020 2,275,000 1,438,700 3,713,700
2021-2025 16,500,000 5,447,800 21,947,8002026-2029 19,720,000 1,465,400 21,185,400
$ 43,505,000 $ 14,788,575 $ 58,293,575
During the year ended June 30, 2015, the District issued $32,055,000 of 2015 General ObligationRefunding Bonds. The current interest bonds bear interest at rates of 2.00% to 5.00%, maturingAugust 1, 2030. Proceeds were used to advance refund a portion of the outstanding 2004 SeriesA and B General Obligation Bonds and to pay the costs of issuing the 2015 Refunding Bonds. AtJune 30, 2015, the District has unamortized premiums of $4,432,287.
34
MARIN COMMUNITY COLLEGE DISTRICT
NOTES TO FINANCIAL STATEMENTS(Continued)
6. LONG-TERM LIABILITIES (Continued)
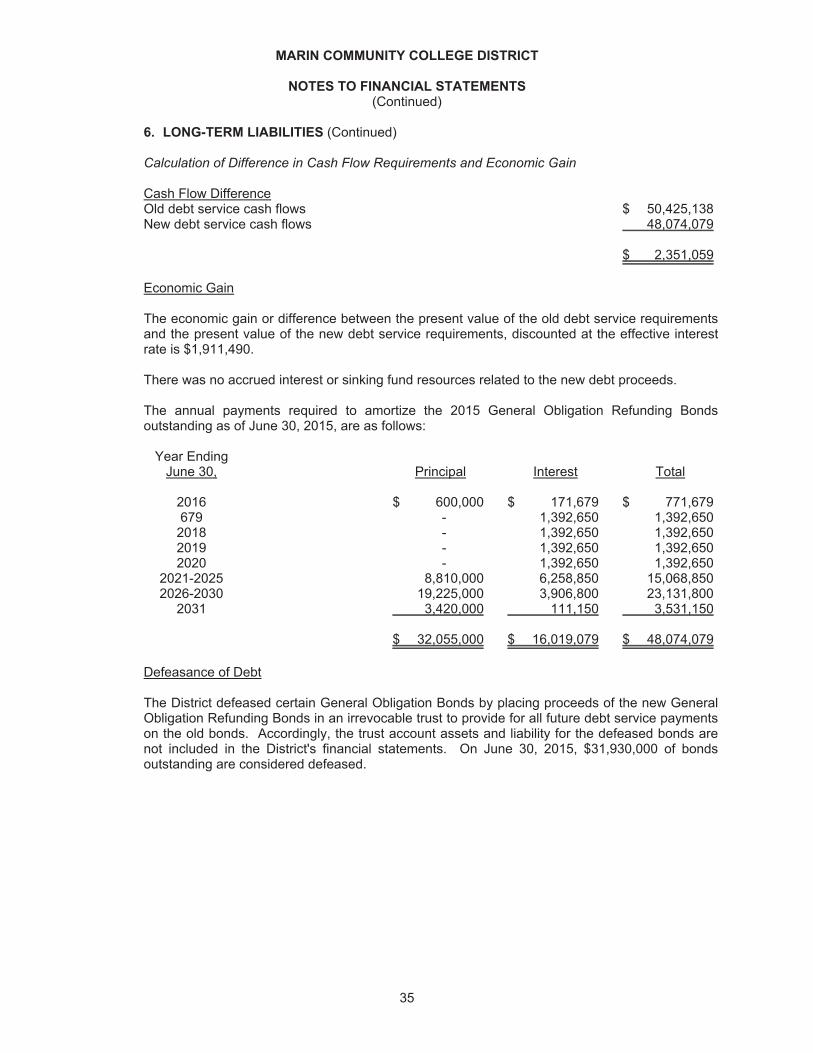
Calculation of Difference in Cash Flow Requirements and Economic Gain
Cash Flow DifferenceOld debt service cash flows $ 50,425,138New debt service cash flows 48,074,079
$ 2,351,059
Economic Gain
The economic gain or difference between the present value of the old debt service requirementsand the present value of the new debt service requirements, discounted at the effective interestrate is $1,911,490.
There was no accrued interest or sinking fund resources related to the new debt proceeds.
The annual payments required to amortize the 2015 General Obligation Refunding Bondsoutstanding as of June 30, 2015, are as follows:
Year EndingJune 30, Principal Interest Total
2016 $ 600,000 $ 171,679 $ 771,679679 - 1,392,650 1,392,650
2018 - 1,392,650 1,392,6502019 - 1,392,650 1,392,6502020 - 1,392,650 1,392,650
2021-2025 8,810,000 6,258,850 15,068,8502026-2030 19,225,000 3,906,800 23,131,800
2031 3,420,000 111,150 3,531,150
$ 32,055,000 $ 16,019,079 $ 48,074,079
Defeasance of Debt
The District defeased certain General Obligation Bonds by placing proceeds of the new GeneralObligation Refunding Bonds in an irrevocable trust to provide for all future debt service paymentson the old bonds. Accordingly, the trust account assets and liability for the defeased bonds arenot included in the District's financial statements. On June 30, 2015, $31,930,000 of bondsoutstanding are considered defeased.
35

MARIN COMMUNITY COLLEGE DISTRICT
NOTES TO FINANCIAL STATEMENTS(Continued)
6. LONG-TERM LIABILITIES (Continued)
Lease Revenue Bonds
In June 2003, the District issued $3,070,834 of Lease Revenue Bonds with effective interestrates ranging from 2.0% to 4.25% and maturing through May 2033. The bond proceeds arebeing used to fund various capital improvement projects throughout the District.
The annual payments required to amortize the Lease Revenue Bonds outstanding as ofJune 30, 2015, are as follows:
Year EndingJune 30, Principal Interest Total
2016 $ 85,000 $ 26,139 $ 111,1392017 95,000 22,951 117,9512018 100,000 19,294 119,2942019 110,000 15,294 125,2942020 125,000 10,894 135,894
2021-2025 828,755 1,234,009 2,062,7642026-2030 806,195 1,989,437 2,795,6322031-2033 450,884 1,458,146 1,909,030
$ 2,600,834 $ 4,776,164 $ 7,376,998
Note Payable - PG&E
In July 2014, the District entered into an On Bill Financing Loan with PG&E with an effectiveinterest rate of 0% and expiring in February 2022. The loan is used as financing for an energyefficiency retrofit.
The annual payments required to amortize the PG&E loan outstanding as of June 30, 2015, areas follows:
Year EndingJune 30, Principal Interest Total
2016 $ 66,186 $ - $ 66,1862017 77,924 - 77,9242018 77,924 - 77,9242019 77,924 - 77,9242020 77,924 - 77,924
2021-2022 134,852 - 134,852
$ 512,734 $ - $ 512,734
36

MARIN COMMUNITY COLLEGE DISTRICT
NOTES TO FINANCIAL STATEMENTS(Continued)
6. LONG-TERM LIABILITIES (Continued)
Supplemental Employee Retirement Plan
During the fiscal year ended June 30, 2014 and 2015, the District provided the option of aSupplemental Employee Retirement Plan to the District employees. Employees under the SERPwill receive monthly annuity benefits. The District is obligated to pay annual installments for thecalculated benefits for employees under the SERP and for the administration of the plan.
The annual requirements to amortize the SERP liability outstanding as of June 30, 2015 are asfollows:
Year EndingJune 30,
2016 $ 733,5022017 733,5022018 359,0932019 266,431
$ 2,092,528
Changes in Long-Term Debt
A schedule of changes in long-term debt for the year ended June 30, 2015 is as follows:
Balance Balance AmountsJuly 1, 2014 June 30, Due Withinas restated Additions Deductions 2015 Year
General Obligation Bonds $ 220,770,000 $ 32,055,000 $ 34,190,000 $ 218,635,000 $ 3,030,000Lease Revenue Bonds 2,675,834 - 75,000 2,600,834 85,000Bond Premium 10,268,238 4,471,615 1,625,672 13,114,181 743,788Net pension liability (Notes 9 & 10) 43,600,649 - 8,435,524 35,165,125 -Compensated Absences 1,127,502 - 153,612 973,890 252,724SERP Liability 1,746,430 1,363,737 1,017,639 2,092,528 733,502Note payable - PG&E 62,808 457,463 7,537 512,734 66,186Capital leases obligations 276,525 - 55,159 221,366 56,478
$ 236,927,337 $ 38,347,815 $ 37,124,619 $ 273,315,658 $ 4,967,678
7. PROPERTY TAXES
All property taxes are levied and collected by the Tax Assessor of the County of Marin and paidupon collection to the various taxing entities including the District. Secured taxes are levied onJuly 1 and are due in two installments on November 1 and February 1, and become delinquenton December 10 and April 10, respectively. The lien date for secured and unsecured propertytaxes is March 1 of the preceding fiscal year.
37
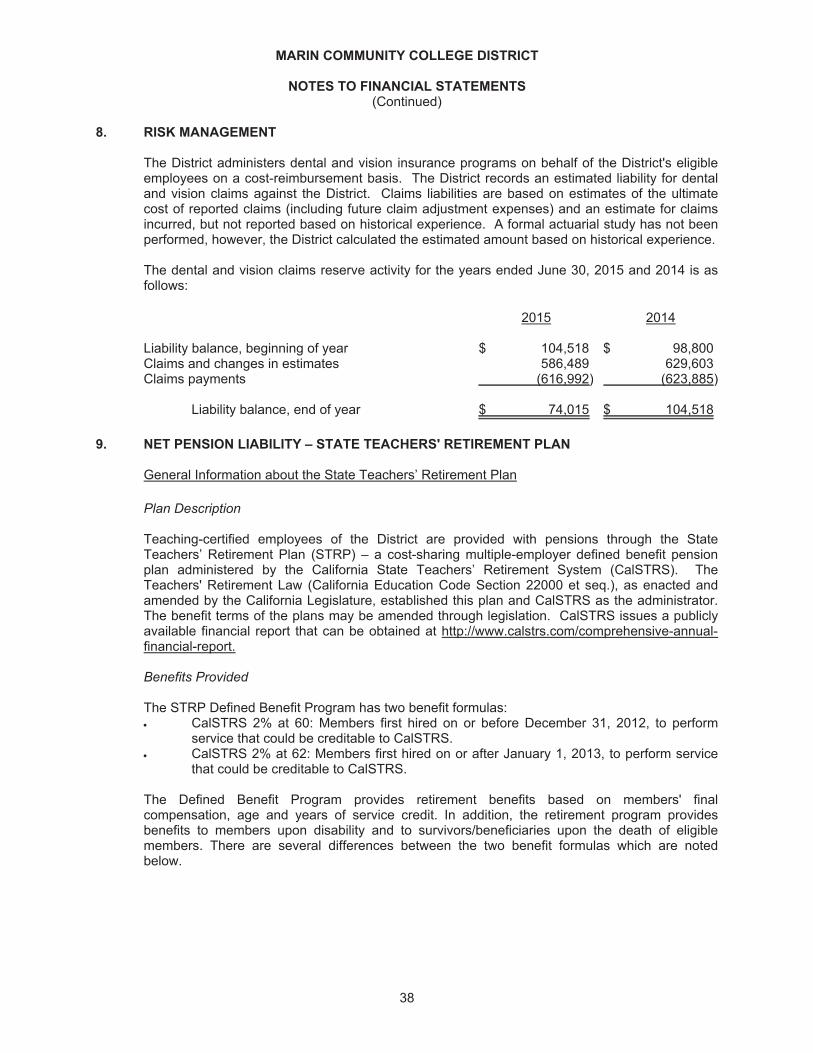
MARIN COMMUNITY COLLEGE DISTRICT
NOTES TO FINANCIAL STATEMENTS(Continued)
8. RISK MANAGEMENT
The District administers dental and vision insurance programs on behalf of the District's eligibleemployees on a cost-reimbursement basis. The District records an estimated liability for dentaland vision claims against the District. Claims liabilities are based on estimates of the ultimatecost of reported claims (including future claim adjustment expenses) and an estimate for claimsincurred, but not reported based on historical experience. A formal actuarial study has not beenperformed, however, the District calculated the estimated amount based on historical experience.
The dental and vision claims reserve activity for the years ended June 30, 2015 and 2014 is asfollows:
2015 2014
Liability balance, beginning of year $ 104,518 $ 98,800Claims and changes in estimates 586,489 629,603Claims payments (616,992) (623,885)
Liability balance, end of year $ 74,015 $ 104,518
9. NET PENSION LIABILITY – STATE TEACHERS' RETIREMENT PLAN
General Information about the State Teachers’ Retirement Plan
Plan Description
Teaching-certified employees of the District are provided with pensions through the StateTeachers’ Retirement Plan (STRP) – a cost-sharing multiple-employer defined benefit pensionplan administered by the California State Teachers’ Retirement System (CalSTRS). TheTeachers' Retirement Law (California Education Code Section 22000 et seq.), as enacted andamended by the California Legislature, established this plan and CalSTRS as the administrator.The benefit terms of the plans may be amended through legislation. CalSTRS issues a publiclyavailable financial report that can be obtained at http://www.calstrs.com/comprehensive-annual-financial-report.
Benefits Provided
The STRP Defined Benefit Program has two benefit formulas: CalSTRS 2% at 60: Members first hired on or before December 31, 2012, to performservice that could be creditable to CalSTRS.CalSTRS 2% at 62: Members first hired on or after January 1, 2013, to perform servicethat could be creditable to CalSTRS.
The Defined Benefit Program provides retirement benefits based on members' finalcompensation, age and years of service credit. In addition, the retirement program providesbenefits to members upon disability and to survivors/beneficiaries upon the death of eligiblemembers. There are several differences between the two benefit formulas which are notedbelow.
38

MARIN COMMUNITY COLLEGE DISTRICT
NOTES TO FINANCIAL STATEMENTS(Continued)
9. NET PENSION LIABILITY – STATE TEACHERS' RETIREMENT PLAN (Continued)
General Information about the State Teachers’ Retirement Plan (Continued)
Benefits Provided (Continued)
CalSTRS 2% at 60
CalSTRS 2% at 60 members are eligible for normal retirement at age 60, with a minimum of fiveyears of credited service. The normal retirement benefit is equal to 2.0 percent of finalcompensation for each year of credited service. Early retirement options are available at age 55with five years of credited service or as early as age 50 with 30 years of credited service. Theage factor for retirements after age 60 increases with each quarter year of age to 2.4 percent atage 63 or older. Members who have 30 years or more of credited service receive an additionalincrease of up to 0.2 percent to the age factor, known as the career factor. The maximum benefitwith the career factor is 2.4 percent of final compensation.
CalSTRS calculates retirement benefits based on a one-year final compensation for memberswho retired on or after January 1, 2001, with 25 or more years of credited service, or forclassroom teachers with less than 25 years of credited service if the employer elected to pay theadditional benefit cost prior to January 1, 2014. One-year final compensation means a member’shighest average annual compensation earnable for 12 consecutive months calculated by takingthe creditable compensation that a member could earn in a school year while employed on afulltime basis, for a position in which the person worked. For members with less than 25 years ofcredited service, final compensation is the highest average annual compensation earnable forany three consecutive years of credited service.
CalSTRS 2% at 62
CalSTRS 2% at 62 members are eligible for normal retirement at age 62, with a minimum of fiveyears of credited service. The normal retirement benefit is equal to 2.0 percent of finalcompensation for each year of credited service. An early retirement option is available at age 55.The age factor for retirement after age 62 increases with each quarter year of age to 2.4 percentat age 65 or older.
All CalSTRS 2% at 62 members have their final compensation based on their highest averageannual compensation earnable for three consecutive years of credited service.
Contributions
Required member, employer and state contribution rates are set by the California Legislature andGovernor and detailed in Teachers' Retirement Law. Contribution rates are expressed as a levelpercentage of payroll using the entry age normal actuarial cost method.
A summary of statutory contribution rates and other sources of contributions to the DefinedBenefit Program are as follows:
Members – Under CalSTRS 2% at 60, the member contribution rate was 8.15 percent ofapplicable member earnings for fiscal year 2014-15. Under CalSTRS 2% at 62, memberscontribute 50 percent of the normal cost of their retirement plan, which resulted in a contributionrate of 8.15 percent of applicable member earnings for fiscal year 2014-15.
39
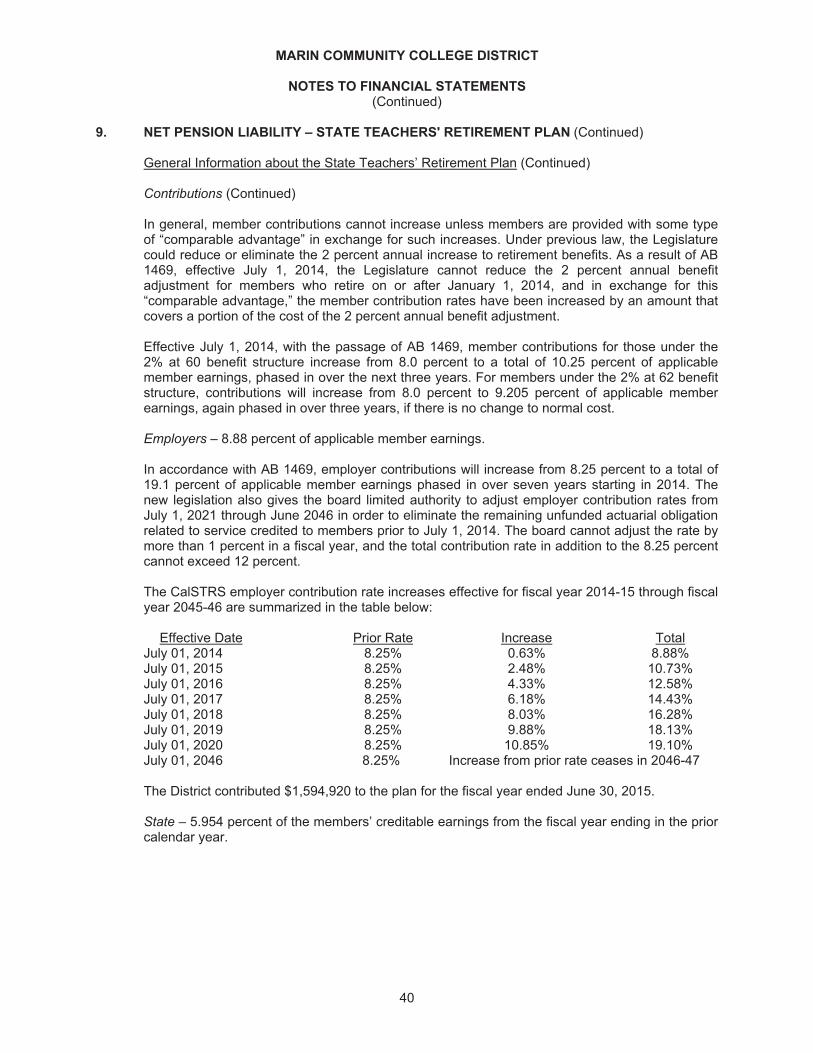
MARIN COMMUNITY COLLEGE DISTRICT
NOTES TO FINANCIAL STATEMENTS(Continued)
9. NET PENSION LIABILITY – STATE TEACHERS' RETIREMENT PLAN (Continued)
General Information about the State Teachers’ Retirement Plan (Continued)
Contributions (Continued)
In general, member contributions cannot increase unless members are provided with some typeof “comparable advantage” in exchange for such increases. Under previous law, the Legislaturecould reduce or eliminate the 2 percent annual increase to retirement benefits. As a result of AB1469, effective July 1, 2014, the Legislature cannot reduce the 2 percent annual benefitadjustment for members who retire on or after January 1, 2014, and in exchange for this“comparable advantage,” the member contribution rates have been increased by an amount thatcovers a portion of the cost of the 2 percent annual benefit adjustment.
Effective July 1, 2014, with the passage of AB 1469, member contributions for those under the2% at 60 benefit structure increase from 8.0 percent to a total of 10.25 percent of applicablemember earnings, phased in over the next three years. For members under the 2% at 62 benefitstructure, contributions will increase from 8.0 percent to 9.205 percent of applicable memberearnings, again phased in over three years, if there is no change to normal cost.
Employers – 8.88 percent of applicable member earnings.
In accordance with AB 1469, employer contributions will increase from 8.25 percent to a total of19.1 percent of applicable member earnings phased in over seven years starting in 2014. Thenew legislation also gives the board limited authority to adjust employer contribution rates fromJuly 1, 2021 through June 2046 in order to eliminate the remaining unfunded actuarial obligationrelated to service credited to members prior to July 1, 2014. The board cannot adjust the rate bymore than 1 percent in a fiscal year, and the total contribution rate in addition to the 8.25 percentcannot exceed 12 percent.
The CalSTRS employer contribution rate increases effective for fiscal year 2014-15 through fiscalyear 2045-46 are summarized in the table below:
Effective Date Prior Rate Increase TotalJuly 01, 2014 8.25% 0.63% 8.88%July 01, 2015 8.25% 2.48% 10.73%July 01, 2016 8.25% 4.33% 12.58%July 01, 2017 8.25% 6.18% 14.43%July 01, 2018 8.25% 8.03% 16.28%July 01, 2019 8.25% 9.88% 18.13%July 01, 2020 8.25% 10.85% 19.10%July 01, 2046 8.25% Increase from prior rate ceases in 2046-47
The District contributed $1,594,920 to the plan for the fiscal year ended June 30, 2015.
State – 5.954 percent of the members’ creditable earnings from the fiscal year ending in the priorcalendar year.
40

MARIN COMMUNITY COLLEGE DISTRICT
NOTES TO FINANCIAL STATEMENTS(Continued)
9. NET PENSION LIABILITY – STATE TEACHERS' RETIREMENT PLAN (Continued)
General Information about the State Teachers’ Retirement Plan (Continued)
Contributions (Continued)
Additionally, beginning October 1, 1998, a statutory contribution rate of 0.524 percent, adjustableannually in 0.25 percent increments up to a maximum of 1.505 percent, of the creditable earningsfrom the fiscal year ending in the prior calendar year per Education Code Section 22955(b). Thiscontribution is reduced to zero if there is no unfunded actuarial obligation and no normal costdeficit for benefits in place as of July 1, 1990. Based on the actuarial valuation, as of June 30,2012 there was no normal cost deficit, but there was an unfunded obligation for benefits in placeas of July 1, 1990. As a result, the state was required to make quarterly payments startingOctober 1, 2013, at an additional contribution rate of 1.024 percent. As of June 30, 2014, thestate contributed $200.7 million of the $267.6 million total amount for fiscal year 2013-14. As aresult of AB 1469, the fourth quarterly payment of $66.9 million was included in an increased firstquarter payment of $94 million for the 2014-15 fiscal year, which was transferred on July 1, 2014.
In accordance with AB 1469, the portion of the state appropriation under Education Code Section22955(b) that is in addition to the 2.017 percent has been replaced by section 22955.1(b) in orderto fully fund the benefits in effect as of 1990 by 2046. The additional state contribution willincrease from 1.437 percent in 2014-15 to 4.311 percent in 2016-17. The increased contributionsend as of fiscal year 2046-47.
The CalSTRS state contribution rates effective for fiscal year 2014-15 and beyond aresummarized in the table below:
AB 1469Increase For Total State
Base 1990 Benefit SBMA AppropriationEffective Date Rate Structure Funding to DB Program
July 01, 2014 2.017% 1.437% 2.50% 5.954%July 01, 2015 2.017% 2.874% 2.50% 7.391%July 01, 2016 2.017% 4.311% 2.50% 8.828% July 01, 2017 toJune 30, 2046 2.017% 4.311%* 2.50% 8.828%* July 01, 2046and thereafter 2.017% * 2.50% 4.571%*
* The new legislation also gives the board limited authority to adjust state contribution rates fromJuly 1, 2017, through June 2046 in order to eliminate the remaining unfunded actuarial obligationassociated with the 1990 benefit structure. The board cannot increase the rate by more than 0.50percent in a fiscal year, and if there is no unfunded actuarial obligation, the contribution rateimposed to pay for the 1990 benefit structure shall be reduced to 0 percent. Rates in effect priorto July 1, 2014, are reinstated if necessary to address any remaining 1990 unfunded actuarialobligation from July 1, 2046, and thereafter.
41

MARIN COMMUNITY COLLEGE DISTRICT
NOTES TO FINANCIAL STATEMENTS(Continued)
9. NET PENSION LIABILITY – STATE TEACHERS' RETIREMENT PLAN (Continued)
Pension Liabilities, Pension Expense, and Deferred Outflows of Resources and Deferred Inflowsof Resources Related to Pensions
At June 30, 2015, the District reported a liability for its proportionate share of the net pensionliability that reflected a reduction for State pension support provided to the District. The amountrecognized by the District as its proportionate share of the net pension liability, the related Statesupport, and the total portion of the net pension liability that was associated with the District wereas follows:
District’s proportionate share of the net pension liability $ 20,662,000State’s proportionate share of the net pension liability
associated with the District 12,477,000
Total $ 33,139,000
The net pension liability was measured as of June 30, 2014, and the total pension liability used tocalculate the net pension liability was determined by an actuarial valuation as of June 30, 2013.The District’s proportion of the net pension liability was based on the District’s share ofcontributions to the pension plan relative to the contributions of all participating school Districtsand the State. At June 30, 2014, the District’s proportion was .035 percent, which was anincrease of zero from its proportion measured as of June 30, 2013.
For the year ended June 30, 2015, the District recognized pension expense of $2,087,232 andrevenue of $297,000 for support provided by the State. At June 30, 2015, the District reporteddeferred outflows of resources and deferred inflows of resources related to pensions from thefollowing sources:
Deferred Outflows Deferred Inflowsof Resources of Resources
Difference between expected and actual experience $ - $ -
Changes of assumptions - -
Net differences between projected and actual earnings on investments - 5,088,000
Changes in proportion and differences between District contributions and proportionate share of contributions - -
Contributions made subsequent tomeasurement date 1,594,920 -
Total $ 1,594,920 $ 5,088,000
42

MARIN COMMUNITY COLLEGE DISTRICT
NOTES TO FINANCIAL STATEMENTS(Continued)
9. NET PENSION LIABILITY – STATE TEACHERS' RETIREMENT PLAN (Continued)
Pension Liabilities, Pension Expense, and Deferred Outflows of Resources and Deferred Inflowsof Resources Related to Pensions (Continued)
$1,594,920 reported as deferred outflows of resources related to pensions resulting fromcontributions subsequent to the measurement date will be recognized as a reduction of the netpension liability in the year ended June 30, 2016. Other amounts reported as deferred outflows ofresources and deferred inflows of resources related to pensions will be recognized in pensionexpense as follows:
2016 $ 1,272,0002017 $ 1,272,0002018 $ 1,272,0002019 $ 1,272,000
The schedule includes only certain categories of deferred outflows of resources and deferredinflows of resources. These include differences between expected and actual experience,changes of assumptions and differences between projected and actual earnings on planinvestments. The schedule does not include deferred outflows/inflows of resources for changes inthe employer’s proportionate share of contributions. Differences between expected and actualexperience and changes in assumptions are amortized over a closed period equal to the averageremaining service life of plan members, which is 7 years as of June 30, 2014. The STRP netpension liability as of June 30, 2013 and the STRP net pension liability as of June 30, 2014 arebased on the June 30, 2013 actuarial valuation for the first year of implementation. As a resultthere are no differences between expected and actual experience or changes in assumptionssubject to amortization. Deferred outflows and inflows related to differences between projectedand actual earrings on plan investments are netted and amortized over a closed 5-year period.
Actuarial Methods and Assumptions
The total pension liability for the STRP was determined by applying update procedures to afinancial reporting actuarial valuation as of June 30, 2013, and rolling forward the total pensionliability to June 30, 2014. The financial reporting actuarial valuation as of June 30, 2013, used thefollowing actuarial methods and assumptions, applied to all prior periods included in themeasurement:
Valuation Date June 30, 2013Experience Study July 1, 2006, through June 30, 2010Actuarial Cost Method Entry age normalInvestment Rate of Return 7.60%Consumer Price Inflation 3.00%Wage Growth 3.75%Post-retirement Benefit Increases 2.00% simple for DB
Not applicable for DBS/CBB
CalSTRS uses custom mortality tables to best fit the patterns of mortality among its members.These custom tables are based on RP2000 series tables adjusted to fit CalSTRS experience.RP2000 series tables are an industry standard set of mortality rates published by the Society ofActuaries. See CalSTRS July 1, 2006 – June 30, 2010 experience analysis for more information.
43

MARIN COMMUNITY COLLEGE DISTRICT
NOTES TO FINANCIAL STATEMENTS(Continued)
9. NET PENSION LIABILITY – STATE TEACHERS' RETIREMENT PLAN (Continued)
Pension Liabilities, Pension Expense, and Deferred Outflows of Resources and Deferred Inflowsof Resources Related to Pensions (Continued)
Actuarial Methods and Assumptions (Continued)
The long-term expected rate of return on pension plan investments was determined using abuilding-block method in which best-estimate ranges of expected future real rates of return(expected returns, net of pension plan investment expense and inflation) are developed for eachmajor asset class. The best estimate ranges were developed using capital market assumptionsfrom CalSTRS general investment consultant as an input to the process. Based on the modelfrom CalSTRS consulting actuary’s investment practice, a best estimate range was determinedby assuming the portfolio is re-balanced annually and that annual returns are log normallydistributed and independent from year to year to develop expected percentiles for the long-termdistribution of annualized returns. The assumed asset allocation by PCA is based on board policyfor target asset allocation in effect on February 2, 2012, the date the current experience studywas approved by the board. Best estimates of 10-year geometric real rates of return and theassumed asset allocation for each major asset class used as input to develop the actuarialinvestment rate of return are summarized in the following table:
Long-Term*Assumed Asset Expected Real
Asset Class Allocation Rate of Return
Global Equity 47% 4.50%Private Equity 12 6.20Real Estate 15 4.35Inflation Sensitive 5 3.20Fixed Income 20 0.20Cash / Liquidity 1 0.00
* 10-year geometric average
Discount Rate
The discount rate used to measure the total pension liability was 7.60 percent. The projection ofcash flows used to determine the discount rate assumed that contributions from plan membersand employers will be made at statutory contribution rates in accordance with the rate increaseper Assembly Bill 1469. Projected inflows from investment earnings were calculated using thelong-term assumed investment rate of return (7.60 percent) and assuming that contributions,benefit payments, and administrative expense occur midyear. Based on those assumptions, theSTRP’s fiduciary net position was projected to be available to make all projected future benefitpayments to current plan members. Therefore, the long-term assumed investment rate of returnwas applied to all periods of projected benefit payments to determine the total pension liability.
44

MARIN COMMUNITY COLLEGE DISTRICT
NOTES TO FINANCIAL STATEMENTS(Continued)
9. NET PENSION LIABILITY – STATE TEACHERS' RETIREMENT PLAN (Continued)
Pension Liabilities, Pension Expense, and Deferred Outflows of Resources and Deferred Inflowsof Resources Related to Pensions (Continued)
Sensitivity of the District’s Proportionate Share of the Net Pension Liability to Changes in theDiscount Rate
The following presents the District’s proportionate share of the net pension liability calculatedusing the discount rate of 7.60 percent, as well as what the District’s proportionate share of thenet pension liability would be if it were calculated using a discount rate that is 1-percentage-pointlower (6.60 percent) or 1-percentage-point higher (8.60 percent) than the current rate:
1% Current 1%Decrease Discount Increase(6.60%) Rate (7.60%) (8.60%)
District’s proportionate share ofthe net pension liability $ 32,206,000 $ 20,662,000 $ 11,036,000
Pension Plan Fiduciary Net Position
Detailed information about the pension plan’s fiduciary net position is available in the separatelyissued CalSTRS financial report.
10. NET PENSION LIABILITY – PUBLIC EMPLOYER’S RETIREMENT FUND B
General Information about the Public Employer’s Retirement Fund B
Plan Description
The schools cost-sharing multiple-employer defined benefit pension plan Public Employer’sRetirement Fund B (PERF B) is administered by the California Public Employees’ RetirementSystem (CalPERS). Plan membership consists of non-teaching and non-certified employees ofpublic schools (K-12), community college districts, offices of education, charter and privateschools (elective) in the State of California.
The Plan was established to provide retirement, death and disability benefits to non-teaching andnoncertified employees in schools. The benefit provisions for Plan employees are established bystatute. CalPERS issues a publicly available financial report that can be obtained athttps://www.calpers.ca.gov/docs/forms-publications/cafr-2014.pdf.
Benefits Provided
The benefits for the defined benefit plans are based on members’ years of service, age, finalcompensation, and benefit formula. Benefits are provided for disability, death, and survivors ofeligible members or beneficiaries. Members become fully vested in their retirement benefitsearned to date after five years (10 years for State Second Tier members) of credited service.
45

MARIN COMMUNITY COLLEGE DISTRICT
NOTES TO FINANCIAL STATEMENTS(Continued)
10. NET PENSION LIABILITY – PUBLIC EMPLOYER’S RETIREMENT FUND B (Continued)
General Information about the Public Employer’s Retirement Fund B (Continued)
Contributions
The benefits for the defined benefit pension plans are funded by contributions from members andemployers, and earnings from investments. Member and employer contributions are apercentage of applicable member compensation. Member contribution rates are defined by lawand depend on the respective employer’s benefit formulas. Employer contribution rates aredetermined by periodic actuarial valuations or by state statute. Actuarial valuations are based onthe benefit formulas and employee groups of each employer. Employer contributions, includinglump sum contributions made when agencies first join the PERF, are credited with a market valueadjustment in determining contribution rates.
The required contribution rates of most active plan members are based on a percentage of salaryin excess of a base compensation amount ranging from zero dollars to $863 monthly.
Required contribution rates for active plan members and employers as a percentage of payroll forthe year ended June 30, 2015 were as follows:
Members – The member contribution rate was 6.0 or 7.0 percent of applicable member earningsfor fiscal year 2014-15.
Employers – The employer contribution rate was 11.771 percent of applicable member earnings.
The District contributed $2,360,150 to the plan for the fiscal year ended June 30, 2015.
Pension Liabilities, Pension Expense, and Deferred Outflows of Resources and Deferred Inflowsof Resources Related to Pensions
At June 30, 2015, the District reported a liability of $14,503,125 for its proportionate share of thenet pension liability. The net pension liability was measured as of June 30, 2014, and the totalpension liability used to calculate the net pension liability was determined by an actuarialvaluation as of that date. The District’s proportion of the net pension liability was based on aprojection of the District’s long-term share of contributions to the pension plan relative to theprojected contributions of all participating school Districts, actuarially determined. At June 30,2014, the District’s proportion was 0.01 percent, which was an increase of 0.008 percent from itsproportion measured as of June 30, 2013.
46
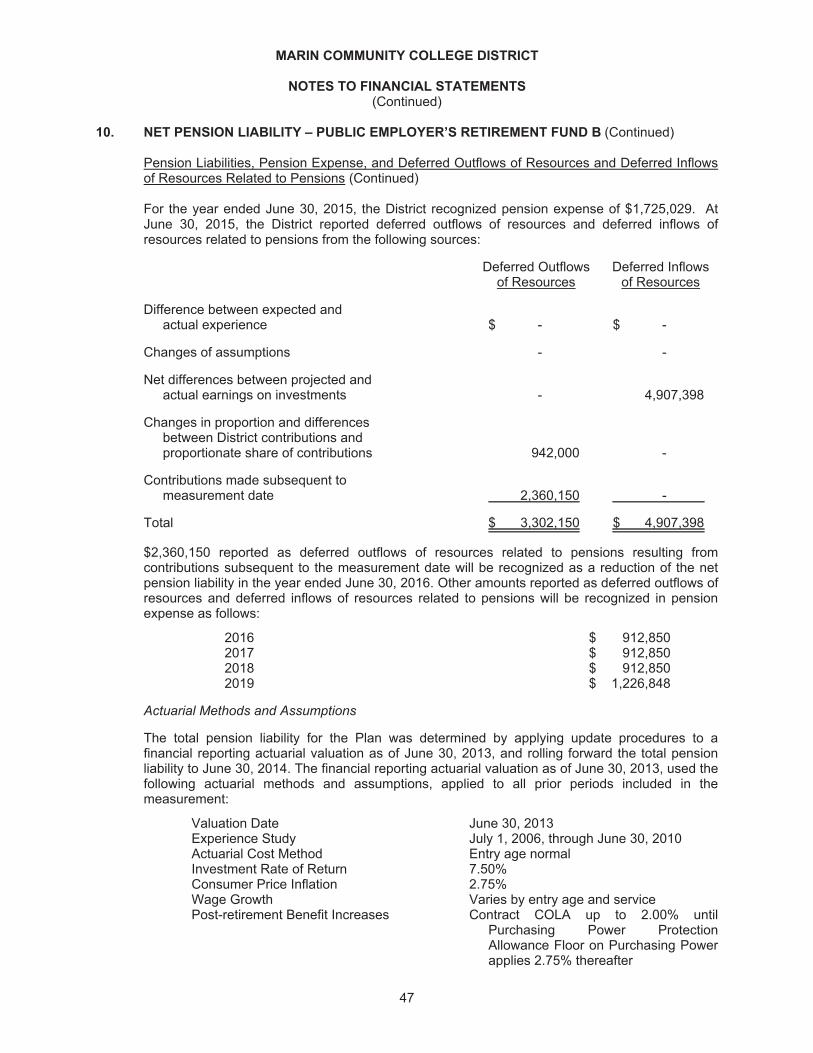
MARIN COMMUNITY COLLEGE DISTRICT
NOTES TO FINANCIAL STATEMENTS(Continued)
10. NET PENSION LIABILITY – PUBLIC EMPLOYER’S RETIREMENT FUND B (Continued)
Pension Liabilities, Pension Expense, and Deferred Outflows of Resources and Deferred Inflowsof Resources Related to Pensions (Continued)
For the year ended June 30, 2015, the District recognized pension expense of $1,725,029. AtJune 30, 2015, the District reported deferred outflows of resources and deferred inflows ofresources related to pensions from the following sources:
Deferred Outflows Deferred Inflowsof Resources of Resources
Difference between expected andactual experience $ - $ -
Changes of assumptions - -
Net differences between projected andactual earnings on investments - 4,907,398
Changes in proportion and differencesbetween District contributions and proportionate share of contributions 942,000 -
Contributions made subsequent tomeasurement date 2,360,150 -
Total $ 3,302,150 $ 4,907,398
$2,360,150 reported as deferred outflows of resources related to pensions resulting fromcontributions subsequent to the measurement date will be recognized as a reduction of the netpension liability in the year ended June 30, 2016. Other amounts reported as deferred outflows ofresources and deferred inflows of resources related to pensions will be recognized in pensionexpense as follows:
2016 $ 912,8502017 $ 912,8502018 $ 912,8502019 $ 1,226,848
Actuarial Methods and Assumptions
The total pension liability for the Plan was determined by applying update procedures to afinancial reporting actuarial valuation as of June 30, 2013, and rolling forward the total pensionliability to June 30, 2014. The financial reporting actuarial valuation as of June 30, 2013, used thefollowing actuarial methods and assumptions, applied to all prior periods included in themeasurement:
Valuation Date June 30, 2013Experience Study July 1, 2006, through June 30, 2010Actuarial Cost Method Entry age normalInvestment Rate of Return 7.50%Consumer Price Inflation 2.75%Wage Growth Varies by entry age and servicePost-retirement Benefit Increases Contract COLA up to 2.00% until
Purchasing Power ProtectionAllowance Floor on Purchasing Powerapplies 2.75% thereafter
47

MARIN COMMUNITY COLLEGE DISTRICT
NOTES TO FINANCIAL STATEMENTS(Continued)
10. NET PENSION LIABILITY – PUBLIC EMPLOYER’S RETIREMENT FUND B (Continued)
Pension Liabilities, Pension Expense, and Deferred Outflows of Resources and Deferred Inflowsof Resources Related to Pensions (Continued)
Actuarial Methods and Assumptions (Continued)
The mortality table used was developed based on CalPERS specific data. The table includes 20years of mortality improvements using Society of Actuaries Scale BB. For more details on thistable, please refer to the 2014 experience study report.
All other actuarial assumptions used in the June 30, 2013 valuation were based on the results ofan actuarial experience study for the period from 1997 to 2011, including updates to salaryincrease, mortality and retirement rates. Further details of the Experience Study can be found atCalPERS’ website.
The table below reflects long-term expected real rate of return by asset class. The rate of returnwas calculated using the capital market assumptions applied to determine the discount rate andasset allocation.
Long-Term*Assumed Asset Expected Real
Asset Class Allocation Rate of Return
Global Equity 47% 5.25%Global Fixed Income 19 0.99Inflation Insensitive 6 0.45Private Equity 12 6.83Real Estate 11 4.50Infrastructure & Forestland 3 4.50Liquidity 2 (0.55)
* 10-year geometric average
Discount Rate
The discount rate used to measure the total pension liability was 7.50 percent. A projection ofthe expected benefit payments and contributions was performed to determine if assets would runout. The test revealed the assets would not run out. Therefore the long-term expected rate ofreturn on pension plan investments was applied to all periods of projected benefit payments todetermine the total pension liability for the Plan. The results of the crossover testing for the Planare presented in a detailed report that can be obtained at CalPERS’ website.
According to Paragraph 30 of Statement 68, the long-term discount rate should be determinedwithout reduction for pension plan administrative expense. The 7.50 percent investment returnassumption used in the actuarial valuation is net of administrative expenses. Administrativeexpenses are assumed to be 15 basis points. An investment return excluding administrativeexpenses would have been 7.65 percent. Using this lower discount rate has resulted in a slightlyhigher total pension liability and net pension liability. This difference was deemed immaterial tothe Plan and the District.
The long-term expected rate of return on pension plan investments was determined using abuilding-block method in which best-estimate ranges of expected future real rates of return(expected returns, net of pension plan investment expense and inflation) are developed for eachmajor asset class.
48

MARIN COMMUNITY COLLEGE DISTRICT
NOTES TO FINANCIAL STATEMENTS(Continued)
10. NET PENSION LIABILITY – PUBLIC EMPLOYER’S RETIREMENT FUND B (Continued)
Pension Liabilities, Pension Expense, and Deferred Outflows of Resources and Deferred Inflowsof Resources Related to Pensions (Continued)
Discount Rate (Continued)
In determining the long-term expected rate of return, CalPERS took into account both short-termand long-term market return expectations as well as the expected cash flows of the Plan. Suchcash flows were developed assuming that both members and employers will make their requiredcontributions on time and as scheduled in all future years. Using historical returns of all the Plan’sasset classes, expected compound (geometric) returns were calculated over the short-term (first10 years) and the long-term (11-60 years) using a building-block approach. Using the expectednominal returns for both short-term and long-term, the present value of benefits was calculated.The expected rate of return was set by calculating the single equivalent expected return thatarrived at the same present value of benefits for cash flows as the one calculated using bothshort-term and long-term returns. The expected rate of return was then set equivalent to thesingle equivalent rate calculated above and rounded down to the nearest one quarter of onepercent.
Sensitivity of the District’s Proportionate Share of the Net Pension Liability to Changes in theDiscount Rate
The following presents the District’s proportionate share of the net pension liability calculatedusing the discount rate of 7.50 percent, as well as what the District’s proportionate share of thenet pension liability would be if it were calculated using a discount rate that is 1-percentage-pointlower (6.50 percent) or 1-percentage-point higher (8.50 percent) than the current rate:
1% Current 1%Decrease Discount Increase(6.50%) Rate (7.50%) (8.50%)
District's proportionate share ofthe net pension liability $ 25,370,000 $ 14,503,000 $ 5,287,000
Pension Plan Fiduciary Net Position
Detailed information about the pension plan’s fiduciary net position is available in the separatelyissued CalPERS financial report.
11. OTHER POSTEMPLOYMENT BENEFITS
In addition to the pension benefits described in Note 9 and 10, the District provides post-retirement health care benefits to employees hired prior to 1988 and who retire from the Districtand meet the specific eligibility requirements set forth in their prospective employment contracts.The District pays medical and dental insurance premiums to maintain the level of coverageenjoyed by the retiree immediately preceding retirement up until the age of 70 or death of theretiree.
49

MARIN COMMUNITY COLLEGE DISTRICT
NOTES TO FINANCIAL STATEMENTS(Continued)
11. OTHER POSTEMPLOYMENT BENEFITS (Continued)
The District's annual other postemployment benefit (OPEB) cost (expense) is calculated basedon the annual required contribution of the employer (ARC), an amount actuarially determined inaccordance with the parameters of GASB Cod. Sec. P50.108-.109. The ARC represents a levelof funding that, if paid on an ongoing basis, is projected to cover normal cost each year andamortize any unfunded actuarial liabilities (or funding excess) over a period not to exceed thirtyyears. The following table shows the components of the District's annual OPEB cost for the year,the amount actually contributed, and changes in the District's net OPEB obligation:
Annual required contribution $ 254,077
Interest on net OPEB obligation -
Adjustment to annual required contribution 257,505
Annual OPEB cost (expense) 511,582
Contributions made (969,724)
Change in net OPEB obligation (458,142)
Net OPEB obligation (asset) - beginning of year (1,829,699)
Net OPEB obligation (asset) - end of year $ (2,287,841)
The District's annual OPEB cost, the percentage of annual OPEB cost contributed to the plan,and the net OPEB obligation for the year ended June 30, 2015 and the preceding two years wereas follows:
Percentageof Annual Net OPEB
Fiscal Year Annual OPEB Cost ObligationEnded OPEB Cost Contributed (Asset)
June 30, 2013 $ 757,875 383.3% $ (1,845,971)June 30, 2014 $ 853,349 98.1% $ (1,829,699)June 30, 2015 $ 511,582 189.6% $ (2,287,841)
As of April 21, 2015, the most recent actuarial valuation date, the plan was 75.8 percent funded.The actuarial accrued liability for benefits was $3,631,365, and the actuarial value of assets was$2,753,999, resulting in an unfunded actuarial accrued liability (UAAL) of $877,366. The coveredpayroll (annual payroll of active employees covered by the Plan) was $1,863,851, and the ratio ofthe UAAL to the covered payroll was 47 percent.
Benefits are provided by the District on a pay-as-you-go basis. The District does maintain aretiree benefit trust fund ("OPEB Trust"), a single-employer defined benefit OPEB plan. TheOPEB Trust is administered by Benefit Trust and is included in the District's financial report as aseparately presented fiduciary fund. Contribution requirements for plan members are establishedand may be amended by the District's Board of Trustees through the collective bargainingprocess. Plan members meeting certain eligibility requirements contribute 1% of earnings and theDistrict matches those contributions.
50

MARIN COMMUNITY COLLEGE DISTRICT
NOTES TO FINANCIAL STATEMENTS(Continued)
11. OTHER POSTEMPLOYMENT BENEFITS (Continued)
Actuarial valuations of an ongoing plan involve estimates of the value of reported amounts andassumptions about the probability of occurrence of events far into the future. Examples includeassumptions about future employment, mortality, and the healthcare cost trend. Amountsdetermined regarding the funded status of the plan and the annual required contributions of theemployer are subject to continual revision as actual results are compared with past expectationsand new estimates are made about the future. The schedule of funding progress presented asRequired Supplementary Information following the notes to the financial statements, presentsmultiyear trend information about whether the actuarial value of plan assets is increasing ordecreasing over time relative to the actuarial accrued liabilities for benefits starting in 2013 whenthe trust was formed.
Projections of benefits for financial reporting purposes are based on the substantive plan (theplan as understood by the employer and the plan members) and include the types of benefitsprovided at the time of each valuation and the historical pattern of sharing of benefit costsbetween the employer and plan members to that point. The actuarial methods and assumptionsused include techniques that are designed to reduce the effects of short-term volatility in actuarialaccrued liabilities and the actuarial value of assets, consistent with the long-term perspective ofthe calculations.
In the April 21, 2015, actuarial valuation, the entry age actuarial cost method was used. Theactuarial assumptions included a 6.75 percent investment rate of return (net of administrativeexpenses), which is a blended rate of the expected long-term investment returns on plan assetsand on the employer's own investments calculated based on the funded level of the plan on thevaluation date, and an annual healthcare cost trend rate of 4 percent. Both rates include a 2.75percent inflation assumption. The actuarial value of assets was determined using techniques thatspread the effects of short-term volatility in the market value of investments over a five-yearperiod. The UAAL is being amortized as a level percentage of projected payroll on an openbasis. The remaining amortization period at June 30, 2015, was 10 years.
12. COMMITMENTS AND CONTINGENCIES
Contingent Liabilities
There are various claims and legal actions pending against the District for which no provision hasbeen made in the general purpose financial statements. In the opinion of the District, anyliabilities arising from these claims and legal actions are not considered significant.
The District has received Federal and State funds for specific purposes that are subject to reviewor audit by the grantor agencies. Although such audits could result in expenditure disallowancesunder terms of the grants, it is management's opinion that any required reimbursements or futurerevenue offsets subsequently determined will not have a material effect.
Construction Commitments
As of June 30, 2015, the District has $1,293,189 in outstanding commitments on constructioncontracts.
51

MARIN COMMUNITY COLLEGE DISTRICT
NOTES TO FINANCIAL STATEMENTS(Continued)
13. JOINT POWERS AGREEMENTS
Marin Community College District participates in Joint Power Agreements (JPAs), with NorthernCalifornia Community College Self Insurance Authority (NCCCSIA), Schools Excess LiabilityFund (SELF), Marin Schools Insurance Authority (MSIA) and Statewide Association ofCommunity Colleges (SWACC). The relationship between Marin Community College District andthe JPAs is such that the JPAs are not component units of Marin Community College District forfinancial reporting purposes.
The JPAs are governed by boards consisting of a representative from each member district. Theboards control the operations of the JPAs, including the selection of management and approvalof operating budgets, independent of any influence by the member district beyond theirrepresentation on the governing board. NCCCSIA, SELF and SWACC provide property andliability insurance for its members. MSIA provides workers' compensation insurance for itsmembers. Marin Community College District pays a premium commensurate with the level ofcoverage requested. Settled claims resulting from these risks have not exceeded insurancecoverage on any of the past three years.
Member districts share surpluses and deficits proportionate to their participation in the JPAs. TheJPAs are independently accountable for their fiscal matters and maintain their own accountingrecords. Budgets are not subject to any approval other than that of the governing board.
Condensed financial information of the JPAs for the most current year for which auditedinformation is available, is as follows:
NCCCSIA SELF MSIA SWACCJune 30, 2014 June 30, 2015 June 30, 2015 June 30, 2014
Total assets and and deferred outflows $ 3,136,348 $ 154,826,708 $ 26,777,095 $ 54,045,044Total liabilities and and deferred inflows $ 1,134,262 $ 122,637,079 $ 22,881,562 $ 23,536,002Net position $ 2,002,086 $ 32,189,629 $ 3,895,533 $ 30,509,042Total revenues $ 7,708,060 $ 11,968,752 $ 12,224,203 $ 9,348,523Total expenses $ 8,282,437 $ 23,063,637 $ 15,658,189 $ 10,082,446Change in net position $ (574,377) $ (11,094,885) $ (3,433,986) $ (733,923)
52

REQUIRED SUPPLEMENTARY INFORMATION

MARIN COMMUNITY COLLEGE DISTRICT
SCHEDULE OF OTHER POSTEMPLOYMENT BENEFITS (OPEB)FUNDING PROGRESS
For the Year Ended June 30, 2015
Schedule of Funding Progress Unfunded UAAL as a
Actuarial Actuarial PercentageActuarial Actuarial Accrued Accrued ofValuation Value of Liability Liability Funded Covered Covered
Date Assets (AAL) (UAAL) Ratio Payroll Payroll
September 1, 2008 $ - $ 7,312,141 $ 7,312,141 0% $ 5,974,919 122%September 1, 2010 $ - $ 6,604,857 $ 6,604,857 0% $ 4,058,179 163%April 29, 2013 $ - $ 5,188,334 $ 5,188,334 0% $ 1,938,814 268%April 21, 2015 $ 2,753,999 $ 3,631,365 $ 877,366 76% $ 1,863,366 47%
See accompanying notes to required supplementary information.
53

MARIN COMMUNITY COLLEGE DISTRICT
SCHEDULE OF EMPLOYER CONTRIBUTIONS
For the Year Ended June 30, 2015
Fiscal Annual Required Percentage ofYear Contribution ARC
Ended (ARC) Contributions Contributed
June 30, 2013 $ 771,401 $ 2,908,545 377%June 30, 2014 $ 771,401 $ 837,077 109%June 30, 2015 $ 254,077 $ 969,724 382%
See accompanying notes to required supplementary information.
54

MARIN COMMUNITY COLLEGE DISTRICT
SCHEDULE OF THE DISTRICT’S PROPORTIONATE SHARE OF THE NET PENSION LIABILITY
For the Year Ended June 30, 2015
State Teacher's Retirement PlanLast 10 Fiscal Years
2015
District's proportion of the net pension liability .035%
District's proportionate share of the net pension liability $ 20,662,000
State's proportionate share of the net pension liabilityassociated with the District 12,477,000
Total net pension liability $ 33,139,000
District's covered-employee payroll $ 15,748,000
District's proportionate share of the net pension liabilityas a percentage of its covered-employee payroll 131%
Plan fiduciary net position as a percentage of the total pension liability 76.52%
The amounts presented for each fiscal year were determined as of the year end that occurred one yearprior.
All years prior to 2015 are not available.
(Continued)
55

MARIN COMMUNITY COLLEGE DISTRICT
SCHEDULE OF THE DISTRICT’S PROPORTIONATE SHARE OF THE NET PENSION LIABILITY
(Continued)For the Year Ended June 30, 2015
Public Employers Retirement Fund BLast 10 Fiscal Years
2015
District's proportion of the net pension liability .12%
District's proportionate share of the net pension liability $ 14,503,000
District's covered-employee payroll $ 12,593,000
District's proportionate share of the net pension liabilityas a percentage of its covered-employee payroll 115%
Plan fiduciary net position as a percentage of the total pension liability 83.38%
The amounts presented for each fiscal year were determined as of the year end that occurred one yearprior.
All years prior to 2015 are not available.
56

MARIN COMMUNITY COLLEGE DISTRICT
SCHEDULE OF THE DISTRICT'S CONTRIBUTIONS
For the Year Ended June 30, 2015
State Teachers' Retirement PlanLast 10 Fiscal Years
2015
Contractually required contribution $ 2,360,150
Contributions in relation to the contractually required contribution $ 2,360,150
Contribution deficiency (excess) $ -
District's covered-employee payroll $ 20,052,000
Contributions as a percentage of covered-employee payroll 8.88%
All years prior to 2015 are not available.
(Continued)
57

MARIN COMMUNITY COLLEGE DISTRICT
SCHEDULE OF THE DISTRICT'S CONTRIBUTIONS(Continued)
For the Year Ended June 30, 2015
Public Employers Retirement Fund BLast 10 Fiscal Years
2015
Contractually required contribution $ 2,186,501
Contributions in relation to the contractually required contribution $ 2,186,501
Contribution deficiency (excess) $ -
District's covered-employee payroll $ 18,575,000
Contributions as a percentage of covered-employee payroll 11.77%
All years prior to 2015 are not available.
58

MARIN COMMUNITY COLLEGE DISTRICT
NOTE TO REQUIRED SUPPLEMENTARY INFORMATION
1. PURPOSE OF SCHEDULE
A - Schedule of Other Postemployment Benefits Funding Progress
The Schedule of Funding Progress presents multi-year trend information whichcompares, over time, the actuarially accrued liability for benefits with the actuarial valueof accumulated plan assets.
B - Schedule of Employer Contributions
The Schedule of the Employer Contributions presents the actuarially determined annualrequired contribution (ARC) and the percentage of that ARC that was contributed by theDistrict as benefit payments directly to or on behalf of members or into the OPEB Trustfund.
C - Schedule of the District’s Proportionate Share of the Net Pension Liability
The Schedule of the District’s Proportionate Share of the Net Pension Liability ispresented to illustrate the elements of the District’s Net Pension Liability. There is arequirement to show information for 10 years. However, until a full 10-year trend iscompiled, governments should present information for those years for which informationis available.
D - Schedule of the District's Contributions
The Schedule of the District's Contributions is presented to illustrate the District’srequired contributions relating to the pensions. There is a requirement to showinformation for 10 years. However, until a full 10-year trend is compiled, governmentsshould present information for those years for which information is available.
E - Changes of Benefit Terms
There are no changes in benefit terms reported in the Required SupplementaryInformation.
F - Changes of Assumptions
There are no changes in assumptions reported in the Required SupplementaryInformation.
59

SUPPLEMENTARY INFORMATION

MARIN COMMUNITY COLLEGE DISTRICT
ORGANIZATION
June 30, 2015
Marin Community College District was established in 1926, and is comprised of two campuses,Kentfield and Indian Valley. There were no changes in the boundaries of the District during the currentyear.
The Governing Board and District Administration for the fiscal year ended June 30, 2015 werecomposed of the following members:
BOARD OF TRUSTEES
Members Office Term Expires
Wanden Treanor President 2017Stephanie O'Brien Vice President 2015Diana Conti Clerk 2017Brady Bevis Trustee 2017Philip Kranenburg Trustee 2015Eva Long, Ph.D Trustee 2015Stuart Tanenberg Trustee 2015Michael Trump Student Trustee 2015
DISTRICT ADMINISTRATION
David Wain Coon Ed.D.Superintendent/President
Gregory W. NelsonVice President, Finance and College Operations
60

MARIN COMMUNITY COLLEGE DISTRICT
SCHEDULE OF EXPENDITURES OF FEDERAL AWARDS
For the Year Ended June 30, 2015
Federal Grantor/ FederalPass-Through Grantor/ CFDA FederalProgram or Cluster Title Number Expenditures
U.S. Department of Education
Direct Programs:Student Financial Aid Cluster:
Federal Supplementary Educational OpportunityProgram (FSEOG) 84.007 $ 224,925
Federal College Work Study (FWS) 84.003 163,506Federal Direct Loan Program 84.268 2,077,283Federal Pell Grant (PELL) 84.063 4,225,848
Subtotal Financial Aid Cluster 6,691,562
Passed through California Community College Chancellor's Office:Vocation and Applied Technology Education - Act Programs:
Vocational and Applied Technology Educational Act - Title IC 84.048 130,873
Vocational and Applied Technology Educational Act - Title II - Tech Prep 84.048 43,269
Subtotal Vocational and Applied Technology Education Act Programs 174,142
Passed through California Department of Education:Early Childhood Mentor Program 84.405A 2,483
Total U.S. Department of Education 6,868,187
U.S. Department of Health and Human Services
Passed through California Community College Chancellor's Office:Temporary Assistance to Needy Families (TANF) 93.558 16,008
Passed through California Department of Education:Child Development Training Consortium 95.575 8,050Foster Care Education 93.658 29,401
Total U.S. Department of Health andHuman Services 53,459
U.S. Department of Agriculture - Passed through CaliforniaDepartment of Education
Child Care Food Program 10.558 20,524
Total Federal Programs $ 6,942,170
See accompanying notes to supplemental information.
61

MARIN COMMUNITY COLLEGE DISTRICT
SCHEDULE OF STATE FINANCIAL AWARDS
For the Year Ended June 30, 2015
Program Revenues Accounts Total
Cash Receivable/ Unearned ProgramReceived (Payable) Income Total Expenditures
AB86 Adult Education $ 195,784 $ 21,755 $ - $ 217,539 $ 217,539Administrative 2% Enrollment
Fee Waivers 45,451 - - 45,451 45,451Basic Skills 135,098 - 52,956 82,142 82,142BFAP Administrative 195,576 - - 195,576 195,576Cal Grants 285,760 829 - 286,589 286,589CalWORKs 136,893 (6,367) 218 130,308 130,308CARE 37,254 - 248 37,006 37,006Child Care Food Program - Preschool 847 307 - 1,154 1,154Child Development Bailout Tax 75,862 - - 75,862 75,862Child Development - State Preschool 128,525 3,557 - 132,082 132,082DSPS 820,564 - - 820,564 820,564EOPS 441,286 - 113 441,173 441,173Faculty/Staff Development 11,325 - 11,325 - -Faculty/Staff Diversity 4,106 - - 4,106 4,106Foster Care Education 20,880 20,069 - 40,949 40,949Hazardous Substance 4,880 - 4,880 - -Instructional Equipment & Library
Materials 110,303 - 6,516 103,787 103,787Lottery - Proposition 20 486,859 132,551 552,268 67,142 67,142Nursing Enrollment Growth 129,587 - - 129,587 129,587OTF - Sched. Maintenance 101,117 - 24,884 76,233 76,233Physical Plant & Inst'l Support 577,847 - 476,552 101,295 101,295Student Equity 230,649 - 142,966 87,683 87,683Student Success - Credit 764,182 - 193,316 570,866 570,866Student Success - Noncredit 55,643 - - 55,643 55,643Peace Officers Training 3,000 - 1,438 1,562 1,562Scheduled Maintenance and Repair 237,605 - 125,987 111,618 111,618TANF 16,008 - - 16,008 16,008Transfers & Articulation 40 - 40 - -
See accompanying notes to supplemental information.
62

MARIN COMMUNITY COLLEGE DISTRICT
SCHEDULE OF WORKLOAD MEASURES FORSTATE GENERAL APPORTIONMENT
Annual Attendance as of June 30, 2015
Reported Audit RevisedCategories Data Adjustments Data
A. Summer Intersession (Summer 2014 only)
1. Noncredit - - -2. Credit - - -
B. Summer Intersession (Summer 2015 - Prior toJuly 1, 2015)
1. Noncredit 17 - 172. Credit 181 - 181
C. Primary Terms (Exclusive of Summer Intersession)
1. Census Procedure Coursesa. Weekly Census Contact Hours 2,990 - 2,990b. Daily Census Contact Hours 109 - 109
2. Actual Hours of Attendance ProcedureCourses
a. Noncredit 208 - 208b. Credit 142 - 142
3. Alternative Attendance Accounting Procedure
a. Weekly Census Procedure Courses 186 - 186b. Daily Census Procedure Courses - - -c. Noncredit Independent Study/
Distance Education Courses - - -
D. Total FTES 3,833 - 3,833
Supplementary Information:
E. In-Service Training Courses (FTES) - - -
H. Basic Skills Courses and ImmigrantEducation
a. Noncredit 211 - 211b. Credit 354 - 354
CCFS 320 Addendum
CDCP - - -
Centers FTES
a. Noncredit 20 - 20b. Credit 497 - 497
See accompanying notes to supplemental information.
63

MARIN COMMUNITY COLLEGE DISTRICT
RECONCILIATION OF ANNUAL FINANCIAL AND BUDGET REPORT(CCFS-311) WITH AUDITED BASIC FINANCIAL STATEMENTS
For the Year Ended June 30, 2015
There were no audit adjustments proposed to any funds of the District.
See accompanying notes to supplemental information.
64
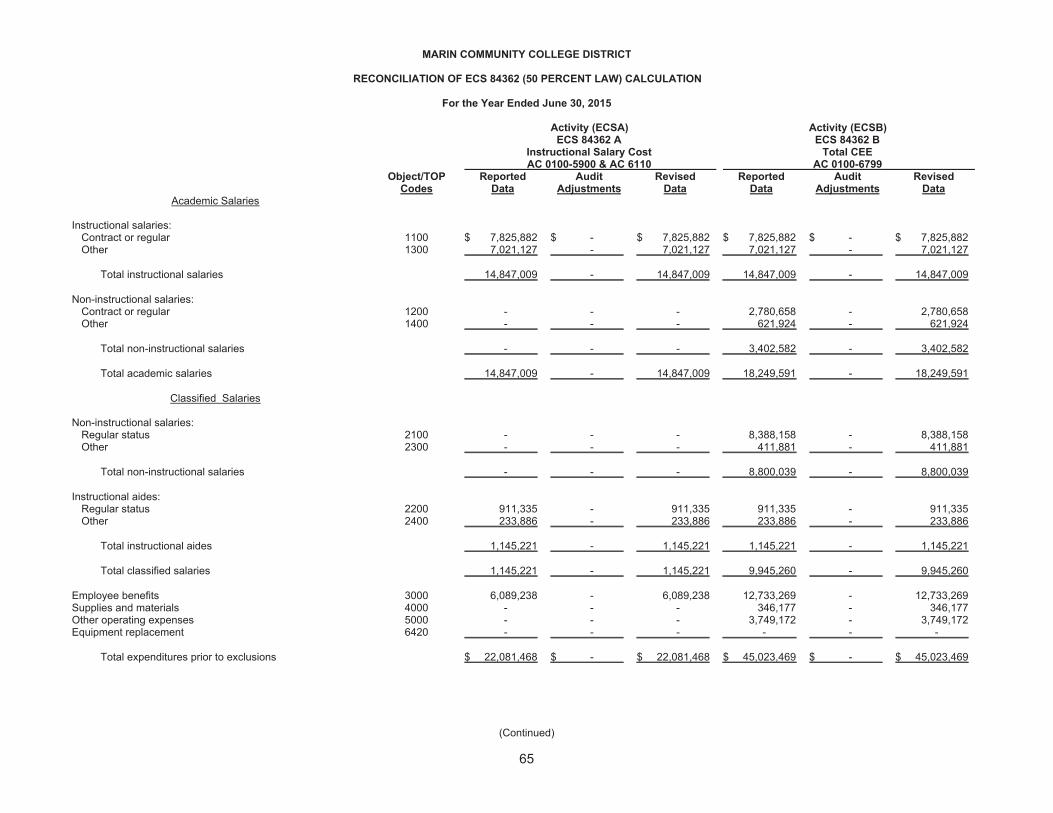
MARIN COMMUNITY COLLEGE DISTRICT
RECONCILIATION OF ECS 84362 (50 PERCENT LAW) CALCULATION
For the Year Ended June 30, 2015
Activity (ECSA) Activity (ECSB)ECS 84362 A ECS 84362 B
Instructional Salary Cost Total CEE AC 0100-5900 & AC 6110 AC 0100-6799
Object/TOP Reported Audit Revised Reported Audit RevisedCodes Data Adjustments Data Data Adjustments Data
Academic Salaries
Instructional salaries:Contract or regular 1100 $ 7,825,882 $ - $ 7,825,882 $ 7,825,882 $ - $ 7,825,882Other 1300 7,021,127 - 7,021,127 7,021,127 - 7,021,127
Total instructional salaries 14,847,009 - 14,847,009 14,847,009 - 14,847,009
Non-instructional salaries:Contract or regular 1200 - - - 2,780,658 - 2,780,658Other 1400 - - - 621,924 - 621,924
Total non-instructional salaries - - - 3,402,582 - 3,402,582
Total academic salaries 14,847,009 - 14,847,009 18,249,591 - 18,249,591
Classified Salaries
Non-instructional salaries:Regular status 2100 - - - 8,388,158 - 8,388,158Other 2300 - - - 411,881 - 411,881
Total non-instructional salaries - - - 8,800,039 - 8,800,039
Instructional aides:Regular status 2200 911,335 - 911,335 911,335 - 911,335Other 2400 233,886 - 233,886 233,886 - 233,886
Total instructional aides 1,145,221 - 1,145,221 1,145,221 - 1,145,221
Total classified salaries 1,145,221 - 1,145,221 9,945,260 - 9,945,260
Employee benefits 3000 6,089,238 - 6,089,238 12,733,269 - 12,733,269Supplies and materials 4000 - - - 346,177 - 346,177Other operating expenses 5000 - - - 3,749,172 - 3,749,172Equipment replacement 6420 - - - - - -
Total expenditures prior to exclusions $ 22,081,468 $ - $ 22,081,468 $ 45,023,469 $ - $ 45,023,469
(Continued)
65

MARIN COMMUNITY COLLEGE DISTRICT
RECONCILIATION OF ECS 84362 (50 PERCENT LAW) CALCULATION(Continued)
For the Year Ended June 30, 2015
Activity (ECSA) Activity (ECSB)ECS 84362 A ECS 84362 B
Instructional Salary Cost Total CEE AC 0100-5900 & AC 6110 AC 0100-6799
Object/TOP Reported Audit Revised Reported Audit RevisedCodes Data Adjustments Data Data Adjustments Data
Exclusions
Activities to exclude:Instructional staff-retirees' benefits and
retirement incentives 5900 $ 757,809 $ - $ 757,809 $ 757,809 $ - $ 757,809Student health services above amount collected 6441 - - - - - -Student transportation 6491 - - - - - -Noninstructional staff-retirees' benefits and
retirement incentives 6740 - - - 928,617 - 928,617Objects to exclude:
Rents and leases 5060 - - - 228,695 - 228,695Lottery expenditures - - - - - -Academic salaries 1000 - - - - - -Classified salaries 2000 - - - - - -Employee benefits 3000 - - - - - -
Supplies and materials: 4000Software 4100 - - - - - -Books, magazines and periodicals 4200 - - - - - -Instructional supplies and materials 4300 - - - - - -Noninstructional supplies and materials 4400 - - - - - -
Total supplies and materials - - - - - -
Other operating expenses and services 5000 - - - 559,968 - 559,968Capital outlay 6000 - - - - - -Library books 6300 - - - 58,858 - 58,858
Equipment: 6400Equipment - additional 6410 - - - 953,432 - 953,432Equipment - replacement 6420 - - - - - -
Total equipment - - - 953,432 - 1,012,290
Total capital outlay - - - 953,432 - 1,012,290
Other outgo 7000 - - - - - -
Total exclusions $ 757,809 $ - $ 757,809 $ 3,428,521 $ - $ 3,487,379
Total for ECS 84362, 50% Law $ 21,323,659 $ - $ 21,323,659 $ 41,594,948 $ - $ 41,536,090
Percent of CEE (instructional salary cost /Total CEE) 51.34% - 51.34% 100.00% - 100.00%
50% of current expense of education $ 20,797,474 $ - $ 20,768,045
See accompanying notes to supplemental information.
66

MARIN COMMUNITY COLLEGE DISTRICT
PROP 30 EPA EXPENDITURE REPORT
For the Year Ended June 30, 2015
EPA Proceeds: $ 387,363
Activity Salaries and Operating Capital Code Benefits Expenses Outlay
Activity Classification (0100-5900) (1000-3000) (4000-5000) (6000) Total
Instructional Activities - $ 387,363 $ - $ - $ 387,363
See accompanying notes to supplemental information.
67

MARIN COMMUNITY COLLEGE DISTRICT
NOTE TO SUPPLEMENTARY INFORMATION
1. PURPOSE OF SCHEDULES
A - Schedule of Expenditure of Federal Awards
The accompanying Schedule of Expenditure of Federal Awards includes the Federalgrant activity of the District and is presented on the modified accrual basis ofaccounting. The information in this schedule is presented in accordance with therequirements of the United States Office of Management and Budget Circular A-133.Therefore, some amounts presented in this schedule may differ from amountspresented in, or used in the preparation of, the basic financial statements.
B - Schedule of State Financial Awards
The accompanying Schedule of State Financial Awards includes State grant activity ofthe District and is presented on the accrual basis of accounting. Therefore, someamounts presented in this schedule may differ from amounts presented in, or used inthe preparation of, the basic financial statements. The information in this schedule ispresented to comply with reporting requirements of the California Community CollegesChancellor's Office.
C - Schedule of Workload Measures for State General Apportionment
Full-time equivalent students is a measurement of the number of students attendingclasses of the District. The purpose of attendance accounting from a fiscal standpointis to provide the basis on which apportionments of State funds are made to communitycollege districts. This schedule provides information regarding the attendance ofstudents based on various methods of accumulating attendance data.
D - Reconciliation of Annual Financial and Budget Report (CCFS-311) with Audited BasicFinancial Statements
This schedule provides the information necessary to reconcile the fund balance of allfunds reported on the CCFS-311 to the audited basic financial statements.
E - Reconciliation of ECS 84362 (50 Percent Law) Calculation
This schedule provides the information necessary to reconcile the 50 Percent LawCalculation reported on the CCFS-311 to the audited data.
F - Prop 30 EPA Expenditure Report
This schedule provides information about the District's EPA proceeds and summarizeshow the EPA proceeds were spent.
68

INDEPENDENT AUDITOR'S REPORTON STATE COMPLIANCE REQUIREMENTS
Board of TrusteesMarin Community College DistrictKentfield, California
Report on Compliance with State Laws and Regulations
We have audited the compliance of Marin Community College District with the types of compliancerequirements described in Section 400 of the California State Chancellor's Office's California CommunityCollege District Audit Manual (CDAM) that are applicable to community colleges in the State of Californiafor the year ended June 30, 2015:
Salaries of Classroom Instructors (50 Percent Law)Apportionment for Instructional Service Agreements/ContractsState General Apportionment Funding SystemResidency Determination for Credit CoursesStudents Actively EnrolledConcurrent Enrollment of K 12 Students in Community College Credit CoursesSchedule Maintenance ProgramGann Limit CalculationOpen EnrollmentStudent Fees Health Fees and Use of Health Fee FundsProposition 39 Clean EnergyIntersession Extension ProgramExtended Opportunity Programs and Services (EOPS) and Cooperative Agencies
Resources for Education (CARE)Disabled Student Programs and Services (DSPS)To Be Arranged Hours (TBA)Proposition 1D State Bond Funded ProjectsProposition 30 Education Protection Account Funds
Management's Responsibility
Management is responsible for compliance with the requirements of state laws and regulations, as listedabove.
Auditor's Responsibility
Our responsibility is to express an opinion on compliance with state laws and regulations as listed aboveof Marin Community College District. We conducted our audit of compliance in accordance with auditingstandards generally accepted in the United States of America; the standards applicable to financial auditscontained in Government Auditing Standards, issued by the Comptroller General of the United States andthe California State Chancellor's Office's California Community College District Audit Manual. Thosestandards require that we plan and perform the audit to obtain reasonable assurance about whethernoncompliance with the state laws and regulations listed above occurred. An audit includes examining,on a test basis, evidence about Marin Community College District's compliance with those requirementsand performing such other procedures as we considered necessary in the circumstances.
We believe that our audit provides a reasonable basis for our opinion on compliance with State laws andregulations. However, our audit does not provide legal determination of Marin Community CollegeDistrict's compliance with those requirements.
69

Basis for Qualified Opinion with State Laws and Regulations
As described in Findings 2015-001 and 2015-002 in the accompanying Schedule of Audit Findings andQuestioned Costs, Marin Community College District did not comply with the requirements regarding ToBe Arranged Hours and Concurrent Enrollment. Compliance with such requirements is necessary, in ouropinion, for Marin Community College District to comply with state laws and regulations applicable to ToBe Arranged Hours and Concurrent Enrollment.
Qualified Opinion with State Laws and Regulations
In our opinion, except for the noncompliance, described in the Basis for Qualified Opinion paragraph,Marin Community College District complied, in all material respects, with the compliance requirementsassociated with the state laws and regulations listed above for the year ended June 30, 2015. Further,based on our examination, for items not tested, nothing came to our attention to indicate that MarinCommunity College District had not complied with the state laws and regulations.
Other Matters
Marin Community College District's responses to the noncompliance findings identified in our audit areincluded in the accompanying Schedule of Audit Findings and Questioned Costs. Marin CommunityCollege District's responses were not subjected to the auditing procedures applied in the audit ofcompliance and, accordingly, we express no opinion on the responses.
Purpose of this Report
This report is intended solely to describe the scope of testing of compliance and the results of that testingbased on requirements of the Contracted District Audit Manual. Accordingly, this report is not suitable forany other purpose.
Crowe Horwath LLP
Sacramento, CaliforniaDecember 2, 2015
70

INDEPENDENT AUDITOR'S REPORT ON INTERNAL CONTROL OVER FINANCIALREPORTING AND ON COMPLIANCE AND OTHER MATTERS BASED ON AN
AUDIT OF BASIC FINANCIAL STATEMENTS PERFORMED IN ACCORDANCE WITHGOVERNMENT AUDITING STANDARDS
Board of TrusteesMarin Community College DistrictKentfield, California
We have audited, in accordance with the auditing standards generally accepted in the United States ofAmerica and the standards applicable to financial audits contained in Government Auditing Standardsissued by the Comptroller General of the United States, the financial statements of the business-typeactivities and fiduciary activities of Marin Community College District as of and for the year endedJune 30, 2015, and the related notes to the financial statements, which collectively comprise MarinCommunity College District’s basic financial statements, and have issued our report thereon datedDecember 2, 2015.
Internal Control Over Financial Reporting
In planning and performing our audit of the financial statements, we considered Marin CommunityCollege District's internal control over financial reporting (internal control) to determine the auditprocedures that are appropriate in the circumstances for the purpose of expressing our opinions on thefinancial statements, but not for the purpose of expressing opinions on the effectiveness of MarinCommunity College District’s internal control. Accordingly, we do not express an opinion on theeffectiveness of Marin Community College District’s internal control.
A deficiency in internal control exists when the design or operation of a control does not allowmanagement or employees, in the normal course of performing their assigned functions, to prevent, ordetect and correct, misstatements on a timely basis. A material weakness is a deficiency, or acombination of deficiencies, in internal control, such that there is a reasonable possibility that a materialmisstatement of the entity’s financial statements will not be prevented, or detected and corrected on atimely basis. A significant deficiency is a deficiency, or a combination of deficiencies, in internal controlthat is less severe than a material weakness, yet important enough to merit attention by those chargedwith governance.
Our consideration of internal control was for the limited purpose described in the first paragraph of thissection and was not designed to identify all deficiencies in internal control that might be materialweaknesses or significant deficiencies. Given these limitations, during our audit we did not identify anydeficiencies in internal control that we consider to be material weaknesses. However, materialweaknesses may exist that have not been identified.
Compliance and Other Matters
As part of obtaining reasonable assurance about whether Marin Community College District's financialstatements are free of material misstatement, we performed tests of its compliance with certain provisionsof laws, regulations, contracts, and grant agreements, noncompliance with which could have a direct andmaterial effect on the determination of financial statement amounts. However, providing an opinion oncompliance with those provisions was not an objective of our audit, and accordingly, we do not expresssuch an opinion. The results of our tests disclosed no instances of noncompliance or other matters thatare required to be reported under Government Auditing Standards.
71

Purpose of this Report
The purpose of this report is solely to describe the scope of our testing of internal control over financialreporting and compliance and the results of that testing, and not to provide an opinion on theeffectiveness of the entity’s internal control or on compliance. This report is an integral part of an auditperformed in accordance with Government Auditing Standards in considering the entity’s internal controland compliance. Accordingly, this communication is not suitable for any other purpose.
Crowe Horwath LLP
Sacramento, CaliforniaDecember 2, 2015
72

INDEPENDENT AUDITOR’S REPORT ON COMPLIANCE FOR EACH MAJOR FEDERAL PROGRAM AND REPORT ON INTERNAL CONTROL OVER COMPLIANCE
Board of TrusteesMarin Community College DistrictKentfield, California
Report on Compliance for Each Major Federal Program
We have audited Marin Community College District’s compliance with the types of compliancerequirements described in the OMB Circular A-133 Compliance Supplement that could have a direct andmaterial effect on each of Marin Community College District’s major federal programs for the year endedJune 30, 2015. Marin Community College District’s major federal programs are identified in the summaryof auditor’s results section of the accompanying schedule of findings and questioned costs.
Management’s Responsibility
Management is responsible for compliance with the requirements of laws, regulations, contracts, andgrants applicable to its federal programs.
Auditor’s Responsibility
Our responsibility is to express an opinion on compliance for each of Marin Community College District’smajor federal programs based on our audit of the types of compliance requirements referred to above.We conducted our audit of compliance in accordance with auditing standards generally accepted in theUnited States of America; the standards applicable to financial audits contained in Government AuditingStandards, issued by the Comptroller General of the United States; and OMB Circular A-133, Audits ofStates, Local Governments, and Non-Profit Organizations. Those standards and OMB Circular A-133require that we plan and perform the audit to obtain reasonable assurance about whether noncompliancewith the types of compliance requirements referred to above that could have a direct and material effecton a major federal program occurred. An audit includes examining, on a test basis, evidence about MarinCommunity College District’s compliance with those requirements and performing such other proceduresas we considered necessary in the circumstances.
We believe that our audit provides a reasonable basis for our opinion on compliance for each majorfederal program. However, our audit does not provide a legal determination of Marin Community CollegeDistrict’s compliance.
Opinion on Each Major Federal Program
In our opinion, Marin Community College District complied, in all material respects, with the types ofcompliance requirements referred to above that could have a direct and material effect on each of itsmajor federal programs for the year ended June 30, 2015.
73

Report on Internal Control Over Compliance
Management of Marin Community College District is responsible for establishing and maintainingeffective internal control over compliance with the types of compliance requirements referred to above. Inplanning and performing our audit of compliance, we considered Marin Community College District’sinternal control over compliance with the types of requirements that could have a direct and materialeffect on each major federal program to determine the auditing procedures that are appropriate in thecircumstances for the purpose of expressing an opinion on compliance for each major federal programand to test and report on internal control over compliance in accordance with OMB Circular A-133, but notfor the purpose of expressing an opinion on the effectiveness of internal control over compliance.Accordingly, we do not express an opinion on the effectiveness of Marin Community College District’sinternal control over compliance.
A deficiency in internal control over compliance exists when the design or operation of a control overcompliance does not allow management or employees, in the normal course of performing their assignedfunctions, to prevent, or detect and correct, noncompliance with a type of compliance requirement of afederal program on a timely basis. A material weakness in internal control over compliance is adeficiency, or combination of deficiencies, in internal control over compliance, such that there isreasonable possibility that material noncompliance with a type of compliance requirement of a federalprogram will not be prevented, or detected and corrected, on a timely basis. A significant deficiency ininternal control over compliance is a deficiency, or combination of deficiencies, in internal control overcompliance with a type of compliance requirement of a federal program that is less severe than a materialweakness in internal control over compliance, yet important enough to merit attention by those chargedwith governance.
Our consideration of internal control over compliance was for the limited purpose described in the firstparagraph of this section and was not designed to identify all deficiencies in internal control overcompliance that might be material weaknesses or significant deficiencies. We did not identify anydeficiencies in internal control over compliance that we consider to be material weaknesses. However,material weaknesses may exist that have not been identified.
Purpose of this Report
The purpose of this report on internal control over compliance is solely to describe the scope of ourtesting of internal control over compliance and the results of that testing based on the requirements ofOMB Circular A-133. Accordingly, this report is not suitable for any other purpose.
Crowe Horwath LLP
Sacramento, CaliforniaDecember 2, 2015
74

FINDINGS AND RECOMMENDATIONS

MARIN COMMUNITY COLLEGE DISTRICT
SCHEDULE OF AUDIT FINDINGS AND QUESTIONED COSTS
Year Ended June 30, 2015
SECTION I - SUMMARY OF AUDITOR'S RESULTS
FINANCIAL STATEMENTS
Type of auditor's report issued: Unmodified
Internal control over financial reporting:Material weakness(es) identified? Yes X NoSignificant deficiency(ies) identified not considered
to be material weakness(es)? Yes X None reported
Noncompliance material to financial statements noted? Yes X No
FEDERAL AWARDS
Internal control over major programs:Material weakness(es) identified? Yes X NoSignificant deficiency(ies) identified not considered
to be material weakness(es)? Yes X None reported
Type of auditor's report issued on compliance formajor programs: Unmodified
Any audit findings disclosed that are required to bereported in accordance with Circular A-133,Section .510(a)? Yes X No
Identification of major programs:
CFDA Number(s) Name of Federal Program or Cluster
84.007, 84.033, 84,268, 84.063 Student Financial Aid Cluster
Dollar threshold used to distinguish between Type Aand Type B programs: $ 300,000
Auditee qualified as low-risk auditee? Yes X No
STATE AWARDS
Type of auditor's report issued on compliance forstate programs: Qualified
75

MARIN COMMUNITY COLLEGE DISTRICT
SCHEDULE OF AUDIT FINDINGS AND QUESTIONED COSTS(Continued)
Year Ended June 30, 2015
SECTION II - FINANCIAL STATEMENT FINDINGS
No matters were reported
76

MARIN COMMUNITY COLLEGE DISTRICT
SCHEDULE OF AUDIT FINDINGS AND QUESTIONED COSTS(Continued)
Year Ended June 30, 2015
SECTION III - FEDERAL AWARD FINDINGS AND QUESTIONED COSTS
No matters were reported
77

MARIN COMMUNITY COLLEGE DISTRICT
SCHEDULE OF AUDIT FINDINGS AND QUESTIONED COSTS(Continued)
Year Ended June 30, 2015
SECTION IV - STATE AWARD FINDINGS AND QUESTIONED COSTS
2015-001 DEFICIENCY – STATE COMPLIANCE - TO BE ARRANGED HOURS (TBA)
Criteria
The Student Attendance Accounting Manual and California Education Code sections 84040 and 88240require districts to maintain support for To Be Arranged Hour courses including a course syllabus andattendance records.
Condition
We identified an error in one (1) course out of our sample for To Be Arranged Hour courses that did notmaintain the proper supporting documentation (syllabus and attendance records). The error was for one(1) FTE out of a sample of 18.5 FTEs. When extrapolated, this error results in 13.06 To Be ArrangedHour FTEs that did not maintain the proper supporting documentation.
Effect
The District is not in compliance with State requirements.
Cause
The District failed to maintain supporting documentation (syllabus and attendance records) for a To BeArranged Hours course.
Fiscal Impact
Not determinable.
Recommendation
The District should maintain all support regarding To Be Arranged Hours.
Corrective Action Plan
The College implemented the SARS Track-It system in all labs effective Fall 2015. All TBA hours will nowbe captured in the system and a standardized report will be generated for the auditors starting with thenext visit in June, 2016. The auditors were told that the College was in the process of implementing atracking system and that the deficiency was in the process of being resolved. For TBA courses, thecourse syllabi will be kept on file with the departments.
78

MARIN COMMUNITY COLLEGE DISTRICT
SCHEDULE OF AUDIT FINDINGS AND QUESTIONED COSTS(Continued)
Year Ended June 30, 2015
SECTION IV - STATE AWARD FINDINGS AND QUESTIONED COSTS
2015-002 DEFICIENCY – STATE COMPLIANCE - CONCURRENT ENROLLMENT
Criteria
The California Education Code section 48800 requires that districts, for summer session attendance, tocertify that they have not recommended for community college attendance more than 5% of the totalnumber of pupils who completed that grade immediately prior to the time of recommendation.
Condition
The District was unable to provide K-12 principal certifications for concurrently enrolled students forsummer sessions. Total FTES for concurrrently enrolled students in the Summer was 19.83.
Effect
The District is not in compliance with State requirements.
Cause
The District failed to maintain certifications supporting K-12 concurrent enrollment for summer sessions.
Fiscal Impact
Not determinable.
Recommendation
The District should maintain all support regarding K-12 concurrent enrollment.
Corrective Action Plan
College of Marin will begin, with the Summer 2016 semester, collecting from each public feeder highschool, an official certification for each grade level of the number of students in each year, (9th, 10th, 11th
and 12th).
A letter will be sent by the Dean of Enrollment Services in March 2016 explaining the requirement, andwill include a certification form requesting that they certify the number of students in each grade level andthe calculation for 5% of each class. For example: If the 9th grade class at Redwood High School certifiesfor 435 students – they will indicate and acknowledge that they may authorize no more than 21-22students from that grade level.
College of Marin will announce this process at the Annual Counselors and Administrators breakfast inearly Spring, as well as sending electronic communications to all explaining the process and requirement.
By Summer 2016, COM will be able to work in partnership with the feeder high schools to assure that weare monitoring the number of students to stay within the 5% limit as per ED Code §48800.
79

STATUS OF PRIOR YEAR
FINDINGS AND RECOMMENDATIONS

MARIN COMMUNITY COLLEGE DISTRICT
STATUS OF PRIOR YEAR FINDINGS AND RECOMMENDATIONS
Year Ended June 30, 2015
Findings Recommendations Current StatusDistrict Explanation
If Not FullyImplemented
2014-001
There is no evidence of anyreview by Human Resources ofwage or other changes afterthe information is entered intothe District's employeemasterfile.
2014-002
Title IV funds for five (5)students out of 25 were notreturned to ED within the 45days after the institutiondetermined the studentwithdrew.
2014-003
Five (5) out of sixty (60)students selected for testingdid not maintain good standingor academic progress; theDistrict did not disqualify thesestudents in a timely manner.
The District should designcontrols to ensureemployee masterfilechanges entered byHuman Resources areverified by anotherindependent individual inHuman Resources afterthe changes are entered inthe employee masterfile.Formal documentationshould include thereviewer's signature/initialand the date of review.The date of the reviewshould precede any paydate that would beaffected.
The District shouldimplement controls toensure funds are returnedwithin 45 days after theinstitution determines thestudent withdrew.
The District should followtheir SAP policy andevaluate all student'seligibility at the end ofeach semester.
Implemented.
Implemented.
Implemented.
(Continued)
80

MARIN COMMUNITY COLLEGE DISTRICT
STATUS OF PRIOR YEAR FINDINGS AND RECOMMENDATIONS
Year Ended June 30, 2015
Findings Recommendations Current StatusDistrict Explanation
If Not FullyImplemented
2014-004
SAR comment code 002indicates professionaljudgment was used.Professional judgment refers tothe authority of a District'sfinancial aid administrator tomake adjustment to dataelements on the FAFSA and tooverride a student'sdependency status.
Out of sixty (60) studentsselected for testing,professional judgment wasused for two (2) students. TheDistrict did not maintain supportfor professional judgmentdecisions (i.e. pay-stubs, taxreturns, W2 forms) for the two(2) students with SARcomment code 002.
2014-005
One course was not properlylisted in the class schedule andadvertised to the generalpublic.
2014-006
Sample selections were madefrom the detailed listing ofstudents receiving DSPSsupport and services for the2013-2014 academic year.
The District was unable toprovide the verification ofdisability for 2 of the 25students selected for testing.
The District should obtaindocuments to supportprofessional judgmentchanges and maintain thedocuments within thestudent files.
The District should reviseand resubmit the CCFS320 report to remove thedisallowed FTES.
The District shouldimplement procedures toensure all the requireddocuments are maintainedin the student files.
Implemented.
Implemented.
Implemented.
(Continued)
81

MARIN COMMUNITY COLLEGE DISTRICT
STATUS OF PRIOR YEAR FINDINGS AND RECOMMENDATIONS
Year Ended June 30, 2015
Findings Recommendations Current StatusDistrict Explanation
If Not FullyImplemented
2014-007
Sample selections were madefrom the detailed listing ofstudents receiving EOPSsupport and services for the2013-2014 academic year.
Out of 25 students selected fortesting, one did not have acurrent EOPS/CAREapplication.
The District shouldimplement procedures tothe ensure compliancewith EOPS/CARErecordkeepingrequirements.
Implemented.
82