marin clean energy technical committee meeting€¦ · 06-07-2015 · town of corte madera barbara...
TRANSCRIPT

Kathrin Sears, Chair County of Marin Tom Butt, Vice Chair City of Richmond Bob McCaskill City of Belvedere Alan Schwartzman City of Benicia Greg Lyman City of El Cerrito Sloan C. Bailey Town of Corte Madera Barbara Coler Town of Fairfax Kevin Haroff City of Larkspur
Garry Lion City of Mill Valley Brad Wagenknecht County of Napa Denise Athas City of Novato Carla Small Town of Ross Ford Greene Town of San Anselmo
Genoveva Calloway City of San Pablo Andrew McCullough City of San Rafael Ray Withy City of Sausalito Emmett O’Donnell Town of Tiburon
1125 Tamalpais Avenue San Rafael, CA 94901 1 (888) 632-3674 mceCleanEnergy.org
Marin Clean Energy
Technical Committee Meeting Monday, July 6, 2015
5:00 P.M.
The Barbara George Conference Room 1125 Tamalpais Avenue, San Rafael, CA 94901
Agenda Page 1 of 1
Agenda material can be inspected at 1125 Tamalpais Avenue, San Rafael, CA 94901 on the Mission Avenue side of the building. The meeting facilities are in accessible locations. If you are a person with a disability and require this document in an alternate format (example: Braille, Large Print, Audiotape, CD-ROM), you may request it by using the contact information below. If you require accommodation (example: ASL Interpreter, reader, note taker) to participate in any MCE program, service or activity, you may request an accommodation by calling (415) 464-6032 (voice) or 711 for the California Relay Service or by e-mail at [email protected] not less than four work days in advance of the event.
1. Board Announcements (Discussion)
2. Public Open Time (Discussion)
3. Report from Chief Executive Officer (Discussion)
4. Approval of 6.1.15 Meeting Minutes (Discussion/Action) 5. 2016 Energy Efficiency Implementation Plans (Discussion)
6. Members & Staff Matters (Discussion)
7. Adjourn

1
MARIN CLEAN ENERGY TECHNICAL COMMITTEE MEETING
June 1, 2015 5:00PM
The Barbara George Conference Room
1125 Tamalpais Avenue, San Rafael, CA 94901 Roll Call Present: Kate Sears, County of Marin, Chair
Kevin Haroff, Town of Larkspur Carla Small, Town of Ross Emmett O’Donnell, Town of Tiburon Greg Lyman, City of El Cerrito
Ford Greene, Town of San Anselmo Ray Withy, City of Sausalito
Absent: None Staff: Dawn Weisz, Chief Executive Officer Greg Brehm, Director of Power Resources
Rafael Silberblatt, Program Specialist Action taken: Agenda Item #4 – Approval of Minutes from 5.4.15 Meeting (Discussion/Action) M/s Lyman/Haroff (passed 5-0) approval of minutes from 5.4.15 meeting. Directors Greene and Withy abstained. Agenda Item #5 – Approval of Potential Adjustments to Deep Green Product (Discussion/Action) Recommendation was made to adjust the Deep Green portfolio to diversify products sources and better match customer usage; and to conduct due diligence with customers to determine if a flat premium is of interest, then bring proposed adjustments to a future Board meeting. M/s Lyman/Greene (passed 7-0) approval of potential adjustments to Deep Green product.
Agenda Item #03: 6.1.15 Meeting Minutes

2
Agenda Item #6 – Approve MCE Battery Storage Rate and Pilot Program (Discussion/Action) M/s Haroff/Small (passed 7-0) approval of MCE battery storage rate and pilot program.
Kate Sears, Chair ATTEST:
Dawn Weisz, Chief Executive Officer
Agenda Item #03: 6.1.15 Meeting Minutes

1
Implementation Plan: Commercial Draft June 30, 2015 Table 1. Budget and Savings Summary, Years 1-4 Commercial Sector Years 1-2 Years 3-4 TRC 1.1 1.5 Budget $4,268,465 $6,551,348 Estimated Savings 3,552,496 kWh
3,503 therms 7,785,435 kWh (20,331) therms
Introduction MCE’s commercial program maximizes both customer and program benefits by offering a flexible yet structured approach to integrated demand side management. Its full-service approach provides technical assistance, rebates, financing, assistance finding contractors, quality assurance, and project management. The program employs an integrated model that optimizes a range of integrated demand side management metrics including energy savings, renewable energy generation, water conservation, and greenhouse gas emission reductions. The program offers a targeted and personalized approach through software and data analytics to identify best candidates and develop a savings action plan. MCE is committed to providing excellent customer service and satisfaction through dedicated staff resources and tools. The commercial program is structured to transition from focusing primarily on technical assistance, rebates and incentives, or financing to incorporating cutting-edge strategies like demand side management bidding, web-based tools and software, behavioral campaigns and competitions, and strategic and continuous energy improvement. Many of the proposed strategies are relatively new to the marketplace, so will be phased in to closely evaluate and quantify the success of the transition. A core tenant of the program is delivering a seamless platform for integrating opportunities across energy efficiency (EE), demand response (DR), distributed generation (DG), renewables, electric vehicles (EVs), and water efficiency. These integrated opportunities are called integrated demand side management. Targeted users include all non-residential customers within MCE’s service territory, including office buildings, storage facilities and warehouses, schools, restaurants, municipalities, hospitals, retail facilities, hotels and motels.1 Marketing & Outreach To meet aggressive energy savings targets, and ensure information on program strategies are broadly distributed, MCE will employ a multi-pronged approach to marketing and outreach: Develop and widely disseminate collateral: MCE will produce program flyers and case studies ensuring collateral is as segment-specific as possible within budget confines. Collateral can then be generously distributed through purchasing print ads and
1 Agricultural and industrial customers will be served under MCE’s agricultural and industrial programs.
Agenda Item #04: 2016 EE Draft Implementation Plans

2
air time, providing FAQs and case studies at events, requesting partners disseminate information online and at their offices and events, and updating the MCE website regularly. Leverage Single Point of Contact (SPOC) and Customer Relationship Management systems: MCE plans to use the Customer Relationship Manager (CRM) system to organize data for lead generation and follow-up. Educate, engage and incentivize SPOCs and MCE account managers to generate leads and convert leads to active and completed projects. Generate project leads by conducting outreach to commercial customers: Request feedback from customers on what types of assistance would best help them save energy, while increasing employee productivity and customer satisfaction. Leverage key partners: Communicate regularly with key partners to ensure that they are armed with the latest program information. Help them remain motivated to “sell” the program by providing case studies, and sharing exciting program developments and initiatives. Participate in trade shows and other partner events, or provide talking points and collateral to designated representatives. Engage with partners in campaigns and committees, such as Chambers’ sustainability or Green Business Committees. Conduct recognition campaigns for customers and contractors: Key activities include hosting award ceremonies conducted by an emcee or local luminaries to recognize customers with the greatest energy savings and contractors who provided the most customer leads or completed the greatest number of projects. MCE may also consider offering stipends to program ambassadors (customers, contractors, or trade allies) who commit to present at a defined number of forums each year.
Market Characterization The commercial sector includes a wide variety of building types and consumption profiles. MCE has analyzed energy consumption and building stock characteristics to better understand the diversity, motivators and trends within its service territory. Energy Consumption Analysis The following graphics depict statewide commercial electricity and gas usage by building type and end use. The data is from the 2006 California Commercial End-Use Survey (CEUS), which is a comprehensive study of commercial energy use across thousands of commercial facilities in California. Typical energy consumption profiles varies considerably across California and within MCE’s service territory, so MCE will work with partners that understand the diversity of its customer base and tailor strategies accordingly. On a statewide basis, commercial customer segments electricity and gas use varies considerably. For example, on a comparative basis, restaurants natural gas use is a more significant cost driver than it is for large offices. On an absolute basis, the miscellaneous segment represents the highest electricity use segment and the restaurants represent the highest gas use segment.
Agenda Item #04: 2016 EE Draft Implementation Plans

3
Figure 1: California Commercial Electricity Usage by Building Type
Source: California Commercial End-Use Survey (CEUS). California Energy Commission. Accessed June 9, 2015. http://www.energy.ca.gov/ceus/ Figure 2: California Commercial Natural Gas Usage by Building Type
Source: CEUS. In the commercial sector, the primary electricity end uses are interior lighting, cooling, ventilation, and refrigeration. The top three gas end uses are heating, water heating and cooking, which comprise over 90% of the sector’s gas usage.
Agenda Item #04: 2016 EE Draft Implementation Plans

4
Figure 3: California Commercial Electric Usage by End Use
Source: CEUS Figure 4: California Natural Gas Usage by End Use
Source: CEUS Commercial Building Stock Characteristics MCE’s service territory contains a diversity of commercial building vintages, which provides insights into trends affecting construction and growth. Marin County, for example, has seen declining growth since the mid 1970’s due to planning regulations and growth limits, while Benicia has seen considerable growth and expansion during that same time period. Building vintage provides useful insights into energy efficiency program planning and marketing strategies.
Agenda Item #04: 2016 EE Draft Implementation Plans

5
Figure 5: Commercial Building Vintage by Service Territory
The size of commercial buildings varies considerably across MCE’s service territory. As a result, different energy efficiency programs best suit each of these service territories. For example, small commercial strategies will be better suited to Richmond, El Cerrito, and San Pablo (with the greatest number of commercial buildings under 5,000 square feet); meanwhile, there may be more significant opportunities for large commercial upgrades in Napa and Marin (which have the greatest share of commercial facilities over 100,000 square feet). Figure 6: Commercial Building Size by Service Territory
*Data not available for Benicia.
Barriers There are a number of structural, market, financial, and knowledge barriers to greater energy efficiency adoption within the commercial sector. Some barriers are unique to certain segments within the commercial sector, while others affect the entire sector. The following barriers affect the entire commercial sector:
0%10%20%30%40%50%60%70%
Before 1950 1950-1974 1975-1999 2000-2014
Commercial Building Vintage by Service Territory
Richmond, El Cerrito, and San Pablo Marin Napa Benicia
0%10%20%30%40%50%60%70%
< 5k 5k > 10k 10k > 20k 20k > 50k 50k > 100k > 100k
Commercial Building Size by Sub-jurisdiction Territory*
Richmond, El Cerrito, and San Pablo Marin Napa
Agenda Item #04: 2016 EE Draft Implementation Plans

6
• Structural and market barriers. “Split incentive” issue in tenant-occupied spaces.2 Potential savings fragmented across a high diversity in business type and large geographical area. Limited number of contractors with technical knowledge of integrated and comprehensive demand-side management; dearth of contractors that also have the business, sales, and project management skills needed to convert lead generations and complete projects. Some entities are constrained by barriers separating capital development and operating funds, and can be limited by lowest-bid regulations. Accessing capital funds often requires approval from fiscal managers, who have to weigh many competing priorities across business lines.
• Financial and other resource constraints. Financial constraints: payback requirements are 3.6 years, on average3 (this can be a challenge for two reasons. First, it can limit deeper retrofits. Second, many small commercial building owners change properties every 2-5 years, so are not incentivized to pay for efficiency upgrades that they may not reap the rewards of).Time constraints, and lack of dedicated energy managers.
• Knowledge barriers. General lack of awareness of energy efficiency benefits and program incentives. Uncertainty in achievable savings. Need for greater sub-metering to gain insight into energy consumption.
• Other types of barriers. EE isn’t “sexy”, doesn’t provide the “street cred” that consumers associate with solar, and doesn’t usually increase property values in the way that solar does.
Within the small to midsize business (SMB) market, the program faces the “hard-to-reach sector” challenge. The SMB segment tends to be hard to engage due to the high number of businesses, fragmentation of savings across many small accounts, and difficulty getting the attention of busy small business owners. Another challenge within the large commercial sector is that many businesses do not consider energy efficiency a driving force, since it may represent a relatively small portion of their operating budget. Some businesses may be concerned about impacts of energy efficiency on products and productivity. Furthermore, it can be challenging to reach decision makers in large commercial facilities. MCE’s commercial efficiency program is designed to address as many of these barriers as possible by offering tailored solutions to meet individual customer needs, and proactively working to mitigate structural and market barriers to entry. Trigger Points Energy efficiency continues to gain traction as an attractive way to save costs, increase productivity and improve aesthetics in commercial facilities. However, considering the many remaining barriers to adoption, it’s advantageous to manage the program strategically. This section provides a brief overview of key “trigger points” or opportunities to engage customers and the marketplace at large. Seasons: Effective marketing and outreach efforts take weather patterns and seasons into account.
2 The “split incentive” issue refers to the challenge of encouraging energy efficiency upgrades in facilities where the tenant pays for electricity, but does not own the equipment. This arrangement is very common in the commercial sector, and can make it challenging to get buy-in and financial backing for efficiency upgrades. 3 McKinsey & Company. Unlocking Energy Efficiency in the US Economy. 2009. Page 58.
Agenda Item #04: 2016 EE Draft Implementation Plans

7
Turnover and upgrades: Periods of change, such as office space turnover (signing or renewing a lease), turnover in retail or restaurant space, major facility renovations or upgrades (restaurants, hospitals, hotels, groceries, offices, etc., are opportunities for integrating energy efficiency and IDSM measures. Operating budget cycles: Particularly for large commercial customers, an awareness of their budget planning cycle can be crucial to timing discussions about strategic and continuous energy management. Regulations, standards and goals: Where there is a change of law or a sunset to an existing law, there is also opportunity for a SPOC to engage. MCE closely tracks developments including, among others:
• Regulations: California Green Building Initiative Executive Order (S-20-04), California Energy Benchmarking and Disclosure Law (AB1103), California Comprehensive Energy Efficiency Program for Existing Buildings (AB758), and California Global Warming Solutions Act (AB32)
• Standards: California’s energy codes in retrofits (Title 20), California’s energy codes in new construction Title 24, International Organization for Standardization’s Energy Management Standard (ISO 50001), American National Standards Institute (ANSI) certification; Leadership in Energy & Environmental Design (LEED); Green Building Initiative’s Green Globes, and Department of Energy codes and standards (commercial HVAC equipment, lighting, appliances, etc.)
• Goals: California Long Term Energy Efficiency Strategic Plan Equipment failure: Convincing customers to upgrade to more expensive but highly-efficient equipment can be challenging to do until the equipment is at or near failure, especially for capital-intensive and long-lived equipment like boilers. Proactively educating service contractors and customers about rebates and incentives can help ensure customers are informed and ready to replace equipment with more efficient alternatives than they would have done so in the absence of the program. Timing is key! Key Market Actors Key market actors can be upstream, midstream, or downstream, and can influence market supply, market demand, and the overall structure of the commercial industry. The list below provides a snapshot of key market actors and their role (in parentheses):
• Energy consumers (end-use decision maker): Owners, renters, staff and other occupants of a commercial facility
• Legislative and regulatory bodies (tax laws, regulations, codes and standards): Federal and State Legislatures, California Energy Commission, California Public Utilities Commission
• City and county organizations (regulatory influence, financial incentives and customer/constituent relationships): Development agencies, Planning Commissions, environmental task forces/committees/commissions
• Community organizations (customer/constituent relationships): RichmondBUILD, [San Pablo] Merchants Association, West County Council of Industries
• Business partners: • Energy consultants, implementers and visionaries
Financial lending institutions Chambers of Commerce
Agenda Item #04: 2016 EE Draft Implementation Plans

8
• Other key market actors: Construction industry: designers, architects, builders, general contractors (customer influence) Contractors: HVAC and refrigeration, lighting, controls, installation, maintenance service companies, DG contractors Equipment manufacturers (equipment supply) Vendors/commercial supply store: retail displays and staff (customer influence) Research & development industry (pipeline of new measures) Media (marketing and outreach)
Current Status of Energy Efficiency Adoption and Penetration Existing commercial programs have focused on low-hanging fruit, which presents a challenge. However, significant opportunities remain for certain measures (LEDs, and advanced rooftop HVAC controllers, for example) and in certain sectors (SMB, for example). To make significant inroads at penetrating the SMB market, energy efficiency programs must develop creative solutions to address structural market barriers like the tenant-occupant split incentive. In the large commercial sector, relatively low cost opportunities like retrocommissioning can be paired with more capital-intensive measures and deep retrofits. Trendy measures like energy dashboards or subsidized electric vehicle infrastructure can be used as a hook to get a customer in the door. Likewise, leveraging upcoming regulations (such as building benchmarking) can be a leverage point for large commercial customers. A tailored and integrated approach is crucial to making significant progress at increasing commercial efficiency penetration rates. Commercial participation rates vary significantly across program administrators and by sector and programmatic approach. For example, Rhode Island’s SMB direct install program achieved a participation rate of 4.8% of eligible customers between 2008-2013; meanwhile, New York’s SMD direct install reached 16.9% of eligible customers between 2010-2014.4 Participation rates for commercial financing programs are predominantly 0.5% or less. A few notable exceptions are the Kansas How $mart program, which reached 1.3% of commercial and residential customers after just 3 years of operation, and Connecticut Light & Power Commercial and Industrial and Small Business Energy Advantage programs, which reached 8.2% of commercial and industrial customers after a decade of operation.5 Likewise, penetration rates vary significantly. For example, a study on measure-by-measure savings evaluation conducted as part of the California Investor Owned Utilities (IOU) Evaluation Measurement and Verification (EM&V) process point to a 1-6% range for commercial measures like PC power management and LED case lighting, with a few outliers providing up to 12% savings.6 A 2011 ACEEE report on financing programs also looked at annual energy savings, and found a range of 12-17% for eligible commercial customers.7
4 Lime Energy. Direct Install Utility Programs are defined as the systematic delivery of energy efficient equipment and technology to reduce customer demand on electricity. Accessed June 8, 2015. http://www.lime-energy.com/utilities 5 American Council for an Energy-Efficient Economy. September 2011. What Have We Learned from Energy Efficiency Financing Programs? Accessed June 8, 2015. http://www.pacenow.org/wp-content/uploads/2012/08/ACEEE-Sep-2011-paper.pdf 6 California Public Utilities Commission. 2013-2014 Final EM&V Plan. Accessed June 9, 2015. http://www.energydataweb.com/cpuc/home.aspx# 7 of savings.
Agenda Item #04: 2016 EE Draft Implementation Plans

9
To date, over 1,209 businesses have been audited through the joint MCE-PG&E direct install program managed by SmartLights. Savings are jointly distributed across the two program administrators. MCE has claimed savings from 372 of the businesses that participated, including 12,358,572 kWh (and 51,878 negative therms due to interactive effects).
Implementation Details MCE’s commercial energy efficiency program is designed to serve both large and small commercial customers. The program acknowledges inherent differences in opportunities between small and large commercial properties, and emphasizes integrating diverse program strategies under one umbrella. The proposed program will focus on customer satisfaction with the energy upgrade experience, and ultimately drive towards market transformation. The commercial program will offer low- or no-cost audits for small commercial properties, and will provide extensive audits with customizable incentives for larger properties. Upon completion of the audit, an integrated assessment process will streamline multiple program strategies into one customer report. MCE will deploy user-friendly customer management software that allows for an ongoing relationship between the business and the program. The program will provide participants with a SPOC who will serve as a facilitator and customer advocate, and help to guide the business owner through the process from initial contact to project completion. There are many benefits of a SPOC program. For example, projects may be more attractive to customers and easier to accomplish when all savings opportunities are bundled together and follow a clear, uniform presentation. In addition, the SPOC delivery model can provide more personalized attention and more follow through to reduce customer confusion and increase project completion rate. Project phasing is yet another benefit; MCE can remain in contact with participating properties over time and encourage property owners to implement projects in phases according to customer needs. To meet aggressive targets, MCE will employ software and data analytics platforms to target buildings and tailor strategies according to demographics and energy savings opportunities. Strategies MCE proposes to offer the following seven program strategies during the next program cycle. To help ensure a successful outcome, MCE proposes a phased rollout, particularly for the offerings that are relatively new. Some of the new offerings are relatively unproven, yet represent an exciting opportunity for the communities that MCE serves to demonstrate leadership and serve as pioneers forging new approaches to energy efficiency. The rollout will likely follow the order of the strategies below, depending on factors like customer demand and regulatory guidance. Non-energy benefits are an important component of each of the strategies. While the commercial program’s goal is to secure energy savings, the program recognizes the importance of selling benefits like improved productivity and aesthetics. Other non-energy benefits may include refrigerant leak and natural gas leak detection (used as a hook to entice customers to participate in commercial efficiency programs). In addition, HVAC contractors and builders must ensure ventilation standards (such as Combustion Appliance Safety (CAS) Test and Natural Gas Appliance Testing (NGAT) are met where the project scope includes building envelope measures or where the building lacks mechanical ventilation.
Agenda Item #04: 2016 EE Draft Implementation Plans

10
For each of the seven strategies, we include the following information (where applicable): • Overview • Key partners8 • Quality Assurance/Quality Control • Coordination with other programs • Strategy-specific metrics • Strategy-specific EM&V
1. Retrofit offers technical assistance, incentives (including kickers for whole building and multiple measures), and financing options to upgrade existing nonresidential facilities. In addition, customers who achieve zero net energy will receive a bonus incentive. Savings can be estimated with either a performance-based approach or widget-based, depending on the type of project. Rebates will be offered for lighting, HVAC, refrigeration, insulation, building envelope, plug loads, and other measures as appropriate. For a more detailed list of measures, see the E3 calculator. MCE will offer tailored approaches, recognizing that small businesses have different needs and barriers to entry than larger commercial facilities. For example, as a generalization, small to midsize businesses (SMB sector) may face more stringent payback period thresholds, whereas large commercial properties may be able to conduct deeper retrofits. Also, gaining access to key decision makers requires a different approach for small businesses than for large commercial offices. Key partners include contractors (HVAC and refrigeration, lighting, controls, installation, maintenance service companies), trade allies, green building groups, property management companies, chambers of commerce and other business oriented peer organizations, community-based organization, commercial real estate organizations, and financial and lending institutions. Quality Assurance/Quality Control: For all projects, contractors will be subject to 100% pre and post installation verification for their first ten projects with the program. MCE will pilot an approach to relax pre and post verification visits once contractors have successfully completed the ten initial projects with no issues; at that point, MCE will accept photos and associated documentation to confirm the existing conditions and proposed replacement. Of these projects, MCE proposes to conduct pre-installation site visits for approximately 25% of projects, selected randomly form the queue. If contractors are found to have made errors or provided false information, they will be subject to repeating the ten successful projects at 100% pre and post site visits. Operations & Maintenance training and documentation will be offered to all participants to ensure ongoing persistence of energy savings. Coordination with other programs: Coordination will involve many partner agencies, including water districts, climate coalitions, renewable and distributed generation companies and installers, and electric vehicle companies
8 Key partners may also serve as market actors, but are categorized as key partners in the “strategies” section to provide detail about the direct role they play in implementation.
Agenda Item #04: 2016 EE Draft Implementation Plans

11
Strategy-specific metrics:
• Number of customers that implement EE projects plus participate in DR, EV, DG, water, or other MCE or partner programs
• Number of projects receiving a whole building or multiple measures kicker
2. Green Business Certification provides proof of a company’s commitment to conserving energy and water, minimizing waste, preventing pollution, and reducing your carbon footprint. Green business certification can be a powerful tool to encourage companies to conduct energy assessments and invest in the efficiency of their operations. MCE partners with local governments’ sustainability departments to provide assistance in the certification process by helping customers navigate certification options and providing audit verification. MCE also will facilitate marketing and outreach for green businesses to help publicize the commitment to sustainability and generate demand locally for green business. In addition, MCE will promote green building rating schemes, and educate customers on the value of building labels.
Table 2: Certified Green Businesses in MCE’s Service Territory City/County Number of certified California Green
Businesses Benicia 1 El Cerrito 22 Marin County 434 Napa County (unincorporated) 4 Richmond 30 San Pablo 13 Source: California Green Business Program. Accessed June 24, 2015. http://www.greenbusinessca.org/
Key Partners: Bay Area Green Business Program, local governments, Chamber of Commerce’s, other industry organizations. Quality Assurance/Quality Control: Bay Area Green Business Program responsible for QA/QC Health & Safety: MCE will work with the existing green business certifications to encourage the inclusion of gas and refrigerant leak detection in the standard certification checklist. Strategy-specific metrics: Increase in certification of green businesses; number of green businesses that implement energy efficiency retrofits as part of their certification process.
3. Green Business Loans provide eligible customers with a low interest loan they can repay on
their monthly utility bills. The interest rate is 5% for $10,000-265,000 projects, with 5-10 year payment terms (rates subject to change). Up to 30% of the loan value can be used for non-energy related projects. Key Partners
• Financial/lending institutions (capital availability; M&O if MCE Green Business Loan partner)
• Contractors: HVAC and refrigeration, lighting, controls, installation, maintenance service companies (influencer; M&O; implementation)
Agenda Item #04: 2016 EE Draft Implementation Plans

12
• Trade allies and associations (M&O) • Community-based organizations: faith-based, initiative-focused, sector-specific (M&O)
Quality Assurance/Quality Control: Use loan application to ensure participants are creditworthy and minimize loan default rate Coordination with other programs: The availability of low interest financing can encourage projects for energy efficiency, and MCE intends to promote all products available in its service territory. Other programs which will be included in MCE outreach activities include: Property Assessed Clean Energy (PACE): PACE financing is a tool where property owners can voluntarily opt into an assessment, which is then tied to the property. Advantages of PACE include that it is transferable with the property, helping to mitigate concerns over payback period and average tenancy in a building, and the fact that it is paid on property taxes. PACE financing also enables investment in renewable energy and water savings improvements, and in some cases can be a source of financing for new construction projects.9 Currently MCE is working with the County of Marin to establish an Open Market PACE model where any provider who can agree to a minimum set of best practices would be eligible to operate in Marin. MCE will seek to work with other parts of its service territory to expand this approach to PACE. MCE maintains a financing marketplace web portal where information about all available financing products is presented to the customer. On-Bill Financing (OBF): Currently the IOUs have a program where ratepayer funds are offered to offset the upfront cost of a project and the customer can pay back the improvements over time on the utility bill. This product, offered at 0% and available for loans between $5,000 and $100,000 requires participants to limit the payback of projects financed through the loan to five years. However, this program may be a powerful motivator – particularly for small business customers who may have limited time tenancy in the property. Statewide Financing Pilots: The IOUs have been directed to offer a variety of financing tools for energy efficiency improvements. MCE will monitor the development of these products and ensure that customers are made aware of them as a possible means of completing upgrade projects. Strategy-specific metrics Number of participants Average loan amount Default rate Mix of measures financed through the program. Strategy-specific EM&V: MCE proposes process evaluations to determine if the availability of financing has enabled more, and more comprehensive, projects to be accomplished.
9 Some PACE providers utilize SB 555 (2012) as the enabling legislation; this follows the Mello-Roos style assessment (rather than the Streets and Highways Code assessment enabled under AB 811 [2008]), which can be used for new construction.
Agenda Item #04: 2016 EE Draft Implementation Plans

13
4. Demand Side Management Bidding pays incentives based on measured and verified savings. This “pay-for-performance” approach would leverage AMI data and innovative meter-based performance strategies. The intent is to capture real, verified savings in a more administratively efficient way across demand side management resources. Advocates explain that the approach “is intended to spur private sector innovation and investment by building a market for efficiency bundled with DR, solar, EVs, and DG”. 10 Furthermore, “if implemented correctly, this approach would create transparent and real time accounting for savings using Smart Meter data and increase quality efficiency installations by making contractors accountable to measured performance. This would ultimately reduce EE program administration and evaluation costs by making the industry (and not just the program) responsible for performance risk”.11 Another key innovation with the demand side management bidding strategy would explore the use of a transaction structure in which a third-party investor finances building efficiency upgrades. MCE would then buy the actual energy savings, while the building tenant or owner would reduce electricity consumption costs. MCE would partner with industry leaders to pilot this innovative approach to using energy efficiency in procurement. Key partners include software companies with energy dashboards, financing lending institutions, and metering services companies Quality Assurance/Quality Control: A major benefit of metered-based measurement is the potential for greater accuracy at a lower cost. However, a baseline must first be established and the model must be proven (including accounting for variables like weather, occupancy, changes in tenant behavior and production, etc.). Coordination with other programs: Considering the integrated nature of the standard offer, coordination can involve many partner agencies, including water districts, climate coalitions, renewable and distributed generation companies and installers, and electric vehicle companies. Coordinated strategies will be employed based on customer demand. Strategy-specific metrics: number of customers who express interest in the program. Strategy-specific EM&V: conduct an impact evaluation comparing traditional EM&V approaches to the meter-based strategies. These studies would explore cost effectiveness of savings delivered relative to existing EE strategies and whether or not this program achieves integration of savings into MCE’s procurement portfolio.
5. Data Analytics and Behavioral Approaches offers a wealth of innovative tactics to inform, engage and motivate customers to change their energy consumption habits. Many of the same tools can also serve as powerful tools to target customers for participation. Data analytics and software systems are leveraged to enable continual measurable feedback for assessing opportunities, project tracking, lead generation, and measurement and verification (M&V).12
10 TURN, Response to R.14-10-003, page 8 11 Ibid. 12 Measurement and verification differs from evaluation, measurement, and verification (EM&V) in that it is information gathered real time and analyzed in house for the purposes of immediate program improvement.
Agenda Item #04: 2016 EE Draft Implementation Plans

14
Examples include everything from benchmarking platforms (like Energy Star Portfolio Manager), to load disaggregation software, to fault detection and diagnostics software. These tools could also enable dashboard control of plug load technology, and / or information to the customer to control the energy use of existing plug loads. Behavioral approaches can couple these tools with the principles of social norming. Possible strategies could include comparative energy reports, competitions, development of green teams, interactive energy-use kiosks, social media, and games. Specific approaches will be tailored according to customer need and demand. Consistent with the other program strategies, data analytics and behavioral approaches will allow for integration with DR, DG, plug load control, and EVs. This program could be combined with the retrofit program, providing rebates for lighting, HVAC, refrigeration, insulation, building envelope, plug loads, and other measures as appropriate. For a more detailed list of measures, see the E3 calculator. Key Partners include the following:
• Software companies with energy dashboards, energy benchmark reports, fault detection and diagnostic capabilities, and other tools aimed at enabling continual measurable feedback for assessing opportunities, project tracking, lead generation, and M&V
• Controls contractors (can promote program strategies) • Companies that produce energy benchmark reports • Companies that produce energy-use kiosks or displays • Companies specializing in social media, games, and other customer engagement tactics
to promote energy efficiency • Green building groups (provide marketing & outreach support) • Community-based organizations: faith-based, initiative-focused, sector-specific, etc.
(provide marketing & outreach support) • Trade allies and associations (provide marketing & outreach support)
Quality Assurance/Quality Control: For QA, launch a small-scale pilot to ensure tools work smoothly and data is accurate before opening the door to all eligible customers. For QC, leverage benchmarking tools and billing data to ensure accuracy. Programs will be encouraged to participate in MCE’s O&M training, where appropriate, to encourage persistence of savings. Coordination with other programs: While the tools themselves may offer water and GHG data, MCE will partner with water districts and climate coalitions to ensure coordination across programs. Other partners may include City Chambers, County development and sustainability departments, and local consulting companies. Strategy-specific metrics: number of participants (at both a company and employee level) in behavioral campaigns.
EM&V is traditionally bid to an independent third party to provide an analysis of program improvement for regulatory processes.
Agenda Item #04: 2016 EE Draft Implementation Plans

15
Strategy-specific EM&V Conduct a limited number of side-by-side studies comparing savings estimated by the software program to savings estimates from traditional M&V approaches (i.e., pre- and post-inspections for lighting and HVAC measures).
6. Strategic and Continuous Energy Improvement (S-CEI): is a way of promoting energy efficiency
as a lifestyle. It involves the creation of an ongoing plan for integrated demand side management plans, with leadership buy-in as a key element for success. The goal is to create lasting changes driven from management and facilities personnel alike. The typical pillars of an S-CEI program include: obtaining management support for ongoing energy efficiency enhancements, conducting ongoing assessments, trainings and improvements, and periodically developing and reviewing strategic efficiency goals. An emerging best practice is to offer energy management certification to help ensure the long-term success of projects. S-CEI projects can be a mix of retrocommissioning (RCx) in that they typically target more behavioral and operational measures; however, they go beyond RCx by emphasizing leadership buy-in and ongoing updates to energy management plans. Anticipated benefits to MCE include measurement of actual savings, plus a higher likelihood of deeper savings, greater persistence and improved customer satisfaction. Rebates will be given for lighting, HVAC, refrigeration, insulation, building envelope, plug loads, and other measures as appropriate. For a more detailed list of measures, see the E3 calculator. Key Partners include contractors (HVAC and refrigeration, lighting, controls, installation, and maintenance service companies), trade allies and associations, green building groups, and financial and lending institutions Quality Assurance/Quality Control QA: consider employing benchmarking tools, billing and meter data analysis, facility production and operations data, weather data, or existing energy management information systems (EMIS) data in baseline calculations. QC: retrofit savings will be estimated in accordance with the retrofit strategy guidelines; behavioral savings will be estimated according to an experimental design approach comparing a treatment group to a control group with regression analysis.13 Strategy-specific metrics Number of strategic energy management plans written Non-energy benefits like increased productivity and other operational impacts Strategy-specific EM&V Statistical design between control and experimentation groups to verify program savings. MCE proposes an independent survey of participants to gather qualitative information on program
13 See, for example, steps adopted from Cadmus study on “Estimating Energy Savings from CEI”: Page 2. http://www.energydataweb.com/cpucFiles/pdaDocs/903/Appendices%20A%20-%20G.pdf (accessed June 11, 2015)
Agenda Item #04: 2016 EE Draft Implementation Plans

16
design, marketing and outreach, program implementation, participation experience, and market barriers. 14
7. New Construction targets new facilities or major renovations that require a building permit and trigger code compliance. MCE offers education, performance-based incentives and financing options to foster greater adoption of energy efficient and green building practices. Exceeding Title 24 requirements requires significant investment and technical knowledge. To help overcome this barrier, outreach will be conducted to architects and builders to encourage factoring energy-efficient technologies and strategies into cost estimates and design plans. Performance-based incentives will be offered to encourage investment in long-term energy savings. In addition, MCE will connect property developers with emerging financing programs that can help eligible customers to help defray the higher upfront cost (for example, PACE). Finally, customers who achieve zero net energy15 will receive a bonus incentive. MCE will offer tailored approaches, recognizing that small businesses have different needs and barriers to entry than large commercial facilities. Rebates will be offered for lighting, HVAC, refrigeration, building envelope, plug loads, and other measures as appropriate. MCE will evaluate offering tiered incentives for exceeding code. For a more detailed list of measures, see the E3 Calculator. Key partners include builders, developers, architects, DG companies, contractors (HVAC and refrigeration, lighting, controls, installation, maintenance service companies), trade allies, green building groups, community-based organization, commercial real estate organizations, and financial and lending institutions. Quality Assurance/Quality Control: QA/QC is built into the savings estimation process. MCE’s new construction projects will conform to the California Energy Commission’s (CEC) standards and list of approved energy analysis computer programs that are in accordance with Title 24 code. Approved software programs include CBECC-Com, IES Virtual Environment, and EnergyPro.16 These software programs are important tools for analyzing efficiency choices and estimating savings. MCE staff reviews all savings estimates and appropriate documents and plans to ensure reporting accuracy. Owners are encouraged to develop and implement operations and
14 MCE proposes a process consistent with that in the Cadmus study on “Estimating Energy Savings from CEI”: Page 2. 15 ZNE is defined as, “The societal value of energy consumed by the building over the course of a typical year is less than or equal to the societal value of the on-site renewable energy generated.” (IEPR Workshop on the Definition of ZNE, July 2013) 16 For details, visit the California Energy Commission’s 2013 Building Energy Efficiency Standards Approved Computer Compliance Programs website: http://www.energy.ca.gov/title24/2013standards/2013_computer_prog_list.html (accessed June 25, 2015). An alternate calculation method can be employed if an application to the CEC is successfully approved. For details, visit 2013 Nonresidential Alternate Calculation Method Approval Manual: http://www.energy.ca.gov/2012publications/CEC-400-2012-006/CEC-400-2012-006-CMF-REV.pdf (accessed June 25, 2015)
Agenda Item #04: 2016 EE Draft Implementation Plans

17
maintenance plans to ensure the building and its equipment and appliances continue to operate optimally. Coordination with other programs: Considering the integrated nature of the new construction, coordination can involve many partner agencies, including water districts, climate coalitions, renewable and distributed generation companies and installers, and electric vehicle companies. Coordinated strategies will be employed based on customer demand. Marketing and Outreach: Ensuring customer demand for new, efficient buildings will involve reaching customers before the decision to build is made. As stated above, established relationships with architects and builders will be key to this. MCE will also partner with local government building offices to ensure information about program services is available where customers and contractors go to obtain permits. Demand generation activities that highlight the benefits of comfortable, efficient, and aesthetically pleasing new homes will focus on print and media ad campaigns in local home magazines and other local media outlets. Strategy-specific metrics: Number of customers that participate in new construction projects plus participate in DR, EV, DG, water, or other MCE or partner programs. Strategy-specific EM&V Process evaluation to determine most effective ways and extent MCE’s services enable and promote more efficient new construction.
Measuring Success Program Performance Metrics MCE takes an adaptive management approach to continuously evaluate program performance. To enable an interactive approach, MCE has a process for gathering information: Advanced Metering Infrastructure (AMI) data, customer feedback, participation surveys, and other sources. This feedback loop enables MCE to make improvements throughout the program cycle. For the commercial sector, the following performance metrics will be tracked:
1. Participation metrics: number (of participants?) and percent for each county within MCE service territory; number of hard-to-reach customers; number of repeat participants; number of projects provided with technical assistance
2. Savings metrics: net and gross energy and demand savings. MCE plans to employ a mix of deemed, widget based methodologies as well as custom and performance based methodologies.
3. Measure-level information: total number of installed measures; claimed EUL for each measure (deemed and calculated) installed
4. Incentive metrics: total amount offered; largest rebate amount 5. Market transformation indicators: number of contractor partners; number of trade allies;
number of customer touch points (i.e., mailers and events) EM&V Impact Evaluation: MCE will gather data on participation metrics, savings, and measure information as a standard business practice. Depending on resources and expertise, MCE will either conduct or hire an
Agenda Item #04: 2016 EE Draft Implementation Plans

18
outside firm to complete a study on the market transformation indicators mentioned for each of the program strategies. Process Evaluation: MCE will gather customer satisfaction and referral metrics as standard business practice – either on project forms, or via customer survey submitted shortly after project completion. This data will be analyzed to ensure continuous improvement and that program strategies align with customer needs.
Agenda Item #04: 2016 EE Draft Implementation Plans

Technical Committee: EE Implementation Plans Energy Efficiency Team| Marin Clean Energy
July 6, 2015
Agenda Item #04: 2016 EE I-Plan Presentation
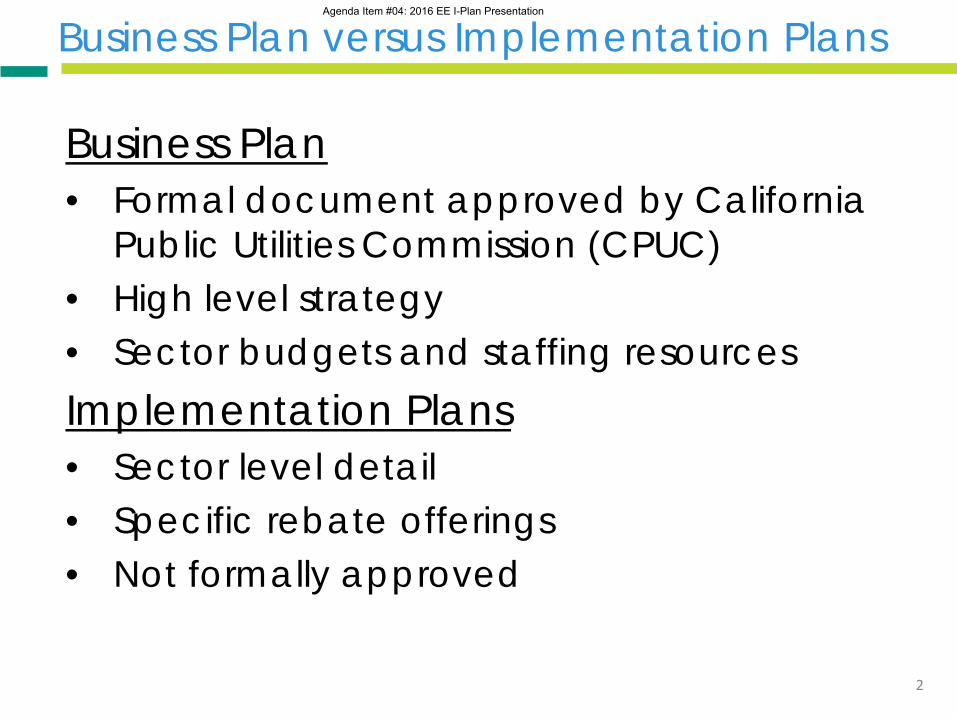
Business Plan versus Implementation Plans
Business Plan • Formal document approved by California
Public Utilities Commission (CPUC) • High level strategy • Sector budgets and staffing resources Implementation Plans • Sector level detail • Specific rebate offerings • Not formally approved
2
Agenda Item #04: 2016 EE I-Plan Presentation

Implementation Plan Preview: Commercial
Document Structure • Budget, savings targets, cost
effectiveness metrics • Market characterization
• Building and energy characteristics • Key market actors / forces
• Specific Strategies • Program design • Quality assurance / quality control
3
Agenda Item #04: 2016 EE I-Plan Presentation

Commercial
4
Year 1-2 Year 3-4 Year 5-10 Ten Year % of Total Portfolio
Budget $ 4,268,465 $ 6,551,348 $ 7,650,294 $ 18,470,107 22%
Electric (kWh) 3,552,496 7,785,435 36,815,369 48,153,300 42% Natural Gas (therms) 3,503 (20,331) (96,203) (113,031) -5%
Agenda Item #04: 2016 EE I-Plan Presentation

Savings Methodology
1 • Define and Quantify Target Population
2 • Estimate Participation Rate
3 • Estimate Savings Potential
4 • Develop Measure List
5 • Develop Incentive Structure
6 • Calculate Savings Targets and Cost Effectiveness
5
Agenda Item #04: 2016 EE I-Plan Presentation

Commercial Budget Detail
Category Years 1-2 Years 3-4 Administration $270,000 $400,000 Marketing and Outreach $341,139 $322,152 Direct Implementation $840,443 $1,705,316 Incentives $1,076,638 $1,460,168 Evaluation, Monitoring, & Verification $100,000 $120,000 Total $2,628,220 $4,007,636
6
Agenda Item #04: 2016 EE I-Plan Presentation

Commercial: Market Characterization
• 10% of MCE’s accounts, but 31% of electrical consumption
• Small commercial • Limited capital and decision making
authority • Difficulty reaching decision makers
• Medium to large commercial • Energy efficiency is small proportion of
operating expenses • Leveraging more visible improvements
like solar and electric vehicles is a key approach
7
Agenda Item #04: 2016 EE I-Plan Presentation

Commercial: Market Characterization
8
Commercial electrical use by building type (statewide)
Commercial electrical use by end use (statewide)
Agenda Item #04: 2016 EE I-Plan Presentation

Commercial: Market Characterization
9
0%
10%
20%
30%
40%
50%
60%
70%
Before 1950 1950-1974 1975-1999 2000-2014
Commercial Building Vintage by Service Territory
Richmond, El Cerrito, and San Pablo Marin Napa Benicia
0%
10%
20%
30%
40%
50%
60%
70%
< 5k 5k > 10k 10k > 20k 20k > 50k 50k > 100k > 100k
Commercial Building Size by Service Territory*
Richmond, El Cerrito, and San Pablo Marin Napa
Most commercial buildings pre-date Title 24; exception is Benicia.
Most large commercial facilities in Marin; Richmond and San Pablo have a lot of smaller commercial facilities.
Agenda Item #04: 2016 EE I-Plan Presentation

Commercial Market Characterization
Trigger Points • Seasons • Turnover and Upgrades • Operating Budget Cycles • Regulations, standards, goals • Equipment failure Key Market Actors • Energy consumers • Regulatory bodies • City and County organizations • Community organizations • Business partners (i.e. contractors) • Equipment distributors
10
Agenda Item #04: 2016 EE I-Plan Presentation

Commercial: Program Strategy
• Single point of contact identifies customers objectives with a project
• Key strategies can be leveraged • Expanded retrofit program • Strategic and Continuous Energy
Improvement (S-CEI) • Pay for performance model • Data analytics / behavior • New construction
11
Agenda Item #04: 2016 EE I-Plan Presentation

Commercial: Adaptive Management
Program Monitoring • Quantitative metrics
• Participation rate • Energy savings • AMI data to monitor real impacts
• Qualitative metrics • Customer surveys • Contractor surveys
12
Agenda Item #04: 2016 EE I-Plan Presentation

Next Steps
• July 10: All program implementation plans (PIPs) released for public comment
• July 24: Deadline for public comment • July 29: Revised PIPs for committee
review • August 3: Technical Committee • August 5: Executive Committee • August 7: Tentative Date to File with
CPUC
13
Agenda Item #04: 2016 EE I-Plan Presentation

Thank you!
Questions?
MCE Energy Efficiency Team (415) 363-6033
14
Agenda Item #04: 2016 EE I-Plan Presentation