maricopa county adult probation department report 2013
TRANSCRIPT
October 2013
2013 adult probation report Maricopa County Adult Probation Department Report
i
Arizona Arrestee Reporting Information Network 2013 Maricopa County Adult Probation Department Report
By David E. Choate
October 2013
Suggested citation: Choate, David E. (2013). Arizona Arrestee Reporting Information Network: 2013 Maricopa County Adult Probation Department Report. Phoenix, AZ: Center for Violence Prevention & Community Safety, Arizona State University.
ii
Contents
Arizona Arrestee Reporting Information System Overview 1 Methodology and Sampling 2 Survey Instrument 3 Introduction and Key Findings 5 Characteristics of the Sample 6 Drug and Alcohol Use 11 Positive Urinalysis Results 14 Criminal Involvement 17 Gang Involvement 26 Substance Abuse / Dependence 27 Mental Health 30 Victimization 33 Firearm Possession 38 Police Contact 40 Probation Officer Perceptions 42
List of Exhibits Exhibit 1: Sample of Arrestees 6 Exhibit 8: Substance Abuse / Dependence 28-29
Exhibit 2: Characteristics 8-10 Exhibit 9: Mental Health 31-32
Exhibit 3: Drug Use Results 12-13 Exhibit 10: Victimization – 12 months 34-35
Exhibit 4: Positive UA Results 15-16 Exhibit 11: Victimization – 30 days 36-37
Exhibit 5: Arrest History 18 Exhibit 12: Firearm Possession 39
Exhibit 6: Criminal Involvement by Type 19-25 Exhibit 13: Police Contact 41
Exhibit 7: Gang Involvement 26 Exhibit 14: Probation Officer 42

iii
1
AARIN Program Overview The Arizona Arrestee Reporting Information Network (AARIN) is a monitoring system that provides ongoing descriptive information about drug use, crime, victimization, and other characteristics of interest among individuals arrested in Maricopa County, Arizona. Funded by the Maricopa County Board of Supervisors beginning in 2007, AARIN is modeled after the former National Institute of Justice (NIJ) national-level Arrestee Drug Abuse Monitoring Program (ADAM). In three facilities throughout the county, professionally trained interviewers conduct voluntary and confidential interviews with recently booked adult arrestees and juvenile detainees. Questions focus on a range of topics including education, employment and other demographics, patterns of drug use (lifetime and recent), substance abuse and dependence risk, criminal activity, gang affiliation, victimization, mental health, interactions with police, public health concerns, incarceration and probation, citizenship, and treatment experiences. Each interviewee also provides a urine specimen that is tested for the presence of alcohol and/or drugs. Arrestees who have been in custody longer than 48 hours are ineligible for participation in AARIN, due to the 72-hour time limitation for valid testing of urine specimen.
The instruments used and the reporting mechanism underwent a substantial revision in 2011. While maintaining all of the data elements from the previous core set of questions, the baseline interview expanded by more than 60%. Additionally, with the change in the core questionnaire, the project shifted its reporting strategy to focus reports to each of six key Maricopa County criminal justice agencies: Maricopa County Manager’s Office, Maricopa County Sheriff’s Office, Maricopa County Attorney’s Office, Office of the Public Defender, Adult Probation Department, and the Juvenile Probation Department.
Overall, AARIN serves as a near-real time information source on the extent and nature of drug abuse and related activity in Maricopa County, AZ. This information helps to inform policy and practice among police, courts and correctional agencies to increase public safety and address the needs of individuals who find themselves in the criminal justice system.
For information using the most recent set of data, please see the following reports:
• Maricopa County Manager’s Office – Report on medical marijuana use among the arrestee population of Maricopa County.
• Maricopa County Sheriff’s Office – Report based on the Booking Process Addendum, which assesses the implementation and early indicators related to the MCSO’s new Integrity, Accountability and Community Initiative, for arrestees as they move through the booking process at Central Intake.
• Maricopa County Attorney’s Office – Detailed report covering veterans among the arrestee population, combining core instrument data with data from the Veteran Addendum to assess the particular needs and experiences of Maricopa County arrestees who are veterans.
2
• Office of the Public Defender – Assessment of use of force and perception of police among selected special populations of Maricopa County arrestees, primarily drawing from the Police Addendum data.
• Adult Probation Department – Comprehensive summary of the core questionnaire comparing Maricopa County probationers to probationers from elsewhere and those arrestees who have not served probation.
• Juvenile Probation Department - Comprehensive summary of the core juvenile questionnaire comparing Maricopa County juvenile probationers to those who have served probation elsewhere and those detainees who have not served probation.
For other reports and more information about the project, visit the AARIN page of the Center for Violence Prevention & Community Safety’s website: http://cvpcs.asu.edu/.
Methodology: Sampling and Data Collection In order to ensure representative results for the entire population of arrestees in Maricopa County, the AARIN project employs a systematic sampling protocol that includes the collection of data with target quotas each day. Data are collected during three cycles each calendar year – with interviews conducted during a continuous two-week period at the Central Intake of Maricopa County’s Fourth Avenue Jail each collection cycle. Dispersing data collection cycles across three different four-month blocks helps control for possible seasonal variations in crime and arrest patterns, and conducting collections covering all seven days of the week account for possible differences between weekdays and weekends, or other day-to-day variations. The periodic data collection cycles combined with the sampling protocols ensures a representative sample of all Maricopa County arrestees. The same procedures employed by AARIN were tested under ADAM (Maricopa County was one of the sites used in the evaluation), comparing the selected sample to comprehensive jail census data to assess the representativeness of the sample to the population on key characteristics. The National Opinion Research Center at the University of Chicago was the national data manager for ADAM at the time and concluded that the periodic data collection cycles, sampling protocols and daily quotas would result in a scientifically representative sample of study participants that could be generalized to the whole of arrestees for the particular jurisdiction (i.e. Maricopa County arrestees).
Daily collection quotas call for 23 males and 7 females to be interviewed, including the completion of the core instrument, any and all addenda, and to provide a urine specimen. Potential participants are selected using a standardized procedure (described below) to ensure both a sufficiently randomized and representative sample of arrestees. Some of the potential participants are either unavailable or otherwise ineligible for participation. Most commonly this applies to those arrestees who have already been released from custody or transferred to another facility, but also includes those whose behavior constitutes a safety risk to the jail and/or interview staff. Upon initial contact, arrestees are read an informed consent script (see inset), to which they voluntarily either decline or agree to participate; typically more than 90% agree to participate.
3
Hello, my name is __. I am working on a research project run by Arizona State University. The purpose of the project is to understand issues and problems confronted by people and to help give advice on how to provide services to individuals who have been arrested. I would like to ask you a series of questions that will take 15-45 minutes to answer. There are no foreseeable risks for participating in this research, and there are no benefits to you individually. Jail personnel will not have access to the information that you provide us. The information you provide is confidential and anonymous, and it will not help or hurt your case. If, for any reason, you become distressed or anxious during the interview, you can request to speak with the facility’s medical personnel or psychological counselors.
Consent Script:
I will not write down your name or any other identifying information the questionnaire. You can refuse to answer any question, and you may stop the interview at any time for any reason. At the end of the interview I will ask you to provide a urine sample. If you listen to my questions, I will give you a candy bar. Do you have any questions?
During the data collection period, interviews are conducted during an eight-hour period each day, with arrestees who are randomly selected based on their booking time that yields a stratified random sample. Consistent with the ADAM sampling strategy, a stock (i.e., arrested and booked during non-data collection hours) and flow (i.e., during data collection hours) process is employed to ensure a representative sample of arrestees across any given 24-hour period. The stock sample is selected by starting with a list of all bookings processed from the 16 hours that range from when collection ended the previous day through the start-time of the current collection day. Eligible bookings are counted and divided by ten, which gives the selection interval. A random start-point is selected, and each nth (e.g. the value equal to the selection interval) arrestee is selected as a potential participant. A “nearest-neighbor” procedure is used to replace members of the stock list that are either found to be ineligible or unavailable, or whom decline to participate, until the daily quota of 10 completed and provided interviews is met. The flow sample is more straight-forward. Potential participants are randomly selected as they are booked into the facility as needed. A minimum of 13 completed and provided interviews are expected to meet daily quota.
Survey Instrument The core AARIN survey instrument is modeled after the ADAM and Drug Use Forecasting (DUF) instruments, and was developed with input from Maricopa County officials. Starting with the third collection cycle of 2011, AARIN began using a new core instrument. The new instrument included the same elements of the previous version, but expanded by more than 60%, following extensive input from Maricopa County officials representing six key agencies related to the criminal justice system and the arrestee population – the County Manager’s Office, Sheriff’s Office, County Attorney, Public Defender, Adult Probation, and Juvenile Probation.
The instrument is broken down into a variety of sections that include: demographics and background information (sex, race/ethnicity, age, citizenship, educational level, methods of income), current and past
4
drug use (ever, past 12 months, 30 days and three days), drug dependency and treatment, medical marijuana and marijuana acquisition, criminal history (ever, past 12 months), gang involvement, firearms possession, victimization (past 12 months, 30 days), police interactions, mental health issues (ever and past 12 months), correctional health services and public health concerns, and incarceration and probation history (ever and past 12 months). Additionally, the AARIN platform includes addenda instruments to the core set of questions. Addenda are used to collect more detailed information regarding a particular topic and/or population. The collection cycle is based on a fiscal year, and the reports using the most recently collected data were collected from September 2012 through June 2013. During this collection year, both a police contact and a gang addenda were used, collecting information from arrestees about police in general, use of force by and against the police (Police Contact Addendum), reasons and methods for joining and leaving a gang, gang organizational structure and criminal activities, and the respondents’ perceptions of cohesion and connectedness to their gang (Gang Addendum). Additionally, for one collection period, a booking process addendum was used to provide direct analysis of the principles and procedures outlined in the MCSO Integrity, Accountability and Community Initiative.
Urinalysis Testing Once an interview is completed, the arrestee then submits a urine sample. The urine specimens are tested for alcohol and four illicit drugs: cocaine, marijuana, methamphetamine, and opiates. The testing is done using the enzyme-multiplied immunoassay technique (EMIT), which has shown a high degree of accuracy with very few false-positive results (Reardon, 1993). As a reliability check, all specimens that test positive with the EMIT methods are then tested again using Gas Chromatography with Mass Spectrum Detection (GC/MS). The EMIT technique with GC/MS confirmation procedures are well-established and offer highly reliable results for the illicit drugs under study here – cocaine, marijuana, methamphetamine, and opiates – for up to 72 hours after use. Unfortunately, these procedures offer high reliability results for alcohol for only 12-24 hours after use. The adoption of more sensitive alcohol screening procedures was cost-prohibitive, however.
Sample Used in the Present Report The analyses presented in this report are derived from 1,370 completed interviews. Originally, 1,848 arrestees were screened used the methodology described above, at which time about 15% (n=189) were eliminated as ineligible for a variety of reasons (e.g. released, transferred to another facility, segregated to isolation due to violent behavior, etc.). Of the remaining 1,579 available and eligible arrestees, 88.1% (n=1,390) agreed to participate, and of those 98.6% (n=1,370) completed the interview.
5
Adult Probation Department Report The analysis and report presented here is prepared specifically for the Maricopa County Adult Probation Department (APD) on behalf of the Maricopa County Board of Supervisors (BOS) and Maricopa County Manager as part of their support of the Arizona Arrestee Reporting Information Network (AARIN). The researchers at Arizona State University (ASU) and its Center for Violence Prevention and Community Safety (CVPCS) are the authors of this report and any errors, omissions and opinions are their own and do not necessarily reflect the other parties. The analysis plan and the format of this report are derived from numerous meetings held over more than an eighteen-month span with the AARIN project advisory board, Maricopa County leadership, and representatives from Maricopa County APD. Following the guidance of the advisory board, the dissemination strategy for the AARIN project shifted from a single, broadly scoped annual summary report supplemented by smaller topic-specific reports into shorter, individual reports tailored to the specific needs and wants of six key county criminal justice agencies. Meetings with APD representatives regarding their individualized report indicated they would be most interested in a broad analysis akin to the traditional AARIN annual reports. A key modification to this broad traditional analysis strategy, this report compares arrestees in three categories of probation history – never served probation (or not in the past 12 months), served probation in a county other than Maricopa, and served probation in Maricopa County, each defined for either lifetime or the past 12 months, ultimately yielding six analysis categories. Each of the three probation categories are mutually exclusive within a given time period (i.e. lifetime and past 12 months). Given the APD’s need for the broadly scoped analysis as opposed to a topically focused and interpretive report, the report here primarily provides analyses across most of the core instrument elements, presented in tabular form, with a list of key findings and highlights. This report format was first used in 2012, and is again used for the 2013 report, with some additional analyses and tables.
Key Findings The analyses for this report are derived from the 1,370 arrestees who completed the interview (with or without a testable urine sample), including sufficient responses to critical probation related questions. Arrestees were asked whether they had been on probation ever and within the last 12 months, either under the jurisdiction of Maricopa County or another probation agency. About two-in-five of arrestees (41.4%) indicated that they had been on probation in Maricopa County at some point in their life, and 14.8% reported being under Maricopa County probation supervision currently (see Exhibit 1). An additional 14.2% reported being on probation for another agency, and 1.8% indicated that they were currently still serving probation with this “other” agency. In sum, the majority of arrestees interviewed had been under probation supervision at some point in the past (55.6%; in Maricopa County or elsewhere), and nearly one-fifth were currently on probation at the time of their arrest and interview (16.6%).
6
In general, results show that past Maricopa County probationers1
have extensive criminal arrest histories with frequent and diverse criminal involvement; they also are active, long-term drug users with substantial dependence issues. Many are gang-involved, and nearly half have had mental health problems in their past. A comparison of past Maricopa County probationers to non-probationer arrestees demonstrates that the problems experienced by those previously under MCAPD supervision are far more extensive and severe than non-probationers. There are numerous similarities, however, between past Maricopa County probationers and those who have been under probation supervision elsewhere. More detailed findings are reported below.
Exhibit 1: Sample of Arrestees by Probation Status
No Probation Other Probation Maricopa County Total
Ever Currently Ever Currently Ever Currently Ever Currently
n 603 1,044 194 22 567 185 1,370 1,370
% 44.2 83.5 14.2 1.8 41.4 14.8 100.0 100.0
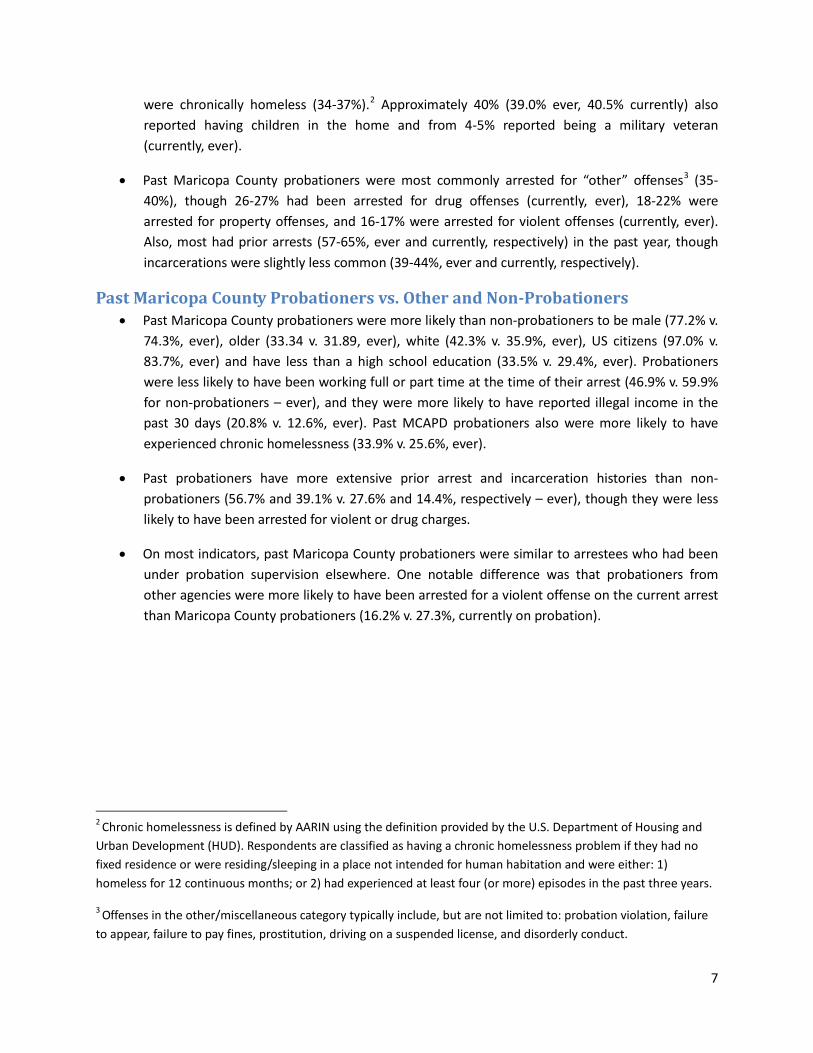
Characteristics of the Sample (Exhibit 2) Past Maricopa County Probationers
• The majority of past Maricopa County probationers were male (77.2% ever; 74.6% currently), over age 25 (mean ages of 33.3 and 31.2, ever and currently, respectively), and non-white. Approximately 7-12% were Black (currently and ever), from 25-29% were Hispanic/Latino (currently and ever), 8% were Native American, and 9-12% reported their race/ethnicity as “other” (ever and currently). The vast majority reported US citizenship (97%).
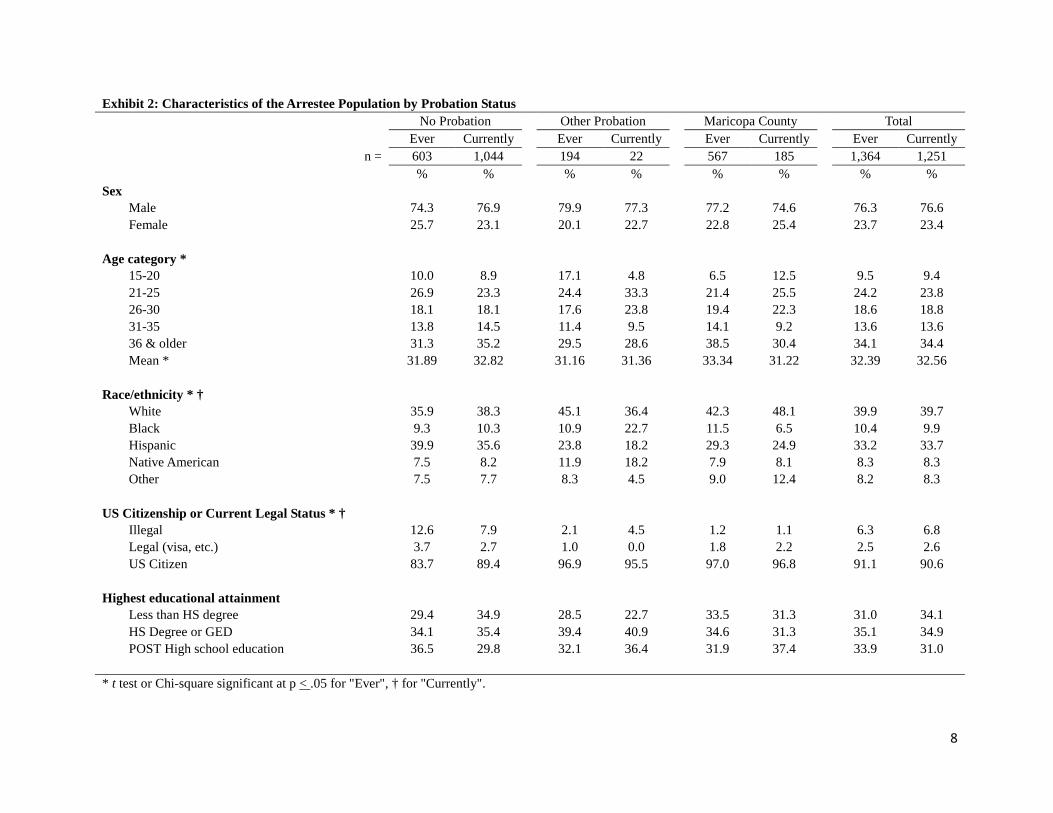
• One-third of past Maricopa County probationers had less than a high school degree (31-34%; currently and ever); an additional 32-37% (ever and currently) had post high school education. From 33-47% (currently and ever, respectively) reported working full or part time in the month before their arrest; about 14% reported income from illegal sources, and 8-9% reported no income (currently, ever).
• Though the vast majority of past Maricopa County probationers reported residing in a private residence in the month before their arrest (84-86%), more than one-third also reported that they
1 The term “Past Maricopa County Probationers” is used to describe arrestees who self-reported being under Maricopa County Probation supervision, either in the last 12 months or at some point in their lives (i.e., ever).
7
were chronically homeless (34-37%).2
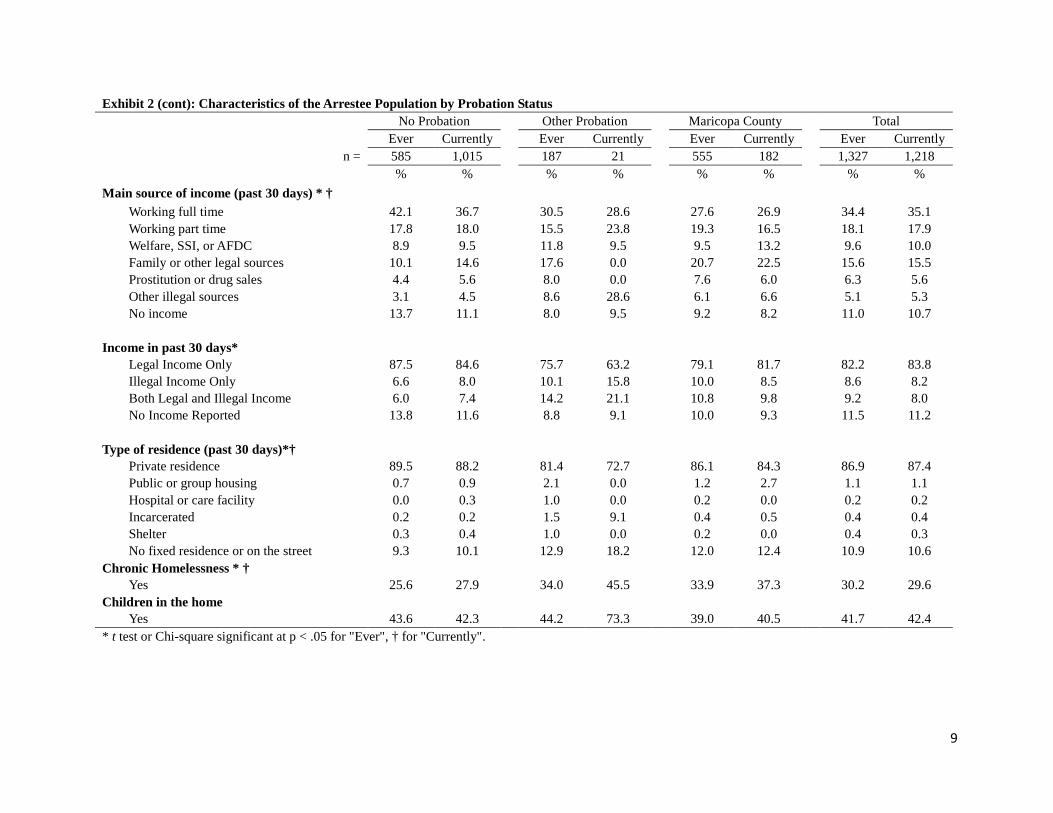
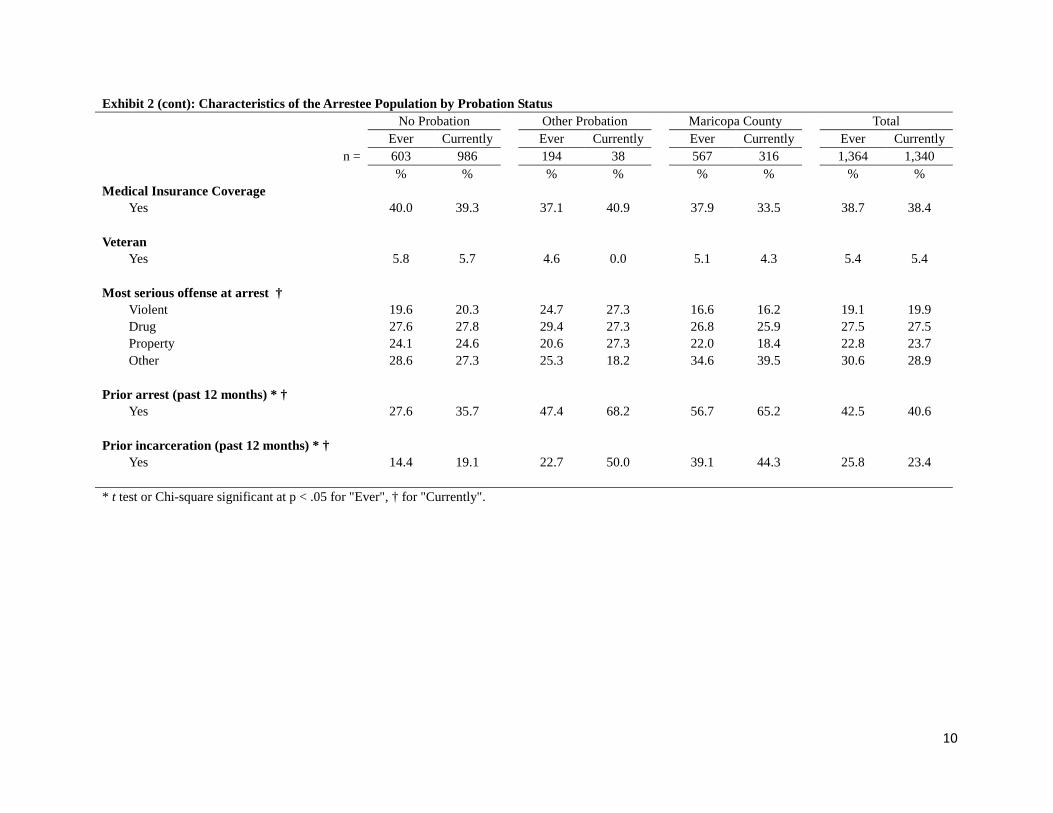
• Past Maricopa County probationers were most commonly arrested for “other” offenses
Approximately 40% (39.0% ever, 40.5% currently) also reported having children in the home and from 4-5% reported being a military veteran (currently, ever).
3
Past Maricopa County Probationers vs. Other and Non-Probationers
(35-40%), though 26-27% had been arrested for drug offenses (currently, ever), 18-22% were arrested for property offenses, and 16-17% were arrested for violent offenses (currently, ever). Also, most had prior arrests (57-65%, ever and currently, respectively) in the past year, though incarcerations were slightly less common (39-44%, ever and currently, respectively).
• Past Maricopa County probationers were more likely than non-probationers to be male (77.2% v. 74.3%, ever), older (33.34 v. 31.89, ever), white (42.3% v. 35.9%, ever), US citizens (97.0% v. 83.7%, ever) and have less than a high school education (33.5% v. 29.4%, ever). Probationers were less likely to have been working full or part time at the time of their arrest (46.9% v. 59.9% for non-probationers – ever), and they were more likely to have reported illegal income in the past 30 days (20.8% v. 12.6%, ever). Past MCAPD probationers also were more likely to have experienced chronic homelessness (33.9% v. 25.6%, ever).
• Past probationers have more extensive prior arrest and incarceration histories than non-probationers (56.7% and 39.1% v. 27.6% and 14.4%, respectively – ever), though they were less likely to have been arrested for violent or drug charges.
• On most indicators, past Maricopa County probationers were similar to arrestees who had been under probation supervision elsewhere. One notable difference was that probationers from other agencies were more likely to have been arrested for a violent offense on the current arrest than Maricopa County probationers (16.2% v. 27.3%, currently on probation).
2 Chronic homelessness is defined by AARIN using the definition provided by the U.S. Department of Housing and Urban Development (HUD). Respondents are classified as having a chronic homelessness problem if they had no fixed residence or were residing/sleeping in a place not intended for human habitation and were either: 1) homeless for 12 continuous months; or 2) had experienced at least four (or more) episodes in the past three years.
3 Offenses in the other/miscellaneous category typically include, but are not limited to: probation violation, failure to appear, failure to pay fines, prostitution, driving on a suspended license, and disorderly conduct.
8
Exhibit 2: Characteristics of the Arrestee Population by Probation Status
No Probation Other Probation Maricopa County Total
Ever Currently Ever Currently Ever Currently Ever Currently n = 603 1,044 194 22 567 185 1,364 1,251
% % % % % % % % Sex
Male 74.3 76.9 79.9 77.3 77.2 74.6 76.3 76.6 Female 25.7 23.1 20.1 22.7 22.8 25.4 23.7 23.4
Age category *
15-20 10.0 8.9 17.1 4.8 6.5 12.5 9.5 9.4 21-25 26.9 23.3 24.4 33.3 21.4 25.5 24.2 23.8 26-30 18.1 18.1 17.6 23.8 19.4 22.3 18.6 18.8 31-35 13.8 14.5 11.4 9.5 14.1 9.2 13.6 13.6 36 & older 31.3 35.2 29.5 28.6 38.5 30.4 34.1 34.4 Mean * 31.89 32.82 31.16 31.36 33.34 31.22 32.39 32.56
Race/ethnicity * †
White 35.9 38.3 45.1 36.4 42.3 48.1 39.9 39.7 Black 9.3 10.3 10.9 22.7 11.5 6.5 10.4 9.9 Hispanic 39.9 35.6 23.8 18.2 29.3 24.9 33.2 33.7 Native American 7.5 8.2 11.9 18.2 7.9 8.1 8.3 8.3 Other 7.5 7.7 8.3 4.5 9.0 12.4 8.2 8.3
US Citizenship or Current Legal Status * †
Illegal 12.6 7.9 2.1 4.5 1.2 1.1 6.3 6.8 Legal (visa, etc.) 3.7 2.7 1.0 0.0 1.8 2.2 2.5 2.6 US Citizen 83.7 89.4 96.9 95.5 97.0 96.8 91.1 90.6
Highest educational attainment
Less than HS degree 29.4 34.9 28.5 22.7 33.5 31.3 31.0 34.1 HS Degree or GED 34.1 35.4 39.4 40.9 34.6 31.3 35.1 34.9 POST High school education 36.5 29.8 32.1 36.4 31.9 37.4 33.9 31.0
* t test or Chi-square significant at p < .05 for "Ever", † for "Currently".
9
Exhibit 2 (cont): Characteristics of the Arrestee Population by Probation Status
No Probation Other Probation Maricopa County Total
Ever Currently Ever Currently Ever Currently Ever Currently n = 585 1,015 187 21 555 182 1,327 1,218
% % % % % % % % Main source of income (past 30 days) * †
Working full time 42.1 36.7 30.5 28.6 27.6 26.9 34.4 35.1 Working part time 17.8 18.0 15.5 23.8 19.3 16.5 18.1 17.9 Welfare, SSI, or AFDC 8.9 9.5 11.8 9.5 9.5 13.2 9.6 10.0 Family or other legal sources 10.1 14.6 17.6 0.0 20.7 22.5 15.6 15.5 Prostitution or drug sales 4.4 5.6 8.0 0.0 7.6 6.0 6.3 5.6 Other illegal sources 3.1 4.5 8.6 28.6 6.1 6.6 5.1 5.3 No income 13.7 11.1 8.0 9.5 9.2 8.2 11.0 10.7
Income in past 30 days*
Legal Income Only 87.5 84.6 75.7 63.2 79.1 81.7 82.2 83.8 Illegal Income Only 6.6 8.0 10.1 15.8 10.0 8.5 8.6 8.2 Both Legal and Illegal Income 6.0 7.4 14.2 21.1 10.8 9.8 9.2 8.0 No Income Reported 13.8 11.6 8.8 9.1 10.0 9.3 11.5 11.2
Type of residence (past 30 days)*†
Private residence 89.5 88.2 81.4 72.7 86.1 84.3 86.9 87.4 Public or group housing 0.7 0.9 2.1 0.0 1.2 2.7 1.1 1.1 Hospital or care facility 0.0 0.3 1.0 0.0 0.2 0.0 0.2 0.2 Incarcerated 0.2 0.2 1.5 9.1 0.4 0.5 0.4 0.4 Shelter 0.3 0.4 1.0 0.0 0.2 0.0 0.4 0.3 No fixed residence or on the street 9.3 10.1 12.9 18.2 12.0 12.4 10.9 10.6
Chronic Homelessness * † Yes 25.6 27.9 34.0 45.5 33.9 37.3 30.2 29.6
Children in the home Yes 43.6 42.3 44.2 73.3 39.0 40.5 41.7 42.4
* t test or Chi-square significant at p < .05 for "Ever", † for "Currently".
10
Exhibit 2 (cont): Characteristics of the Arrestee Population by Probation Status
No Probation Other Probation Maricopa County Total
Ever Currently Ever Currently Ever Currently Ever Currently n = 603 986 194 38 567 316 1,364 1,340
% % % % % % % % Medical Insurance Coverage
Yes 40.0 39.3 37.1 40.9 37.9 33.5 38.7 38.4
Veteran
Yes 5.8 5.7 4.6 0.0 5.1 4.3 5.4 5.4
Most serious offense at arrest †
Violent 19.6 20.3 24.7 27.3 16.6 16.2 19.1 19.9 Drug 27.6 27.8 29.4 27.3 26.8 25.9 27.5 27.5 Property 24.1 24.6 20.6 27.3 22.0 18.4 22.8 23.7 Other 28.6 27.3 25.3 18.2 34.6 39.5 30.6 28.9
Prior arrest (past 12 months) * †
Yes 27.6 35.7 47.4 68.2 56.7 65.2 42.5 40.6
Prior incarceration (past 12 months) * †
Yes 14.4 19.1 22.7 50.0 39.1 44.3 25.8 23.4
* t test or Chi-square significant at p < .05 for "Ever", † for "Currently".
11
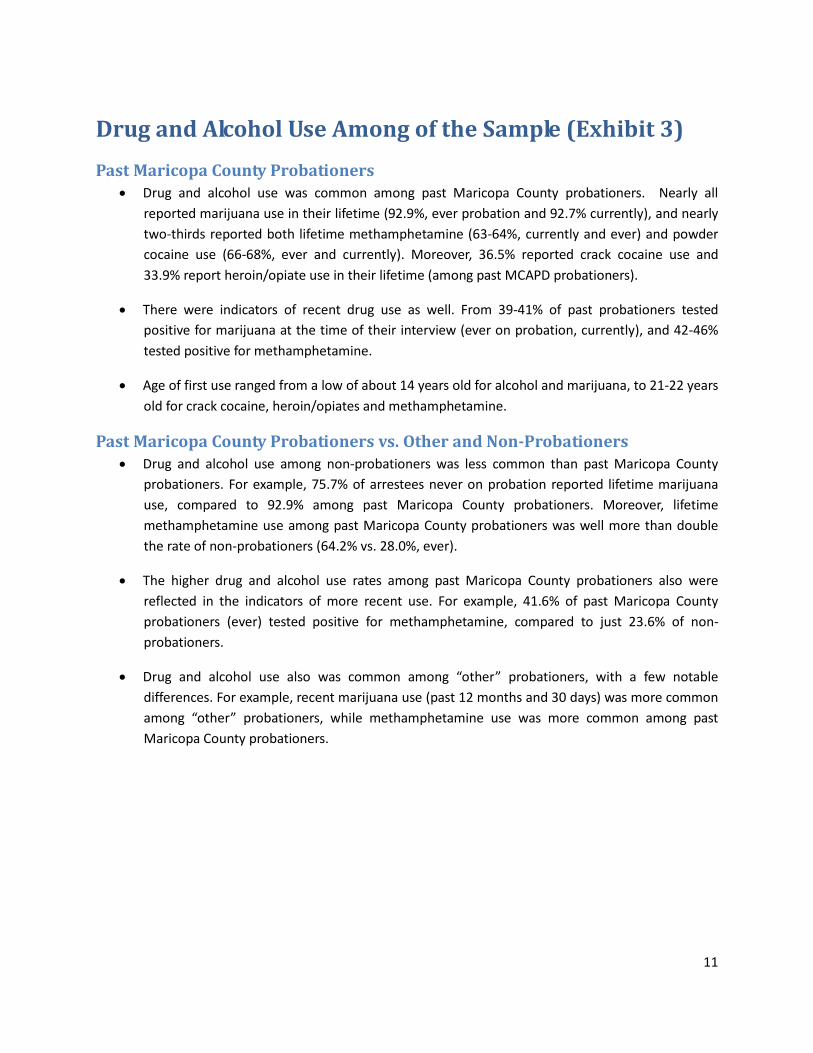
Drug and Alcohol Use Among of the Sample (Exhibit 3) Past Maricopa County Probationers
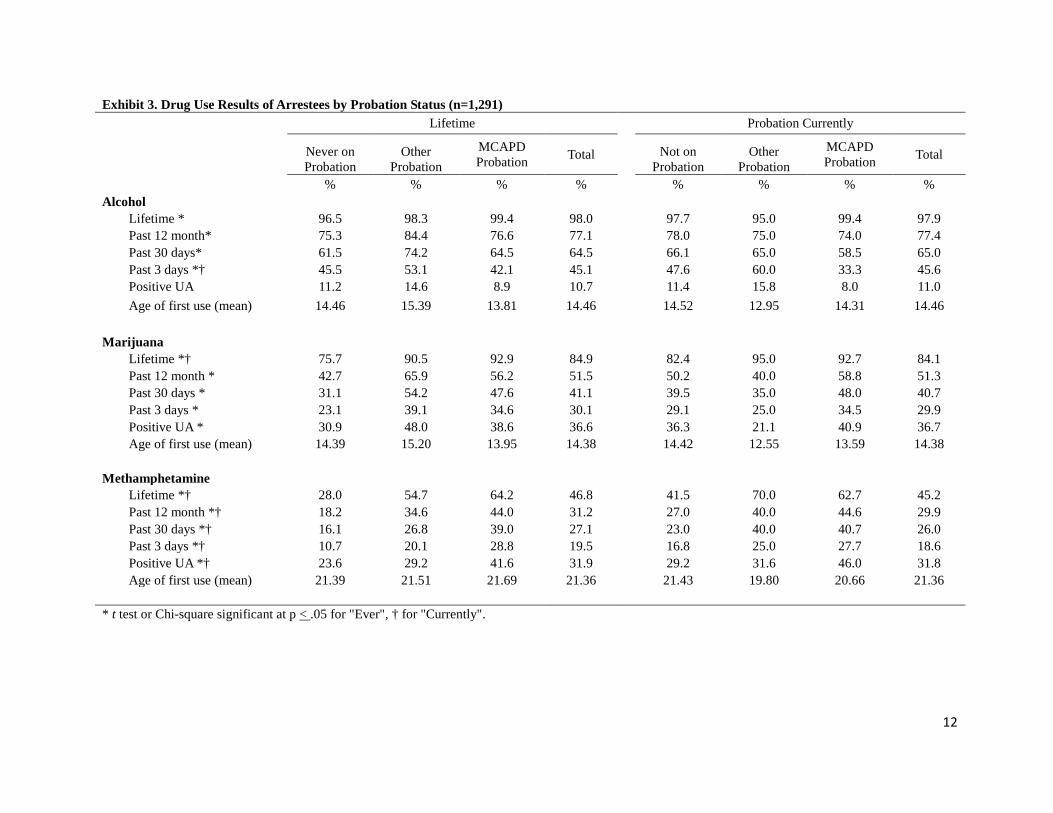
• Drug and alcohol use was common among past Maricopa County probationers. Nearly all reported marijuana use in their lifetime (92.9%, ever probation and 92.7% currently), and nearly two-thirds reported both lifetime methamphetamine (63-64%, currently and ever) and powder cocaine use (66-68%, ever and currently). Moreover, 36.5% reported crack cocaine use and 33.9% report heroin/opiate use in their lifetime (among past MCAPD probationers).
• There were indicators of recent drug use as well. From 39-41% of past probationers tested positive for marijuana at the time of their interview (ever on probation, currently), and 42-46% tested positive for methamphetamine.
• Age of first use ranged from a low of about 14 years old for alcohol and marijuana, to 21-22 years old for crack cocaine, heroin/opiates and methamphetamine.
Past Maricopa County Probationers vs. Other and Non-Probationers • Drug and alcohol use among non-probationers was less common than past Maricopa County
probationers. For example, 75.7% of arrestees never on probation reported lifetime marijuana use, compared to 92.9% among past Maricopa County probationers. Moreover, lifetime methamphetamine use among past Maricopa County probationers was well more than double the rate of non-probationers (64.2% vs. 28.0%, ever).
• The higher drug and alcohol use rates among past Maricopa County probationers also were reflected in the indicators of more recent use. For example, 41.6% of past Maricopa County probationers (ever) tested positive for methamphetamine, compared to just 23.6% of non-probationers.
• Drug and alcohol use also was common among “other” probationers, with a few notable differences. For example, recent marijuana use (past 12 months and 30 days) was more common among “other” probationers, while methamphetamine use was more common among past Maricopa County probationers.
12
Exhibit 3. Drug Use Results of Arrestees by Probation Status (n=1,291)
Lifetime Probation Currently
Never on Probation
Other Probation
MCAPD Probation Total
Not on Probation
Other Probation
MCAPD Probation Total
% % % %
% % % %
Alcohol Lifetime * 96.5 98.3 99.4 98.0
97.7 95.0 99.4 97.9
Past 12 month* 75.3 84.4 76.6 77.1
78.0 75.0 74.0 77.4 Past 30 days* 61.5 74.2 64.5 64.5
66.1 65.0 58.5 65.0
Past 3 days *† 45.5 53.1 42.1 45.1
47.6 60.0 33.3 45.6 Positive UA 11.2 14.6 8.9 10.7
11.4 15.8 8.0 11.0
Age of first use (mean) 14.46 15.39 13.81 14.46
14.52 12.95 14.31 14.46
Marijuana Lifetime *† 75.7 90.5 92.9 84.9
82.4 95.0 92.7 84.1
Past 12 month * 42.7 65.9 56.2 51.5
50.2 40.0 58.8 51.3 Past 30 days * 31.1 54.2 47.6 41.1
39.5 35.0 48.0 40.7
Past 3 days * 23.1 39.1 34.6 30.1
29.1 25.0 34.5 29.9 Positive UA * 30.9 48.0 38.6 36.6
36.3 21.1 40.9 36.7
Age of first use (mean) 14.39 15.20 13.95 14.38
14.42 12.55 13.59 14.38
Methamphetamine Lifetime *† 28.0 54.7 64.2 46.8
41.5 70.0 62.7 45.2
Past 12 month *† 18.2 34.6 44.0 31.2
27.0 40.0 44.6 29.9 Past 30 days *† 16.1 26.8 39.0 27.1
23.0 40.0 40.7 26.0
Past 3 days *† 10.7 20.1 28.8 19.5
16.8 25.0 27.7 18.6 Positive UA *† 23.6 29.2 41.6 31.9
29.2 31.6 46.0 31.8
Age of first use (mean) 21.39 21.51 21.69 21.36
21.43 19.80 20.66 21.36 * t test or Chi-square significant at p < .05 for "Ever", † for "Currently".
13
Exhibit 3 (cont.). Drug Use Results of Arrestees by Probation Status (n=1,291)
Lifetime Probation Currently
Never on Probation
Other Probation
MCAPD Probation Total
Not on Probation
Other Probation
MCAPD Probation Total
% % % %
% % % %
Crack Lifetime* 17.7 29.1 36.5 27.1
25.5 40.0 31.6 26.6
Past 12 month *† 3.5 5.0 6.7 5.1
4.1 10.0 8.5 4.8 Past 30 days* 1.4 3.4 5.6 3.4
2.7 5.0 5.1 3.1
Past 3 days* 0.9 1.7 3.2 1.9
1.6 0.0 2.8 1.8 Positive UA 5.1 6.7 8.1 6.6
6.3 10.5 9.1 6.8
Age of first use (mean) 21.48 21.64 22.00 21.48
21.51 21.56 21.75 21.48
Powder Cocaine Lifetime *† 36.4 58.7 65.9 51.8
47.0 70.0 68.4 50.6
Past 12 month*† 8.0 14.5 10.9 10.1
9.1 20.0 14.7 10.1 Past 30 days*† 3.1 7.3 6.7 5.2
4.3 15.0 8.5 5.1
Past 3 days 1.7 2.8 2.2 2.1
1.8 5.0 3.4 2.1 Positive UA 5.1 6.7 8.1 6.6
6.3 10.5 9.1 6.8
Age of first use (mean) 18.35 19.06 17.94 18.35
18.49 17.43 17.38 18.35
Heroin or other opiates Lifetime *† 12.9 31.3 33.9 24.2
20.7 45.0 33.3 23.0
Past 12 month *† 8.2 15.1 14.6 11.8
10.1 10.0 17.5 11.2 Past 30 days* † 7.2 11.7 11.8 9.7
8.5 10.0 14.7 9.4
Past 3 days *† 5.4 9.5 9.7 7.8
6.7 10.0 12.4 7.6 Positive UA*† 9.8 12.9 15.4 12.6
11.2 15.8 19.3 12.5
Age of first use (mean) 22.11 21.66 22.26 22.10
21.97 21.38 21.15 22.11 * t test or Chi-square significant at p < .05 for "Ever", † for "Currently".
14
Positive UA Results for the Sample – by Race/Ethnicity (Exhibit 4)
Past Maricopa County Probationers • Among past Maricopa County probationers, rates of drug and alcohol use differed notably by
race/ethnicity. For those who had been on Maricopa County probation in their lifetime, White arrestees (53.0%) most commonly tested positive for methamphetamine, followed by marijuana (33.6%). Marijuana and cocaine use were the drugs of choice among Black past probationers (43.3% and 21.7%, respectively), while marijuana and methamphetamine use was most common among Hispanic/Latino arrestees (42.5% and 38.6%, respectively) and American Indian past probationers (41.4% and 33.3%, respectively).
Past Maricopa County Probationers vs. Other and Non-Probationers • Many of the race/ethnicity differences noted above persisted for non-probationers. For example,
methamphetamines were the most common drug among White non-probationers (36.3%), and marijuana use was frequent among Black non-probationers (52.0%).
• However, there were notable differences between non-probationers and past Maricopa County probationers in terms of positive drug tests (see lifetime columns). For example, cocaine use was much less common among Black non-probationers, compared to Black past Maricopa County probationers (8.0% v. 21.7%). Among Hispanic/Latino arrestees, methamphetamine use was much more common among past Maricopa County probationers than non-probationers (38.6% v. 17.9%, respectively).
• There are also some notable differences between “other” probationers and past Maricopa County probationers (lifetime columns). For White arrestees, methamphetamine use is less common among “other” probationers than past Maricopa County probationers (35.9% v. 53.0%). Marijuana use was more common among Hispanic “other” probationers compared to past Maricopa County probationers (54.5% v. 42.5%), and a similar pattern emerged with American Indians and methamphetamine use (“other” probationers 16.7% v. 33.3% for past Maricopa County probationers).
15
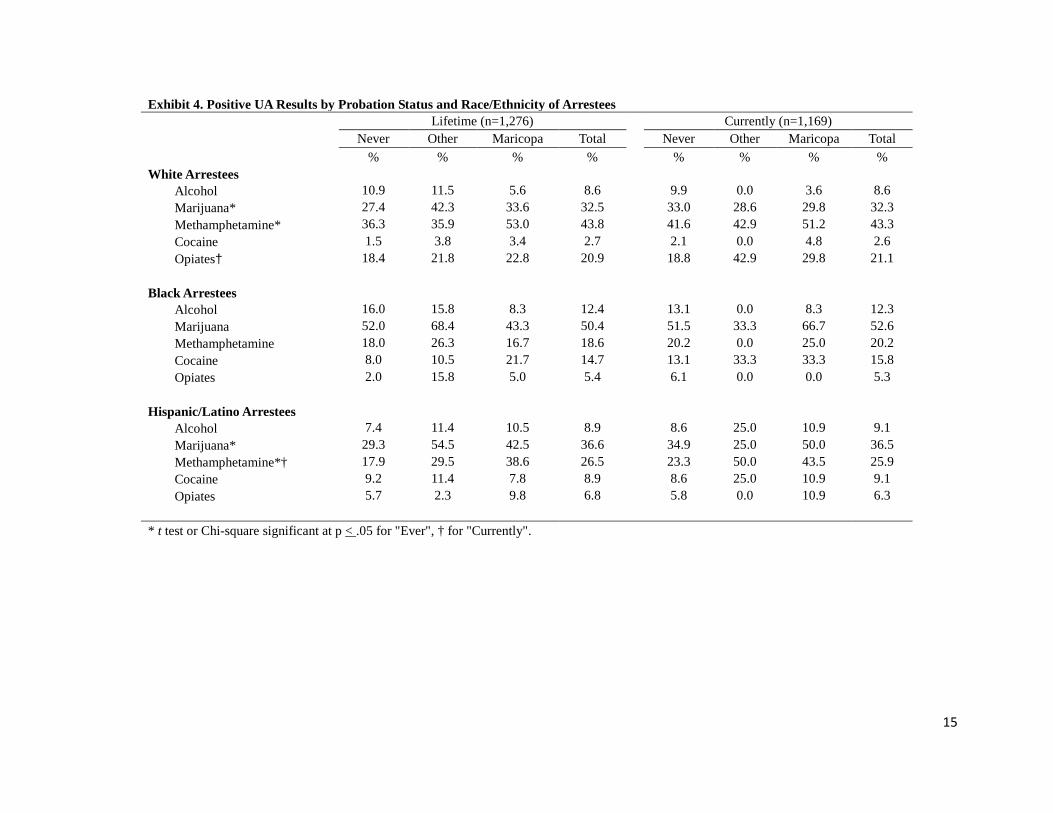
Exhibit 4. Positive UA Results by Probation Status and Race/Ethnicity of Arrestees
Lifetime (n=1,276)
Currently (n=1,169)
Never Other Maricopa Total Never Other Maricopa Total
% % % %
% % % %
White Arrestees Alcohol 10.9 11.5 5.6 8.6 9.9 0.0 3.6 8.6
Marijuana* 27.4 42.3 33.6 32.5 33.0 28.6 29.8 32.3 Methamphetamine* 36.3 35.9 53.0 43.8 41.6 42.9 51.2 43.3 Cocaine 1.5 3.8 3.4 2.7 2.1 0.0 4.8 2.6 Opiates† 18.4 21.8 22.8 20.9 18.8 42.9 29.8 21.1
Black Arrestees
Alcohol 16.0 15.8 8.3 12.4 13.1 0.0 8.3 12.3 Marijuana 52.0 68.4 43.3 50.4 51.5 33.3 66.7 52.6 Methamphetamine 18.0 26.3 16.7 18.6 20.2 0.0 25.0 20.2 Cocaine 8.0 10.5 21.7 14.7 13.1 33.3 33.3 15.8 Opiates 2.0 15.8 5.0 5.4 6.1 0.0 0.0 5.3
Hispanic/Latino Arrestees
Alcohol 7.4 11.4 10.5 8.9 8.6 25.0 10.9 9.1 Marijuana* 29.3 54.5 42.5 36.6 34.9 25.0 50.0 36.5 Methamphetamine*† 17.9 29.5 38.6 26.5 23.3 50.0 43.5 25.9 Cocaine 9.2 11.4 7.8 8.9 8.6 25.0 10.9 9.1 Opiates 5.7 2.3 9.8 6.8 5.8 0.0 10.9 6.3
* t test or Chi-square significant at p < .05 for "Ever", † for "Currently".
16
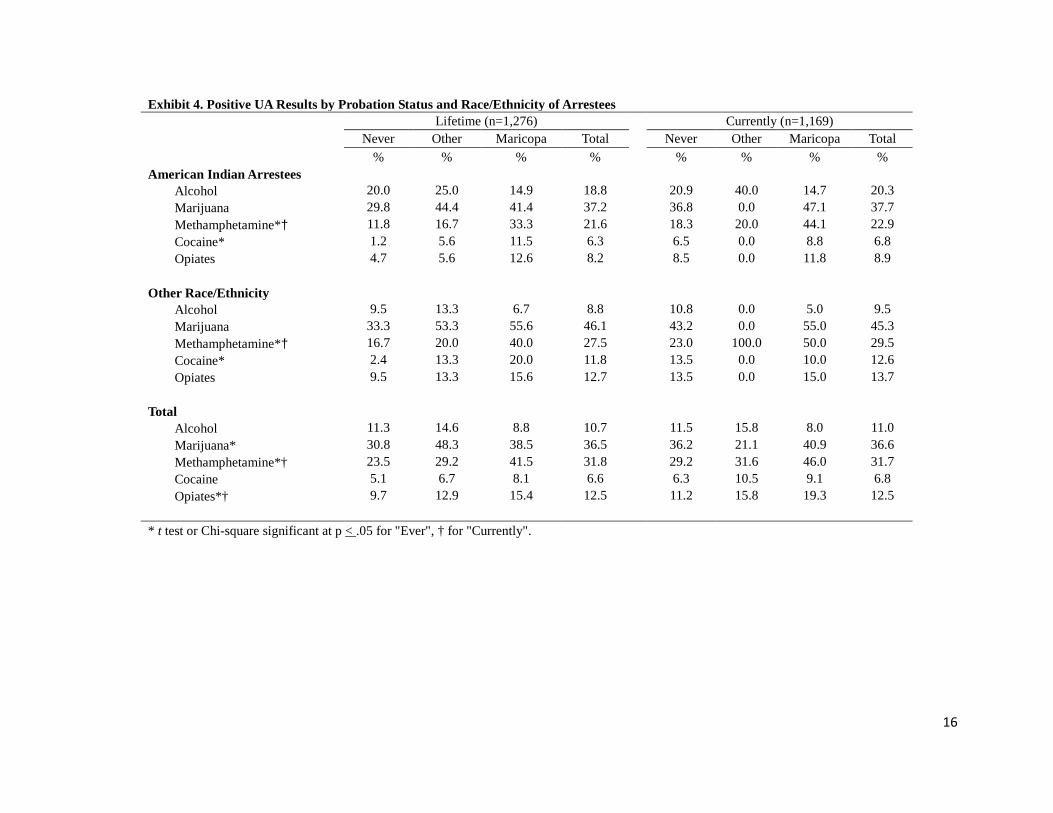
Exhibit 4. Positive UA Results by Probation Status and Race/Ethnicity of Arrestees
Lifetime (n=1,276)
Currently (n=1,169)
Never Other Maricopa Total Never Other Maricopa Total
% % % %
% % % %
American Indian Arrestees Alcohol 20.0 25.0 14.9 18.8 20.9 40.0 14.7 20.3 Marijuana 29.8 44.4 41.4 37.2 36.8 0.0 47.1 37.7 Methamphetamine*† 11.8 16.7 33.3 21.6 18.3 20.0 44.1 22.9 Cocaine* 1.2 5.6 11.5 6.3 6.5 0.0 8.8 6.8 Opiates 4.7 5.6 12.6 8.2 8.5 0.0 11.8 8.9
Other Race/Ethnicity
Alcohol 9.5 13.3 6.7 8.8 10.8 0.0 5.0 9.5 Marijuana 33.3 53.3 55.6 46.1 43.2 0.0 55.0 45.3 Methamphetamine*† 16.7 20.0 40.0 27.5 23.0 100.0 50.0 29.5 Cocaine* 2.4 13.3 20.0 11.8 13.5 0.0 10.0 12.6 Opiates 9.5 13.3 15.6 12.7 13.5 0.0 15.0 13.7
Total
Alcohol 11.3 14.6 8.8 10.7 11.5 15.8 8.0 11.0 Marijuana* 30.8 48.3 38.5 36.5 36.2 21.1 40.9 36.6 Methamphetamine*† 23.5 29.2 41.5 31.8 29.2 31.6 46.0 31.7 Cocaine 5.1 6.7 8.1 6.6 6.3 10.5 9.1 6.8 Opiates*† 9.7 12.9 15.4 12.5 11.2 15.8 19.3 12.5
* t test or Chi-square significant at p < .05 for "Ever", † for "Currently".
17
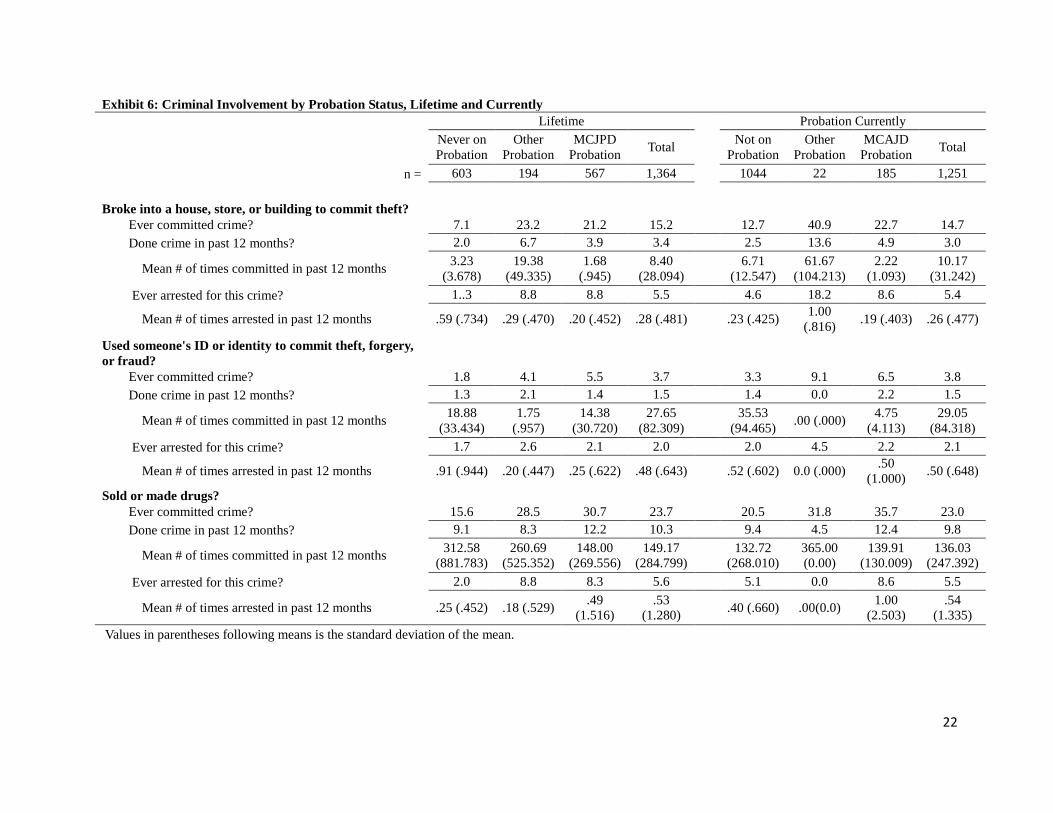
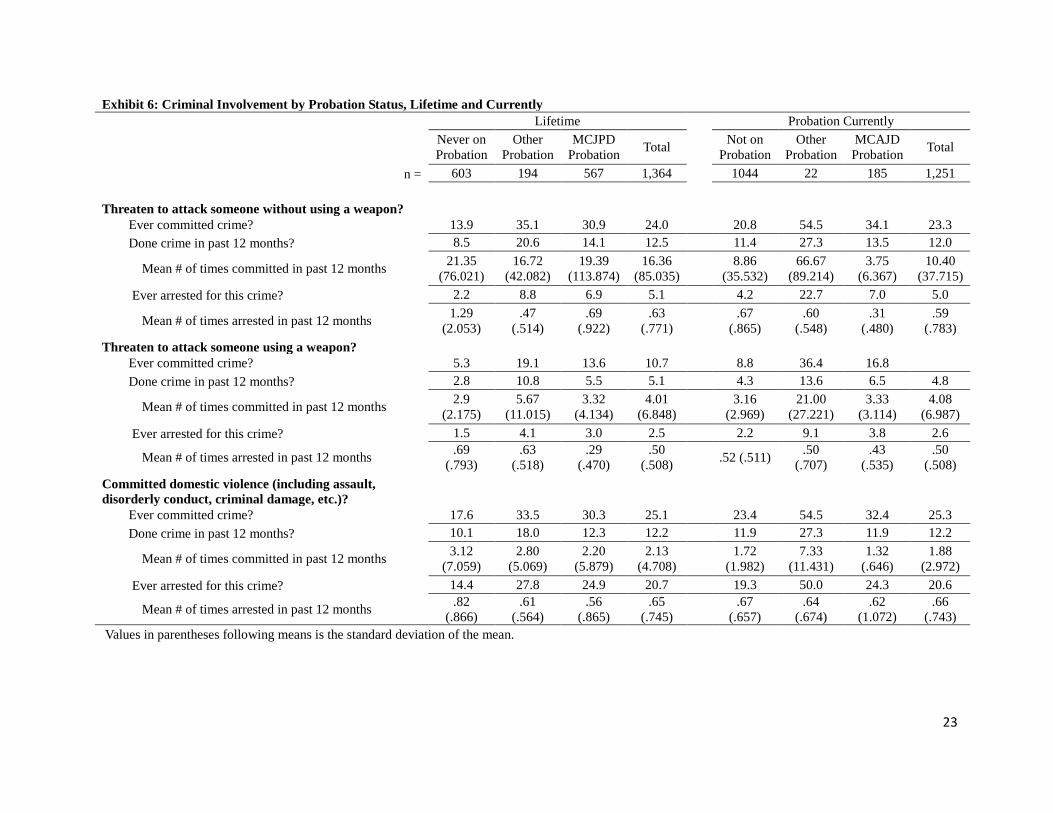
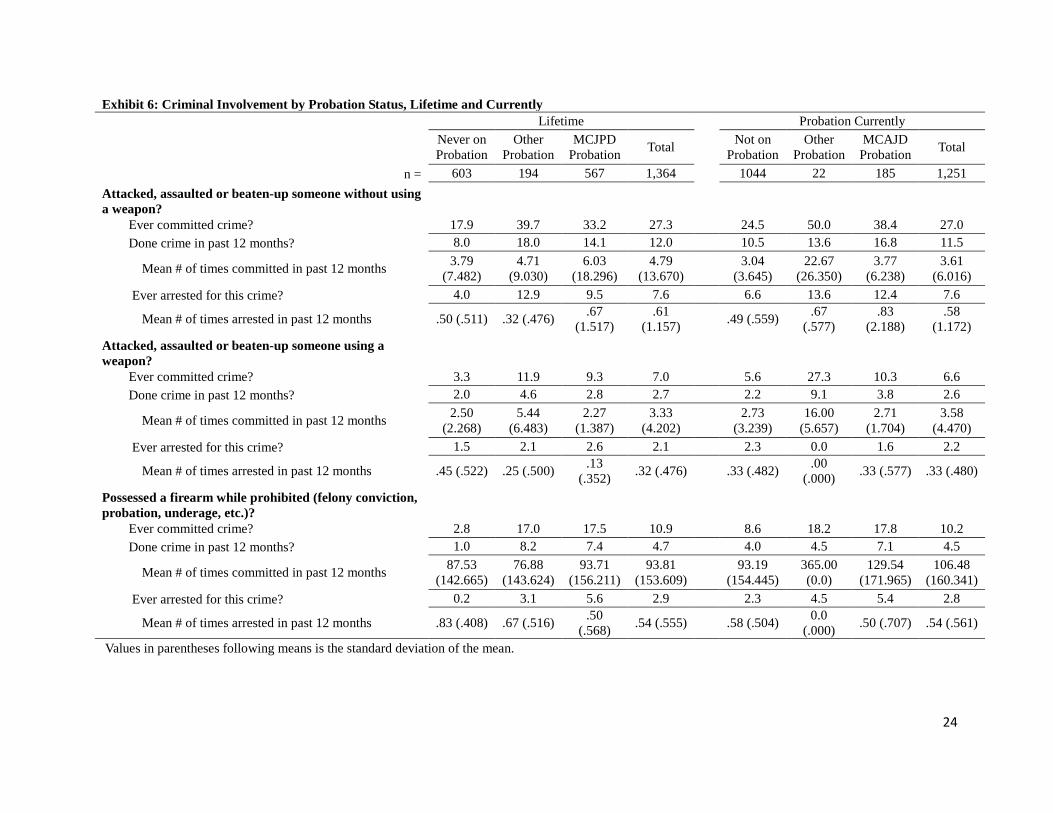
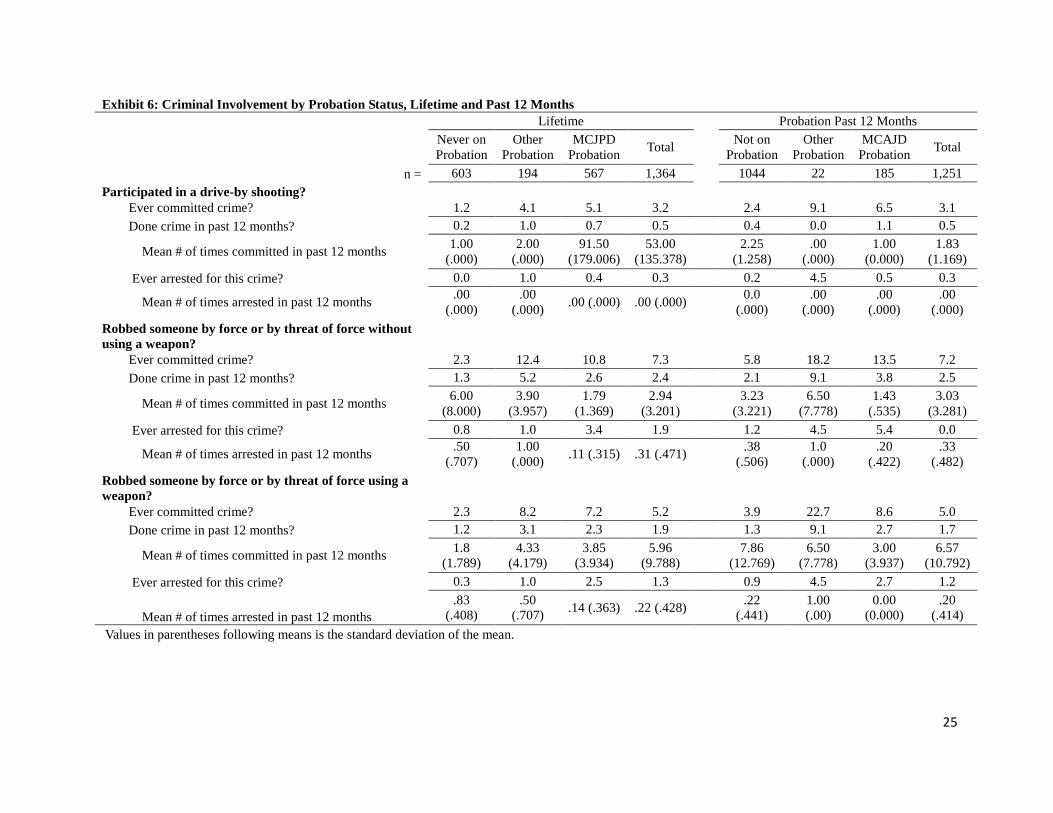
Criminal Involvement of the Sample (Exhibits 5 and 6) Past Maricopa County Probationers
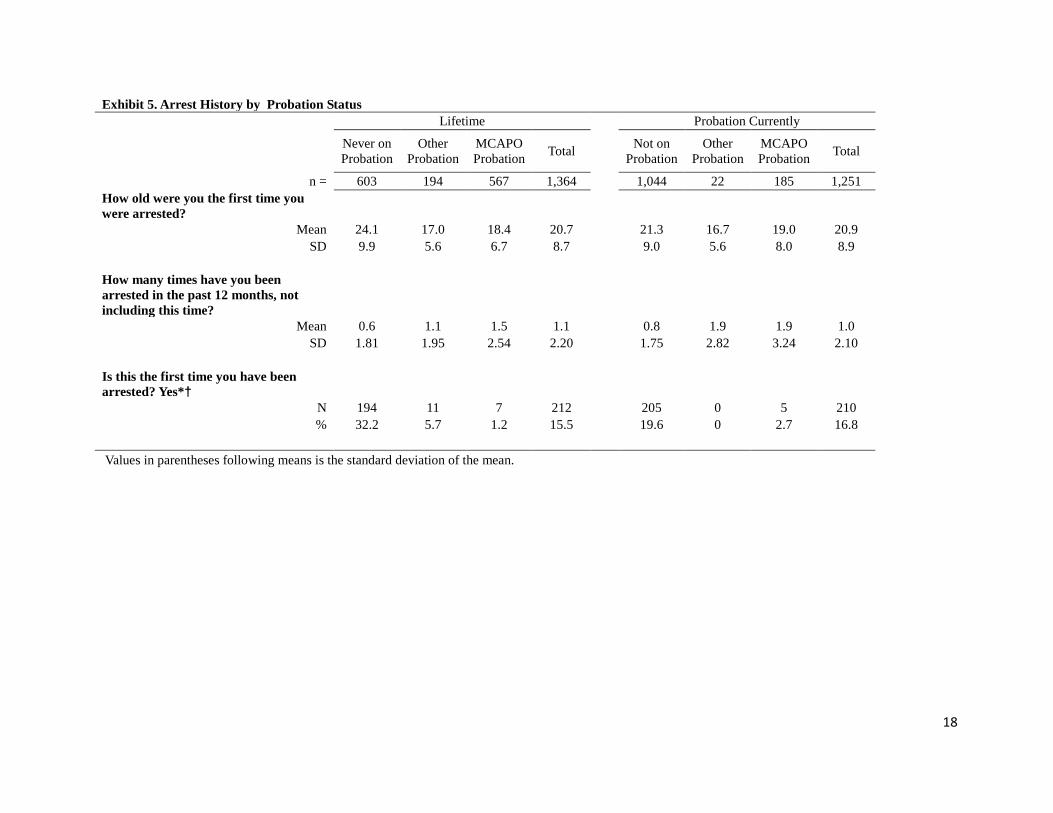
• Past Maricopa County probationers reported extensive and frequent criminal involvement. For example, at some point in their lives, 23.6% have stolen a car, 21.2% have committed a burglary, 33.2% have assaulted someone (without a weapon), and 30.7% have sold or made drugs (see the lifetime MCAPD probation columns).
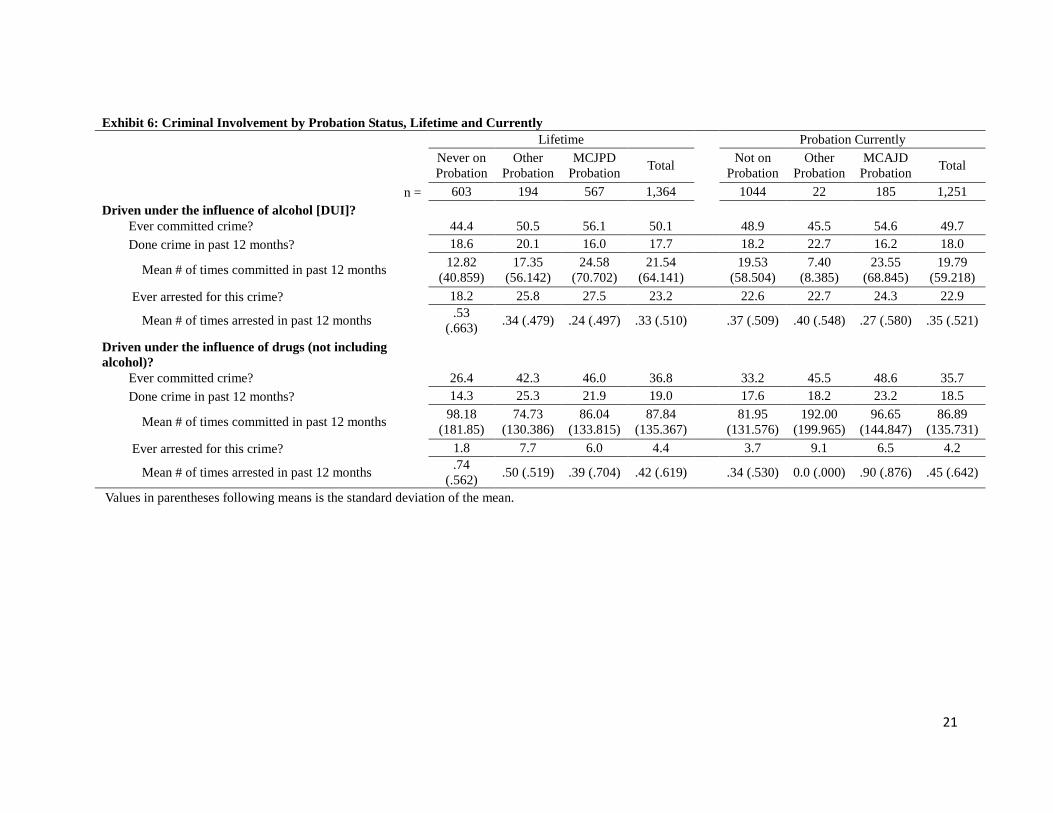
• In many cases, past Maricopa County probationers reported monthly criminal activity. For example, past probationers reported an average of 1.77 stolen vehicles in the past year, and 19.39 threatened assaults (without a weapon). Past Maricopa County probationers reported an average of 6.03 assaults (without a weapon) in the past year, and they drove under the influence of drugs on average of 86.04 times in the past year. The most frequent crime involved making or selling drugs, at an average of 148 times in the past year.
Past Maricopa County Probationers vs. Other and Non-Probationers • Past Maricopa County probationers reported significantly younger average age of first arrest,
18.4 years compared to 24.1 years among non-probationers. “Other” probationers were similar to MCAPD probationers.
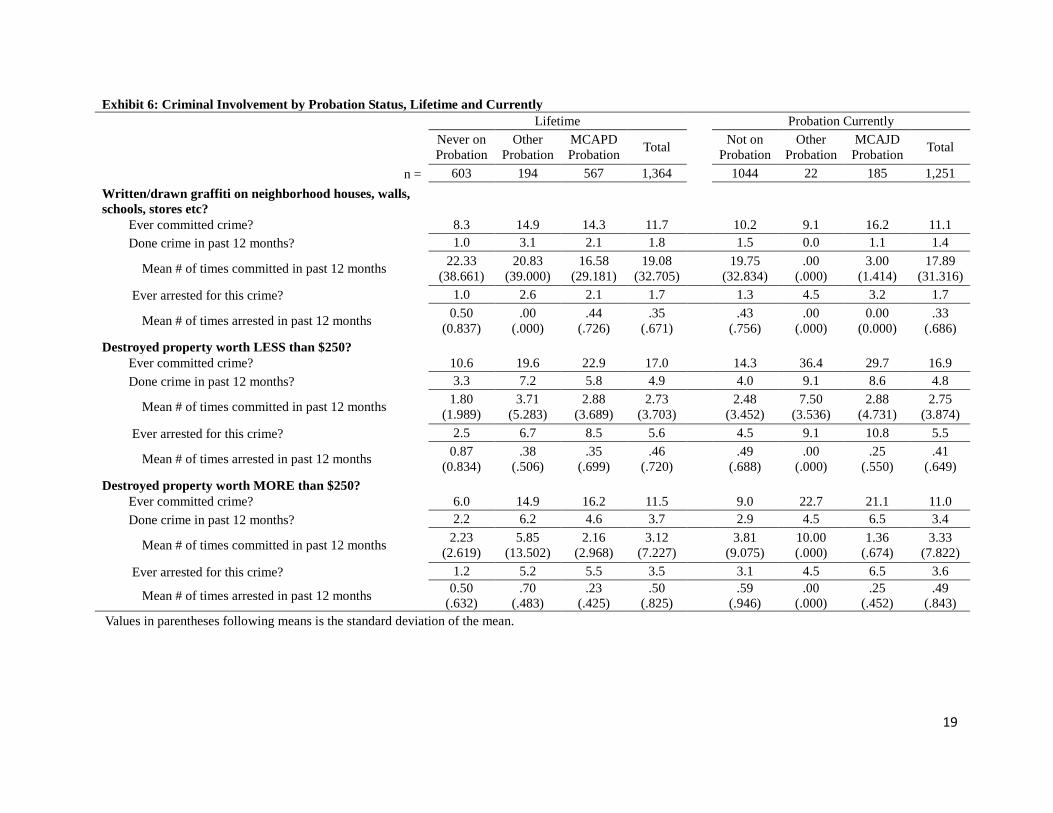
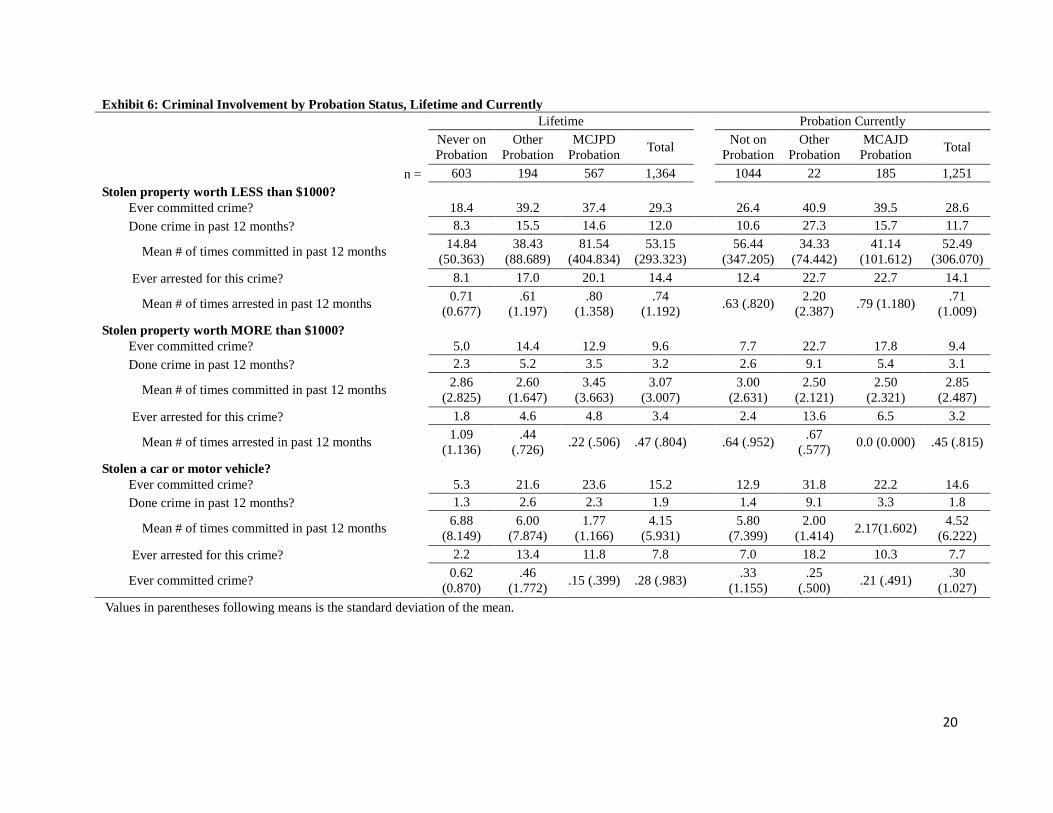
• Criminal involvement among past Maricopa County probationers was far more extensive than non-probationers. For example, past probationer rates (ever) were three times higher for stealing a car (23.6% v. 5.3%), committing a burglary (21.2% v. 7.1%), assaulted someone with a weapon (9.3% v. 3.3%) and committing an armed robbery (7.2% v. 2.3%). Past Maricopa County probationers were also about twice as likely as non-probationers to have destroyed property worth more than $250 (16.2% v. 6.0%), stolen property worth less than $1,000 (37.4% v. 18.4%) or more than $1,000 (12.9% v. 5.0%), attacked/assaulted someone (without a weapon; 33.2% v. 17.9%), and make or sell drugs (30.7% v. 15.6%). These patterns also extended to frequency of crimes committed.
• Criminal involvement among past Maricopa County probationers and “other” probationers were generally similar, with a few notable differences. For example, 35.1% of “other” probationers reported threatening to assault someone (without a weapon), compared to 30.9% of past Maricopa County probationers.
18
Exhibit 5. Arrest History by Probation Status
Lifetime Probation Currently
Never on Probation
Other Probation
MCAPO Probation Total
Not on Probation
Other Probation
MCAPO Probation Total
n = 603 194 567 1,364 1,044 22 185 1,251 How old were you the first time you were arrested?
Mean 24.1 17.0 18.4 20.7 21.3 16.7 19.0 20.9 SD 9.9 5.6 6.7 8.7 9.0 5.6 8.0 8.9
How many times have you been arrested in the past 12 months, not including this time?
Mean 0.6 1.1 1.5 1.1 0.8 1.9 1.9 1.0 SD 1.81 1.95 2.54 2.20 1.75 2.82 3.24 2.10
Is this the first time you have been arrested? Yes*†
N 194 11 7 212 205 0 5 210 % 32.2 5.7 1.2 15.5 19.6 0 2.7 16.8
Values in parentheses following means is the standard deviation of the mean.
19
Exhibit 6: Criminal Involvement by Probation Status, Lifetime and Currently
Lifetime Probation Currently Never on Probation
Other Probation
MCAPD Probation Total
Not on Probation
Other Probation
MCAJD Probation Total
n = 603 194 567 1,364 1044 22 185 1,251 Written/drawn graffiti on neighborhood houses, walls, schools, stores etc?
Ever committed crime? 8.3 14.9 14.3 11.7 10.2 9.1 16.2 11.1 Done crime in past 12 months? 1.0 3.1 2.1 1.8 1.5 0.0 1.1 1.4
Mean # of times committed in past 12 months 22.33 (38.661)
20.83 (39.000)
16.58 (29.181)
19.08 (32.705) 19.75
(32.834) .00
(.000) 3.00
(1.414) 17.89
(31.316) Ever arrested for this crime? 1.0 2.6 2.1 1.7 1.3 4.5 3.2 1.7
Mean # of times arrested in past 12 months 0.50 (0.837)
.00 (.000)
.44 (.726)
.35 (.671)
.43 (.756)
.00 (.000)
0.00 (0.000)
.33 (.686)
Destroyed property worth LESS than $250? Ever committed crime? 10.6 19.6 22.9 17.0 14.3 36.4 29.7 16.9 Done crime in past 12 months? 3.3 7.2 5.8 4.9 4.0 9.1 8.6 4.8
Mean # of times committed in past 12 months 1.80 (1.989)
3.71 (5.283)
2.88 (3.689)
2.73 (3.703) 2.48
(3.452) 7.50
(3.536) 2.88
(4.731) 2.75
(3.874) Ever arrested for this crime? 2.5 6.7 8.5 5.6 4.5 9.1 10.8 5.5
Mean # of times arrested in past 12 months 0.87 (0.834)
.38 (.506)
.35 (.699)
.46 (.720)
.49 (.688)
.00 (.000)
.25 (.550)
.41 (.649)
Destroyed property worth MORE than $250? Ever committed crime? 6.0 14.9 16.2 11.5 9.0 22.7 21.1 11.0 Done crime in past 12 months? 2.2 6.2 4.6 3.7 2.9 4.5 6.5 3.4
Mean # of times committed in past 12 months 2.23 (2.619)
5.85 (13.502)
2.16 (2.968)
3.12 (7.227) 3.81
(9.075) 10.00 (.000)
1.36 (.674)
3.33 (7.822)
Ever arrested for this crime? 1.2 5.2 5.5 3.5 3.1 4.5 6.5 3.6
Mean # of times arrested in past 12 months 0.50 (.632)
.70 (.483)
.23 (.425)
.50 (.825)
.59 (.946)
.00 (.000)
.25 (.452)
.49 (.843)
Values in parentheses following means is the standard deviation of the mean.
20
Exhibit 6: Criminal Involvement by Probation Status, Lifetime and Currently
Lifetime Probation Currently Never on Probation
Other Probation
MCJPD Probation Total
Not on Probation
Other Probation
MCAJD Probation Total
n = 603 194 567 1,364 1044 22 185 1,251 Stolen property worth LESS than $1000?
Ever committed crime? 18.4 39.2 37.4 29.3 26.4 40.9 39.5 28.6 Done crime in past 12 months? 8.3 15.5 14.6 12.0 10.6 27.3 15.7 11.7
Mean # of times committed in past 12 months 14.84 (50.363)
38.43 (88.689)
81.54 (404.834)
53.15 (293.323) 56.44
(347.205) 34.33
(74.442) 41.14
(101.612) 52.49
(306.070) Ever arrested for this crime? 8.1 17.0 20.1 14.4 12.4 22.7 22.7 14.1
Mean # of times arrested in past 12 months 0.71 (0.677)
.61 (1.197)
.80 (1.358)
.74 (1.192) .63 (.820) 2.20
(2.387) .79 (1.180) .71 (1.009)
Stolen property worth MORE than $1000? Ever committed crime? 5.0 14.4 12.9 9.6 7.7 22.7 17.8 9.4 Done crime in past 12 months? 2.3 5.2 3.5 3.2 2.6 9.1 5.4 3.1
Mean # of times committed in past 12 months 2.86 (2.825)
2.60 (1.647)
3.45 (3.663)
3.07 (3.007) 3.00
(2.631) 2.50
(2.121) 2.50
(2.321) 2.85
(2.487) Ever arrested for this crime? 1.8 4.6 4.8 3.4 2.4 13.6 6.5 3.2
Mean # of times arrested in past 12 months 1.09 (1.136)
.44 (.726) .22 (.506) .47 (.804) .64 (.952) .67
(.577) 0.0 (0.000) .45 (.815)
Stolen a car or motor vehicle? Ever committed crime? 5.3 21.6 23.6 15.2 12.9 31.8 22.2 14.6 Done crime in past 12 months? 1.3 2.6 2.3 1.9 1.4 9.1 3.3 1.8
Mean # of times committed in past 12 months 6.88 (8.149)
6.00 (7.874)
1.77 (1.166)
4.15 (5.931) 5.80
(7.399) 2.00
(1.414) 2.17(1.602) 4.52 (6.222)
Ever arrested for this crime? 2.2 13.4 11.8 7.8 7.0 18.2 10.3 7.7
Ever committed crime? 0.62 (0.870)
.46 (1.772) .15 (.399) .28 (.983)
.33 (1.155)
.25 (.500) .21 (.491) .30
(1.027) Values in parentheses following means is the standard deviation of the mean.
21
Exhibit 6: Criminal Involvement by Probation Status, Lifetime and Currently
Lifetime Probation Currently Never on Probation
Other Probation
MCJPD Probation Total
Not on Probation
Other Probation
MCAJD Probation Total
n = 603 194 567 1,364 1044 22 185 1,251 Driven under the influence of alcohol [DUI]?
Ever committed crime? 44.4 50.5 56.1 50.1 48.9 45.5 54.6 49.7 Done crime in past 12 months? 18.6 20.1 16.0 17.7 18.2 22.7 16.2 18.0
Mean # of times committed in past 12 months 12.82 (40.859)
17.35 (56.142)
24.58 (70.702)
21.54 (64.141) 19.53
(58.504) 7.40
(8.385) 23.55
(68.845) 19.79
(59.218) Ever arrested for this crime? 18.2 25.8 27.5 23.2 22.6 22.7 24.3 22.9
Mean # of times arrested in past 12 months .53 (.663) .34 (.479) .24 (.497) .33 (.510) .37 (.509) .40 (.548) .27 (.580) .35 (.521)
Driven under the influence of drugs (not including alcohol)?
Ever committed crime? 26.4 42.3 46.0 36.8 33.2 45.5 48.6 35.7 Done crime in past 12 months? 14.3 25.3 21.9 19.0 17.6 18.2 23.2 18.5
Mean # of times committed in past 12 months 98.18 (181.85)
74.73 (130.386)
86.04 (133.815)
87.84 (135.367) 81.95
(131.576) 192.00
(199.965) 96.65
(144.847) 86.89
(135.731) Ever arrested for this crime? 1.8 7.7 6.0 4.4 3.7 9.1 6.5 4.2
Mean # of times arrested in past 12 months .74 (.562) .50 (.519) .39 (.704) .42 (.619) .34 (.530) 0.0 (.000) .90 (.876) .45 (.642)
Values in parentheses following means is the standard deviation of the mean.
22
Exhibit 6: Criminal Involvement by Probation Status, Lifetime and Currently
Lifetime Probation Currently Never on Probation
Other Probation
MCJPD Probation Total
Not on Probation
Other Probation
MCAJD Probation Total
n = 603 194 567 1,364 1044 22 185 1,251
Broke into a house, store, or building to commit theft? Ever committed crime? 7.1 23.2 21.2 15.2 12.7 40.9 22.7 14.7 Done crime in past 12 months? 2.0 6.7 3.9 3.4 2.5 13.6 4.9 3.0
Mean # of times committed in past 12 months 3.23 (3.678)
19.38 (49.335)
1.68 (.945)
8.40 (28.094) 6.71
(12.547) 61.67
(104.213) 2.22
(1.093) 10.17
(31.242) Ever arrested for this crime? 1..3 8.8 8.8 5.5 4.6 18.2 8.6 5.4
Mean # of times arrested in past 12 months .59 (.734) .29 (.470) .20 (.452) .28 (.481) .23 (.425) 1.00 (.816) .19 (.403) .26 (.477)
Used someone's ID or identity to commit theft, forgery, or fraud?
Ever committed crime? 1.8 4.1 5.5 3.7 3.3 9.1 6.5 3.8 Done crime in past 12 months? 1.3 2.1 1.4 1.5 1.4 0.0 2.2 1.5
Mean # of times committed in past 12 months 18.88 (33.434)
1.75 (.957)
14.38 (30.720)
27.65 (82.309) 35.53
(94.465) .00 (.000) 4.75 (4.113)
29.05 (84.318)
Ever arrested for this crime? 1.7 2.6 2.1 2.0 2.0 4.5 2.2 2.1
Mean # of times arrested in past 12 months .91 (.944) .20 (.447) .25 (.622) .48 (.643) .52 (.602) 0.0 (.000) .50 (1.000) .50 (.648)
Sold or made drugs? Ever committed crime? 15.6 28.5 30.7 23.7 20.5 31.8 35.7 23.0 Done crime in past 12 months? 9.1 8.3 12.2 10.3 9.4 4.5 12.4 9.8
Mean # of times committed in past 12 months 312.58 (881.783)
260.69 (525.352)
148.00 (269.556)
149.17 (284.799) 132.72
(268.010) 365.00 (0.00)
139.91 (130.009)
136.03 (247.392)
Ever arrested for this crime? 2.0 8.8 8.3 5.6 5.1 0.0 8.6 5.5
Mean # of times arrested in past 12 months .25 (.452) .18 (.529) .49 (1.516)
.53 (1.280) .40 (.660) .00(0.0) 1.00
(2.503) .54
(1.335) Values in parentheses following means is the standard deviation of the mean.
23
Exhibit 6: Criminal Involvement by Probation Status, Lifetime and Currently
Lifetime Probation Currently Never on Probation
Other Probation
MCJPD Probation Total
Not on Probation
Other Probation
MCAJD Probation Total
n = 603 194 567 1,364 1044 22 185 1,251
Threaten to attack someone without using a weapon? Ever committed crime? 13.9 35.1 30.9 24.0 20.8 54.5 34.1 23.3 Done crime in past 12 months? 8.5 20.6 14.1 12.5 11.4 27.3 13.5 12.0
Mean # of times committed in past 12 months 21.35 (76.021)
16.72 (42.082)
19.39 (113.874)
16.36 (85.035) 8.86
(35.532) 66.67
(89.214) 3.75
(6.367) 10.40
(37.715) Ever arrested for this crime? 2.2 8.8 6.9 5.1 4.2 22.7 7.0 5.0
Mean # of times arrested in past 12 months 1.29 (2.053)
.47 (.514)
.69 (.922)
.63 (.771)
.67 (.865)
.60 (.548)
.31 (.480)
.59 (.783)
Threaten to attack someone using a weapon? Ever committed crime? 5.3 19.1 13.6 10.7 8.8 36.4 16.8 Done crime in past 12 months? 2.8 10.8 5.5 5.1 4.3 13.6 6.5 4.8
Mean # of times committed in past 12 months 2.9 (2.175)
5.67 (11.015)
3.32 (4.134)
4.01 (6.848) 3.16
(2.969) 21.00
(27.221) 3.33
(3.114) 4.08
(6.987) Ever arrested for this crime? 1.5 4.1 3.0 2.5 2.2 9.1 3.8 2.6
Mean # of times arrested in past 12 months .69 (.793)
.63 (.518)
.29 (.470)
.50 (.508) .52 (.511) .50
(.707) .43
(.535) .50
(.508) Committed domestic violence (including assault, disorderly conduct, criminal damage, etc.)?
Ever committed crime? 17.6 33.5 30.3 25.1 23.4 54.5 32.4 25.3 Done crime in past 12 months? 10.1 18.0 12.3 12.2 11.9 27.3 11.9 12.2
Mean # of times committed in past 12 months 3.12 (7.059)
2.80 (5.069)
2.20 (5.879)
2.13 (4.708) 1.72
(1.982) 7.33
(11.431) 1.32
(.646) 1.88
(2.972) Ever arrested for this crime? 14.4 27.8 24.9 20.7 19.3 50.0 24.3 20.6
Mean # of times arrested in past 12 months .82 (.866)
.61 (.564)
.56 (.865)
.65 (.745)
.67 (.657)
.64 (.674)
.62 (1.072)
.66 (.743)
Values in parentheses following means is the standard deviation of the mean.
24
Exhibit 6: Criminal Involvement by Probation Status, Lifetime and Currently
Lifetime Probation Currently Never on Probation
Other Probation
MCJPD Probation Total
Not on Probation
Other Probation
MCAJD Probation Total
n = 603 194 567 1,364 1044 22 185 1,251 Attacked, assaulted or beaten-up someone without using a weapon?
Ever committed crime? 17.9 39.7 33.2 27.3 24.5 50.0 38.4 27.0 Done crime in past 12 months? 8.0 18.0 14.1 12.0 10.5 13.6 16.8 11.5
Mean # of times committed in past 12 months 3.79 (7.482)
4.71 (9.030)
6.03 (18.296)
4.79 (13.670) 3.04
(3.645) 22.67
(26.350) 3.77
(6.238) 3.61
(6.016) Ever arrested for this crime? 4.0 12.9 9.5 7.6 6.6 13.6 12.4 7.6
Mean # of times arrested in past 12 months .50 (.511) .32 (.476) .67 (1.517)
.61 (1.157) .49 (.559) .67
(.577) .83
(2.188) .58
(1.172) Attacked, assaulted or beaten-up someone using a weapon?
Ever committed crime? 3.3 11.9 9.3 7.0 5.6 27.3 10.3 6.6 Done crime in past 12 months? 2.0 4.6 2.8 2.7 2.2 9.1 3.8 2.6
Mean # of times committed in past 12 months 2.50 (2.268)
5.44 (6.483)
2.27 (1.387)
3.33 (4.202) 2.73
(3.239) 16.00
(5.657) 2.71
(1.704) 3.58
(4.470) Ever arrested for this crime? 1.5 2.1 2.6 2.1 2.3 0.0 1.6 2.2
Mean # of times arrested in past 12 months .45 (.522) .25 (.500) .13 (.352) .32 (.476) .33 (.482) .00
(.000) .33 (.577) .33 (.480)
Possessed a firearm while prohibited (felony conviction, probation, underage, etc.)?
Ever committed crime? 2.8 17.0 17.5 10.9 8.6 18.2 17.8 10.2 Done crime in past 12 months? 1.0 8.2 7.4 4.7 4.0 4.5 7.1 4.5
Mean # of times committed in past 12 months 87.53 (142.665)
76.88 (143.624)
93.71 (156.211)
93.81 (153.609) 93.19
(154.445) 365.00 (0.0)
129.54 (171.965)
106.48 (160.341)
Ever arrested for this crime? 0.2 3.1 5.6 2.9 2.3 4.5 5.4 2.8
Mean # of times arrested in past 12 months .83 (.408) .67 (.516) .50 (.568) .54 (.555) .58 (.504) 0.0
(.000) .50 (.707) .54 (.561)
Values in parentheses following means is the standard deviation of the mean.
25
Exhibit 6: Criminal Involvement by Probation Status, Lifetime and Past 12 Months
Lifetime Probation Past 12 Months Never on Probation
Other Probation
MCJPD Probation Total
Not on Probation
Other Probation
MCAJD Probation Total
n = 603 194 567 1,364 1044 22 185 1,251 Participated in a drive-by shooting?
Ever committed crime? 1.2 4.1 5.1 3.2 2.4 9.1 6.5 3.1 Done crime in past 12 months? 0.2 1.0 0.7 0.5 0.4 0.0 1.1 0.5
Mean # of times committed in past 12 months 1.00 (.000)
2.00 (.000)
91.50 (179.006)
53.00 (135.378) 2.25
(1.258) .00
(.000) 1.00
(0.000) 1.83
(1.169) Ever arrested for this crime? 0.0 1.0 0.4 0.3 0.2 4.5 0.5 0.3
Mean # of times arrested in past 12 months .00 (.000)
.00 (.000) .00 (.000) .00 (.000)
0.0 (.000)
.00 (.000)
.00 (.000)
.00 (.000)
Robbed someone by force or by threat of force without using a weapon?
Ever committed crime? 2.3 12.4 10.8 7.3 5.8 18.2 13.5 7.2 Done crime in past 12 months? 1.3 5.2 2.6 2.4 2.1 9.1 3.8 2.5
Mean # of times committed in past 12 months 6.00 (8.000)
3.90 (3.957)
1.79 (1.369)
2.94 (3.201) 3.23
(3.221) 6.50
(7.778) 1.43
(.535) 3.03
(3.281) Ever arrested for this crime? 0.8 1.0 3.4 1.9 1.2 4.5 5.4 0.0
Mean # of times arrested in past 12 months .50 (.707)
1.00 (.000) .11 (.315) .31 (.471)
.38 (.506)
1.0 (.000)
.20 (.422)
.33 (.482)
Robbed someone by force or by threat of force using a weapon?
Ever committed crime? 2.3 8.2 7.2 5.2 3.9 22.7 8.6 5.0 Done crime in past 12 months? 1.2 3.1 2.3 1.9 1.3 9.1 2.7 1.7
Mean # of times committed in past 12 months 1.8 (1.789)
4.33 (4.179)
3.85 (3.934)
5.96 (9.788) 7.86
(12.769) 6.50
(7.778) 3.00
(3.937) 6.57
(10.792) Ever arrested for this crime? 0.3 1.0 2.5 1.3 0.9 4.5 2.7 1.2
Mean # of times arrested in past 12 months .83
(.408) .50
(.707) .14 (.363) .22 (.428) .22
(.441) 1.00 (.00)
0.00 (0.000)
.20 (.414)
Values in parentheses following means is the standard deviation of the mean.
26
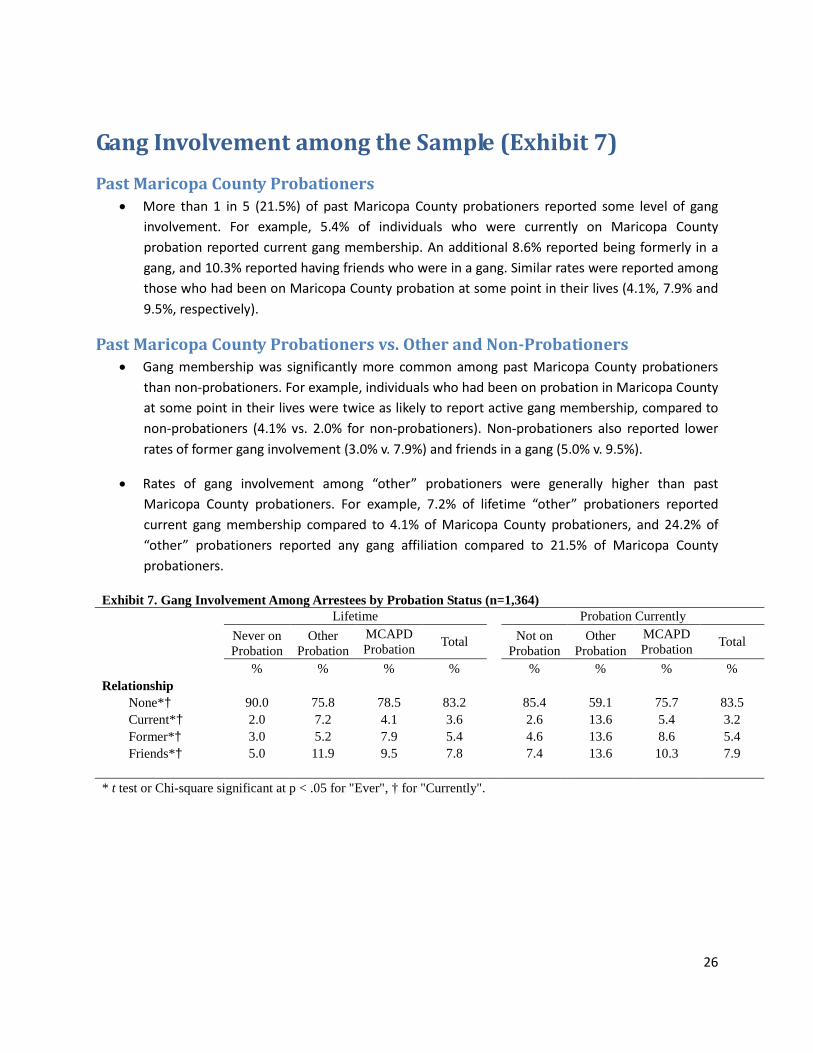
Gang Involvement among the Sample (Exhibit 7) Past Maricopa County Probationers
• More than 1 in 5 (21.5%) of past Maricopa County probationers reported some level of gang involvement. For example, 5.4% of individuals who were currently on Maricopa County probation reported current gang membership. An additional 8.6% reported being formerly in a gang, and 10.3% reported having friends who were in a gang. Similar rates were reported among those who had been on Maricopa County probation at some point in their lives (4.1%, 7.9% and 9.5%, respectively).
Past Maricopa County Probationers vs. Other and Non-Probationers • Gang membership was significantly more common among past Maricopa County probationers
than non-probationers. For example, individuals who had been on probation in Maricopa County at some point in their lives were twice as likely to report active gang membership, compared to non-probationers (4.1% vs. 2.0% for non-probationers). Non-probationers also reported lower rates of former gang involvement (3.0% v. 7.9%) and friends in a gang (5.0% v. 9.5%).
• Rates of gang involvement among “other” probationers were generally higher than past Maricopa County probationers. For example, 7.2% of lifetime “other” probationers reported current gang membership compared to 4.1% of Maricopa County probationers, and 24.2% of “other” probationers reported any gang affiliation compared to 21.5% of Maricopa County probationers.
Exhibit 7. Gang Involvement Among Arrestees by Probation Status (n=1,364)
Lifetime
Probation Currently Never on Probation
Other Probation
MCAPD Probation Total
Not on Probation
Other Probation
MCAPD Probation Total
% % % %
% % % %
Relationship None*† 90.0 75.8 78.5 83.2
85.4 59.1 75.7 83.5
Current*† 2.0 7.2 4.1 3.6
2.6 13.6 5.4 3.2 Former*† 3.0 5.2 7.9 5.4
4.6 13.6 8.6 5.4
Friends*† 5.0 11.9 9.5 7.8
7.4 13.6 10.3 7.9
* t test or Chi-square significant at p < .05 for "Ever", † for "Currently".
27
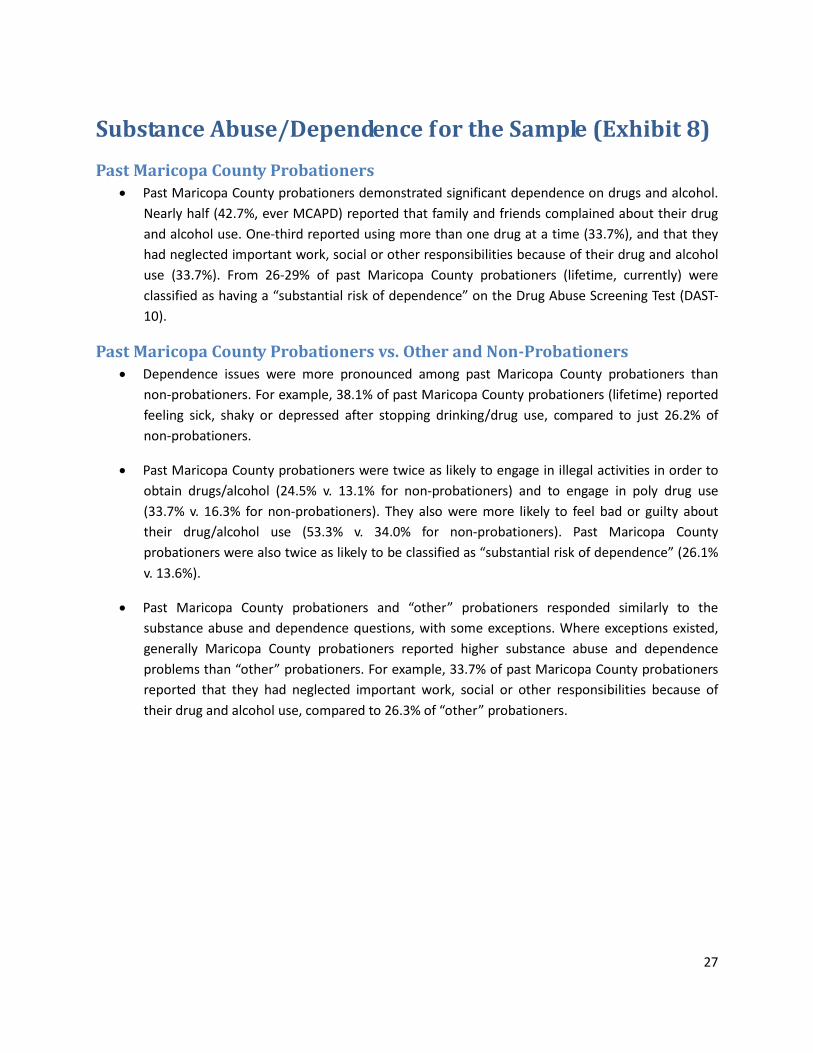
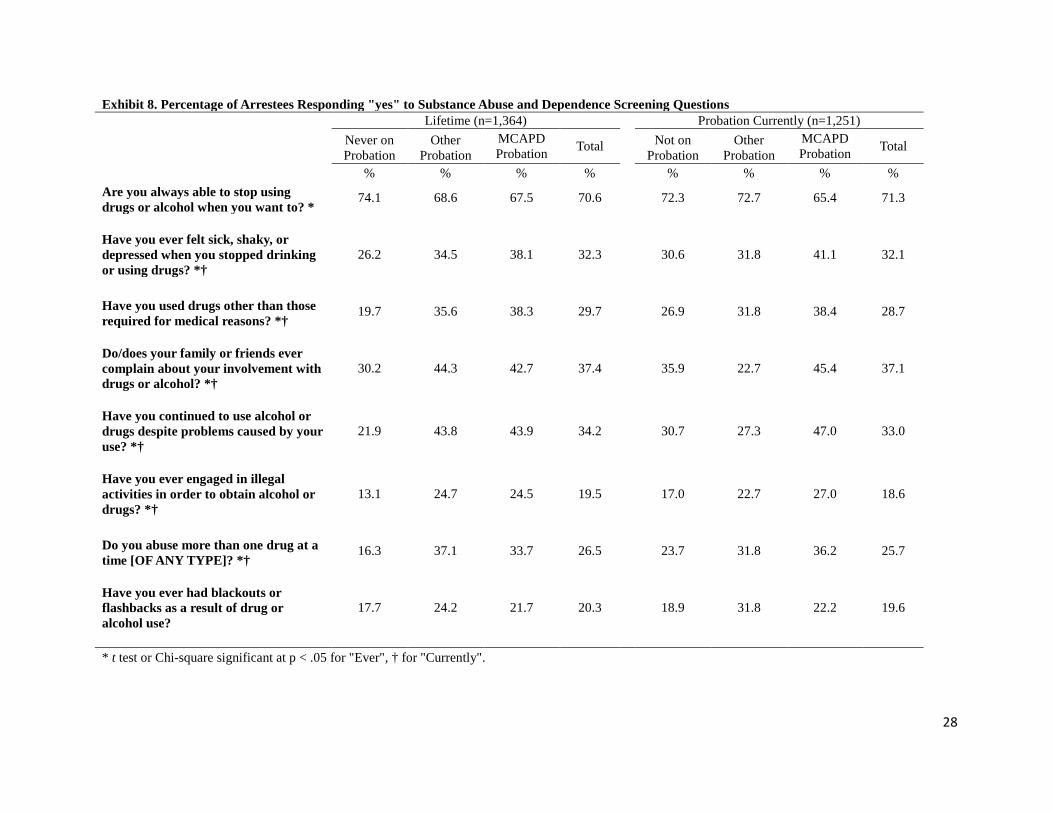
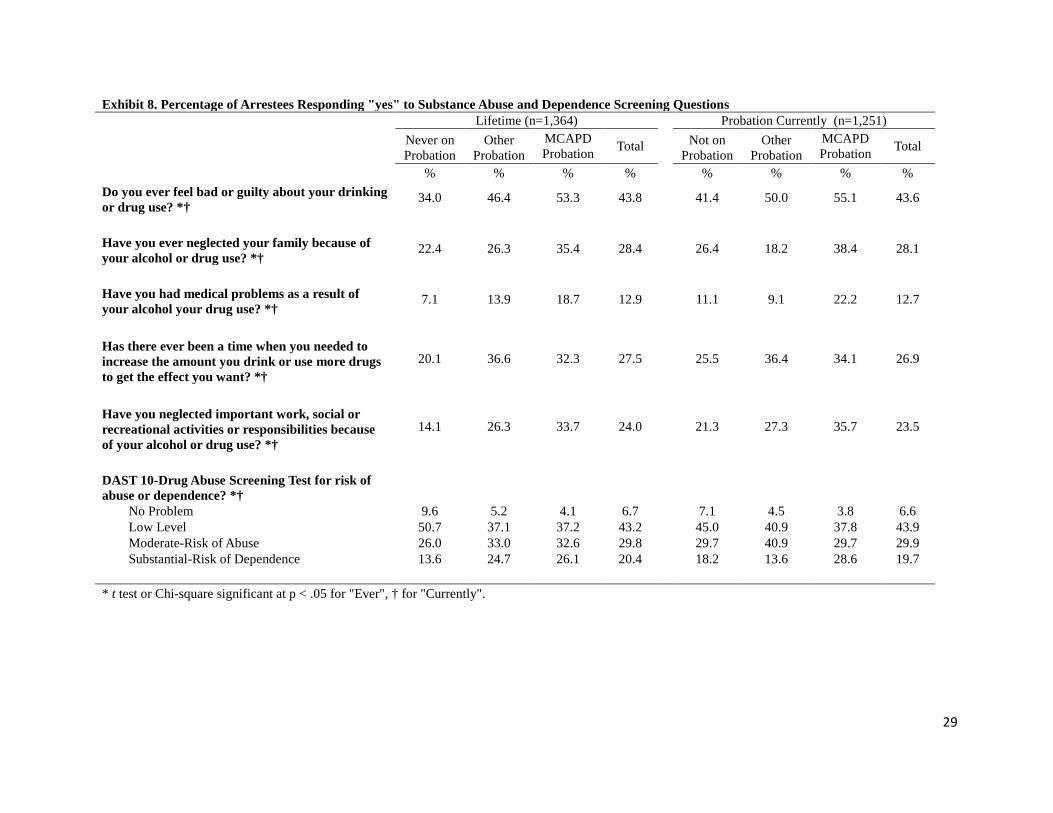
Substance Abuse/Dependence for the Sample (Exhibit 8) Past Maricopa County Probationers
• Past Maricopa County probationers demonstrated significant dependence on drugs and alcohol. Nearly half (42.7%, ever MCAPD) reported that family and friends complained about their drug and alcohol use. One-third reported using more than one drug at a time (33.7%), and that they had neglected important work, social or other responsibilities because of their drug and alcohol use (33.7%). From 26-29% of past Maricopa County probationers (lifetime, currently) were classified as having a “substantial risk of dependence” on the Drug Abuse Screening Test (DAST-10).
Past Maricopa County Probationers vs. Other and Non-Probationers • Dependence issues were more pronounced among past Maricopa County probationers than
non-probationers. For example, 38.1% of past Maricopa County probationers (lifetime) reported feeling sick, shaky or depressed after stopping drinking/drug use, compared to just 26.2% of non-probationers.
• Past Maricopa County probationers were twice as likely to engage in illegal activities in order to obtain drugs/alcohol (24.5% v. 13.1% for non-probationers) and to engage in poly drug use (33.7% v. 16.3% for non-probationers). They also were more likely to feel bad or guilty about their drug/alcohol use (53.3% v. 34.0% for non-probationers). Past Maricopa County probationers were also twice as likely to be classified as “substantial risk of dependence” (26.1% v. 13.6%).
• Past Maricopa County probationers and “other” probationers responded similarly to the substance abuse and dependence questions, with some exceptions. Where exceptions existed, generally Maricopa County probationers reported higher substance abuse and dependence problems than “other” probationers. For example, 33.7% of past Maricopa County probationers reported that they had neglected important work, social or other responsibilities because of their drug and alcohol use, compared to 26.3% of “other” probationers.
28
Exhibit 8. Percentage of Arrestees Responding "yes" to Substance Abuse and Dependence Screening Questions
Lifetime (n=1,364)
Probation Currently (n=1,251) Never on Probation
Other Probation
MCAPD Probation Total
Not on Probation
Other Probation
MCAPD Probation Total
% % % %
% % % %
Are you always able to stop using drugs or alcohol when you want to? *
74.1 68.6 67.5 70.6 72.3 72.7 65.4 71.3
Have you ever felt sick, shaky, or depressed when you stopped drinking or using drugs? *†
26.2 34.5 38.1 32.3 30.6 31.8 41.1 32.1
Have you used drugs other than those required for medical reasons? *†
19.7 35.6 38.3 29.7 26.9 31.8 38.4 28.7
Do/does your family or friends ever complain about your involvement with drugs or alcohol? *†
30.2 44.3 42.7 37.4 35.9 22.7 45.4 37.1
Have you continued to use alcohol or drugs despite problems caused by your use? *†
21.9 43.8 43.9 34.2 30.7 27.3 47.0 33.0
Have you ever engaged in illegal activities in order to obtain alcohol or drugs? *†
13.1 24.7 24.5 19.5 17.0 22.7 27.0 18.6
Do you abuse more than one drug at a time [OF ANY TYPE]? *†
16.3 37.1 33.7 26.5 23.7 31.8 36.2 25.7
Have you ever had blackouts or flashbacks as a result of drug or alcohol use?
17.7 24.2 21.7 20.3 18.9 31.8 22.2 19.6
* t test or Chi-square significant at p < .05 for "Ever", † for "Currently".
29
Exhibit 8. Percentage of Arrestees Responding "yes" to Substance Abuse and Dependence Screening Questions
Lifetime (n=1,364)
Probation Currently (n=1,251) Never on Probation
Other Probation
MCAPD Probation Total
Not on Probation
Other Probation
MCAPD Probation Total
% % % %
% % % %
Do you ever feel bad or guilty about your drinking or drug use? *†
34.0 46.4 53.3 43.8 41.4 50.0 55.1 43.6
Have you ever neglected your family because of your alcohol or drug use? *†
22.4 26.3 35.4 28.4 26.4 18.2 38.4 28.1
Have you had medical problems as a result of your alcohol your drug use? *†
7.1 13.9 18.7 12.9 11.1 9.1 22.2 12.7
Has there ever been a time when you needed to increase the amount you drink or use more drugs to get the effect you want? *†
20.1 36.6 32.3 27.5 25.5 36.4 34.1 26.9
Have you neglected important work, social or recreational activities or responsibilities because of your alcohol or drug use? *†
14.1 26.3 33.7 24.0 21.3 27.3 35.7 23.5
DAST 10-Drug Abuse Screening Test for risk of abuse or dependence? *†
No Problem 9.6 5.2 4.1 6.7
7.1 4.5 3.8 6.6 Low Level 50.7 37.1 37.2 43.2
45.0 40.9 37.8 43.9
Moderate-Risk of Abuse 26.0 33.0 32.6 29.8
29.7 40.9 29.7 29.9 Substantial-Risk of Dependence 13.6 24.7 26.1 20.4
18.2 13.6 28.6 19.7
* t test or Chi-square significant at p < .05 for "Ever", † for "Currently".
30
Mental Health History for the Sample (Exhibit 9) Past Maricopa County Probationers
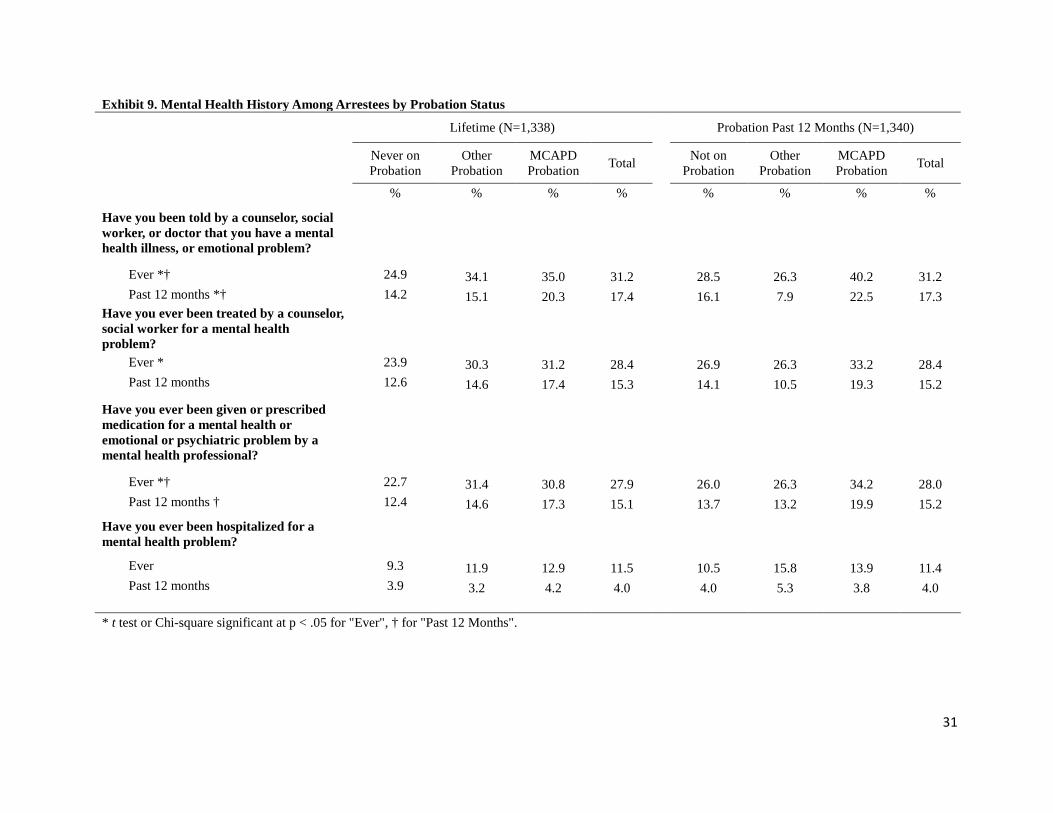
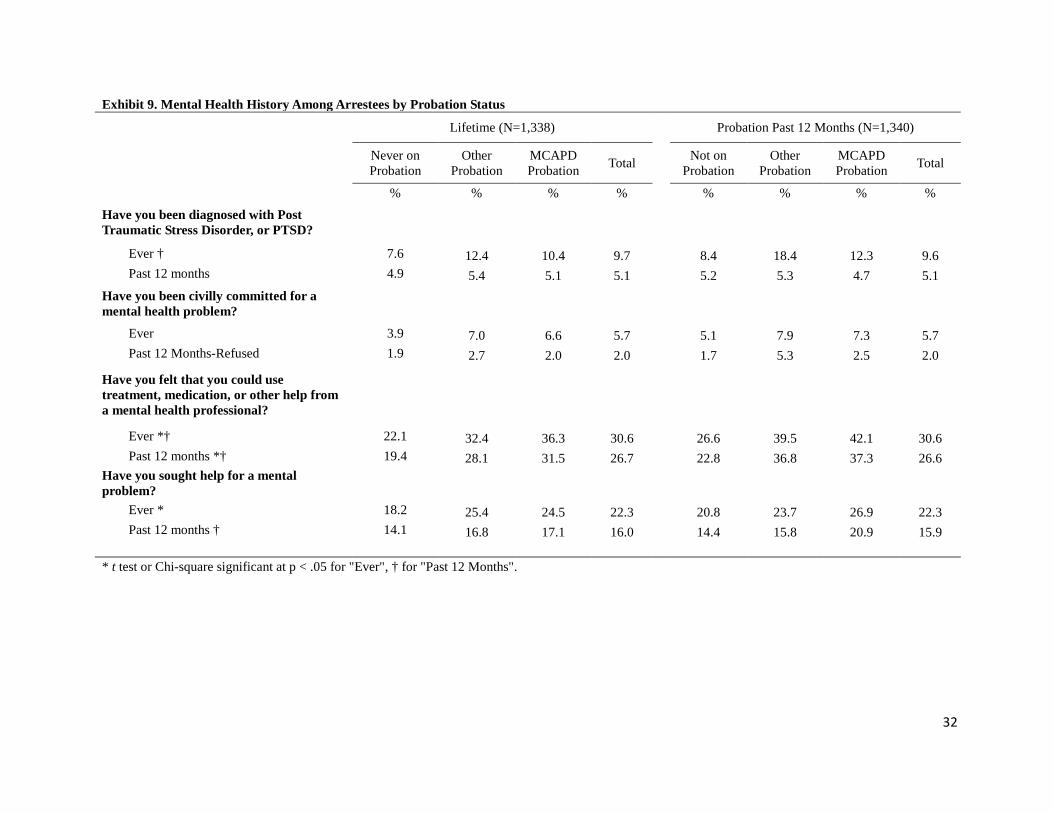
• Past Maricopa County probationers have significant histories of mental health problems. Among respondents currently on Maricopa County probation, 40.2% stated that, at some point in their lives, they had been told by a counselor, social worker or doctor that they had a mental health problem. Almost one-quarter had been given this diagnosis in the past year (22.5%). Almost one-third of past Maricopa County probationers (30.8%) had been prescribed medication for a mental illness at some point in their life, and 12.9% had been hospitalized for a mental health problem.
• Past Maricopa County probationers also expressed willingness to received help for their mental health problems. Among those currently under MCAPD supervision, 26.9% reported that they had sought help, while 42.1% stated that they believed they could use treatment (or medication) from a mental health professional.
Past Maricopa County Probationers vs. Other and Non-Probationers • Non-probationers reported fewer mental health problems than past Maricopa County
probationers. For example, 24.9% of non-probationers stated that they had been diagnosed with a mental health problem at some point in their lives, compared to 35.0% of past Maricopa County probationers (lifetime columns). Also, 23.9% of non-probationers had received mental health treatment, compared to 31.2% of past Maricopa County probationers.
• Past Maricopa County probationers and “other” probationers responded similarly to the mental health questions.
31
Exhibit 9. Mental Health History Among Arrestees by Probation Status
Lifetime (N=1,338) Probation Past 12 Months (N=1,340)
Never on Probation
Other Probation
MCAPD Probation Total
Not on Probation
Other Probation
MCAPD Probation Total
% % % %
% % % %
Have you been told by a counselor, social worker, or doctor that you have a mental health illness, or emotional problem?
Ever *† 24.9 34.1 35.0 31.2
28.5 26.3 40.2 31.2 Past 12 months *† 14.2 15.1 20.3 17.4
16.1 7.9 22.5 17.3
Have you ever been treated by a counselor, social worker for a mental health problem?
Ever * 23.9 30.3 31.2 28.4
26.9 26.3 33.2 28.4 Past 12 months 12.6 14.6 17.4 15.3
14.1 10.5 19.3 15.2
Have you ever been given or prescribed medication for a mental health or emotional or psychiatric problem by a mental health professional?
Ever *† 22.7 31.4 30.8 27.9
26.0 26.3 34.2 28.0 Past 12 months † 12.4 14.6 17.3 15.1
13.7 13.2 19.9 15.2
Have you ever been hospitalized for a mental health problem?
Ever 9.3 11.9 12.9 11.5
10.5 15.8 13.9 11.4 Past 12 months 3.9 3.2 4.2 4.0
4.0 5.3 3.8 4.0
* t test or Chi-square significant at p < .05 for "Ever", † for "Past 12 Months".
32
Exhibit 9. Mental Health History Among Arrestees by Probation Status
Lifetime (N=1,338) Probation Past 12 Months (N=1,340)
Never on Probation
Other Probation
MCAPD Probation Total
Not on Probation
Other Probation
MCAPD Probation Total
% % % %
% % % %
Have you been diagnosed with Post Traumatic Stress Disorder, or PTSD?
Ever † 7.6 12.4 10.4 9.7
8.4 18.4 12.3 9.6 Past 12 months 4.9 5.4 5.1 5.1
5.2 5.3 4.7 5.1
Have you been civilly committed for a mental health problem?
Ever 3.9 7.0 6.6 5.7
5.1 7.9 7.3 5.7 Past 12 Months-Refused 1.9 2.7 2.0 2.0
1.7 5.3 2.5 2.0
Have you felt that you could use treatment, medication, or other help from a mental health professional?
Ever *† 22.1 32.4 36.3 30.6
26.6 39.5 42.1 30.6 Past 12 months *† 19.4 28.1 31.5 26.7
22.8 36.8 37.3 26.6
Have you sought help for a mental problem?
Ever * 18.2 25.4 24.5 22.3
20.8 23.7 26.9 22.3 Past 12 months † 14.1 16.8 17.1 16.0
14.4 15.8 20.9 15.9
* t test or Chi-square significant at p < .05 for "Ever", † for "Past 12 Months".
33
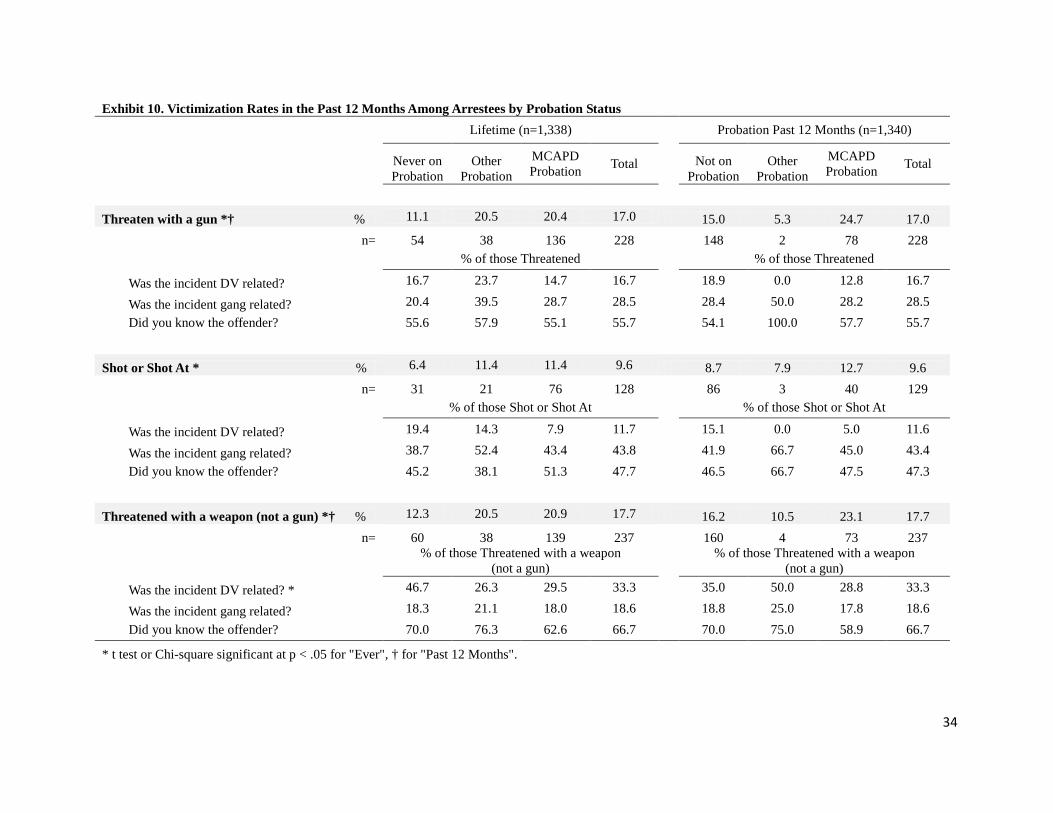
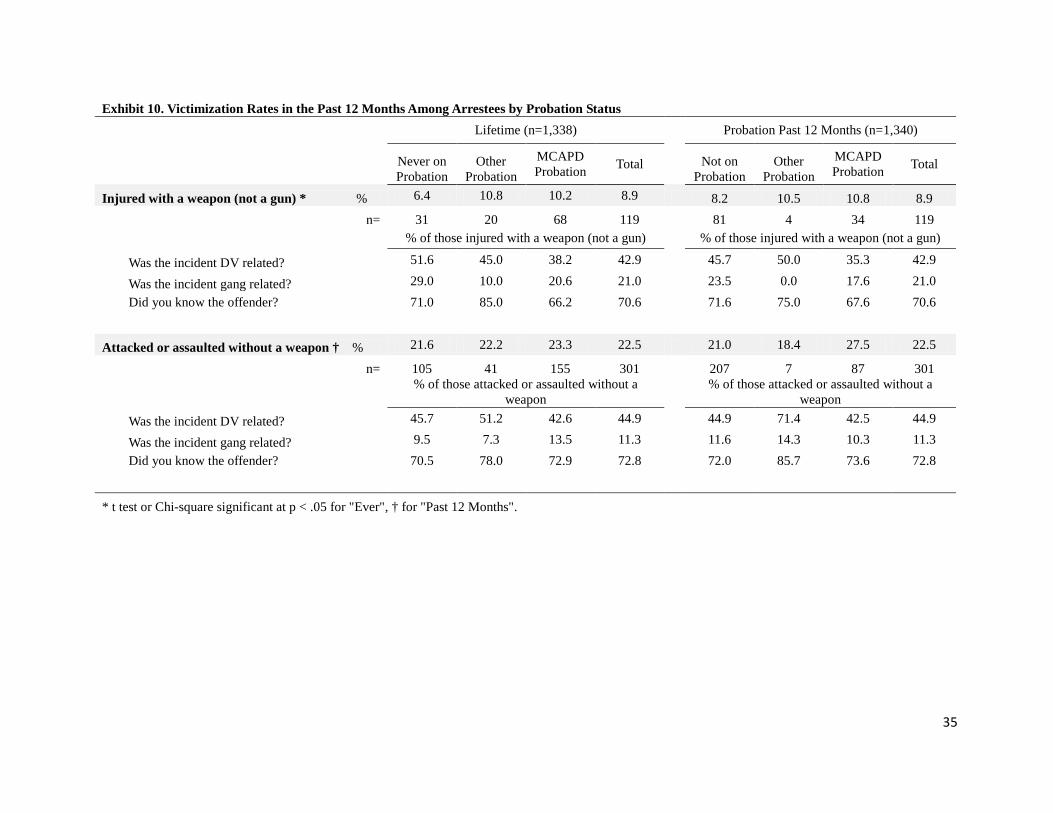
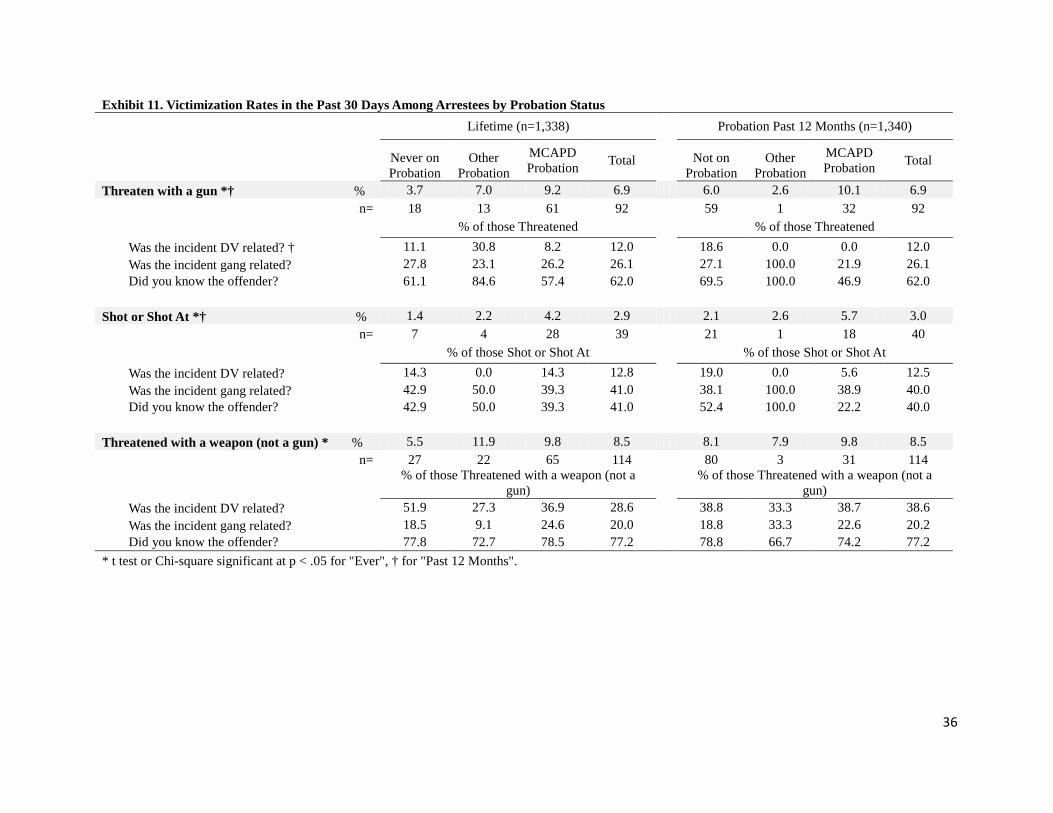
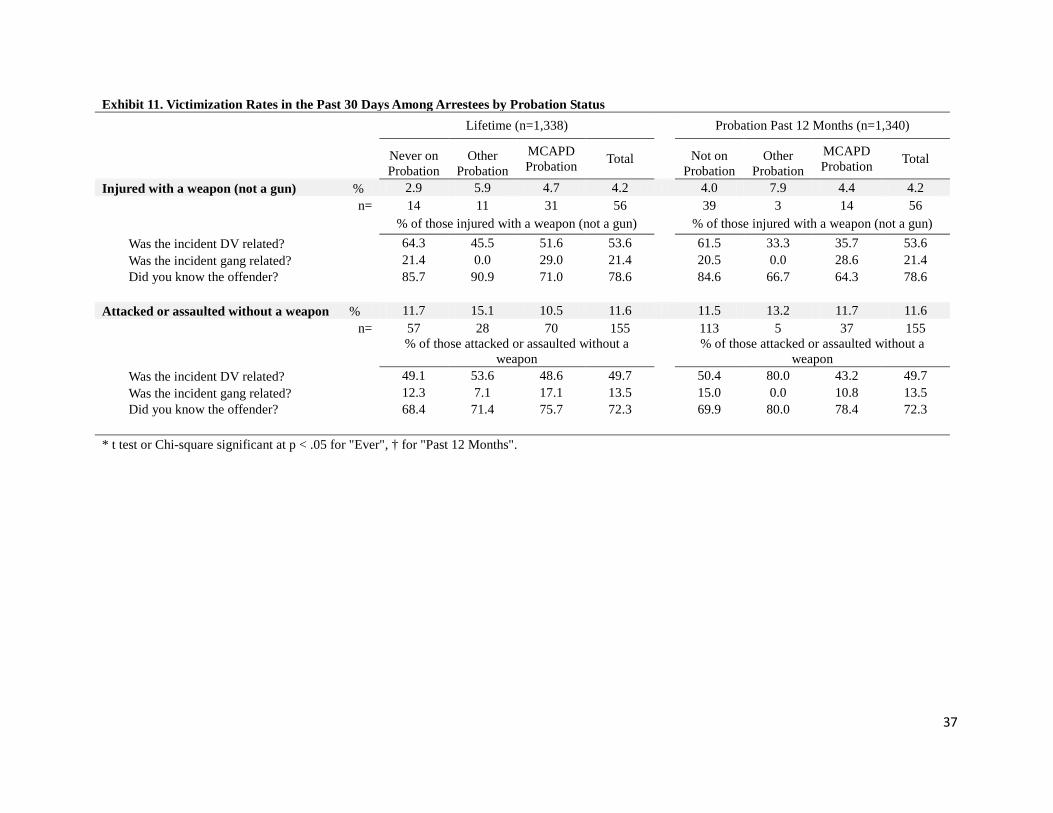
Victimization Experiences for the Sample (Exhibits 10 and 11)
Past Maricopa County Probationers • Past Maricopa County probationers have significant histories violent victimization. Nearly one-
fourth (23.3%) of lifetime Maricopa County probationers had been assaulted or attacked without a weapon in the past 12 months and 24.7% of current MCAPD probationers had been threatened with a gun in the past 12 months. See Exhibit 10.
• Victimization in the past 30 days was also significant. For example, 10.1% of current probationers reported that they had been threatened with a gun at some time in the past 30 days, and 11.7% had been assaulted or attacked (without a weapon). See Exhibit 11.
Past Maricopa County Probationers vs. Other and Non-Probationers • Lifetime non-probationers reported lower rates of 12-month victimization compared to
probationers. For example, Maricopa County probationers were about twice as likely to have been threatened with a gun (20.4% v. 11.1%) or having been shot or shot at (11.4% v. 6.4%) in the past 12 months, and to be threatened with a weapon other than a gun in the past 30 days (9.8% v. 5.5%).
• Past Maricopa County probationers and “other” probationers reported very similar rates of victimizations in the past 12 months and 30 days.
34
Exhibit 10. Victimization Rates in the Past 12 Months Among Arrestees by Probation Status
Lifetime (n=1,338) Probation Past 12 Months (n=1,340)
Never on Probation
Other Probation
MCAPD Probation Total
Not on Probation
Other Probation
MCAPD Probation Total
Threaten with a gun *† % 11.1 20.5 20.4 17.0 15.0 5.3 24.7 17.0 n= 54 38 136 228
148 2 78 228
% of those Threatened
% of those Threatened
Was the incident DV related? 16.7 23.7 14.7 16.7
18.9 0.0 12.8 16.7
Was the incident gang related? 20.4 39.5 28.7 28.5
28.4 50.0 28.2 28.5 Did you know the offender? 55.6 57.9 55.1 55.7
54.1 100.0 57.7 55.7
Shot or Shot At * % 6.4 11.4 11.4 9.6 8.7 7.9 12.7 9.6 n= 31 21 76 128
86 3 40 129
% of those Shot or Shot At
% of those Shot or Shot At
Was the incident DV related? 19.4 14.3 7.9 11.7
15.1 0.0 5.0 11.6
Was the incident gang related? 38.7 52.4 43.4 43.8
41.9 66.7 45.0 43.4 Did you know the offender? 45.2 38.1 51.3 47.7
46.5 66.7 47.5 47.3
Threatened with a weapon (not a gun) *† % 12.3 20.5 20.9 17.7 16.2 10.5 23.1 17.7
n= 60 38 139 237
160 4 73 237
% of those Threatened with a weapon (not a gun)
% of those Threatened with a weapon (not a gun)
Was the incident DV related? * 46.7 26.3 29.5 33.3
35.0 50.0 28.8 33.3
Was the incident gang related? 18.3 21.1 18.0 18.6
18.8 25.0 17.8 18.6 Did you know the offender? 70.0 76.3 62.6 66.7
70.0 75.0 58.9 66.7
* t test or Chi-square significant at p < .05 for "Ever", † for "Past 12 Months".
35
Exhibit 10. Victimization Rates in the Past 12 Months Among Arrestees by Probation Status
Lifetime (n=1,338) Probation Past 12 Months (n=1,340)
Never on Probation
Other Probation
MCAPD Probation Total
Not on Probation
Other Probation
MCAPD Probation Total
Injured with a weapon (not a gun) * % 6.4 10.8 10.2 8.9 8.2 10.5 10.8 8.9 n= 31 20 68 119
81 4 34 119
% of those injured with a weapon (not a gun)
% of those injured with a weapon (not a gun)
Was the incident DV related? 51.6 45.0 38.2 42.9
45.7 50.0 35.3 42.9
Was the incident gang related? 29.0 10.0 20.6 21.0
23.5 0.0 17.6 21.0 Did you know the offender? 71.0 85.0 66.2 70.6
71.6 75.0 67.6 70.6
Attacked or assaulted without a weapon † % 21.6 22.2 23.3 22.5 21.0 18.4 27.5 22.5
n= 105 41 155 301
207 7 87 301
% of those attacked or assaulted without a weapon
% of those attacked or assaulted without a weapon
Was the incident DV related? 45.7 51.2 42.6 44.9 44.9 71.4 42.5 44.9
Was the incident gang related? 9.5 7.3 13.5 11.3 11.6 14.3 10.3 11.3 Did you know the offender? 70.5 78.0 72.9 72.8 72.0 85.7 73.6 72.8
* t test or Chi-square significant at p < .05 for "Ever", † for "Past 12 Months".
36
Exhibit 11. Victimization Rates in the Past 30 Days Among Arrestees by Probation Status
Lifetime (n=1,338) Probation Past 12 Months (n=1,340)
Never on Probation
Other Probation
MCAPD Probation Total
Not on Probation
Other Probation
MCAPD Probation Total
Threaten with a gun *† % 3.7 7.0 9.2 6.9 6.0 2.6 10.1 6.9 n= 18 13 61 92
59 1 32 92
% of those Threatened
% of those Threatened
Was the incident DV related? † 11.1 30.8 8.2 12.0
18.6 0.0 0.0 12.0 Was the incident gang related? 27.8 23.1 26.2 26.1
27.1 100.0 21.9 26.1
Did you know the offender? 61.1 84.6 57.4 62.0
69.5 100.0 46.9 62.0
Shot or Shot At *† % 1.4 2.2 4.2 2.9 2.1 2.6 5.7 3.0 n= 7 4 28 39
21 1 18 40
% of those Shot or Shot At
% of those Shot or Shot At
Was the incident DV related? 14.3 0.0 14.3 12.8
19.0 0.0 5.6 12.5 Was the incident gang related? 42.9 50.0 39.3 41.0
38.1 100.0 38.9 40.0
Did you know the offender? 42.9 50.0 39.3 41.0
52.4 100.0 22.2 40.0
Threatened with a weapon (not a gun) * % 5.5 11.9 9.8 8.5 8.1 7.9 9.8 8.5
n= 27 22 65 114
80 3 31 114
% of those Threatened with a weapon (not a gun)
% of those Threatened with a weapon (not a gun)
Was the incident DV related? 51.9 27.3 36.9 28.6
38.8 33.3 38.7 38.6 Was the incident gang related? 18.5 9.1 24.6 20.0
18.8 33.3 22.6 20.2
Did you know the offender? 77.8 72.7 78.5 77.2
78.8 66.7 74.2 77.2 * t test or Chi-square significant at p < .05 for "Ever", † for "Past 12 Months".
37
Exhibit 11. Victimization Rates in the Past 30 Days Among Arrestees by Probation Status
Lifetime (n=1,338) Probation Past 12 Months (n=1,340)
Never on Probation
Other Probation
MCAPD Probation Total
Not on Probation
Other Probation
MCAPD Probation Total
Injured with a weapon (not a gun) % 2.9 5.9 4.7 4.2 4.0 7.9 4.4 4.2 n= 14 11 31 56
39 3 14 56
% of those injured with a weapon (not a gun)
% of those injured with a weapon (not a gun)
Was the incident DV related? 64.3 45.5 51.6 53.6
61.5 33.3 35.7 53.6 Was the incident gang related? 21.4 0.0 29.0 21.4
20.5 0.0 28.6 21.4
Did you know the offender? 85.7 90.9 71.0 78.6
84.6 66.7 64.3 78.6
Attacked or assaulted without a weapon % 11.7 15.1 10.5 11.6 11.5 13.2 11.7 11.6 n= 57 28 70 155
113 5 37 155
% of those attacked or assaulted without a weapon
% of those attacked or assaulted without a weapon
Was the incident DV related? 49.1 53.6 48.6 49.7 50.4 80.0 43.2 49.7 Was the incident gang related? 12.3 7.1 17.1 13.5 15.0 0.0 10.8 13.5 Did you know the offender? 68.4 71.4 75.7 72.3 69.9 80.0 78.4 72.3
* t test or Chi-square significant at p < .05 for "Ever", † for "Past 12 Months".
38
Firearm Possession for the Sample (Exhibits 12) Past Maricopa County Probationers
• Among current Maricopa County probationers, 17.8% reported having carried a firearm during the past 12 months. More than half of Maricopa County probationers had possessed a firearm at some time in the past (53.3% ever, 55.1% current).
Past Maricopa County Probationers vs. Other and Non-Probationers • Lifetime non-probationers reported higher rates of 12-month firearm possession compared to
probationers (21.1% v. 17.3%).
• Past Maricopa County probationers were more than twice more likely than non-probationers to report using a gun to commit a crime (8.7% v. 3.6%).
• Past Maricopa County probationers were less likely to report past 12-month gun possession (17.3% v. 25.0%), carrying a gun while a prohibited possessor (4.4% v. 6.3%), and using a gun to commit a crime (2.3% v. 3.1%) compared to “Other” probationers.
39
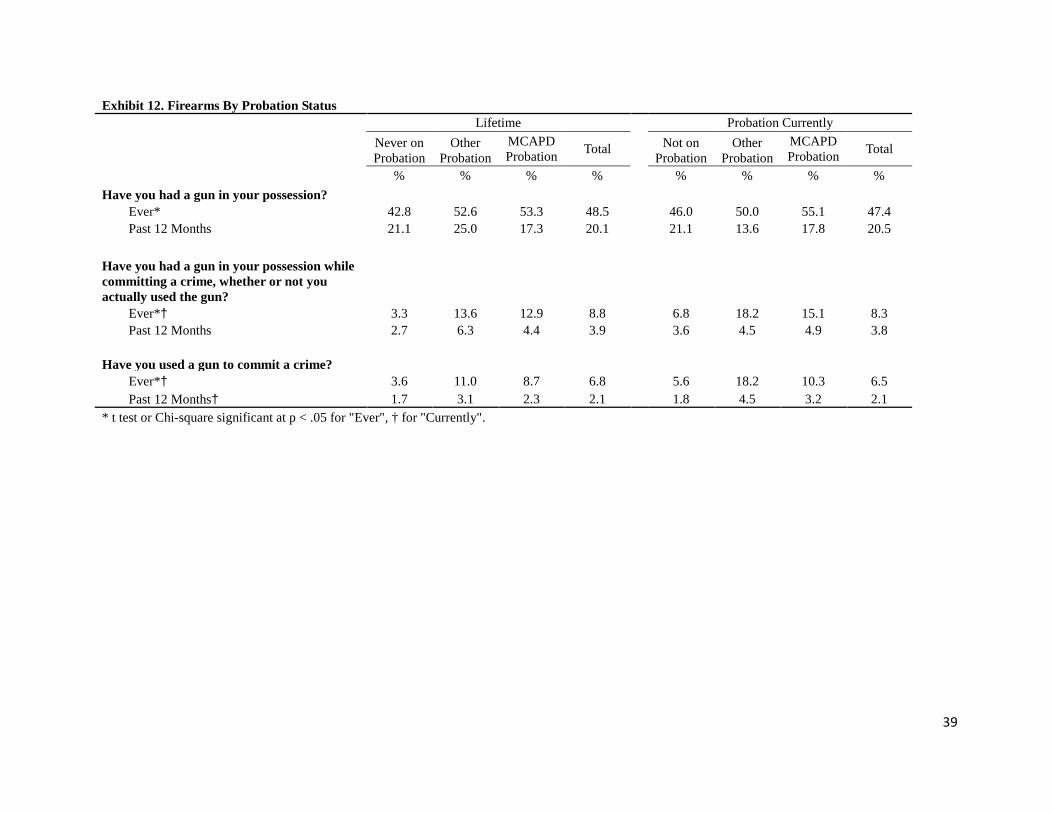
Exhibit 12. Firearms By Probation Status
Lifetime
Probation Currently Never on Probation
Other Probation
MCAPD Probation Total
Not on Probation
Other Probation
MCAPD Probation Total
% % % %
% % % %
Have you had a gun in your possession? Ever* 42.8 52.6 53.3 48.5
46.0 50.0 55.1 47.4
Past 12 Months 21.1 25.0 17.3 20.1
21.1 13.6 17.8 20.5
Have you had a gun in your possession while committing a crime, whether or not you actually used the gun?
Ever*† 3.3 13.6 12.9 8.8
6.8 18.2 15.1 8.3 Past 12 Months 2.7 6.3 4.4 3.9
3.6 4.5 4.9 3.8
Have you used a gun to commit a crime? Ever*† 3.6 11.0 8.7 6.8
5.6 18.2 10.3 6.5
Past 12 Months† 1.7 3.1 2.3 2.1 1.8 4.5 3.2 2.1 * t test or Chi-square significant at p < .05 for "Ever", † for "Currently".
40
Police Contact Perceptions for the Sample (Exhibits 13) Past Maricopa County Probationers
• The majority of past Maricopa County probationers reported favorable interactions with police during their most recent contact. For example, 71.0% reported that the officer treated them respectfully, 71.2% said they were treated fairly, and 75.1% felt the officer behaved professionally.
• About 15% of current Maricopa County probationers reported that the officer threatened to use force against them and 6.0% said that they were physically injured as a result of the incident.
Past Maricopa County Probationers vs. Other and Non-Probationers • About 13% of lifetime non-probationers reported that the officer used force against them for any
reason during their most recent interaction with police, compared to 18.0% of Maricopa County probationers.
• Past Maricopa County probationers were more likely to report arguing or disobeying the officer during the interaction than non-probationers (12.3% v. 7.7%).
• Past Maricopa County probationers generally reported more favorable interactions with police than “other” probationers. For example, 75.1% of MCAPD probationers said the officer(s) behaved professionally, compared to 65.3% of “other” probationers.
41
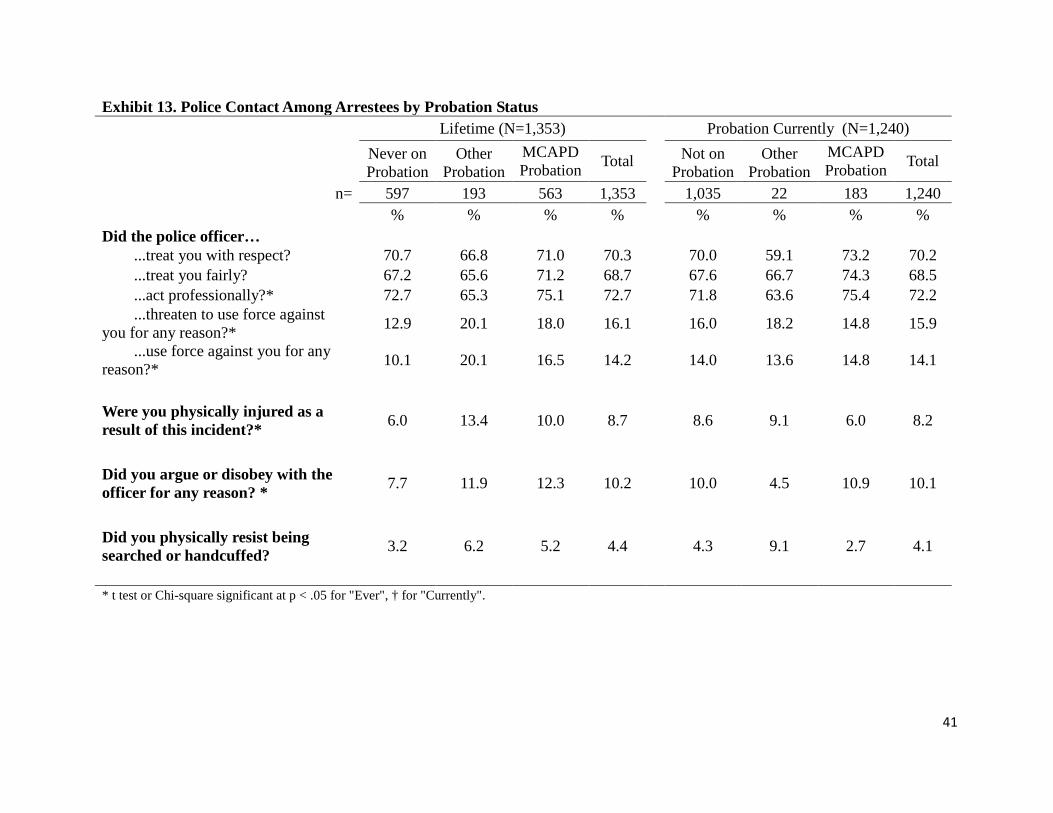
Exhibit 13. Police Contact Among Arrestees by Probation Status
Lifetime (N=1,353) Probation Currently (N=1,240) Never on Probation
Other Probation
MCAPD Probation Total
Not on Probation
Other Probation
MCAPD Probation Total
n= 597 193 563 1,353
1,035 22 183 1,240
% % % %
% % % %
Did the police officer… ...treat you with respect? 70.7 66.8 71.0 70.3 70.0 59.1 73.2 70.2 ...treat you fairly? 67.2 65.6 71.2 68.7 67.6 66.7 74.3 68.5 ...act professionally?* 72.7 65.3 75.1 72.7 71.8 63.6 75.4 72.2 ...threaten to use force against
you for any reason?* 12.9 20.1 18.0 16.1 16.0 18.2 14.8 15.9
...use force against you for any reason?* 10.1 20.1 16.5 14.2 14.0 13.6 14.8 14.1
Were you physically injured as a result of this incident?* 6.0 13.4 10.0 8.7 8.6 9.1 6.0 8.2
Did you argue or disobey with the officer for any reason? * 7.7 11.9 12.3 10.2 10.0 4.5 10.9 10.1
Did you physically resist being searched or handcuffed? 3.2 6.2 5.2 4.4 4.3 9.1 2.7 4.1
* t test or Chi-square significant at p < .05 for "Ever", † for "Currently".
42
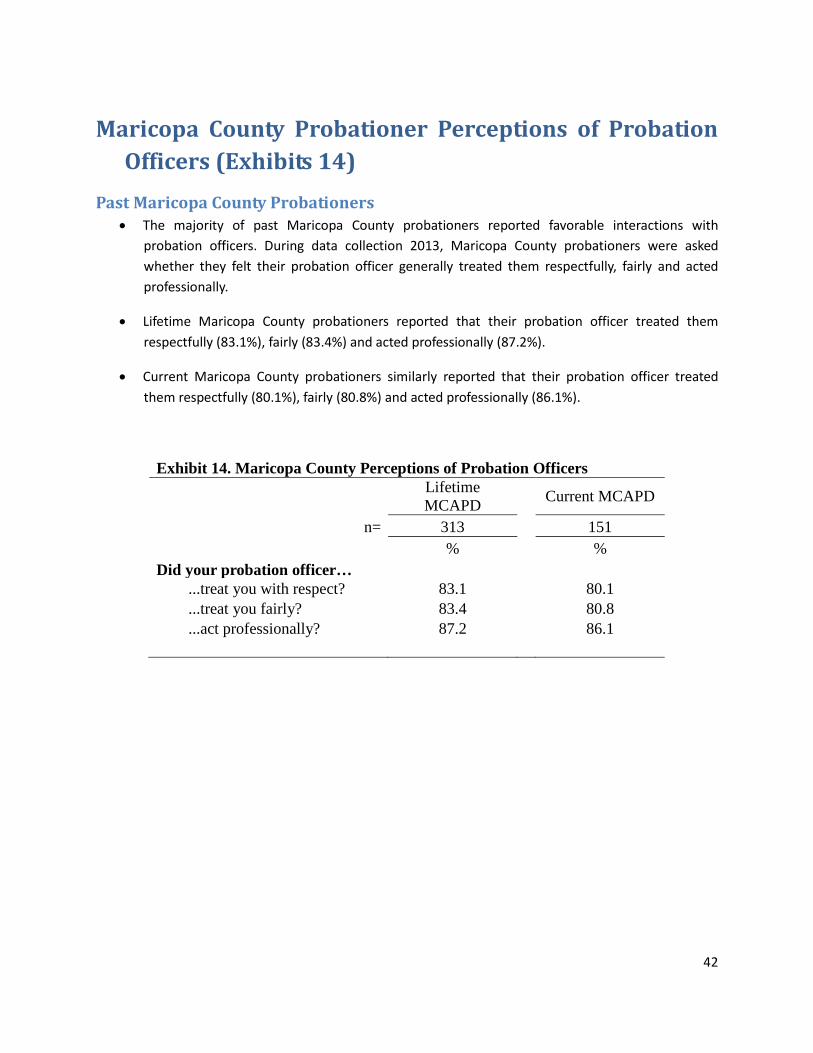
Maricopa County Probationer Perceptions of Probation Officers (Exhibits 14)
Past Maricopa County Probationers • The majority of past Maricopa County probationers reported favorable interactions with
probation officers. During data collection 2013, Maricopa County probationers were asked whether they felt their probation officer generally treated them respectfully, fairly and acted professionally.
• Lifetime Maricopa County probationers reported that their probation officer treated them respectfully (83.1%), fairly (83.4%) and acted professionally (87.2%).
• Current Maricopa County probationers similarly reported that their probation officer treated them respectfully (80.1%), fairly (80.8%) and acted professionally (86.1%).
Exhibit 14. Maricopa County Perceptions of Probation Officers
Lifetime MCAPD Current MCAPD
n= 313
151
%
%
Did your probation officer… ...treat you with respect? 83.1 80.1 ...treat you fairly? 83.4 80.8 ...act professionally? 87.2 86.1

MAILING ADDRESSCenter for Violence Prevention and Community Safety
College of Public ProgramsArizona State University
Mail Code 3120500 N. 3rd Street, Suite 200Phoenix, Arizona 85004-2135
PHONE602.496.1470
WEB SITEhttp://cvpcs.asu.edu
About the Center for Violence Prevention & Community Safety
Arizona State University, in order to deepen its commitment to the communities of Arizona and to society as a whole, has set a new standard for research universities, as modeled by the New American University. Accordingly, ASU is measured not by whom we exclude, but by whom we include.
The University is pursuing research that considers the public good and is assuming a greater responsibility to our communities for economic, social, and cultural vitality. Social embeddedness – university-wide, interactive, and mutually-supportive partnerships with Arizona communities – is at the core of our development as a New American University.
Toward the goal of social embeddedness, in response to the growing need of our communities to improve the public’s safety and well-being, in July 2005 ASU established the Center for Violence Prevention and Community Safety. The Center’s mission is to generate, share, and apply quality research and knowledge to create “best practice” standards.
Specifically, the Center evaluates policies and programs; analyzes and evaluates patterns and causes of violence; develops strategies and programs; develops a clearinghouse of research reports and “best practice” models; educates, trains, and provides technical assistance; and facilitates the development and construction of databases.
For more information about the Center for Violence Prevention and Community Safety, please contact us using the information provided below.