maria h. rapien master of science - vtechworks.lib.vt.edu copper deposits are magmatic-hydrothermal...
TRANSCRIPT

Geochemical Evolution at
White Island, New Zealand
Maria H. Rapien
Thesis submitted to the Faculty of the
Virginia Polytechnic Institute and State University
in partial fulfillment of the requirements for the degree of
Master of Science
in
Geological Sciences
Robert J. Bodnar, Chair
Spencer Cotkin
Csaba Szabó
Robert J. Tracy
July, 1998
Blacksburg, Virginia
Keywords: White Island, New Zealand, Melt inclusions, Porphyry copper deposits
Copyright 1998, Maria Rapien

Geochemical Evolution at White Island, New Zealand
Maria H. Rapien
(ABSTRACT)
White Island, New Zealand, is an active andesitic volcano that is located near the southern end ofthe Tonga-Kermadec Volcanic Arc at the convergent plate boundary where the Pacific Plate isbeing subducted beneath the Indian-Australian Plate. The plate tectonic setting, volcanic featuresand the petrology of White Island are thought to be characteristic of the environment associatedwith formation of porphyry copper deposits. White Island has only been active for about 10 Kaand, as such, is thought to be an ideal location to study early magmatic processes associated withformation of porphyry copper deposits. In this study, the geochemistry of the silicate melt atWhite Island has been characterized through detailed studies of silicate melt inclusions,phenocrysts, and matrix glass contained in recent ejecta (1977-1991). Most melt inclusionscontained only glass, however, daughter minerals present in multiphase melt inclusions in the 1991sample indicate a different P-T history compared to the other samples.
Samples studied are vesicular porphyritic andesitic dacites containing phenocrysts of plagioclase,orthopyroxene, and clinopyroxene. A glassy matrix containing crystallites surrounds thephenocrysts. Both mineral and silicate melt inclusions occur in all three phenocryst phases.Inclusions of plagioclase occur in pyroxenes and inclusions of orthopyroxene and clinopyroxeneoccur in plagioclase. Compositions of minerals are independent of mode of occurrence - that is,plagioclase (and orthopyroxene and clinopyroxene) compositions are the same regardless ofwhether they occur as phenocrysts or as inclusions in another mineral. Moreover, compositions ofmineral inclusions and phenocrysts show no systematic variation within individual samples or insamples representing different eruptive events, indicating that the magma chamber is chemicallyhomogenous over the time-space scale being sampled.
Various major, trace element and volatile compositional features of economic and non-economic(or barren) porphyry copper systems were compared to the White Island data. TheAl2O3/(Na2O+K2O+CaO) ratio observed in economic porphyry copper deposits is always greaterthan or equal to 1.3, and glass in one phase melt inclusions, as well as glass in unhomogenized(1991) inclusions from White Island equal or exceed this value. The glass in the unhomogenized1991 melt inclusions is corundum normative, with Si/(Si+Ca+Mg+Fet)>0.91, andK/(K+Ca+Mg+Fet)>0.36, all of which are characteristic of productive systems. Melt inclusionsfrom White Island also show a positive Eu anomaly similar to that found in productive porphyrydeposits, whereas non-productive systems show a negative Eu anomaly.
Copper concentrations (170-230 ppm) in melt inclusions from White Island are sufficiently high togenerate an economic porphyry copper deposit based on theoretical models. High Cl/H2O ratios(0.15) in melt inclusions furthermore indicate that copper will be efficiently partitioned from themelt into the magmatic aqueous phase. The inferred pressure in the magma chamber at depth (1kbar) is ideal for extracting copper from the melt, and mineral phases (pyrrhotite, biotite oramphibole) which could scavenge copper before it could be partitioned into the magmatic vaporphase are absent. Concentrations of S in the melt are also low, which would prevent pyrrhotitefrom crystallizing.
The tectonic setting and geochemical characteristics of the magma body at White Island are similarto features observed in economic porphyry systems elsewhere. These data suggest thatdevelopment of economic porphyry copper mineralization at White Island is likely.

iii
Acknowledgments
Thanks to my advisor, Bob Bodnar, for always having an open door and an unlimited
reserve of patience. Thanks also to Bob Bodnar for providing me with a great project,
opportunities for data collection, presentation of data, and both moral and financial support.
Thanks to my committee members, Spencer Cotkin, Csaba Szabó, and Bob Tracy for excellent
advice and comments throughout this project. This project would not have been finished were it
not for the experience, encouragement, and occasional pats on the back from Csaba Szabó and Jim
Student (especially during sample preparation!). Thanks to Todd Solberg for always finding time
for me for analyses on the electron microprobe, as well as producing great data, and good advice
on sample preparation. Thanks to Erik Hauri at the Carnegie Institute of Washington for collection
of trace element and volatile data on the ion microprobe, without whom, there would have been no
data.
Thanks to Dr. C. Peter Wood of the Institute of Geological and Nuclear Sciences,
Wairakei, New Zealand for providing the samples for this project. Also, to Dr. Stuart Simmons of
the Geothermal Institute, University of Auckland, for answering many questions and lending data
to this study.
I am grateful to the faculty, staff and fellow graduate students for providing a great
environment in which to do a thesis, and for always providing encouraging words. Finally,
thanks to my family and friends from Cincinnati for cheering me along!!

iv
Table of contents
List of figures .. . . . . . . . . . . . . . . . . . . . . . . . . . . . . . . . . . . . . . . . . . . . . . . . . . . . . . . . . . . . . . . . . . . . . . . . . . . . . . . . . . . . . . . . .v
List of tables............................................................................................vi
Introduction.............................................................................................1
Geologic Setting .. . . . . . . . . . . . . . . . . . . . . . . . . . . . . . . . . . . . . . . . . . . . . . . . . . . . . . . . . . . . . . . . . . . . . . . . . . . . . . . . . . . . . .2
Recent volcanic activity .. . . . . . . . . . . . . . . . . . . . . . . . . . . . . . . . . . . . . . . . . . . . . . . . . . . . . . . . . . . . . . . . . . . . . . . . . . . . . .2
Analytical techniques..................................................................................4
Results . . . . . . . . . . . . . . . . . . . . . . . . . . . . . . . . . . . . . . . . . . . . . . . . . . . . . . . . . . . . . . . . . . . . . . . . . . . . . . . . . . . . . . . . . . . . . . . . . .6
Petrography....................................................................................6
Major element chemistry.....................................................................10
Copper concentrations........................................................................14
Trace elements.................................................................................26
Volatiles........................................................................................26
Temperature .. . . . . . . . . . . . . . . . . . . . . . . . . . . . . . . . . . . . . . . . . . . . . . . . . . . . . . . . . . . . . . . . . . . . . . . . . . . . . . . . . .31
Discussion..... . . . . . . . . . . . . . . . . . . . . . . . . . . . . . . . . . . . . . . . . . . . . . . . . . . . . . . . . . . . . . . . . . . . . . . . . . . . . . . . . . . . . . . . . .31
Conditions in the magma chamber..........................................................31
Is there a porphyry copper deposit in White Island’s future?............................34
Recommendations .. . . . . . . . . . . . . . . . . . . . . . . . . . . . . . . . . . . . . . . . . . . . . . . . . . . . . . . . . . . . . . . . . . . . . . . . . . . . . . . . . . . .37
References..... . . . . . . . . . . . . . . . . . . . . . . . . . . . . . . . . . . . . . . . . . . . . . . . . . . . . . . . . . . . . . . . . . . . . . . . . . . . . . . . . . . . . . . . . .38
Appendix A: Major element data .. . . . . . . . . . . . . . . . . . . . . . . . . . . . . . . . . . . . . . . . . . . . . . . . . . . . . . . . . . . . . . . . . . .43
Appendix B: Copper concentrations................................................................55
Appendix C: Trace elements.........................................................................57
Vita .. . . . . . . . . . . . . . . . . . . . . . . . . . . . . . . . . . . . . . . . . . . . . . . . . . . . . . . . . . . . . . . . . . . . . . . . . . . . . . . . . . . . . . . . . . . . . . . . . . . . .59

v
List of figures
Figure 1: Location of White Island..................................................................2
Figure 2: Photomicrograph of pyroxene phenocryst..............................................7
Figure 3: Photomicrograph of etched plagioclase phenocryst . . . . . . . . . . . . . . . . . . . . . . . . . . . . . . . . . . .8
Figure 4: Photomicrograph of melt and mineral inclusions......................................9
Figure 5: Photomicrographs of melt inclusions before and after homogenization.............11
Figure 6: Compositions of pyroxenes and plagioclase .. . . . . . . . . . . . . . . . . . . . . . . . . . . . . . . . . . . . . . . . . .12
Figure 7: An contents of plagioclase inclusions grouped by sample year......................15
Figure 8: An contents of plagioclase inclusions grouped by locations within phenocryst....16
Figure 9: Harker diagrams of melt inclusions grouped by host phase..........................20
Figure 10: Harker diagrams of melt inclusions grouped by sample year.......................21
Figure 11: Harker diagrams of melt inclusions grouped by location within host..............22
Figure 12: Harker diagrams of melt inclusions within a single phenocryst....................23
Figure 13: Harker diagrams of melt inclusions before and after homogenization.............24
Figure 14: Traverse through melt inclusion showing copper concentrations .. . . . . . . . . . . . . . . . .25
Figure 15: Chondrite normalized REE profile for melt inclusions and matrix glass .. . . . . . . . .28
Figure 16: Concentrations of volatiles in melt inclusion and matrix glass......................30

vi
List of Tables
Table 1: Electron microprobe averages of pyroxene compositions..............................13
Table 2: Electron microprobe averages of plagioclase compositions............................17
Table 3: Major element compositions of melt inclusion glass, grouped by sample year......18
Table 4: Major element compositions of melt inclusion glass, grouped by host...............19
Table 5: Trace element concentrations of melt inclusion and matrix glass......................27
Table 6: Volatile contents of melt inclusion and matrix glass....................................29
Table 7: Calculation of fractionating assemblage..................................................33

1
Introduction
Porphyry copper deposits are magmatic-hydrothermal ore deposits that form at convergent
plate boundaries where magmas generated from a subducting slab migrate upwards to produce
shallow silicic plutons (Sawkins, 1984). It is thought that most, if not all, of the magmatic
systems associated with formation of porphyry copper mineralization were continuously or
intermittently open to the surface through an overlying stratovolcano or other surface manifestation
of the deeper magmatic-hydrothermal system. White Island, located off the North Island of New
Zealand (Figure 1), is an active andesitic-dacitic volcano that occurs at a convergent plate boundary
and thus represents an appropriate environment for formation of porphyry copper mineralization.
Copper is currently being released into the atmosphere at White Island at an estimated rate of 300
kg/day during continuous degassing of the volcano (Rose et al., 1986; Tedesco and Toutain, 1991;
Le Cloarec et al., 1992).
The presence of an active hydrothermal system at White Island is indicated by surface
features including high temperature fumaroles and acid springs (Giggenbach, 1987; Giggenbach
and Sheppard, 1989). Furthermore, Hedenquist et al. (1993) and Hedenquist and Lowenstern
(1994) noted that the near-surface geochemical environment at White Island is similar to that
associated with the formation of high-sulfidation Cu - Au mineralization elsewhere. More recently,
Arribas et al. (1995) documented a clear genetic link between near-surface, high-sulfidation Cu-Au
mineralization and deeper porphyry-type mineralization in the Lapanto-Far Southeast mineralized
system in the Philippines. Based on these observations, it is logical to suggest that White Island
might represent a modern ore-forming system in which shallow high-sulfidation Cu-Au
mineralization overlies deeper porphyry copper-type mineralization.
Although there have been numerous geochemical and fluid inclusion studies of porphyry
copper deposits, conditions during the early magmatic stage have been difficult to characterize
because magmatic assemblages are commonly overprinted by later magmatic and hydrothermal
events (Beane and Titley, 1981; Beane, 1982; Beane and Bodnar, 1995). White Island, however,
is still in its infancy relative to the productive stage for porphyry copper mineralization and thus
offers a unique opportunity to document the early history of a potential porphyry copper-forming
magmatic system. In this study, phenocrysts, silicate melt inclusions, and matrix glass contained
in ejecta from White Island were analyzed. Major, trace element, and volatile concentrations were
determined to characterize the early magmatic system associated with a porphyry copper type
deposit. Melt inclusions within ejecta are especially valuable for this purpose because they provide
a sample of melt that was trapped in the magma chamber at some depth beneath White Island. As
such, the melt inclusions record the volatile and metal concentrations of the silicic melt at depth, at
a time before the major episodes of copper mineralization occurred.

Crater Bay
Wilson Bay
50 m
100150200250
E
CW
xMain Crater
321 m
WhiteIsland
0 500 m
Shark Bay
77/90CraterComplex
Mt. Gisborne
Figure 1. Location of White Island and topographical features. "W", "C", and "E" correspond to the western, central, and eastern subcraters respectively.
District
White Island
North Islandof New Zealand
Bay of IslandsVolcanic District
TaupoVolcanicZone
35o
37o
39o
41o
N
179o177o175o173o
Auckland
DistrictVolcanic
VolcanicEgmont
2
3
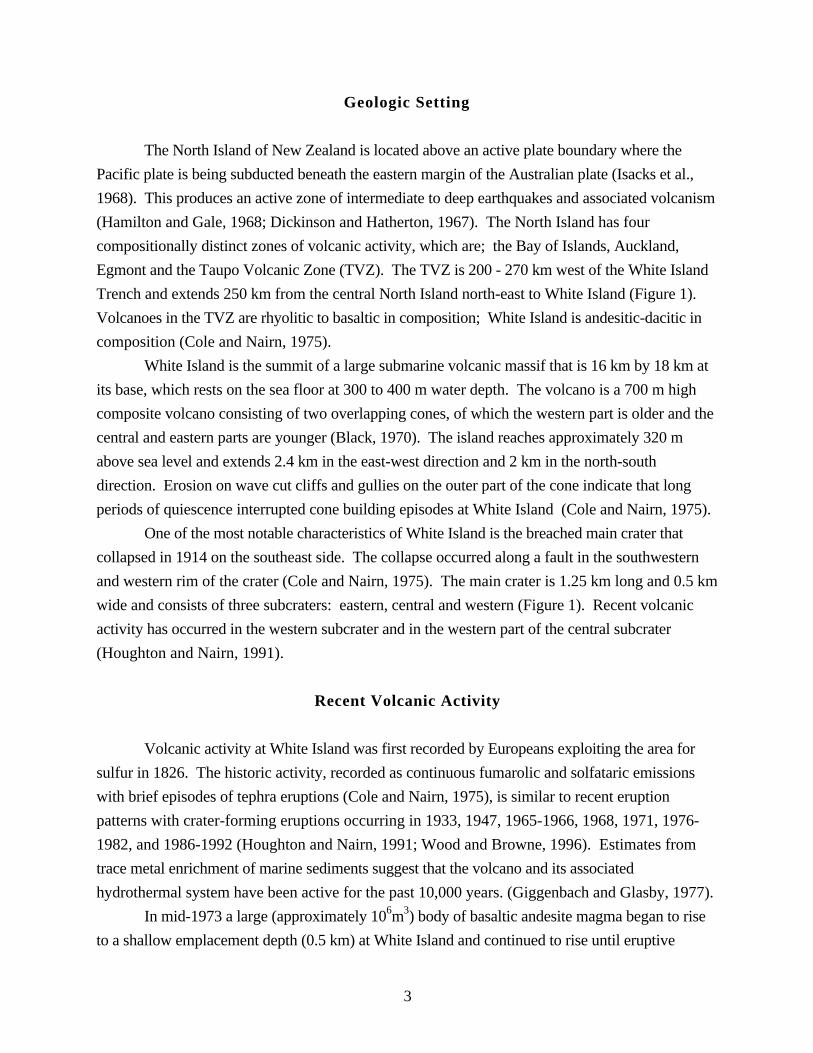
Geologic Setting
The North Island of New Zealand is located above an active plate boundary where the
Pacific plate is being subducted beneath the eastern margin of the Australian plate (Isacks et al.,
1968). This produces an active zone of intermediate to deep earthquakes and associated volcanism
(Hamilton and Gale, 1968; Dickinson and Hatherton, 1967). The North Island has four
compositionally distinct zones of volcanic activity, which are; the Bay of Islands, Auckland,
Egmont and the Taupo Volcanic Zone (TVZ). The TVZ is 200 - 270 km west of the White Island
Trench and extends 250 km from the central North Island north-east to White Island (Figure 1).
Volcanoes in the TVZ are rhyolitic to basaltic in composition; White Island is andesitic-dacitic in
composition (Cole and Nairn, 1975).
White Island is the summit of a large submarine volcanic massif that is 16 km by 18 km at
its base, which rests on the sea floor at 300 to 400 m water depth. The volcano is a 700 m high
composite volcano consisting of two overlapping cones, of which the western part is older and the
central and eastern parts are younger (Black, 1970). The island reaches approximately 320 m
above sea level and extends 2.4 km in the east-west direction and 2 km in the north-south
direction. Erosion on wave cut cliffs and gullies on the outer part of the cone indicate that long
periods of quiescence interrupted cone building episodes at White Island (Cole and Nairn, 1975).
One of the most notable characteristics of White Island is the breached main crater that
collapsed in 1914 on the southeast side. The collapse occurred along a fault in the southwestern
and western rim of the crater (Cole and Nairn, 1975). The main crater is 1.25 km long and 0.5 km
wide and consists of three subcraters: eastern, central and western (Figure 1). Recent volcanic
activity has occurred in the western subcrater and in the western part of the central subcrater
(Houghton and Nairn, 1991).
Recent Volcanic Activity
Volcanic activity at White Island was first recorded by Europeans exploiting the area for
sulfur in 1826. The historic activity, recorded as continuous fumarolic and solfataric emissions
with brief episodes of tephra eruptions (Cole and Nairn, 1975), is similar to recent eruption
patterns with crater-forming eruptions occurring in 1933, 1947, 1965-1966, 1968, 1971, 1976-
1982, and 1986-1992 (Houghton and Nairn, 1991; Wood and Browne, 1996). Estimates from
trace metal enrichment of marine sediments suggest that the volcano and its associated
hydrothermal system have been active for the past 10,000 years. (Giggenbach and Glasby, 1977).
In mid-1973 a large (approximately 106m3) body of basaltic andesite magma began to rise
to a shallow emplacement depth (0.5 km) at White Island and continued to rise until eruptive

4
activity started in 1976 (Clark and Cole, 1989). This magma and its associated hydrothermal
system led to intense volcanic activity that continued over the next several years, consisting of
alternating strombolian and phreatomagmatic eruptions. The volcano continuously erupted for
about 16 years, allowing effective release of magmatic gases. Exsolved gases interacted with the
surrounding hydrothermal system, acidifying the hydrothermal fluids. The acidified fluids
saturated the crater floors and conduit system, weakening substructures and making them
susceptible to alteration and collapse during earthquake activity (Houghton and Nairn, 1989a;
1991). The condition of the crater floors and conduit system, in turn, influenced the eruptive style
at White Island. For example, continuous phreatomagmatic events erupting mainly ash occurred
when conduit walls were stable. Discrete explosions, producing juvenile block aprons, occurred
when conduit walls were weakened and/or clogged (Houghton and Nairn, 1989a; 1991).
A second sequence of eruptive activity at White Island began in February, 1986, with a
discrete phreatomagmatic eruption. Volcanic activity during this eruption period consisted of
continuous gas emissions, interrupted by frequent alternating strombolian and phreatomagmatic
type eruptions. This activity continued until May 1992 (Wood and Browne, 1996).
Representative samples of ejecta from seven eruptions that occurred between 1977 and
1992 were used in this study. The samples were collected by Dr. C. Peter Wood of the Institute of
Geological and Nuclear Sciences, Wairakei, New Zealand. After preliminary examination of all
samples, those from the 1977, 1988, 1989, and 1991 eruptions were chosen for detailed study
owing to their abundance of silicate melt inclusions.
Analytical Techniques
Samples were examined both in hand sample and in doubly polished thin sections using
transmitted and reflected light microscopy. Plagioclase phenocrysts were etched with fluoboric
acid and examined using differential interference microscopy (Anderson, 1983) to observe
chemical zoning that might not be obvious during usual petrographic observations. Phenocrysts,
silicate melt and mineral inclusions in phenocrysts, and matrix glass were analyzed for major
elements by electron microprobe. Melt inclusions and phenocrysts contained in the 1977 sample
were analyzed for copper content by electron microprobe. Melt inclusions and matrix glasses from
the 1988 and 1989 samples were further analyzed for trace element and volatile content by ion
microprobe. Multiphase silicate melt inclusions hosted in orthopyroxene from the 1991 sample
were selected and doubly polished for homogenization. These homogenized inclusions were then
analyzed for major element content by electron microprobe.
Major element and copper concentrations were determined using a Cameca SX50 electron
microprobe, equipped with both wave and energy dispersive spectrometers (WDS and EDS,

5
respectively) at Virginia Tech. Quantitative analyses were conducted using the WDS. Back
scattered electron imaging was used to determine whether an inclusion was silicate melt or mineral,
as well as to determine if the area for analysis in a matrix glass was crystallite free. Natural and
synthetic silicate and oxide standards were used as appropriate, and data were corrected using PAP
methodology according to Pouchou and Pichoir (1985). Analyses were performed at 15 kV, and
the beam current was 10 nA with a 5 µm beam size.
Ion microprobe analyses were performed on a Cameca IMS-6F ion microprobe equipped
with both oxygen and cesium guns at the Department of Terrestrial Magnetism at the Carnegie
Institution of Washington. Trace elements were analyzed in situ using a 12.7 kV primary beam of
O- ions with a current of 0.5-2 nA focused to a diameter of 10-20 µm. Positively charged
secondary ions were analyzed at a nominal accelerating voltage of +10 kV. The secondary ion
beam was energy-filtered using an energy offset of -70 eV and an energy window of ±25eV.
Secondary ions were counted by an ETP electron multiplier feeding into an ECL counting system
with a deadtime of 13 ns. Secondary ion counts were referenced to counts for 30Si (e.g. 90Zr/30Si,93Nb/30Si) and absolute abundances of trace elements were calculated from calibration curves for
silicates. The scatter of standards about the calibration curves was generally less than 10%, similar
to the reproducibility of individual analyses on homogeneous standards. Thus, analytical
uncertainty on individual analyses is typically ±10% except where low numbers of ions indicate a
larger standard deviation.
Volatile elements (H, C, F, S, and Cl) were analyzed in situ using a 10 kV primary beam
of Cs+ ions with a current of 3-8 nA focused to a diameter of 20-30 µm. Negatively charged
secondary ions were analyzed at a nominal accelerating voltage of +5 kV. The ion probe was
tuned to a mass resolving power of 2200, sufficient to separate interferences of 18OH on 19F and16O2 on 32S. No energy filtering was used and the energy slit was kept open wide (±125 eV). A
small-field aperture was inserted into the secondary ion beam path in order to accept only those
ions coming from the central 8 µm of the sputtered crater. This has the effect of filtering out ions
from the edge of the crater and the sample surface, resulting in a very low detection limit for H2O
(<30 ppm). Secondary ions (1H, 12C, 19F, 30Si, 32S, and 35Cl) were counted by an ETP electron
multiplier feeding into an ECL counting system with a deadtime of 13 ns. Secondary ion counts
were referenced to counts for 30Si (e.g. 1H/30Si, 12C/30Si). Analytical uncertainty on individual
analyses is typically ±10% except where low numbers of ions indicate a larger standard deviation.
Homogenization of multiphase silicate melt inclusions was performed on a Linkam TS
1500 stage (linked to a TMS 92 programmer) mounted on an Olympus petrographic microscope at
Virginia Tech. All experiments were conducted in flowing nitrogen to minimize oxidation of the
sample at high temperature. Samples were heated to 900°C at a rate of 30°C/minute, the rate was
then lowered to 3°C/minute until homogenization at 1209°C. After homogenization, samples were

6
cooled to 300°C at 200°C/minute, which is the fastest cooling rate possible with this stage. This
was done in an attempt to produce homogenous glass which could be analyzed by electron
microprobe to determine the bulk composition of the melt.
Results
Petrography
Samples are vesicular porphyritic andesites, which are representative of juvenile ejecta
during eruptions. Hand samples range in color from light to dark gray with some alteration
evident. Phenocrysts of plagioclase, clinopyroxene, and orthopyroxene, and matrix glass are
visible in hand samples. In thin section, phenocrysts are euhedral to anhedral and range in size
from 0.5 - 3 µm (Figure 2). The order of abundance of phenocrysts is orthopyroxene >
plagioclase > clinopyroxene. Minor phases include Ti-magnetite and acicular apatite. All
phenocrysts appear homogeneous in cross-polarized transmitted light, however, plagioclase
phenocrysts exhibit chemical zoning (Figure 3) when viewed with differential interference contrast
microscopy after etching in fluoboric acid (Anderson, 1983). Phenocrysts comprise from 50 to
70% by volume of most samples. Phenocrysts are surrounded by matrix glass that contains
crystallites of pyroxene, plagioclase, and Ti-magnetite.
Phenocrysts contain both mineral and silicate melt inclusions, with a notable absence of
fluid inclusions containing liquid and/or vapor water, CO2 or other volatile phase. Silicate melt
inclusions generally range in size from 5 to 50 µm, with the majority ranging between 10 and 25
µm. Shapes of melt inclusions range from spherical to negative crystal shape. The melt inclusions
were subdivided into four sub-types based on the phase assemblage at room temperature. Type I
inclusions contain only glass; type II inclusions contain glass plus a vapor bubble; type III
inclusions contain glass plus one or more solids; type IV inclusions contain glass, a vapor bubble,
and one or more solids. All four types of inclusions have been observed along growth zones in
phenocrysts (Figure 4) and as isolated, randomly distributed occurrences throughout crystals. The
inclusion assemblages in the 1977, 1988, and 1989 samples appear to be similar, whereas the
assemblage in the 1991 sample is noticeably different. In the 1977-89 group of samples, type I all-
glass inclusions and type II glass plus vapor inclusions occur in all three phenocryst minerals
(plagioclase, ortho- and clinopyroxene). The type I inclusions are very small (1-5 µm) and
abundant in some portions of plagioclase phenocrysts. The vapor bubble in the type II inclusions
shows consistent phase behavior in all inclusions and occupies about 10 volume % of the
inclusion. Type III melt inclusions containing glass and a plagioclase crystal were observed in

Figure 2. Photomicrograph of an orthopyroxene phenocryst that is cut byplagioclase. Other pieces of anhedral phenocrysts are visible throughout the photo. Dark brown material is matrix glass. Large vesicles are present inthe lower left corner and on the right edge of the photo (marked by "V").Field of view is 5 mm.
V
V
7

Figure 3. Photomicrograph of plagioclase phenocryst viewed with differentialinterference contrast after etching in fluoboric acid. Chemical zoning can be seen throughout the phenocryst as dark and light bands. Melt inclusions occur along those zones. Field of view is 1 mm.
8

Figure 4. Photomicrograph of orthopyroxene phenocryst. Bands of primaryinclusions can be seen in the crystal, trapped along a growing crystal face. Both melt inclusions and plagioclase inclusions occur within these bands. Field of viewis 2 mm.
9
10
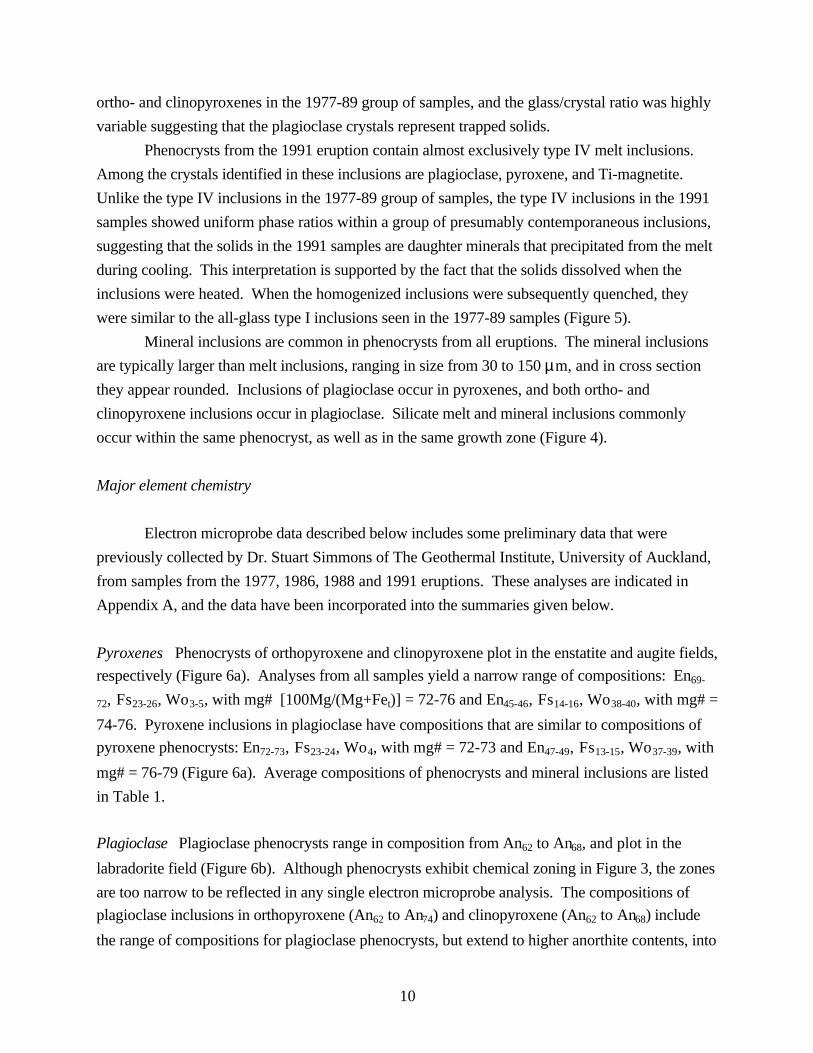
ortho- and clinopyroxenes in the 1977-89 group of samples, and the glass/crystal ratio was highly
variable suggesting that the plagioclase crystals represent trapped solids.
Phenocrysts from the 1991 eruption contain almost exclusively type IV melt inclusions.
Among the crystals identified in these inclusions are plagioclase, pyroxene, and Ti-magnetite.
Unlike the type IV inclusions in the 1977-89 group of samples, the type IV inclusions in the 1991
samples showed uniform phase ratios within a group of presumably contemporaneous inclusions,
suggesting that the solids in the 1991 samples are daughter minerals that precipitated from the melt
during cooling. This interpretation is supported by the fact that the solids dissolved when the
inclusions were heated. When the homogenized inclusions were subsequently quenched, they
were similar to the all-glass type I inclusions seen in the 1977-89 samples (Figure 5).
Mineral inclusions are common in phenocrysts from all eruptions. The mineral inclusions
are typically larger than melt inclusions, ranging in size from 30 to 150 µm, and in cross section
they appear rounded. Inclusions of plagioclase occur in pyroxenes, and both ortho- and
clinopyroxene inclusions occur in plagioclase. Silicate melt and mineral inclusions commonly
occur within the same phenocryst, as well as in the same growth zone (Figure 4).
Major element chemistry
Electron microprobe data described below includes some preliminary data that were
previously collected by Dr. Stuart Simmons of The Geothermal Institute, University of Auckland,
from samples from the 1977, 1986, 1988 and 1991 eruptions. These analyses are indicated in
Appendix A, and the data have been incorporated into the summaries given below.
Pyroxenes Phenocrysts of orthopyroxene and clinopyroxene plot in the enstatite and augite fields,
respectively (Figure 6a). Analyses from all samples yield a narrow range of compositions: En69-
72, Fs23-26, Wo3-5, with mg# [100Mg/(Mg+Fet)] = 72-76 and En45-46, Fs14-16, Wo38-40, with mg# =
74-76. Pyroxene inclusions in plagioclase have compositions that are similar to compositions of
pyroxene phenocrysts: En72-73, Fs23-24, Wo4, with mg# = 72-73 and En47-49, Fs13-15, Wo37-39, with
mg# = 76-79 (Figure 6a). Average compositions of phenocrysts and mineral inclusions are listed
in Table 1.
Plagioclase Plagioclase phenocrysts range in composition from An62 to An68, and plot in the
labradorite field (Figure 6b). Although phenocrysts exhibit chemical zoning in Figure 3, the zones
are too narrow to be reflected in any single electron microprobe analysis. The compositions of
plagioclase inclusions in orthopyroxene (An62 to An74) and clinopyroxene (An62 to An68) include
the range of compositions for plagioclase phenocrysts, but extend to higher anorthite contents, into

Pyroxene Vapor 20 m mi.
ii.iii.
iv.
i.
ii.
iii.
iv.
Figure 5. Melt inclusions from the 1991 eruption shown prior to homogenization (a)and after homogenization (b). Melt inclusions prior to homogenization were type IVmultiphase melt inclusions containing a pyroxene needle and a vapor bubble. After homogenization melt inclusions are type I single phase. Field of view is rotated in the lower picture; Roman numerals are provided to indicate corresponding melt inclusions in the two photos.
a.
b.
11
20 m m

En Fs (·Fe)
Pyroxene inclusions
pyx-phen-comps.txtDi Hd
Augite
Pigeonite
Diopside Hedenbergite
Enstatite Ferrosilite
a.
Pyroxene phenocrysts
Pyroxene crystallitesin matrix
An 80
Ab 60 Ab 90
An
Ab Or
Plagioclase inclusions
Plagioclase phenocrysts
Plagioclase crystallitesin matrix
b.
Figure 6. Compositions of phenocrysts, mineral inclusions, and matrix crystallites for (a) pyroxene and (b) plagioclase. Pyroxene nomenclature after Morimoto, 1988.
ii. Labradoritei. Bytownite
ii.
i.
12

13
Table 1. Electron microprobe analyses in weight percent oxide of pyroxene phenocrysts andmineral inclusions. Numbers in italics are the range for that analysis.
WeightPercentOxide
ClinopyroxenePhenocryst
n=22
ClinopyroxeneInclusions inPlagioclase
n=15
OrthopyroxenePhenocryst
n=40
OrthopyroxeneInclusions inPlagioclase
n=5SiO2 52.71 52.15 53.81 51.66
50.93 - 54.87 50.97 - 53.26 51.73 - 55.72 48.75 - 54.2TiO2 0.49 0.44 0.23* 0.28
0.39 - 0.63 0.30 - 0.60 0.09 - 0.34 0.20 - 0.30Al2O3 1.85 1.93 1.14 1.13
1.58 - 2.08 1.79 - 2.00 0.82 - 1.52 1.07 - 1.24MgO 16.15 17.19 26.13 26.74
15.53 - 16.60 16.51 - 17.80 25.3 - 27.14 25.86 - 27.77CaO 18.94 18.98 2.10 2.02
18.25 - 19.72 18.16 - 19.44 1.7 - 2.6 1.86 - 2.14MnO 0.37 na 0.41 na
0.27 - 0.46 0.17 - 0.67FeO 9.72 8.78 16.44 15.12
9.08 - 10.35 8.07 - 9.63 15.11 - 18.38 14.90 - 15.35Na2O 0.22 0.27 0.04 0.06
0.14 - 0.33 0.16 - 0.35 bd - 0.11 0.10 - 0.07K2O bd 0.04 bd 0.04
bd - 0.09 bd - 0.06F 0.14 na 0.10* na
bd - 0.34 bd - 0.32Cl bd na bd na
Total 100.62 99.78 100.42 97.0597.46 - 103.25 97.58 - 100.71 97.46 - 103.25 93.52 - 100.68
bd = below detection limitsna = not analyzed for those samples* = number analyzed is less for this value

14
the field of bytownite. There is no correlation between the range in An content and the year in
which the sample was ejected from the magma chamber (Figure 7). Also, there is no systematic
correlation between the An content of plagioclase inclusions and the location of the inclusion within
the phenocryst (i.e., there is no apparent zoning in plagioclase composition from the core to the rim
of phenocrysts) (Figure 8). Average compositions of phenocrysts and mineral inclusions are listed
in Table 2.
Melt inclusions Compositions of melt inclusions hosted in all three phenocryst minerals
(plagioclase, ortho- and clinopyroxene) were determined. Composition ranges and averages, and
CIPW norms are listed by year in Table 3 and by host in Table 4. Compositions of melt inclusions
trapped in samples from the 1977, 1986, 1988, and 1989 eruptions (77/89) are similar and
independent of host phase (Figure 9) or year in which they were erupted (Figure 10). No
correlation was found between the location of the inclusion in the host mineral and the composition
of the melt (Figures 11 and 12). Glass in unhomogenized multiphase melt inclusions from 1991
has a composition that differs from compositions and CIPW norms of glass in samples from the
other four years. However, compositions of homogenized melt inclusions hosted by a
clinopyroxene from 1991 are similar to the 77/89 compositions with the exception of the alkalis.
(Table 3 and Figure 13). Analytical totals for the glasses range from 93-99%, which is interpreted
to indicate the presence of unanalyzed volatiles in the melts.
Matrix glass Matrix glass has a composition similar to that of glass in melt inclusions from the
77/89 samples, and similar to glass in homogenized 1991 melt inclusions (Figure 9 and 10).
Crystallites in matrix glass have compositions that are similar to compositions of phenocrysts in the
same samples (Figure 6).
Copper concentrations
Copper concentrations were determined for matrix glass and for two melt inclusions hosted
by an orthopyroxene erupted in 1977. Background concentrations of copper in the orthopyroxene
range from 10-30 ppm. The copper concentration in silicate melt inclusions is significantly higher,
ranging from 160 - 280 ppm with an average of 230±10 ppm. Matrix glass was slightly lower
with a range of 170 - 220 ppm and an average of 188 ppm. The average copper concentration in
andesites is reported to be 60 ppm, with a range from 10 to 150 ppm (Gill, 1981). An electron
microprobe traverse for copper through a melt inclusion and enclosing pyroxene host phase is
shown in Figure 14. As shown, the copper concentration in the melt inclusion is clearly elevated
relative to the copper concentration in the host phase.

15
62 63 64 65 66 67 68 69 70 71 72 73 740
10
20
19771988
19891991
An content
Fre
quen
cy
Figure 7. Variation of An-contents of plagioclase inclusions grouped by eruption year. An-content ranges overlap from all years sampled.

16
62 63 64 65 66 67 68 69 70 71 72 73 740
5
10
15
CoreMiddleRim
An-content
Fre
quen
cy
(a.)
62 63 64 65 66 67 68 69 70 71 72 73 740
2
4
6
8
CoreMiddleRim
An content
Fre
quen
cy
(b.)
Figure 8. Variations of An-contents of plagioclase mineral inclusions grouped according tolocation within phenocrysts for (a) inclusions from all samples and (b) inclusions within a singlephenocryst. All ranges overlap in both cases.

17
Table 2. Electron microprobe analyses in weight percent oxide of plagioclase phenocrysts andmineral inclusions. Numbers in italics are the range for that analysis.
WeightPercentOxide
PlagioclasePhenocryst
n=14
PlagioclaseInclusions in
Clinopyroxenen=14
PlagioclaseInclusions in
Orthopyroxenen=74
SiO2 51.65 51.85 51.4148.53 - 53.14 49.72 - 55.19 48.67 - 55.96
TiO2 0.05 0.09 0.11*bd - 0.10 0.04 - 0.26 bd - 0.37
Al2O3 29.09 28.92 29.1028.75 - 29.50 24.34 - 31.58 24.99 - 31.11
MgO 0.16 0.65 0.360.10 - 0.23 0.16 - 3.08 0.08 - 1.90
CaO 13.35 13.86 13.4112.68 - 14.15 12.31 - 15.32 10.97 - 14.81
MnO 0.06* 0.09 0.10bd - 0.13 bd - 0.15 bd - 0.36
FeO 0.71 1.36 1.580.59 - 0.89 0.81 - 2.79 0.86 - 3.08
Na2O 3.76 3.34 3.483.54 - 4.13 2.61 - 3.74 2.75 - 4.44
K2O 0.25 0.26 0.24*0.11 - 0.33 0.15 - 0.61 0.05 - 0.85
F 0.14* 0.03 0.13*bd - 0.46 bd - 0.14 bd - 0.30
Cl bd bd bd
Total 99.19 100.44 99.7195.83 - 100.81 98.15 - 101.82 96.79 - 101.98
bd = below detection limitsna = not analyzed for those samples* = number analyzed is less for this value

18
Table 3. Major element compositions microprobe in weight percent oxide of melt inclusions asdetermined by electron microprobe. Numbers in italics are the range for the melt inclusioncompositions for that year. CIPW-norms were calculated for the averages given in this table.
WeightPercentOxide
1977 average
n = 14
1986 average
n = 16
1988 average
n = 25
1989 average
n = 20
1991 averageunhomogenized
n = 19
1991 averagehomogenized
n= 9SiO2 64.25 63.75 63.88 64.23 68.28 64.88
61.07 -66.12 62.87 - 64.59 59.99 - 65.87 61.28 - 67.25 63.24 - 71.39 63.11 - 66.54TiO2 1.18 1.08 0.96 1.08* 1.00 1.33
0.68 - 1.6 0.95 - 1.20 0.70 - 1.30 0.90 - 1.40 0.65 - 1.49 1.04 - 1.50Al2O3 12.68 13.81 14.39 13.67 14.68 13.41
11.3 - 13.80 13.36 - 14.27 13.35 - 15.83 13.17 - 14.58 12.57 - 16.2 12.48 - 14.94MgO 1.93 2.16 2.07 1.96 0.9 1.81
0.98 - 2.43 1.96 - 2.31 1.43 - 2.63 0.81 - 2.56 0.14 - 4.06 1.62 - 2.01CaO 4.70 5.14 5.13 4.85 3.05 5.44
4.08 - 5.60 4.55 - 5.55 4.43 - 5.97 3.73 - 6.15 2.1 - 4.55 5.06 - 5.89MnO 0.15 0.09 0.17 0.14* 0.07 0.20
0.05 - 0.29 0.02 -0.21 0.12 - 0.26 0.12 - 0.30 bd - 0.17 0.09 - 0.28FeO 7.05 6.19 6.42 6.31 2.15 8.08
6.27 - 7.84 5.45 -6.88 5.22 - 7.94 5.25 - 7.68 1.29 - 3.79 7.35 - 8.53Na2O 2.45 2.87 2.60 2.24 2.06 0.87
1.75 - 3.13 2.50 - 3.08 1.79 - 3.18 1.54 - 2.99 1.24 - 3.27 0.54 - 1.24K2O 2.87 2.49 2.66 2.58 2.77 1.71
2.54 - 3.11 2.30 - 2.68 1.86 - 3.24 1.74 - 2.84 1.91 - 3.53 1.50 - 1.97F 0.07 0.13 0.05 na 0.11 0.04
bd - 0.20 bd - 0.30 bd - 0.17 bd - 0.29 bd - 0.17Cl 0.14 0.12 0.13 na 0.27 0.14
0.14 - 0.08 0.09 - 0.18 0.09 - 0.17 0.10 - 0.82 0.11 - 0.18Total 97.45 97.83 98.46 96.72 95.34 97.90
97.45 - 99.11 96.72 - 98.59 94.62 - 99.95 93.41 - 99.01 91.94 - 97.78 94.60 - 99.47Q 27.49 24.96 25.31 28.84 40.05 38.70C 0.00 0.00 0.00 0.00 3.87 0.92Or 16.94 14.70 15.70 15.23 16.35 10.09Ab 19.68 23.38 21.02 17.91 15.42 6.32An 15.65 17.89 20.22 20.14 13.11 25.64Di 4.99 4.46 3.13 1.64 0.00 0.00Hy 4.75 5.16 5.90 6.03 2.23 6.99Il 2.24 2.05 1.83 2.05 1.90 2.53Mt 4.60 4.05 4.19 4.12 1.09 5.28Hm 0.00 0.00 0.00 0.00 0.22 0.00Ap 0.44 0.44 0.44 0.44 0.44 0.44Hl 0.23 0.2 0.21 0.23 0.44 0.23Fl 0.10 0.18 0.07 0.14 0.15 0.06
bd = below detection limitsna = not analyzed for those samples* = number analyzed is less for this value

19
Table 4. Major element compositions in weight percent oxide of melt inclusions grouped byphenocryst host. Numbers in italics are the range for the melt inclusion compositions for that host.CIPW-norms were calculated for the averages given in this table.
WeightPercentOxide
Melt inclusionsin clinopyroxene
n=22
Melt inclusions inorthopyroxene
n=17
Melt inclusions inplagioclase
n=33SiO2 63.44 64.34 64.19
59.99 - 65.44 61.97 - 65.87 31.07 - 67.25TiO2 1.02 0.96 1.13
0.70 - 1.30 0.68 - 1.14 0.90 - 1.60Al2O3 14.05 14.03 13.31
13.35 - 15.83 13.22 - 15.21 11.30 - 14.27MgO 2.12 1.65 2.16
1.75 - 2.63 0.81 - 2.36 1.30 - 2.56CaO 5.20 5.29 4.65
4.43 - 5.97 4.53 - 6.15 3.73 - 5.42MnO 0.14 0.17* 0.11*
0.002 - 0.23 bd - 0.30 0.05 - 0.19FeO 6.44 6.79 6.32
5.22 - 7.94 5.74 - 7.68 5.25 - 7.84Na2O 2.75 2.51 2.42
1.79 - 3.09 1.75 - 3.18 1.54 - 2.42K2O 2.57 2.60 2.70
1.86 - 3.24 1.74 - 2.84 2.37 - 3.11F 0.07 0.07* 0.10*
bd - 0.30 bd - 0.20 bd - 0.30Cl 0.12 0.13* 0.13*
0.09 - 0.16 0.08 - 0.18 0.09 - 0.22Total 97.93 98.53 97.08
94.62 - 99.34 95.87 - 99.95 93.41 - 99.11Q 24.54 27.00 27.68Or 15.17 15.35 15.94Ab 22.37 20.26 19.50An 18.84 19.82 17.96Di 4.40 3.96 2.63Hy 5.36 4.67 6.01Il 1.94 1.83 2.15Mt 4.21 4.44 4.12Ap 0.44 0.44 0.44Hl 0.20 0.21 0.21Fl 0.10 0.10 0.14
bd = below detection limitsna = not analyzed for those samples* = number analyzed is less for this value

Al 2
O3
58 60 62 64 66 68
11
12
13
14
15
16
58 60 62 64 66 682
3
4
5
6
7
CaO
58 60 62 64 66 684
5
6
7
8
FeO
58 60 62 64 66 68
0
1
2
3
4
MgO
58 60 62 64 66 68
3
4
5
6
7
Na 2
O+
K 2O
Figure 9. Harker variation diagramsof melt inclusions grouped by occurrencein host. X-axis for plots is SiO2.All axes are in weight percent oxide.
Melt inclusions in CPX
Melt inclusions in OPX
Melt inclusions in plagioclase
Matrix glass
20

Al 2
O3
58 60 62 64 66 68
11
12
13
14
15
16
58 60 62 64 66 68
2
3
4
5
6
7
CaO
4
5
6
7
8
FeO
58 60 62 64 66 68 58 60 62 64 66 68
0
1
2
3
4
MgO
1977198619881989Matrix glass
58 60 62 64 66 683
4
5
6
7
Na 2
O+
K 2O
Figure 10. Harker variation diagramsof melt inclusions grouped by eruptionyear. X-axis for plots is SiO2. All axesare in weight percent oxide.
21
11
12
13
14
15
16
Al 2
O3
3
4
5
6
7
CaO
58 60 62 64 66 68
58 60 62 64 66 68
5
6
7
8
FeO
58 60 62 64 66 680
1
2
3
MgO
58 60 62 64 66 68
58 60 62 64 66 68
3
4
5
6
7
Na 2
O+
K 2O
CoreMiddleRim
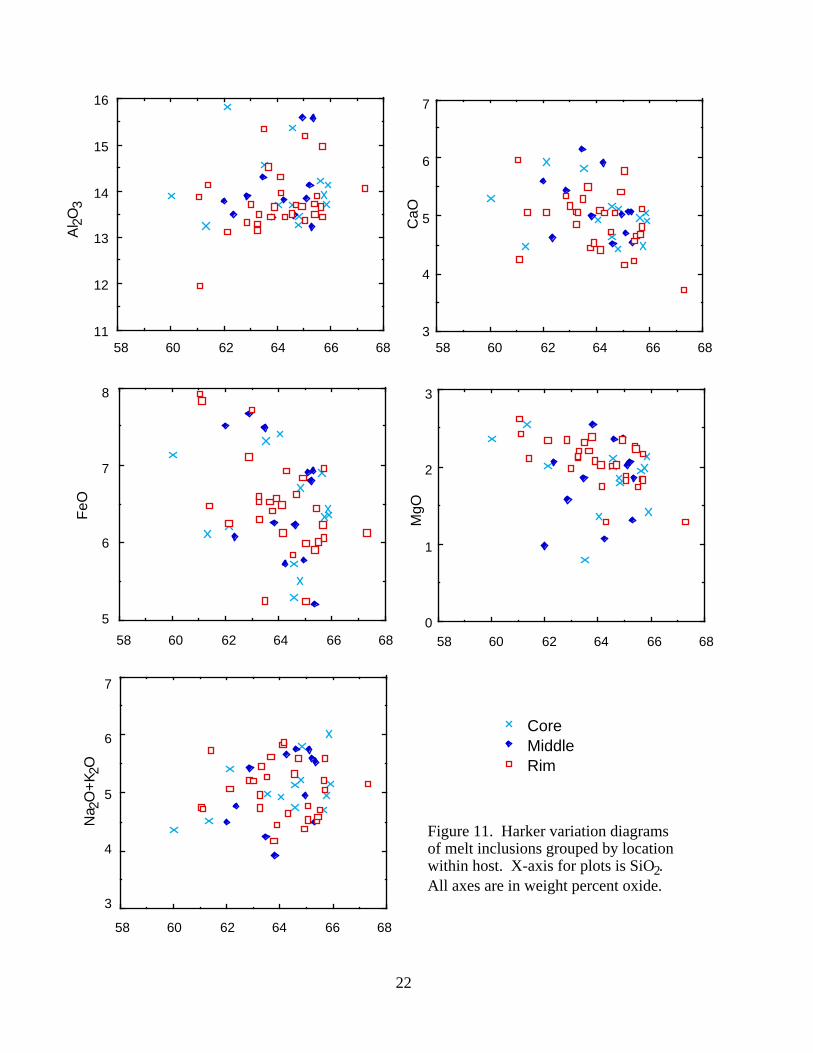
Figure 11. Harker variation diagramsof melt inclusions grouped by locationwithin host. X-axis for plots is SiO2.All axes are in weight percent oxide.
22

62 64 66 68
Al 2
O3
13
14
15
16
4
5
6
7
CaO
62 64 66 68
62 64 66 685
6
7
8
FeO
62 64 66 68
1
2
3
MgO
62 64 66 68
4
5
6
7
Na 2
O+
K 2O
Core
Middle
Rim
Figure 12. Harker variation diagramsof melt inclusions grouped by locationwithin a single phenocryst. X-axis forplots is SiO2. All axes are in weightpercent oxide.
23

11
12
13
14
15
16
17
Al 2
O3
58 60 62 64 66 68 70 722
3
4
5
6
7
CaO
58 60 62 64 66 68 70 72
58 60 62 64 66 68 70 72
0
2
4
6
8
10
FeO
58 60 62 64 66 68 70 720
1
2
3
4
5M
gO
58 60 62 64 66 68 70 722
3
4
5
6
7
Na 2
O+
K 2O
77/891991-Unhomogenized1991-Homogenized
Figure 13. Harker variation diagramsof melt inclusions grouped by phasetype. X-axis for plots is SiO2. Allaxes are in weight percent oxide.
24

25
605040302010000.00
0.01
0.02
0.03
Point
Wei
ght %
cop
per
PyroxenePyroxene
Glass
Figure 14. Electron microprobe traverse across a silicate melt inclusion and surrounding hostpyroxene showing concentrations of copper. The melt inclusion has an average copperconcentration of 240 ±10 ppm, while the pyroxene host has only background traces of copper.

26
Trace elements
Melt inclusion glass and matrix glass from the 1988 and 1989 samples were analyzed for
trace elements. The melt inclusions were hosted by orthopyroxene and plagioclase. Phenocrysts
adjacent to melt inclusions were analyzed for background trace element content in order to compare
melt inclusions trapped in different host minerals (Table 5). Trace element concentrations for the
inclusions show no variation as a function of host phase (Figure 15). Trace element concentrations
of matrix glass are similar to melt inclusion glass except that matrix glass lacks a positive Eu
anomaly. Flynn and Burnham (1978) showed that trivalent rare earth elements, especially Eu, are
fractionated into chlorine rich vapors relative to melt. This is consistent with the interpretation that
the matrix glass is degassed, as discussed below.
Volatiles
Volatile-component concentrations were determined in the same melt inclusions and matrix
glass that were analyzed for trace elements. The n/Si ratios are listed in Table 6, with n being the
negative ion of interest. Calculated volatile concentrations are also listed in Table 6, along with the
equations used to obtain those values. All values were calculated using equations appropriate for
mafic magmas, except those for water. Water concentrations were calculated for a melt containing
50 wt% SiO2, and these values were extrapolated to the silica concentration corresponding to the
glasses analyzed.
H2O contents (Figure 16) are consistently higher in the melt inclusions (0.27 - 0.89 wt%)
than in the matrix glass (0.07 - 0.20 wt%), suggesting that the matrix glass lost water during
eruption. In contrast, CO2 concentrations for melt inclusion glass (0.01 - 0.31 wt%) and matrix
glass (0.06 - 0.27 wt%) overlap, suggesting that CO2 was lost from the melt at depth, before the
melt was trapped as inclusions and before it was erupted onto the surface. The Cl- and F- contents
of matrix glass are highly variable, with some higher and some lower than melt inclusion
concentrations. Matrix glass generally has a lower S- concentration (0.3 - 58 ppm) compared to
melt inclusions (31 - 88 ppm), suggesting near-surface loss of sulfur from the melt (matrix glass)
during eruption. Melt inclusion values are within the range of sulfur reported for blocks and
bombs erupted in 1977 from White Island, which were generated from degassed magma and
contain between 30 and 250 ppm (as reported in Houghton and Nairn, 1989b). Most matrix glass
values are below the reported range for degassed blocks and bombs. The expected value for
andesites is 200 - 2000 ppm (Gill, 1981) which suggests that both melt inclusion glass and matrix
glass represent melt which has been degassed, although to different degrees, and thus yield low
and differing values of sulfur. However, if melt inclusion glass is degassed with respect to sulfur,

27
Table 5. Trace element concentrations in parts per million of melt inclusions and matrix glass asdetermined by ion microprobe.
ppm Melt inclusion inorthopyroxene
n=2
Melt inclusion inclinopyroxene
n=1
Melt inclusion inplagioclase
n=1
Matrix glass
n=1Ba 808 734 594 750Rb 58 56 29 47Nb 7 6 5 6La 14 14 12 14Ce 30 31 25 30Sr 135 115 172 144Be 1 2 2 1Nd 15 16 13 14Hf 6 6 3 6Zr 177 155 142 178Sm 3 5 6 4Eu 3 5 2 1Gd 4 5 3 3Ti 5377 4825 4463 5121Dy 4 8 5 5Er 2 2 3 3Y 21 28 22 22Yb 18 4 5 3Li 17 17 15 16Sc 30 33 17 15Cr 85 292 25 33

1
5
10
50
100
La Ce Pr Nd Sm Eu Gd Tb Dy Ho Er Tm Yb LuPm
Melt inclusion in OPX
Melt inclusion in OPX
Melt inclusion in CPX
Matrix glass
Melt inclusion inplagioclase
Chondrite
Norm
aliz
ed
Figure 15. Chondrite normalized REE profiles for melt inclusions and matrix glass, using values from Anders and Grevasse (1989). Patterns are similar for each glassindependent of host. Matrix glass shows a similar pattern except a lack of a positiveEu anomaly as discussed in text.
28

29
Table 6. Volatile concentrations of melt inclusions and matrix glass determined by the ion microprobe. Values in the upper portion of thetable are reported numbers from the probe. Values in the lower portion of the table are calculated weight percents according to listedequations. Reported water value is an interpolation between the listed mafic and silicic equations.
nx−
30Si−
Mi in1988 CPX
Mi in 1988CPX
Mi in 1988OPX
Mi in 1988OPX
MI in 1989Plag
1988Matrix
1988Matrix
1989Matrix
1989Matrix
1989Matrix
Cl 0.59 0.48 1.03 1.04 0.75 1.02 1.14E-03 1.02E-03 0.91 0.80F 0.55 0.49 0.83 0.87 0.42 0.92 0.02 0.02 0.84 0.74S 0.08 0.09 0.07 0.14 0.05 0.09 4.15E-04 4.80E-04 0.02 0.02C 4.33E-03 0.05 0.19 0.09 0.03 0.09 0.06 0.04 0.16 0.11H 0.45 0.44 1.04 0.57 0.32 0.18 0.01 4.79E-03 0.21 0.14
WeightPercent
Mi in1988 CPX
Mi in 1988CPX
Mi in 1988OPX
Mi in1988 OPX
MI in 1989Plag
1988Matrix
1988Matrix
1989Matrix
1989Matrix
1989Matrix
Cl 0.06 0.05 0.10 0.10 0.07 0.09 0.08 0.10 1.07E-04 9.63E-05F 0.05 0.04 0.07 0.08 0.04 0.08 0.07 0.08 1.72E-03 1.50E-03S 0.01 0.01 0.01 0.01 3.96E-03 1.31E-03 1.30E-03 0.01 3.35E-05 3.87E-05
CO2 0.01 0.08 0.31 0.15 0.05 0.27 0.19 0.14 0.11 0.06H2O 0.42 0.36 0.89 0.46 0.27 0.20 0.15 0.18 0.07 0.07
Cl(ppm) = 73635Cl−
30Si−
N
F(ppm) = 70019F−
30Si −
N
S(ppm) = 63032S−
30Si−
N
CO2(ppm) =1290712C−
30Si−
N
Silicic glass H 2O (wt%)= 0.103+0.3321H-
30Si-
N
+ 0.05441H-
30Si-
N
2
Mafic glass H2O (wt%) =0.039+0.556671H-
30Si-
N
+ 0.177871H-
30Si-
N
2
Where x
30Si−
N
=x
30Si−
×Si value in sample
50 (Si value for mafic magma )

0.00001
0.0001
0.001
0.01
0.1
1
10
H2O CO2 Cl F S
Wei
ght p
erce
nt
Melt inclusionglass
Matrix glass
Figure 16. Concentrations of volatiles for melt inclusion glass and matrix glass.Concentrations were determined using equations listed in Table 5.
30

31
there should be an accompanying depletion of Eu as seen with matrix glass, but there is not. This
suggests that the White Island magma may be anomalously low in sulfur. Elevated values of
sulfur in the blocks and bombs could be attributed to surface contamination if alteration was
present. Hedenquist et al.(1993) found that sulfur contents of altered rocks were an order of
magnitude higher than in fresh samples.
Temperature
Temperature was estimated graphically from the compositions of coexisting pyroxenes
(Lindsley, 1983). This method yielded a temperature of ~1100°C, which is within reasonable
agreement with homogenization temperatures of melt inclusions from the 1991 sample (1210°C).
According to Gill (1981) the temperature range for andesitic eruptions is 1050° to 1150°C, and the
experimentally determined temperature for the andesite liquidus is 1180° - 1250°C at atmospheric
pressure.
Pressure estimates from the graphical Lindsley method were not attained however, as the
compositions of the pyroxenes in this study are not on the pressure sensitive side (Fs-Hd) of the
pyroxene quadrangle.
Discussion
Conditions in the magma chamber
Although the years in which the samples were erupted from the magma chamber are
known, it was not possible to determine when the individual phenocrysts in each sample formed,
or when the solid and melt inclusions were trapped in the phenocrysts. Each phenocryst and its
contained melt and mineral inclusions is therefore considered to represent a random sampling of the
phases that were present in the magma chamber at some unknown location and time in the past.
Petrographic and electron microprobe data indicate that plagioclase, orthopyroxene and
clinopyroxene were the only three phases crystallizing during the unknown magma-residence time
represented by the ejecta. Each of the three phenocryst minerals occurs as solid (mineral)
inclusions in at least one other type of phenocryst, and the mineral inclusions have compositions
that are similar to the compositions of phenocrysts of that mineral in the same sample. The
compositions of plagioclase, orthopyroxene, and clinopyroxene are independent of their mode of
occurrence. That is, phenocrysts of a given phase have the same composition as solid inclusions
of that same phase. This is interpreted to indicate that all three minerals were in equilibrium and
precipitating from the melt at the same time. Moreover, since the phenocrysts and their contained

32
mineral and melt inclusions presumably represent trapping over some extended range of time and
location within the magma chamber, the data suggest that the magma chamber is relatively well
mixed and that crystallization has not significantly changed the composition of the melt over the
time period represented by the melt inclusions.
The relative chronology of trapping of melt or solid inclusions within a crystal can be
estimated based on the position within the crystal, with melt inclusions towards the core
presumably trapped earlier than those found near the edge. This interpretation obviously only
applies to primary inclusions trapped during growth of the crystal, and does not include any
secondary inclusions in the crystals. However, no significant change in melt chemistry as a
function of position with the crystal was observed for primary inclusions along growth zones.
Plagioclase inclusions, which show variable chemistry (Figure 6a), show no systematic change in
composition from cores to rims of phenocrysts (Figure 8).
As noted above, melt inclusions in the 1991 eruption sample are petrographically different
from the inclusions in earlier eruption samples. Specifically, the 1991 inclusions contain daughter
minerals, suggesting that the 1991 samples experienced a different P-T history than the other
samples. Possible scenarios that could result in a different P-T history might be a longer residence
time in the magma following entrapment, and/or a slower cooling history after entrapment (either in
the magma chamber or after eruption to the surface), and/or eruption from a different location
within the magma chamber. An alternative explanation for the presence of daughter minerals in the
1991 samples, and their absence from the other samples, is that the 1991 samples trapped a melt of
different composition. However, the composition of glass within homogenized melt inclusions
from the 1991 samples is similar to that of glass (melt) in the 1977-89 group of samples.
Calculations indicate that glass in unhomogenized multiphase melt inclusions from 1991 represents
the composition that the 1977-89 melt would have after 20% crystallization. In order to attain the
composition of the 1991 glass in unhomogenized inclusions through fractional crystallization
requires a crystal assemblage comprised of 42% plagioclase (An65), 31% clinopyroxene (En46,
Fs15, Wo39), 17% iron oxide, and 9% orthopyroxene (En71, Fs25, Wo4) (Table 7). These
proportions are different from modal relations estimated optically in thin section, which were 41%
orthopyroxene, 41% plagioclase, 15% clinopyroxene, and 2% iron oxides. However, modal
proportions of minerals observed in thin section may not be representative of modal proportions of
these phases in the entire magma chamber, but instead only the portion from which samples were
ejected.

33
Table 7. Calculation of fractionating assemblage to account for variation in major elementchemistry in melt inclusion compositions.
SiO2
TiO2
Al2O
3MgO CaO MnO FeO Na
2O K
2O
1977, 1986, 1988 and1989 average meltcomposition*
65.64 1.10 13.98 2.08 5.08 0.14 6.66 2.60 2.72
Average composition ofOPX
53.64 0.23 1.14 26.05 2.09 0.41 16.39 0.04 0.01
Average composition ofplagioclase
52.14 0.04 29.37 0.16 13.48 0.04 0.72 3.80 0.25
Average composition ofCPX
52.41 0.49 1.84 16.11 18.90 0.36 9.67 0.22 0.01
Average composition ofiron oxides
0.60 5.21 3.94 3.31 0.34 0.71 85.80 0.00 0.09
Composition of meltafter phenocrysts† weresubtracted
71.15 1.11 14.05 0.54 3.40 0.10 3.44 2.84 3.36
Average meltcomposition of 1991
71.90 1.05 15.46 0.95 3.21 0.07 2.26 2.17 2.92
*All compositions in this table have been normalized to 100 wt%.
†Calculation was with 20% phenocrysts crystallizing out of the combination melt.Of that 20%, the relative proportions of the phenocrysts subtracted to reachthe 1991 average composition is:Plagioclase 42%CPX 31%Iron-oxide 17%OPX 10%

34
Is there a porphyry copper deposit in White Island's future?
The generally accepted model for the formation of porphyry copper-type mineralization
involves the emplacement and crystallization of a hydrous silicic magma at shallow levels in the
earth's crust (Burnham, 1979, 1998). During crystallization, the water concentration of the melt
increases, eventually reaching saturation and resulting in the exsolution of a magmatic aqueous
phase. Chlorine, copper, and other metals would be partitioned into the magmatic aqueous phase
(Burnham, 1979; Candela, 1989; Bodnar, 1995). As a result of numerous theoretical,
experimental and field studies of the porphyry copper environment, we now have a fairly
comprehensive database of those features that are required, or are favorable, for the formation of
economic mineralization (c.f., Candela, 1989; Cline and Bodnar, 1991).
Although there appear to be genetic links between shallow high-sulfidation Cu-Au deposits
and deeper porphyry-style mineralization at places such as Red Mountain, Arizona (Bodnar and
Beane, 1980) and Lapanto-Far Southeast in the Philippines (Arribas et al., 1995), the timing of
formation of these two types of mineralization is not clear. Thus, although it has been suggested
that high-sulfidation Cu-Au mineralization may presently be forming in the shallow subsurface at
White Island (Hedenquist et al., 1993), it is also likely that the White Island system has not yet
reached the productive stages of porphyry copper formation. White Island has been an active
magmatic-hydrothermal system for only about 10,000 years (Giggenbach and Glasby, 1977). The
temperature of the magma derived from homogenization of silicate melt inclusions is estimated to
be about 1200°C and the magma chamber beneath White Island is probably still dominantly molten
(Houghton and Nairn, 1989b). Based on numerous field studies, as well as fluid inclusion and
stable isotope studies of porphyry copper deposits, it appears that the main stage of copper
mineralization occurs late in the magmatic history when most or all of the melt has crystallized.
Numerical models by Norton (1982) suggest that for a single emplacement of melt, it takes from
20,000 - 30,000 years for a 4 km tall pluton, with a diameter of 2 km, to cool below its solidus.
This, combined with observations form melt inclusions, suggests that at the present time the deeper
levels at White Island are not yet within the porphyry copper formation window.
If porphyry copper mineralization is not currently forming at depth at White Island, what is
the likelihood that such mineralization will develop in the future? If we assume that the melt found
in melt inclusions in this study is the same melt that will continue to evolve and eventually
crystallize to form an intrusive body at depth beneath White Island, we can compare the chemical
characteristics of the melt inclusions with observations from known porphyry copper deposits, as
well as with similar but barren intrusive rocks. Certainly the copper concentration of the melt is
sufficiently high to generate ore-forming fluids. Burnham (1998) has approximated the copper
concentration of porphyry copper parent magmas by showing that 32% melting of a normal

35
tholeiite containing 75 ppm copper will produce a melt with about 230 ppm copper, similar to the
values of 160 - 280 ppm found in melt inclusions from White Island, and much higher than the 50
ppm required to form economic concentrations of copper in various models for porphyry copper
formation (c.f., Candela, 1989; Cline and Bodnar, 1991). Moreover, simple melt-aqueous fluid
partition calculations (c.f., Bodnar, 1982; Burnham, 1998) show that copper concentrations in
magmatic fluids exsolved from such melts can have copper concentrations of thousands of ppm.
Feiss (1978) and Mason and Feiss (1979) have measured the Al2O3/(Na2O+K2O+CaO)
ratios of rocks from a number of productive and barren intrusives, including many from the
southwest Pacific region. They found that intrusive rocks associated with productive porphyry
systems have higher ratios than those associated with barren systems. More specifically, most
mineralized systems have ratios above about 1.3, whereas ratios lower than this are characteristic
of barren systems. Using the average concentrations of Al2O3, Na2O, K2O and CaO listed in Table
3, all of the melt inclusions have ratios ≥1.3, and the glass in the unhomogenized melt inclusions
from 1991 has a value of 1.9. If we consider this glass composition to represent the composition
that the melt will evolve towards with continued crystallization, the Al2O3/(Na2O+K2O+CaO) ratio
of the magma beneath White Island is characteristic of rocks associated with economic porphyry
copper mineralization elsewhere. Similarly, Urabe (1985) showed that the partitioning of metals
into the magmatic aqueous phase was higher for aluminous (corundum normative) melts than for
alkaline melts. The residual melt (glass) in the 1991 samples contains 3.9% normative corundum.
Based on Urabe's data, this melt has good potential to generate magmatic aqueous fluids with high
concentrations of metals.
Creasey (1984) compared the geochemistry of mineralized (Schultze Granite) to barren
(Tea Cup Granodiorite and Granite Basin Porphyry) Laramide stocks. Ratios of major element
cations showed a distinct division between mineralized and unmineralized stocks. Specifically,
stocks with a Si/(Si+Ca+Mg+Fet) ratio higher than 0.91 and a K/(K+Ca+Mg+Fet) higher than
0.36 were associated with mineralization, whereas all barren stocks had lower ratios. Melt
inclusions from the 1977-1989 samples have ratios that fall into the barren category. However, the
cation ratios of the unhomogenized fractionated melt inclusions from the 1991 sample have ratios
that are in the mineralized range. Assuming that the 1991 glass represents the composition to
which the melt in the magma chamber will evolve, White Island will fall in the productive intrusion
category.
Lang and Titley (1998) studied the geochemical and isotopic characteristics of a large
number of Laramide magmatic systems in the southwestern U.S. These workers noted that
productive intrusions show positive europium anomalies, whereas barren intrusions show negative
Eu anomalies. The melt inclusions from White Island (Figure 15) all show positive Eu anomalies,
again suggesting that the magma beneath White Island shows strong potential for forming

36
porphyry copper mineralization in the future. Fields of alkalinity of Laramide intrusions for barren
and productive intrusions overlapped, however data from this study plot within their field of
productive intrusions. It should be noted, however, that the Y-Mn systematics of the melt
inclusions at White Island are more characteristic of barren intrusions, according to the results of
Lang and Titley (1998, their Figure 8).
Candela (1989) and Cline and Bodnar (1991) have documented the importance of the initial
Cl/H2O ratio of the melt in terms of the ability of the magmatic aqueous fluid to extract metal from
the melt. The Cl/H2O ratio for melt inclusions at White Island is about 0.15, which is beyond the
range of data in either of the studies listed above. However, both papers note that the higher the
Cl/H2O, the more efficient the aqueous phase is in removing copper from the melt. Stated
differently, using data extrapolated from Figure 6 in Cline and Bodnar (1991), only about 5 km3 of
melt would be needed to produce a copper deposit containing 250 million tons of 0.75% copper
ore. For comparison, the size of the causative intrusive at the Yerington porphyry copper deposit
is about 65 km3. Thus, it appears that the Cl/H2O ratio of White Island melts will lead to very
efficient extraction of copper from the melt into the magmatic aqueous phase, and its subsequent
deposition in veins within and above the intrusion. It should also be noted that at the present time
pyrrhotite, amphibole, biotite or other phases that might serve as sinks for copper (Candela, 1989)
do not appear to be crystallizing at depth. In fact, the presence of magnetite in samples indicates an
fO2 value higher than the pyrrhotite stability field (Whitney, 1980). Also, melt inclusions from this
study indicate that the sulfur content in the melt is lower than in a typical andesitic melt. The low
sulfur content coupled with the apparent high fO2 conditions, results in iron being removed from
the melt as an oxide phase rather than a sulfide phase. This suggests that the copper concentration
in the melt will increase with crystallization history as non-copper-bearing phases are removed
from the melt.
Houghton and Nairn (1989b) have constructed a cross section of White Island based on
seismic, chemical and structural data, and estimate that the main portion of the magma chamber
occurs at a depth of ~3-4 km beneath White Island. With an average density of 2.4 to 2.8 g/cm3
for andesitic liquids and 2.4 to 2.9 g/cm3 for crust adjacent to andesitic volcanoes (Gill, 1981) the
pressure at that depth would be 720 - 1160. Candela and Piccoli (1995) report that the maximum
efficiency for partitioning copper into the aqueous phase occurs at 1 kbar. The efficiency decreases
at pressures above and below this value. Thus, the magma chamber at White Island is located at a
depth (pressure) ideal for maximum extraction of copper from the melt.
37
Recommendations
The ultimate goal of most minerals exploration companies is to be the first to discover an
ore district or a mineral occurrence with economic potential. White Island offers an extraordinary
opportunity for an adventurous mining company to secure future leases on a modern ore-forming
system that is likely to contain economic copper mineralization after magmatic hydrothermal
activity ceases in 20,000 - 30,000 years. The tectonic environment, near-surface gas and water
chemistry, and deep melt chemistry (as evidenced by melt inclusions) all show features that are
characteristic of metal-rich hydrothermal systems and economic porphyry copper deposits. So,
explorationists, grab your claim stakes and head on out to White Island!

38
References
Anders, E., and Grevasse, N., 1989. Abundances of the elements: Meteoric and solar.
Geochimica et Cosmochimica Acta, v. 53: 197-214.
Anderson, A.T., Jr., 1983. Oscillatory zoning of plagioclase: Nomarski interference contrast
microscopy of etched polished sections. American Mineralogist, v. 68: 125-129.
Arribas, A., Hedenquist, J.W., Itaya, T., Okada, T., Concepción, R.A., Garcia, J.S., 1995.
Contemporaneous formation of adjacent porphyry and epithermal Cu-Au deposits over 300
ka in northern Luzon, Philippines. Geology, v. 23, no. 4: 337-340.
Beane, R.E., 1982. Hydrothermal alteration in silicate rocks, in Titley, S.R., ed., Advances in
geology of the porphyry copper deposits of Southwestern North America: Tucson,
University of Arizona Press, pp. 117-137.
Beane, R.E., and Titley, S.R., 1981. Porphyry copper deposits. Part II. Hydrothermal alteration
and mineralization. Economic Geology, 75th Anniversary Volume: 235-263.
Black , P.M., 1970. Observations on White Island volcano, New Zealand. Bulletin of
Volcanology, v. 34: 158-167.
Bodnar, R.J., 1982. Fluid inclusions in porphyry-type deposits in Mineral Deposits Research
Review for Industry Course Notes: University Park, The Pennsylvania State University,
pp. RB1-25.
Bodnar, R.J., 1995. Fluid-inclusion evidence for a magmatic source for metals in porphyry
copper deposits. Mineralogical Association of Canada Short Course Handbooks, v. 23:
139-152.
Bodnar, R.J., and Beane, R.E., 1980. Temporal and spatial variations in hydrothermal fluid
characteristics during vein filling in preore cover overlying deeply buried porphyry copper
type mineralization at Red Mountain, Arizona. Economic Geology, v. 75: 876-893.

39
Bodnar, R.J., and Beane, R.E., 1995. Hydrothermal fluids and hydrothermal alteration in
porphyry copper deposits in Pierce, F.W., and Bohm, J.G., eds., Porphyry Copper
Deposits of the American Cordillera. Arizona Geological Society Digest 20, Tucson,
Arizona, pp. 83-93.
Burnham, C.W., 1979. Magmas and hydrothermal fluids, in Barnes, H.L., ed., Geochemistry of
Hydrothermal Ore Deposits, 2nd edition. New York, J. Wiley and Sons. pp. 71-136.
Burnham, C.W., 1998. Magmas and hydrothermal fluids, in Barnes, H.L., ed., Geochemistry of
Hydrothermal Ore Deposits, 3rd edition. New York, J. Wiley and Sons. pp.63-123.
Candela, P.A., 1989. Magmatic ore-forming fluids: Thermodynamic and mass transfer
calculations of metal concentrations, in Whitney, J.A., and Naldrett, A.J., eds., Ore
Deposition Associated with Magmas. Reviews in Economic Geology, v. 4, Economic
Geology, El Paso, TX, pp. 223-233.
Candela, P.A., and Piccoli, P.M., 1995. Model ore-metal partitioning from melts into vapor and
vapor/brine mixtures. Mineralogical Association of Canada Short Course Handbooks, v.
23: 101-127.
Clark, R.H., and Cole, J.W., 1989. Volcanic monitoring and surveillance at White Island before
the 1976-82 eruption sequence. New Zealand Geological Survey Bulletin, v. 103: 9-11.
Cline, J.S. and Bodnar, R.J., 1991. Can economic porphyry copper mineralization be generated
by a typical calc-alkaline melt? Journal of Geophysical Research, v. 96: 8113-8126.
Cole, J.W. and Nairn, I.A., 1975. Catalogue of the active volcanoes of the world including
Solfatara fields. Part 22: New Zealand. International Association of Volcanology and
Chemistry of the Earth’s Interior, Naples.
Creasey, S.C., 1984. The Schultze Granite, the Tea Cup Granodiorite, and the Granite Basin
Porphyry: A geochemical comparison of mineralized and unmineralized stocks in southern
Arizona. USGS Professional Paper 1303, 41 pp.
Dickinson, W.R. and Hatherton, T., 1967. Andesitic volcanism and seismicity around the Pacific.
Science, v. 157: 801-803.

40
Feiss, P.G., 1978. Magmatic sources of copper in porphyry copper deposits. Economic
Geology, v. 73: 397-404.
Flynn, R.T. and Burnham, C.W., 1978. An experimental determination of rare earth partition
coefficients between a chloride containing vapor phase and silicate melts. Geochimica et
Cosmochimica Acta, v. 42: 685-701.
Giggenbach, W.F., 1987. Redox processes governing the chemistry of fumarolic gas discharges
from White Island, New Zealand. Applied Geochemistry., v. 2: 143-161.
Giggenbach, W.F. and Glasby, C., 1977. The influence of thermal activity on the trace metal
distribution in marine sediments around White Island, New Zealand. New Zealand
Department of Science and Industry Research Bulletin, v. 218: 121-126.
Giggenbach, W.F. and Sheppard, D.S., 1989. Variations in the temperature and chemistry of
White Island fumarole discharges 1972-85. New Zealand Geological Survey Bulletin, v.
103: 119-126.
Gill, J.B., 1981. Orogenic andesites and plate tectonics. Berlin, Springer Verlag. 390 pp.
Hamilton, R.M., and Gale, A.W., 1968. Seismicity and structure of North Island, New Zealand.
Journal of Geophysical Research, v. 73: 3859-3876.
Hedenquist, J.W., and Lowenstern, J.B., 1994. The role of magmas in the formation of
hydrothermal ore deposits. Nature, v. 370: 519-526.
Hedenquist, J.W., Simmons, S.F., Giggenbach, W.F., and Eldridge, C.S., 1993. White Island,
New Zealand, volcanic-hydrothermal system represents the geochemical environment of
high-sulfidation Cu and Au ore deposition. Geology, v. 21: 731-734.
Houghton, B.F. and Nairn, I.A., 1989a. The phreatomagmatic and Strombolian eruption events
at White Island volcano 1976-82: eruption narrative. New Zealand Geological Survey
Bulletin, v. 103: 13-23.

41
Houghton, B.F. and Nairn, I.A., 1989b. A model for the 1976-82 phreatomagmatic and
strombolian eruption sequence at White Island volcano, New Zealand. New Zealand
Geological Survey Bulletin, v. 103: 127-136.
Houghton, B.F. and Nairn, I.A., 1991. The 1976-1982 Strombolian and phreatomagmatic
eruptions of White Island, New Zealand: eruptive and depositional mechanisms at a ‘wet’
volcano. Bulletin of Volcanology, v. 54: 25-49.
Isacks, B., Oliver, J., and Sykes, L.R., 1968. Seismology and the new global tectonics. Journal
of Geophysical Research, v. 73: 5585-5899.
Lang, J.R., and Titley, R.T., 1998. Isotopic and geochemical characteristics of Laramide
magmatic systems in Arizona and implications for the genesis of porphyry copper deposits.
Economic Geology, 93: 138-170.
Le Cloarec, M. F., Allard, P., Ardouin, B., Giggenbach, W.F., and Sheppard, D.S., 1992.
Radioactive isotopes and trace elements in gaseous emissions from White Island, New
Zealand. Earth and Planetary Science Letters, v. 108: 19-28.
Lindsley, D.H., 1983. Pyroxene thermometry. American Mineralogist, v. 68: 477-493.
Mason, D.R. and Feiss, P.G., 1979. On the relationship between whole rock chemistry and
porphyry copper mineralization. Economic Geology, v. 74: 1506-1510.
Morimoto, M., 1988. Nomenclature of pyroxenes. Mineralogical Magazine, v. 52: 535-550.
Norton, D., 1982. Fluid and heat transport phenomena typical of copper-bearing pluton
environments: Southwestern Arizona, in Titley, S.R. ed., Advances in geology of the
porphyry copper deposits of Southwestern North America: Tucson, University of Arizona
Press, pp. 59-72.
Pouchou, J.L. and Pichoir, F., 1985. “PAP” Procedure for improved quantitative microanalysis.
Microbeam Analysis, v. 20: 104-105.
Rose, W.I., Chuan, R.L., Giggenbach, W.F., Kyle, P.R., and Symonds, R.B., 1986. Rates of
sulfur dioxide and particle emissions from White Island Volcano, New Zealand, and an
42
estimate of the total flux of major gaseous species. Bulletin of Volcanology, v. 48: 181-
188.
Sawkins, F.J., 1984. Metal deposits in relation to plate tectonics. Springer-Verlag, Berlin.
Tedesco, D., and Toutain, J.P., 1991. Chemistry and emission rate of volatiles from White Island
Volcano (New Zealand). Geophysics Research Letters., v. 8, no. 1: 113-116.
Urabe, T., 1985. Aluminous granite as a source magma of hydrothermal ore deposits: An
experimental study. Economic Geology, v. 80: 148-157.
Whitney, J.A., 1980. Volatiles in magmatic systems in Henley, R.W., Truesdell, A.H., and
Barton, P.B.Jr., Fluid-mineral equilibria in hydrothermal systems. Reviews in Economic
Geology, v. 1, Economic Geology, El Paso, TX, pp. 155-175.
Wood, C.P. and Browne, P.R.L., 1996. Chlorine-rich pyrometamorphic magma at White Island
volcano, New Zealand. Journal of Volcanology and Geothermal Research, v. 72: 21-35.
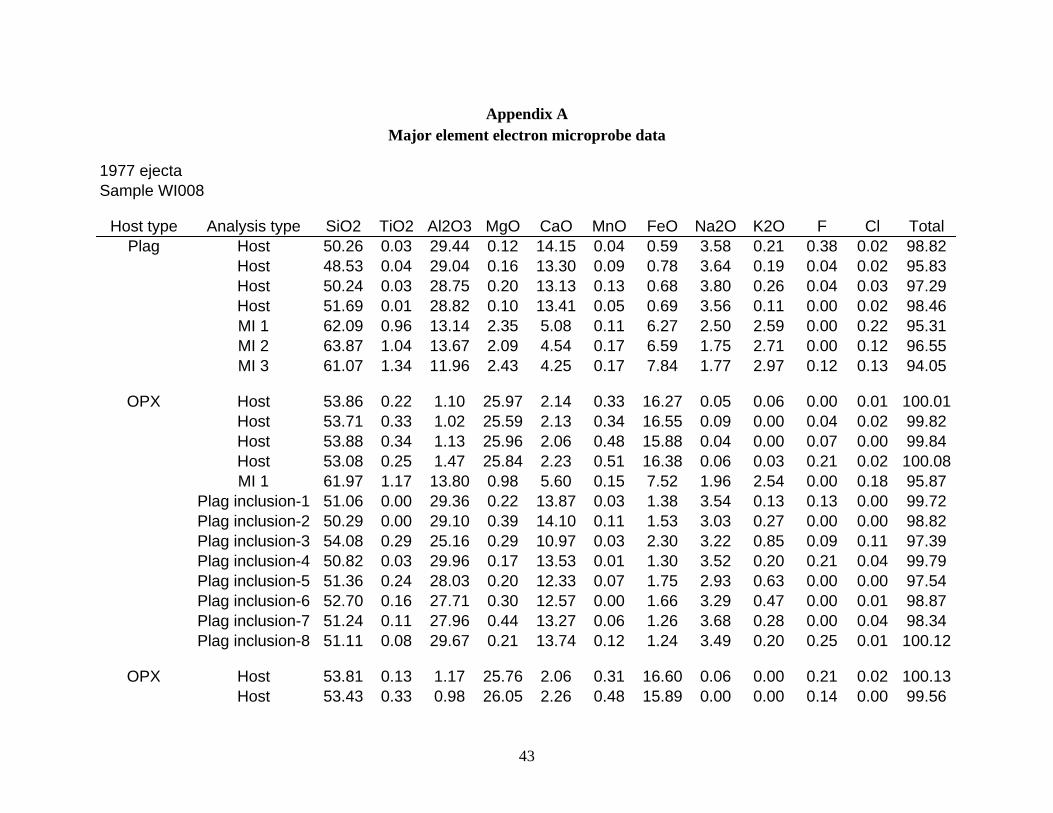
Appendix AMajor element electron microprobe data
1977 ejectaSample WI008
Host type Analysis type SiO2 TiO2 Al2O3 MgO CaO MnO FeO Na2O K2O F Cl TotalPlag Host 50.26 0.03 29.44 0.12 14.15 0.04 0.59 3.58 0.21 0.38 0.02 98.82
Host 48.53 0.04 29.04 0.16 13.30 0.09 0.78 3.64 0.19 0.04 0.02 95.83Host 50.24 0.03 28.75 0.20 13.13 0.13 0.68 3.80 0.26 0.04 0.03 97.29Host 51.69 0.01 28.82 0.10 13.41 0.05 0.69 3.56 0.11 0.00 0.02 98.46MI 1 62.09 0.96 13.14 2.35 5.08 0.11 6.27 2.50 2.59 0.00 0.22 95.31MI 2 63.87 1.04 13.67 2.09 4.54 0.17 6.59 1.75 2.71 0.00 0.12 96.55MI 3 61.07 1.34 11.96 2.43 4.25 0.17 7.84 1.77 2.97 0.12 0.13 94.05
OPX Host 53.86 0.22 1.10 25.97 2.14 0.33 16.27 0.05 0.06 0.00 0.01 100.01Host 53.71 0.33 1.02 25.59 2.13 0.34 16.55 0.09 0.00 0.04 0.02 99.82Host 53.88 0.34 1.13 25.96 2.06 0.48 15.88 0.04 0.00 0.07 0.00 99.84Host 53.08 0.25 1.47 25.84 2.23 0.51 16.38 0.06 0.03 0.21 0.02 100.08MI 1 61.97 1.17 13.80 0.98 5.60 0.15 7.52 1.96 2.54 0.00 0.18 95.87
Plag inclusion-1 51.06 0.00 29.36 0.22 13.87 0.03 1.38 3.54 0.13 0.13 0.00 99.72Plag inclusion-2 50.29 0.00 29.10 0.39 14.10 0.11 1.53 3.03 0.27 0.00 0.00 98.82Plag inclusion-3 54.08 0.29 25.16 0.29 10.97 0.03 2.30 3.22 0.85 0.09 0.11 97.39Plag inclusion-4 50.82 0.03 29.96 0.17 13.53 0.01 1.30 3.52 0.20 0.21 0.04 99.79Plag inclusion-5 51.36 0.24 28.03 0.20 12.33 0.07 1.75 2.93 0.63 0.00 0.00 97.54Plag inclusion-6 52.70 0.16 27.71 0.30 12.57 0.00 1.66 3.29 0.47 0.00 0.01 98.87Plag inclusion-7 51.24 0.11 27.96 0.44 13.27 0.06 1.26 3.68 0.28 0.00 0.04 98.34Plag inclusion-8 51.11 0.08 29.67 0.21 13.74 0.12 1.24 3.49 0.20 0.25 0.01 100.12
OPX Host 53.81 0.13 1.17 25.76 2.06 0.31 16.60 0.06 0.00 0.21 0.02 100.13Host 53.43 0.33 0.98 26.05 2.26 0.48 15.89 0.00 0.00 0.14 0.00 99.56
43

Host type Analysis type SiO2 TiO2 Al2O3 MgO CaO MnO FeO Na2O K2O F Cl TotalHost 54.02 0.25 1.12 25.78 2.07 0.45 15.76 0.02 0.00 0.18 0.00 99.65
Plag inclusion-1 52.32 0.09 27.82 0.20 12.11 0.03 1.94 3.87 0.39 0.17 0.05 98.99Plag inclusion-2 50.87 0.05 29.16 0.18 13.78 0.03 1.47 3.30 0.20 0.04 0.05 99.13Plag inclusion-3 51.35 0.12 28.71 0.49 13.36 0.12 1.59 3.19 0.20 0.13 0.02 99.28Plag inclusion-4 53.39 0.15 26.59 0.24 12.77 0.05 1.85 2.97 0.48 0.25 0.03 98.77Plag inclusion-5 50.63 0.09 27.04 1.69 12.99 0.06 2.02 3.20 0.29 0.00 0.04 98.05Plag inclusion-6 51.91 0.01 28.13 0.25 13.86 0.05 1.30 3.41 0.30 0.30 0.02 99.54Plag inclusion-7 48.67 0.05 29.45 0.13 13.89 0.00 1.51 3.51 0.20 0.09 0.00 97.50Plag inclusion-8 50.53 0.04 29.37 0.19 13.90 0.00 1.48 3.30 0.19 0.17 0.01 99.18Plag inclusion-9 50.66 0.12 28.89 0.73 13.61 0.01 1.43 3.04 0.34 0.00 0.00 98.83
Plag inclusion-10 51.74 0.03 28.88 0.16 12.69 0.00 1.37 3.93 0.22 0.00 0.00 99.02Plag inclusion-11 50.87 0.00 29.63 0.24 14.12 0.00 1.16 3.27 0.12 0.00 0.02 99.43
OPX Host 53.56 0.09 0.94 26.22 1.86 0.48 16.97 0.02 0.00 0.07 0.00 100.21Host 51.73 0.15 1.19 26.09 1.90 0.35 15.84 0.04 0.01 0.14 0.02 97.46Host 53.82 0.14 1.08 25.81 2.01 0.39 15.48 0.04 0.00 0.07 0.00 98.84MI 1 64.77 0.68 13.47 1.81 5.12 0.13 6.72 3.05 2.76 0.00 0.11 98.62MI 2 65.28 1.14 13.22 1.31 5.08 0.17 6.94 1.75 2.74 0.20 0.08 97.91MI 3 64.27 0.90 13.45 1.30 5.05 0.29 6.94 1.82 2.84 0.20 0.14 97.20MI 4 64.01 1.02 13.71 1.37 4.94 0.16 7.42 2.15 2.79 0.00 0.10 97.67
Plag inclusion-1 50.34 0.00 29.05 0.23 13.06 0.05 1.28 3.74 0.15 0.00 0.03 97.93Plag inclusion-2 54.71 0.14 26.09 0.85 11.30 0.14 2.35 3.53 0.56 0.04 0.00 99.71
OPX* Host 54.33 0.33 1.23 26.45 1.87 0.38 16.43 0.00 0.03 0.12 0.01 101.18
Plag* Host 52.58 0.03 28.92 0.15 13.45 0.02 0.66 3.78 0.23 0.07 0.00 99.89Host 52.34 0.03 29.38 0.17 13.81 0.00 0.85 3.93 0.26 0.04 0.00 100.81MI 1 65.75 1.28 12.54 2.13 4.44 0.11 6.27 3.10 3.07 0.17 0.10 98.96MI 2 65.21 1.27 11.53 2.31 4.08 0.05 6.76 2.85 3.07 0.00 0.13 97.26MI 3 66.12 1.32 11.51 2.19 4.25 0.13 7.20 3.13 2.95 0.17 0.14 99.11
44

Host type Analysis type SiO2 TiO2 Al2O3 MgO CaO MnO FeO Na2O K2O F Cl TotalMI 4 65.65 1.60 11.30 2.22 4.25 0.19 7.56 2.70 3.11 0.00 0.19 98.77MI 5 64.52 1.35 12.27 2.26 4.59 0.14 7.42 2.99 2.98 0.07 0.17 98.76MI 6 64.91 1.41 11.95 2.21 4.47 0.14 7.21 2.73 3.04 0.07 0.15 98.29
OPX* Host 53.25 0.19 1.07 26.59 1.82 0.31 16.76 0.00 0.00 0.09 0.00 100.08Host 54.58 0.17 1.15 26.22 1.70 0.34 17.10 0.00 0.00 0.18 0.02 101.46
Matrix* Matrix glass 66.30 1.27 12.89 1.29 3.78 0.09 6.39 3.09 3.26 0.03 0.10 98.49Matrix glass 66.74 1.25 12.87 1.38 3.73 0.15 6.29 2.67 3.20 0.07 0.10 98.45Matrix glass 66.90 1.22 13.19 1.02 3.41 0.07 6.26 2.46 3.33 0.00 0.12 97.98Iron oxide 0.24 9.36 3.15 3.03 0.16 0.67 76.34 0.00 0.08 0.11 0.01 93.15Iron oxide 9.55 8.58 4.46 2.11 0.52 0.42 68.33 0.38 0.43 0.23 0.04 95.05
1986 ejectaSample - 86 0210
Plag* Host 52.34 0.05 28.99 0.19 13.16 0.00 0.60 3.56 0.28 0.18 0.01 99.36Host 51.58 0.02 29.50 0.12 13.81 0.00 0.65 3.54 0.26 0.00 0.00 99.48Host 53.14 0.00 28.92 0.16 12.88 0.00 0.73 4.03 0.25 0.14 0.02 100.27MI 1 63.51 1.01 14.16 2.31 5.02 0.13 5.79 2.89 2.51 0.24 0.11 97.68MI 2 62.87 1.08 14.02 2.29 5.23 0.05 6.45 2.50 2.59 0.30 0.13 97.51MI 3 63.23 1.19 14.07 2.22 5.23 0.08 6.06 2.53 2.53 0.14 0.12 97.40MI 4 63.99 1.00 14.27 2.16 4.82 0.08 6.22 2.78 2.58 0.30 0.09 98.29MI 5 64.10 1.00 13.99 2.14 4.81 0.06 5.88 2.78 2.53 0.07 0.18 97.54MI 6 63.34 1.01 13.86 2.18 5.27 0.05 5.89 3.00 2.57 0.03 0.12 97.32MI 7 63.98 0.98 14.24 2.09 5.02 0.18 5.91 2.87 2.62 0.07 0.10 98.06MI 8 63.62 1.16 14.17 1.96 4.55 0.08 5.45 2.96 2.68 0.00 0.09 96.72
CPX* Host 52.97 0.52 1.67 16.23 19.55 0.39 9.68 0.23 0.01 0.03 0.00 101.28Host 52.71 0.48 1.77 16.40 19.46 0.30 9.08 0.22 0.01 0.10 0.00 100.53MI 1a 64.20 1.14 13.57 2.01 5.34 0.06 6.12 2.95 2.48 0.17 0.11 98.15
45

Host type Analysis type SiO2 TiO2 Al2O3 MgO CaO MnO FeO Na2O K2O F Cl TotalMI 1b 64.59 1.16 13.36 2.11 5.14 0.08 6.15 2.84 2.52 0.14 0.13 98.22MI 2 63.80 1.04 13.52 2.18 5.38 0.05 6.40 3.01 2.31 0.10 0.12 97.91MI 3 63.60 1.12 13.47 2.26 5.55 0.11 6.80 2.77 2.32 0.30 0.12 98.42MI 2 63.35 1.07 13.48 2.18 5.20 0.14 6.88 3.08 2.30 0.07 0.12 97.87MI 4 63.42 1.13 13.52 2.10 5.31 0.12 6.31 3.02 2.50 0.03 0.11 97.57MI 5 64.29 1.20 13.49 2.13 5.16 0.02 6.17 2.87 2.45 0.14 0.13 98.05
OPX* Host 54.44 0.20 0.97 26.54 2.00 0.38 16.45 0.00 0.00 0.03 0.00 101.01MI 1 64.05 0.95 13.76 2.31 5.21 0.21 6.55 3.02 2.39 0.03 0.11 98.59
Matrix* Matrix glass 61.69 1.05 14.08 2.67 5.81 0.18 6.22 3.37 2.37 0.00 0.08 97.52Matrix glass 63.57 1.01 13.98 2.54 5.86 0.06 6.11 3.18 2.34 0.03 0.11 98.79Matrix glass 63.25 0.98 14.38 2.23 5.35 0.10 5.68 3.13 2.56 0.20 0.10 97.96Matrix glass 62.77 1.00 14.03 2.39 5.72 0.08 6.02 2.98 2.33 0.00 0.12 97.44Matrix glass 62.67 1.05 14.17 2.50 5.56 0.13 6.21 3.21 2.34 0.17 0.11 98.12Matrix glass 62.37 1.10 14.27 2.50 5.57 0.04 6.49 3.28 2.41 0.20 0.13 98.36
1988 ejectaSample 880325
CPX Host 51.33 0.43 2.01 16.35 18.99 0.35 9.84 0.22 0.02 0.05 0.01 99.60Host 52.03 0.53 1.98 16.10 19.66 0.33 10.08 0.24 0.05 0.07 0.00 101.07Host 52.66 0.45 2.05 16.25 19.03 0.41 9.56 0.26 0.02 0.10 0.00 100.79MI1a 64.63 0.83 13.71 2.04 5.06 0.14 6.64 2.95 2.66 0.14 0.10 98.90MI1b 64.10 1.03 14.31 2.04 5.11 0.17 6.51 2.96 2.88 0.12 0.11 99.34MI1c 61.34 0.96 14.16 2.12 5.07 0.16 6.49 2.96 2.79 0.02 0.11 96.18MI 2 62.84 1.15 13.35 2.36 5.36 0.19 7.12 2.86 2.37 0.05 0.12 97.77MI 3 62.97 1.20 13.74 1.99 5.19 0.20 7.73 2.92 2.29 0.00 0.14 98.37MI 4 64.11 0.96 13.97 1.76 4.43 0.14 6.15 2.98 2.91 0.00 0.10 97.51MI 5 63.23 0.88 13.52 2.22 5.08 0.15 6.31 2.79 2.68 0.00 0.11 96.97MI 6 65.44 0.87 13.91 1.75 4.67 0.12 6.02 1.79 2.93 0.00 0.09 97.59
46

Host type Analysis type SiO2 TiO2 Al2O3 MgO CaO MnO FeO Na2O K2O F Cl TotalMI 7 61.02 1.30 13.89 2.63 5.97 0.21 7.94 2.91 1.86 0.00 0.11 97.84
Plag inclusion 1a 51.23 0.17 24.34 3.08 14.79 0.15 2.79 3.23 0.17 0.02 0.00 99.97Plag inclusion 1b 52.71 0.15 26.08 2.07 14.27 0.10 1.92 3.39 0.16 0.11 0.00 100.96Plag inclusion 2 55.19 0.26 27.32 0.56 12.31 0.10 2.39 3.02 0.61 0.04 0.02 101.82
OPX Host 54.67 0.34 1.16 25.99 2.14 0.48 17.35 0.06 0.01 0.09 0.01 102.30Host 54.16 0.28 1.18 26.05 2.16 0.54 17.45 0.03 0.03 0.13 0.00 102.01MI 1 63.63 0.85 14.54 2.22 5.51 0.12 6.54 3.02 2.61 0.05 0.17 99.26MI 2 65.65 0.76 14.98 1.84 5.12 0.18 6.07 2.28 2.77 0.14 0.16 99.95MI 3 65.87 1.04 14.16 1.43 4.92 0.15 6.37 2.46 2.71 0.17 0.13 99.41MI 4 65.10 1.07 13.86 2.02 4.70 0.16 6.92 3.13 2.62 0.00 0.13 99.71MI 5 64.60 1.01 13.49 2.36 4.53 0.16 6.24 3.18 2.59 0.07 0.11 98.34MI 6 65.01 0.76 15.21 1.83 5.78 0.12 6.00 1.79 2.76 0.09 0.15 99.50MI 7 65.59 1.14 14.24 1.95 4.98 0.26 6.92 2.10 2.62 0.00 0.11 99.91
Plag inclusion 1 55.96 0.37 25.36 0.79 11.30 0.07 3.08 3.37 0.70 0.05 0.03 101.08Plag inclusion 2 55.48 0.30 24.99 1.17 11.33 0.08 2.71 3.33 0.59 0.00 0.02 100.00
CPX Host 52.27 0.49 1.92 17.33 19.51 0.32 7.92 0.24 0.00 0.02 0.00 100.02MI 1a 59.99 1.11 13.91 2.37 5.31 0.20 7.14 2.00 2.36 0.12 0.11 94.62MI 1b 62.09 0.89 15.83 2.03 5.94 0.23 6.23 3.09 2.33 0.00 0.12 98.78MI 2 63.45 0.70 15.35 2.33 5.30 0.16 5.27 2.28 3.00 0.00 0.13 97.97MI 3 64.53 0.89 15.37 2.01 5.17 0.16 5.73 2.34 2.81 0.00 0.14 99.15MI 4 64.92 0.89 15.60 2.37 5.03 0.13 5.78 2.18 2.78 0.00 0.15 99.83MI 5 65.35 0.86 15.57 1.86 4.55 0.18 5.22 2.30 3.24 0.02 0.16 99.31
Plag inclusion 1a 52.09 0.05 29.31 0.32 13.53 0.07 0.98 3.73 0.31 0.00 0.00 100.39Plag inclusion 1b 52.21 0.05 29.86 0.20 13.08 0.08 0.99 3.74 0.25 0.00 0.00 100.46Plag inclusion 1c 51.13 0.09 28.92 0.17 13.03 0.07 0.81 3.60 0.28 0.05 0.00 98.15Plag inclusion 2a 49.98 0.07 30.36 0.19 14.55 0.09 1.00 3.00 0.16 0.14 0.00 99.54Plag inclusion 2b 49.72 0.07 31.58 0.18 15.32 0.10 0.91 2.61 0.18 0.02 0.00 100.69Plag inclusion 3a 52.35 0.10 28.89 0.84 13.71 0.05 1.31 3.22 0.37 0.00 0.01 100.85
47

Host type Analysis type SiO2 TiO2 Al2O3 MgO CaO MnO FeO Na2O K2O F Cl TotalPlag inclusion 3b 52.02 0.04 30.37 0.19 13.90 0.13 1.01 3.47 0.28 0.00 0.00 101.41Plag inclusion 4a 51.49 0.09 28.69 0.81 13.96 0.15 1.35 3.49 0.28 0.00 0.00 100.31Plag inclusion 4b 52.48 0.05 29.94 0.18 13.35 0.06 0.97 3.70 0.28 0.00 0.00 101.01
Matrix Matrix glass 64.18 1.00 14.11 2.42 5.64 0.20 6.17 3.25 2.55 0.07 0.11 99.70Matrix glass 64.38 1.09 14.13 2.50 5.73 0.19 6.44 3.05 2.40 0.14 0.12 100.17Matrix glass 64.86 0.97 14.57 2.35 5.47 0.22 6.18 3.13 2.54 0.00 0.06 100.35Matrix glass 64.53 1.09 14.34 2.45 5.36 0.22 6.38 3.20 2.56 0.00 0.07 100.20Matrix glass 65.06 1.15 14.48 2.39 5.04 0.16 6.04 3.24 2.45 0.05 0.08 100.14
Plag 52.36 0.07 29.93 0.17 13.63 0.02 0.86 3.75 0.31 0.07 0.00 101.17Plag 53.58 0.08 29.48 0.19 13.20 0.08 0.71 3.87 0.31 0.00 0.00 101.50
1989 ejectaSample 891129
OPX Host 55.09 na 1.15 25.92 1.86 0.67 16.83 0.08 0.00 na na 101.60Host 53.76 na 1.23 27.14 2.06 0.55 18.38 0.08 0.00 na na 103.20Host 54.44 na 1.12 25.84 2.37 0.35 17.40 0.00 0.00 na na 101.52Host 53.19 na 0.82 26.42 2.04 0.64 16.06 0.00 0.00 na na 99.17Host 53.07 na 1.29 26.97 2.42 0.38 17.67 0.08 0.05 na na 101.93Host 53.52 na 1.28 26.81 2.00 0.20 16.80 0.11 0.05 na na 100.77Host 55.72 na 1.22 26.24 2.60 0.17 17.27 0.00 0.03 na na 103.26Host 54.41 na 1.10 26.29 2.24 0.64 16.41 0.11 0.00 na na 101.20Host 54.99 na 1.33 26.32 2.38 0.44 17.09 0.02 0.00 na na 102.57Host 54.80 na 1.10 26.32 2.29 0.38 16.49 0.08 0.00 na na 101.45MI 1 63.47 na 14.31 1.85 6.15 0.15 7.49 2.49 1.74 na na 97.64MI 2 64.22 na 13.82 1.07 5.91 0.30 5.74 2.99 2.68 na na 96.72MI 3 62.85 na 13.90 1.58 5.44 0.00 7.68 2.87 2.55 na na 96.86MI 4 63.48 na 14.58 0.81 5.82 0.12 7.32 2.55 2.45 na na 97.13
Plag inclusion 1 49.91 na 27.06 0.13 13.56 0.00 1.29 2.43 0.21 na na 94.60
48

Host type Analysis type SiO2 TiO2 Al2O3 MgO CaO MnO FeO Na2O K2O F Cl TotalPlag inclusion 2 51.25 na 30.40 0.12 14.51 0.00 1.58 3.69 0.23 na na 101.78Plag inclusion 3 50.93 na 31.02 0.18 14.28 0.00 1.43 3.36 0.11 na na 101.32Plag inclusion 4 51.21 na 28.90 0.20 12.90 0.00 1.33 3.65 0.19 na na 98.39Plag inclusion 5 51.26 na 30.01 0.13 14.60 0.00 1.58 3.44 0.17 na na 101.20Plag inclusion 6 51.69 na 29.65 0.46 13.50 0.12 1.73 3.79 0.37 na na 101.30Plag inclusion 7 51.55 na 29.64 0.22 13.76 0.24 1.73 3.48 0.23 na na 100.86Plag inclusion 8 51.09 na 30.79 0.29 13.41 0.06 1.33 3.88 0.17 na na 101.02Plag inclusion 9 52.28 na 30.85 0.24 14.20 0.33 1.62 4.43 0.21 na na 104.15Plag inclusion 10 52.63 na 29.27 0.56 14.13 0.18 1.80 3.71 0.41 na na 102.69Plag inclusion 11 52.53 na 30.04 0.15 13.74 0.03 1.62 3.62 0.25 na na 101.98Plag inclusion 12 50.95 na 28.91 0.67 14.81 0.30 1.73 3.28 0.07 na na 100.72Plag inclusion 13 51.76 na 30.77 0.20 12.48 0.03 1.88 3.89 0.39 na na 101.40Plag inclusion 14 52.32 na 30.64 0.24 13.86 0.00 1.59 3.72 0.19 na na 102.56Plag inclusion 15 51.50 na 30.48 0.25 13.00 0.03 1.88 3.92 0.17 na na 101.23Plag inclusion 16 52.65 na 27.56 1.90 12.53 0.03 1.99 3.09 0.41 na na 100.16Plag inclusion 17 50.95 na 29.60 0.18 13.29 0.00 1.62 3.44 0.07 na na 99.15Plag inclusion 18 52.38 na 28.58 0.17 13.61 0.27 1.62 3.93 0.33 na na 100.89Plag inclusion 19 50.77 na 30.69 0.29 14.47 0.00 1.95 3.51 0.15 na na 101.83Plag inclusion 20 51.37 na 28.75 0.12 13.99 0.03 1.36 3.89 0.29 na na 99.80Plag inclusion 30 52.67 na 30.39 0.18 13.23 0.03 1.36 3.88 0.21 na na 101.95Plag inclusion 31 50.96 na 29.42 0.41 13.28 0.03 1.55 3.19 0.29 na na 99.13Plag inclusion 32 54.50 na 27.69 0.91 11.25 0.12 2.21 3.47 0.38 na na 100.53Plag inclusion 33 51.49 na 30.37 0.13 14.58 0.00 1.18 3.66 0.11 na na 101.52Plag inclusion 34 50.97 na 30.26 0.25 13.37 0.00 2.17 3.94 0.21 na na 101.17Plag inclusion 35 51.27 na 30.61 0.22 12.64 0.12 1.33 3.80 0.05 na na 100.04Plag inclusion 36 50.60 na 29.29 0.08 13.00 0.27 1.22 3.54 0.19 na na 98.19Plag inclusion 37 51.59 na 30.14 0.17 12.54 0.12 2.02 3.47 0.17 na na 100.22Plag inclusion 38 52.76 na 31.04 0.15 12.66 0.00 1.80 3.89 0.13 na na 102.43Plag inclusion 39 49.99 na 31.11 0.38 13.42 0.36 1.33 4.44 0.11 na na 101.14Plag inclusion 40 50.96 na 29.70 0.39 14.68 0.06 1.69 3.48 0.15 na na 101.11
49

Host type Analysis type SiO2 TiO2 Al2O3 MgO CaO MnO FeO Na2O K2O F Cl TotalPlag inclusion 41 50.72 na 28.25 0.94 12.64 0.09 1.69 3.57 0.19 na na 98.09Plag inclusion 42 51.50 na 29.74 0.31 13.29 0.09 1.63 3.69 0.19 na na 100.45
average n=17
Plag Host 52.86 0.10 28.76 0.17 12.68 na 0.67 4.13 0.31 na na 99.68Host 52.12 0.10 29.39 0.17 13.13 na 0.74 4.05 0.25 na na 99.95MI 1 63.79 1.20 13.45 2.56 4.99 na 6.27 1.54 2.37 na na 96.17MI 2 61.28 1.20 13.27 2.55 4.47 na 6.12 1.91 2.61 na na 93.41
CPX inclusion 1 52.31 0.40 1.97 17.30 19.09 na 8.63 0.27 0.00 na na 99.97CPX inclusion 2a 51.72 0.30 1.83 17.80 19.05 na 8.98 0.27 0.05 na na 100.00CPX inclusion 2b 51.71 0.50 1.84 17.05 18.62 na 8.57 0.28 0.05 na na 98.62CPX inclusion 3 51.63 0.40 1.89 16.72 19.44 na 8.57 0.31 0.00 na na 98.96CPX inclusion 4 50.97 0.40 1.99 17.32 18.83 na 8.07 0.16 0.05 na na 97.79
CPX inclusion 5a 51.72 0.60 1.99 16.96 19.34 na 9.63 0.35 0.02 na na 100.61CPX inclusion 5b 52.91 0.50 2.00 17.35 19.03 na 8.38 0.28 0.09 na na 100.54CPX inclusion 6 52.76 0.40 2.00 17.70 18.39 na 8.81 0.30 0.02 na na 100.38CPX inclusion 7 52.01 0.50 1.95 17.53 19.28 na 8.79 0.20 0.02 na na 100.28CPX inclusion 8 51.69 0.40 1.96 17.04 19.14 na 8.66 0.34 0.04 na na 99.27CPX inclusion 9 52.29 0.40 1.94 16.51 19.24 na 8.40 0.22 0.01 na na 99.01
CPX inclusion 10 51.49 0.50 1.97 17.17 19.06 na 8.63 0.23 0.08 na na 99.13CPX inclusion 11 53.22 0.40 1.79 17.54 18.81 na 8.92 0.29 0.06 na na 101.03OPX inclusion 1a 54.20 0.30 1.07 27.77 2.14 na 15.20 0.10 0.01 na na 100.79OPX inclusion 1b 53.94 0.20 1.24 27.14 2.07 na 14.90 0.07 0.05 na na 99.61
Plag Host 52.51 0.10 29.17 0.16 12.83 na 0.67 3.70 0.27 na na 99.41MI 1 67.25 1.00 14.07 1.30 3.73 na 6.15 2.39 2.78 na na 98.67MI 2 65.39 0.90 13.51 2.24 4.58 na 6.46 2.24 2.37 na na 97.69MI 3 64.99 0.90 13.39 1.89 4.15 na 5.25 1.99 2.79 na na 95.35MI 4 63.73 1.30 13.44 2.40 4.46 na 6.42 1.72 2.47 na na 95.94MI 5 65.35 1.10 13.75 2.28 4.24 na 5.92 1.84 2.68 na na 97.16
50

Host type Analysis type SiO2 TiO2 Al2O3 MgO CaO MnO FeO Na2O K2O F Cl TotalMI 6 64.54 1.00 13.71 2.12 4.64 na 5.30 2.16 2.60 na na 96.07MI 7 65.69 1.00 13.94 2.00 4.49 na 6.35 2.12 2.84 na na 98.43MI 8 64.76 1.00 13.29 1.87 4.44 na 5.52 2.41 2.84 na na 96.13
CPX inclusion 1 52.55 0.50 1.95 17.04 18.16 na 9.44 0.25 0.04 na na 99.93
Plag Host 51.82 0.00 29.15 0.17 13.41 na 0.89 3.68 0.33 na na 99.45MI 1 64.52 1.00 13.54 2.03 4.73 na 5.86 2.50 2.84 na na 97.02MI 2 65.62 0.90 13.67 1.86 4.68 na 6.24 2.47 2.76 na na 98.20MI 3 63.21 1.20 13.31 2.13 5.09 na 6.55 1.98 2.77 na na 96.24MI 4 63.22 1.10 13.17 2.15 4.86 na 6.61 2.42 2.55 na na 96.08MI 5 64.88 1.40 13.70 2.36 5.42 na 6.85 2.02 2.38 na na 99.01MI 6 62.35 1.00 13.51 2.06 4.62 na 6.08 2.28 2.49 na na 94.39
CPX inclusion 1 53.26 0.40 1.82 16.85 19.22 na 9.16 0.33 0.02 na na 101.06OPX inclusion 2a 48.75 0.30 1.12 26.17 1.99 na 15.19 0.02 0.04 na na 93.58OPX inclusion 2b 49.67 0.30 1.13 25.86 1.86 na 14.94 0.05 0.06 na na 93.87OPX inclusion 3 51.76 0.30 1.11 26.77 2.05 na 15.35 0.04 0.03 na na 97.41
Matrix OPX 50.53 0.30 1.10 24.73 2.02 na 14.61 0.02 0.04 na na 93.35Matrix glass 63.51 1.10 12.81 1.79 4.67 na 6.52 2.32 2.71 na na 95.43
1991 ejectaSample 911206A - unhomogenized
OPX Host 53.24 0.17 1.14 25.66 2.05 0.38 15.58 0.02 0.01 0.00 0.01 98.26Host 52.48 0.26 1.01 25.70 2.11 0.34 16.74 0.01 0.01 0.14 0.01 98.81Host 53.45 0.26 1.13 25.30 2.20 0.42 15.76 0.04 0.00 0.00 0.02 98.58Host 53.33 0.18 1.00 26.21 2.12 0.31 15.11 0.00 0.01 0.21 0.00 98.48Host 52.43 0.23 1.25 26.10 2.08 0.32 15.81 0.03 0.00 0.25 0.00 98.50MI 1 69.18 1.32 15.03 0.19 3.10 0.08 1.93 1.62 2.73 0.00 0.45 95.63MI 2a 66.34 1.42 14.92 0.20 3.47 0.16 2.82 3.27 2.55 0.00 0.82 95.97MI 2b 68.64 1.49 16.20 0.21 3.64 0.11 2.42 1.48 2.11 0.04 0.76 97.10
51

Host type Analysis type SiO2 TiO2 Al2O3 MgO CaO MnO FeO Na2O K2O F Cl TotalMI 3 69.01 1.19 14.87 0.17 2.84 0.02 2.29 1.81 2.79 0.25 0.23 95.47MI 4 66.11 0.75 12.89 3.80 2.10 0.01 2.26 1.50 3.06 0.08 0.22 92.78MI 5 68.60 0.96 15.00 0.24 2.97 0.13 2.62 1.70 2.84 0.13 0.13 95.32MI 6 63.24 1.00 12.57 4.06 4.53 0.17 3.79 1.24 2.05 0.04 0.10 92.79MI 7 66.75 0.95 15.42 0.64 4.55 0.16 2.29 1.69 1.91 0.29 0.53 95.18MI 8 64.96 0.95 14.39 2.59 3.93 0.07 2.97 2.39 2.09 0.21 0.40 94.95
Plag inclusion 1a 49.97 0.04 29.23 0.16 14.03 0.03 1.46 3.21 0.09 0.00 0.02 98.24Plag inclusion 1b 50.38 0.02 29.04 0.20 13.71 0.08 1.63 3.33 0.13 0.25 0.00 98.77Plag inclusion 2 51.26 0.02 29.42 0.16 13.58 0.01 1.37 3.65 0.14 0.00 0.01 99.62Plag inclusion 3 49.93 0.11 27.93 0.18 13.52 0.07 1.24 3.56 0.19 0.04 0.02 96.79Plag inclusion 4 51.37 0.09 29.07 0.17 13.22 0.00 1.04 3.90 0.20 0.13 0.00 99.19Plag inclusion 5 51.11 0.08 29.02 0.18 13.33 0.00 1.45 3.71 0.15 0.00 0.00 99.03Plag inclusion 6 51.39 0.14 28.78 0.19 13.15 0.01 1.47 3.92 0.16 0.00 0.00 99.21Plag inclusion 7 52.56 0.19 26.96 3.42 11.20 0.13 2.11 3.41 0.30 0.13 0.00 100.41Plag inclusion 8 51.65 0.04 28.36 0.24 13.05 0.00 1.28 3.97 0.19 0.00 0.02 98.80CPX w/in MI 3 55.35 2.88 11.74 3.76 12.28 0.40 12.36 1.18 1.63 0.00 0.39 101.97Plag w/in MI 3 50.64 0.05 28.68 0.23 13.60 0.10 1.32 3.47 0.15 0.17 0.01 98.42Plag w/in MI4 50.59 0.10 27.46 0.17 13.69 0.07 1.22 3.80 0.09 0.00 0.02 97.21
OPX Host 53.93 0.17 0.92 26.01 1.88 0.34 15.49 0.04 0.00 0.04 0.00 98.82Host 53.76 0.16 1.15 25.73 2.16 0.42 16.01 0.07 0.05 0.04 0.01 99.56MI 1a 69.69 0.65 15.80 0.17 2.84 0.08 1.90 2.08 3.14 0.08 0.22 96.65MI 1b 70.40 0.90 15.63 0.14 2.71 0.06 1.85 1.97 3.21 0.00 0.19 97.06MI 2 67.32 0.67 13.29 2.01 3.14 0.08 2.48 2.08 2.57 0.04 0.13 93.81MI 3 66.78 0.71 13.87 0.94 3.12 0.02 2.03 1.79 2.42 0.08 0.18 91.94
Plag inclusion 1 49.91 0.00 30.12 0.19 14.81 0.00 1.41 2.86 0.09 0.04 0.00 99.43Plag inclusion 2 50.99 0.09 28.04 0.18 13.00 0.06 1.13 3.60 0.12 0.00 0.00 97.21Plag inclusion 3 51.27 0.08 27.59 0.85 12.86 0.11 1.36 3.70 0.20 0.00 0.00 98.02Plag inclusion 4 52.67 0.07 26.48 3.20 11.49 0.02 1.57 3.54 0.29 0.08 0.00 99.41Plag inclusion 5a 51.04 0.00 28.46 0.17 12.68 0.00 1.22 3.54 0.25 0.00 0.00 97.36
52

Host type Analysis type SiO2 TiO2 Al2O3 MgO CaO MnO FeO Na2O K2O F Cl TotalPlag inclusion 5b 48.16 0.06 27.02 0.25 12.45 0.01 1.10 3.67 0.22 0.04 0.00 92.98
OPX Host 54.22 0.22 1.21 25.92 2.03 0.42 16.21 0.06 0.00 0.00 0.00 100.29Host 53.76 0.29 1.13 26.38 2.23 0.27 16.62 0.04 0.01 0.04 0.01 100.78MI 1a 70.16 0.91 15.55 0.19 2.61 0.00 1.74 2.02 3.02 0.12 0.12 96.44MI 1b 69.49 0.81 15.38 0.25 2.66 0.06 1.66 2.23 3.30 0.00 0.20 96.04
Plag inclusion 1 52.21 0.02 29.27 0.21 13.28 0.01 1.21 3.39 0.16 0.00 0.00 99.76
OPX Host 54.44 0.31 1.09 26.31 1.87 0.32 15.87 0.03 0.00 0.07 0.05 100.36Host 53.43 0.22 1.52 26.14 2.17 0.41 15.64 0.01 0.01 0.00 0.00 99.55Host 53.28 0.27 1.23 26.16 2.47 0.46 15.65 0.02 0.00 0.32 0.01 99.87
CPX* Host 47.42 0.40 1.61 15.62 18.63 0.23 8.75 0.18 0.02 0.17 0.00 93.03Host 52.24 0.50 1.83 16.29 19.72 0.31 9.34 0.24 0.00 0.31 0.00 100.78Host 51.41 0.48 1.83 16.23 19.37 0.37 9.21 0.19 0.00 0.24 0.00 99.33MI 1a 69.75 1.21 14.85 0.23 2.28 0.04 1.29 2.84 3.47 0.11 0.15 96.22MI 1b 69.18 1.03 14.83 0.22 2.26 0.00 1.39 2.90 3.53 0.28 0.14 95.76MI 2 70.37 0.77 13.12 0.65 2.91 0.02 1.69 1.75 2.95 0.21 0.12 94.56
Fe phase w/in MI 1 24.78 1.29 7.23 2.00 4.23 0.34 57.06 0.47 0.74 0.07 0.01 98.22Plag w/in MI 2 49.35 0.05 29.35 0.19 14.43 0.00 1.06 3.30 0.19 0.11 0.02 98.05
Fe oxide w/in MI 2 29.78 1.68 7.85 3.14 4.34 0.34 59.43 0.49 0.87 0.21 0.03 108.16
CPX* Host 52.10 0.51 1.97 16.15 19.17 0.41 10.07 0.14 0.00 0.34 0.00 100.86Host 52.25 0.45 1.79 16.18 18.79 0.33 10.28 0.15 0.01 0.10 0.02 100.35MI 1 71.39 1.24 15.31 0.23 2.34 0.02 1.36 2.86 2.81 0.10 0.12 97.78
Plag w/in MI 1 53.55 0.05 28.45 0.18 12.75 0.09 0.91 4.11 0.20 0.14 0.00 100.43Fe oxide w/in MI 1 1.35 1.68 3.26 1.53 0.95 0.63 83.54 0.00 0.08 0.17 0.04 93.23
Matrix Matrix glass 67.01 1.17 15.23 0.56 3.83 0.04 4.37 3.61 1.92 0.28 0.20 98.22Matrix glass 63.33 0.83 15.59 0.81 5.70 0.09 4.64 4.14 1.65 0.36 0.19 97.33Matrix glass 66.48 0.93 14.32 0.62 3.51 0.27 4.91 4.46 1.84 0.00 0.23 97.57
53

Host type Analysis type SiO2 TiO2 Al2O3 MgO CaO MnO FeO Na2O K2O F Cl TotalMatrix glass* 63.47 1.24 11.30 3.51 4.66 0.23 7.91 2.17 3.33 0.00 0.09 97.91Matrix glass* 67.50 1.04 13.56 0.84 2.95 0.12 6.22 2.80 3.60 0.24 0.10 98.97
CPX 50.98 0.56 1.94 16.25 19.73 0.36 9.08 0.25 0.00 0.16 0.03 99.34CPX 51.53 0.43 2.12 16.24 19.43 0.36 8.81 0.26 0.00 0.16 0.04 99.38CPX* 48.73 1.30 4.81 14.10 18.64 0.32 10.10 0.24 0.08 0.14 0.00 98.46
Sample 911206A - homogenized
CPX Host 52.69 0.55 1.79 15.90 18.70 0.42 9.97 0.25 0.00 0.00 0.03 100.30Host 53.40 0.48 1.81 16.41 18.80 0.34 9.79 0.31 0.02 0.00 0.05 101.40Host 52.78 0.51 2.08 16.00 18.38 0.34 9.82 0.19 0.01 0.07 0.00 100.15Host 52.56 0.47 2.04 15.78 18.54 0.38 9.60 0.32 0.01 0.20 0.02 99.82Host 53.66 0.52 1.89 15.53 19.14 0.34 9.57 0.28 0.02 0.00 0.05 100.98Host 52.98 0.49 1.58 15.81 18.25 0.38 9.16 0.14 0.01 0.20 0.02 98.93Host 53.20 0.63 1.94 16.08 18.79 0.42 9.40 0.17 0.00 0.00 0.02 100.64Host 54.75 0.55 1.75 15.92 19.21 0.46 9.94 0.23 0.01 0.13 0.00 102.90Host 53.38 0.43 1.83 16.32 18.33 0.38 9.71 0.22 0.00 0.04 0.03 100.66Host 53.48 0.47 1.88 16.29 18.41 0.37 9.54 0.17 0.01 0.07 0.03 100.68Host 54.87 0.39 1.71 16.19 18.36 0.40 10.35 0.22 0.02 0.00 0.03 102.53MI 1 63.90 1.24 14.94 1.90 5.89 0.21 8.12 1.24 1.50 0.07 0.18 99.11MI 2 65.62 1.04 12.65 2.01 5.40 0.17 7.35 0.81 1.97 0.17 0.12 97.19MI 3 66.54 1.08 12.48 1.96 5.38 0.11 7.50 0.54 1.85 0.00 0.11 97.53MI 4 65.36 1.42 13.81 1.70 5.46 0.28 8.53 1.03 1.73 0.03 0.12 99.41MI 5 64.37 1.31 13.63 1.85 5.59 0.23 8.41 0.83 1.70 0.03 0.14 98.05MI 6 64.55 1.46 13.50 1.82 5.44 0.20 8.21 0.82 1.63 0.04 0.12 97.75MI 7 65.27 1.39 13.29 1.70 5.06 0.24 8.47 0.81 1.65 0.00 0.11 97.98MI 8 63.11 1.50 12.69 1.62 5.13 0.09 8.10 0.66 1.55 0.00 0.15 94.55MI 9 65.21 1.50 13.69 1.74 5.59 0.27 8.02 1.06 1.82 0.04 0.18 99.09
* Data collected by Stuart Simmons
54

Appendix BCopper concentrations for electron microprobe
Traverse 1Sample WiOO8 Pyroxene - melt inclusion - pyroxene
Point # Cu (ppm) Phase Point # Cu (ppm) Phase1 20 Pyroxene 31 250 Melt Inclusion2 0 Pyroxene 32 280 Melt Inclusion3 0 Pyroxene 33 240 Melt Inclusion4 30 Pyroxene 34 260 Melt Inclusion5 0 Pyroxene 35 240 Melt Inclusion6 10 Pyroxene 36 210 Melt Inclusion7 0 Pyroxene 37 270 Melt Inclusion8 0 Pyroxene 38 230 Melt Inclusion9 0 Pyroxene 39 270 Melt Inclusion10 20 Pyroxene 40 270 Melt Inclusion11 0 Pyroxene 41 170 Pyroxene-melt interface12 10 Pyroxene 42 40 Pyroxene13 0 Pyroxene 43 30 Pyroxene14 0 Pyroxene 44 0 Pyroxene15 20 Pyroxene 45 20 Pyroxene16 10 Pyroxene 46 10 Pyroxene17 30 Pyroxene 47 20 Pyroxene18 30 Pyroxene 48 10 Pyroxene19 60 Pyroxene-melt interface 49 20 Pyroxene20 180 Pyroxene-melt interface 50 20 Pyroxene21 260 Melt Inclusion 51 20 Pyroxene22 220 Melt Inclusion 52 0 Pyroxene23 280 Melt Inclusion 53 0 Pyroxene24 230 Melt Inclusion 54 0 Pyroxene25 220 Melt Inclusion 55 10 Pyroxene26 210 Melt Inclusion 56 0 Pyroxene27 220 Melt Inclusion 57 20 Pyroxene28 280 Melt Inclusion 58 0 Pyroxene29 250 Melt Inclusion 59 0 Pyroxene30 240 Melt Inclusion 60 30 Pyroxene
55

Traverse 2 Traverse 3Sample WiOO8 Sample WiOO8Pyroxene-melt inclusion-pyroxene-plagioclase Crystallite rich matrix - pyroxene
Point Cu (ppm) Phase Point Cu (ppm) Phase1 30 Pyroxene 1 110 Crystallite/glass interface2 0 Pyroxene 2 60 Crystallite3 10 Pyroxene 3 90 Crystallite4 20 Pyroxene 4 130 Crystallite/glass interface5 0 Pyroxene 5 170 Matrix glass6 30 Pyroxene 6 190 Matrix glass7 90 Pyroxene-melt interface 7 70 Crystallite8 170 Melt inclusion 8 140 Crystallite/glass interface9 160 Melt inclusion 9 140 Matrix glass10 170 Melt inclusion 10 90 Crystallite11 160 Melt inclusion 11 120 Crystallite/glass interface12 190 Melt inclusion 12 110 Crystallite/glass interface13 130 Pyroxene-melt interface 13 120 Crystallite/glass interface14 20 Pyroxene 14 140 Crystallite/glass interface15 40 Pyroxene 15 170 Matrix glass16 10 Pyroxene 16 220 Matrix glass17 0 Pyroxene 17 100 Crystallite/glass interface18 50 Pyroxene 18 130 Crystallite/glass interface19 0 Pyroxene 19 50 Crystallite20 10 Pyroxene 20 70 Crystallite21 0 Pyroxene 21 120 Crystallite/glass interface22 0 Plagioclase 22 20 Pyroxene23 0 Plagioclase 23 0 Pyroxene24 30 Plagioclase 24 20 Pyroxene25 50 Plagioclase 25 10 Pyroxene26 0 Plagioclase 26 0 Pyroxene27 50 Plagioclase 27 0 Pyroxene28 10 Plagioclase 28 0 Pyroxene29 0 Plagioclase 29 30 Pyroxene30 0 Plagioclase 30 0 Pyroxene
31 0 Pyroxene32 0 Pyroxene33 0 Pyroxene34 30 Pyroxene35 10 Pyroxene36 0 Pyroxene37 0 Pyroxene38 10 Pyroxene39 0 Pyroxene40 0 Pyroxene
56

Appendix CTrace elements from Ion microprobe
Sample number 880325 880325 891129(ppm) OPX CPX Plagioclase
Li 1 3 5Be 0 0 3Sc 28 101 17Ti 1413 2671 236Cr 739 1908 4Rb 9 6 1Sr 1 19 410Y 4 28 0Zr 6 28 1Nb 0 0 0Ba 0 0 196La 0 2 2Ce 0 8 3Nd 0 9 2Sm 0 3 0Eu 0 1 0Gd 0 3 0Dy 1 6 0Er 1 4 0Yb 1 4 0Hf 0 2 0
57

Sample number 880325 880325 880325 891129 891129(ppm) MI-1 in OPX MI-2 in OPX MI in CPX MI in plag Matrix glass
Li 17 17 17 15 16Be 1 1 2 2 1Sc 23 37 33 17 15Ti 5509 5245 4825 4463 5121Cr 30 140 292 25 33Rb 57 59 56 29 47Sr 135 135 115 172 144Y 22 21 28 22 22Zr 188 166 155 142 178Nb 7 6 6 5 6Ba 839 777 734 594 750La 15 13 14 12 14Ce 32 28 31 25 30Nd 16 14 16 13 14Sm 4 3 5 6 4Eu 3 3 5 2 1Gd 4 4 5 3 3Dy 5 4 8 5 5Er 2 1 2 3 3Yb 33 3 4 5 3Hf 7 5 6 3 6
58

59
Vita
Maria Helen Rapien was born in Cincinnati, Ohio June 10, 1972. She graduated from St. UrsulaAcademy in 1990. She received a Bachelor’s of Science degree in Geology from the University ofCincinnati in 1994. In 1995, she began graduate study at Virginia Polytechnic Institute and StateUniversity, where she received a Master’s Degree from the Department of Geological Sciences.Currently, Maria is pursuing a career in teaching.