maria a. schwarz - chemie.unibas.chschwarz/print_version_13_05.pdf · zu berücksichtigendes ......
TRANSCRIPT

Chip-based bioanalytical microsystems: new applications
Maria A. Schwarz
Universität BaselDepartement Chemie

1-2
Table of contents
1 ZUSAMMENFASSUNG.............................................................................................................................1-4
2 LIST OF ABBREVIATION .......................................................................................................................2-5
3 INTRODUCTION .......................................................................................................................................3-2
4 OVERVIEW OF RESEARCH PROJECTS.............................................................................................4-3
5 ELECTROPHORETIC SEPARATIONS ON MICROCHIP ................................................................5-4
5.1 THE MICROCHIP AS A SEPARATION DEVICE .....................................................................................5-45.2 SEPARATION EFFICIENCY ................................................................................................................5-4
5.2.1 Injection.....................................................................................................................................5-85.2.2 Current detection methods on microchip – the advantage of EC-detection...........................5-10
5.3 SEPARATION SELECTIVITY OF BIOGENIC MONOAMINES (P1, P2) ..................................................5-125.3.1 Separation selectivity modified by complexing equilibria ......................................................5-155.3.2 Separation selectivity modified by partition equilibria (MEKC, P6) .....................................5-18
5.4 CHIRAL SEPARATIONS (P1 AND P2) ..............................................................................................5-21
6 SENSITIVITY AND SELECTIVITY FOR AMPEROMETRIC DETECTION OFNEUROTRANSMITTERS.......................................................................................................................6-25
6.1 ENZYME-CATALYZED REACTIONS ................................................................................................6-256.1.1 Glucose oxidase/ glucose (P3) ................................................................................................6-276.1.2 Glucose oxidase/glucose/NADH (P4) .....................................................................................6-29
6.2 CARBON NANOTUBE MODIFIED AMPEROMETRY (P6)....................................................................6-306.3 HADAMARD TRANSFORM MICROCHIP - CE(P5) ...........................................................................6-316.4 MICROCHIP SEPARATIONS OF BIOLOGICAL SAMPLES (P6) ............................................................6-32
6.4.1 Microchip separations in neuroscience ..................................................................................6-33
7 AFFINITY CAPILLARY ELECTROPHORESIS (ACE) ....................................................................7-36
7.1 MODES OF AFFINITY CAPILLARY ELECTROPHORESIS....................................................................7-387.2 THEORY OF ACE-Μ ......................................................................................................................7-427.3 CHARACTERIZATION OF ACE ON MICROCHIPS (P7) .....................................................................7-437.4 MC-ACE APPLICATIONS ..............................................................................................................7-46
7.4.1 Synthetic Receptors (P9) .........................................................................................................7-467.4.2 DNA-Metal Ion Interactions (P8) ...........................................................................................7-487.4.3 Selectivity of metal ions...........................................................................................................7-54
8 CONCLUSION ..........................................................................................................................................8-62
9 ACKNOWLEDGMENTS.........................................................................................................................9-63
10 APPENDIX...............................................................................................................................................10-64
10.1 PUBLICATIONS ............................................................................................................................10-6410.2 CURRICULUM VITAE ...................................................................................................................10-68
11 PUBLICATIONS.....................................................................................................................................11-70
ACE as a separation tool P1: Rapid chiral on-chip separation with simplified amperometric detection (J. Chromatogr. A, 928,
2001, 225-232) P2: Chiral on-chip separation of neurotransmitters (Anal. Chem., 75, 2003, 4691-4695) P3: Enzyme-catalyzed amperometric oxidation of neurotransmitter in chip-capillary electrophoresis
(Electrophoresis, 25, 2004, 1916-1922) P4: Enzymatic sensitivity enhancement of biogenic monoamines on chip (Electrophoresis, 26, 2005,
2701-2707)

1-3
P5: Modified Hadamard transform microchip electrophoresis (Electrophoresis, 26, 2005, 3151-3159)
P6: Determination of cationic neurotransmitters and metabolites in brain homogenates by microchipelectrophoresis and carbon nanotubes modified amperometry (J. Chromatogr. A , in press)
ACE for characterizing interactions P7: Affinity capillary electrophoresis on chip (J. Chromatogr. A , 1063, 2005, 217-225) P8: Quantification of single-stranded nucleic acid and oligonucleotide interactions with metal ions
by affinity capillary electrophoresis. Part I (J. Biol. Inorg. Chem., in press) P9: Electrophoretic affinity measurements on microchip – determination of binding affinities
between diketopiperazine receptors and peptide ligands (Electrophoresis, in press) P10: Microchip affinity capillary electrophoresis: applications and recent advances, Review (J. Liq.
Chromatogr. Relat. Technol., 29, 2006, 1047-1076)

1-4
1 ZUSAMMENFASSUNGDurch Einsatz verschiedenster Trennmechanismen (Modifier) konnten am Beispiel vonbiogenen Aminen (Neurotransmitter) anspruchsvolle sowie schnelle chirale Trennungenauf Mikrochips mit Trennlängen von 8 cm gezeigt werden. Zu berücksichtigendesKriterium der eingesetzten Modifier war die geeignete Steuerung der Trennselektivität ohneVerschlechterung der elektrochemischen Detektion der Analyten. Ein Weg der sensitivenund selektiven Detektion stellte die Verwendung von enzymkatalysierten Reaktionen dar,um Nachweisgrenzen im oberen nM Bereich zu ermöglichen. Es wurde gezeigt, dass auchdie diagnostisch interessanten Metaboliten des Dopamin durch Glukoseoxidase/Glukose(GOx/G) mit deutlich kleineren Nachweisgrenzen detektierbar sind, sowie NADH(Nikotinamid Adenin Dinukleotid) in der Lage ist, die Empfindlichkeit desamperometrischen Signals weiter zu verbessern.Neben den Untersuchungen der elektrochemischen, katalytischen Reaktionen wurde dieHadamard-Transformation und Carbon nanotubes (CNT) immobilisierte Elektrodeneingesetzt. Die Verstärkung des Signals (enzymatisch als auch mit CNT) war ausreichend,um biologische Proben zu untersuchen. Die simultane Bestimmung von kationischenNeurotransmittern und deren kationischen Metaboliten könnte in der Diagnostik vonErkrankungen des zentralen Nervensystems wie Parkinson aber auch der MultiplenSklerose von Bedeutung sein. Von Interesse ist weiterhin die Bestimmung dieser Aminenach Verabreichung verschiedenster Wirkstoffe, die einen Einfluss auf dieNeurotransmitter-Konzentration im Hirn bzw. Hirnflüssigkeiten haben.
Microchip-(EC/UV)-Affinitätsmessungen wurden erstmalig erfolgreich an Hand vonWechselwirkungen zwischen Catecholaminen und Cyclodextrinen gezeigt und qualitativmit der klassischen kapillaren CZE (Capillary Zone Electrophoresis) verglichen. Da beiAffinitätsstudien die Sensitivität und Trennleistung weniger problematisch ist, wurdendiese Untersuchungen mittels UV-Detektion auf Trennkanälen von 2.5 cm verfolgt.Weitere Applikationen, welche wichtige Informationen zu molekularbiologischenInteraktionen geben, wurden beschrieben. So konnten DNA/Metallionen - Interaktionencharakterisiert, als auch der Einfluss von Pufferkomponenten auf die Bildung von binärenund ternären Oligonukleotid-Komplexen gezeigt werden. Die Untersuchungen lassen eineSelektivität ausgewählter Metallionen zu Oligonukleotiden mit variabler Sequenz erkennen.Sequenzspezifische Bindung von Metallen ist hinsichtlich der Entwicklung von Antitumor-Wirkstoffen aber auch zur Klärung grundlegender biologischer Funktionen der DNA vongrosser Bedeutung. Bindungsstudien künstlicher Rezeptoren und deren Affinität zuPeptiden wurden mit konventionellen Methoden wie der Kalorimetrie verglichen.

2-5
2 LIST OF ABBREVIATION
5-HT - serotoninA- adrenaline, peak area, adenineACE - affinity capillary electrophoresisACE-μ- affinity capillary electrophoresis
(evaluation of mobility shift)BGE - background electrolyteC - capillary, cytosineCD - cyclodextrinCDOPA - hydrazinomethyldihydroxy-
phenylalanineCE - capillary electrophoresisCMCD - carboxymethylated cyclodextrinCNT - carbon nanotubesCSF - cerebrospinal fluidsCOx - catechol oxidaseCZE - capillary zone electrophoresisD - dopamine, diffusion coefficientDOPA - dihydroxyphenylalanineDOPAC - 3,4-Dihydroxyphenylacetic acidE electric fieldEC - electrochemical detectionECR - enzyme-catalyzed reactionEG - electrophoretic groundEMSA - electrophoretic mobility shift
assayEOF - electro osmotic flowF - fluorescence detectionFA - frontal analysisFADH2 - flavin-adenine-dinucleotideG - guanine, guanosine, glucoseGMP - guanosine-monophosphateGOx - glucose oxidaseHD - Hadamard transform, Hummel-
Dreyer methodHP - hydroxypropylated, high
performanceHPLC - high performance liquid
chromatographyHV - high voltage, homovanillic acidHVA - homovanillic acidITC - isothermal calorimetryKA - aggregation constantKB - binding constantL - ligand
l - lengthLIF - laser induced fluorescenceLOD - limit of detectionM - metabolite, methylatedMACE - micellar affinity capillary
electrophoresisMC - microchipMC-ACE-μ- microchip affinity
electrophoresis (evaluation ofmobility shift)
MCE - microchip electrophoresisME - metanephrineMed - mediatorMEKC - micellar electrokinetic
chromatographyMOPS - 3-(N-Morpholino)
propanesulfonic acidMT - methoxytyramineμ-TAS - micro total analysis systemNA - noradrenalineNADH - nicotinamide adenine
dinucleotid coenzymeNME - normetanephrineNT - neurotransmitterPAA - polyacrylamidepyr - pyridine and pyridine analogueR - receptorr - hydrodynamic radiusS - solute, single wall, active
binding siteSCD - sulfonated cyclodextrinSDS - sodium dodecyl sulfateT - thymineTES - N-tris(hydroxymethyl)-methyl-
2-amino-ethanesulfonic acidTRIS - tris(hydroxymethyl)-
aminomethaneUA - uric acidVACE - vacancy affinity capillary
electrophoresisVP - vacancy peak analysis[X] - equilibrium concentration of a
solute

3-2
3 INTRODUCTIONMicroscaled analytical devices, often termed “-TAS” (micro total analysis system) orsimply “chips”, employ a short and narrow micro-channel for separation processes. Sincethe first application of an electrophoretic separation on a microfluidic device by Widmer in1992 1 , many efforts have been devoted to the technical development of the separationdevice, detection system and the implementation of various analytical systems. Theultimate goal of microchip systems is to integrate the complete analytical process into onedevice. With the ability to fabricate microfluidic systems of complex structure, parallelanalyzing processes will become a versatile tool for diagnosis, drug screening andbiological research. Although the development is still in its early stage, there are manyreports describing studies of biophysical and biochemical systems. The main field ofapplication to date is in the analysis of oligonucleotides, proteins and peptides.
The simple technical arrangement of capillary electrophoresis and the high separationefficiency provide ideal conditions for a miniaturizing process that is an on-going trend.The main motivation is the possibility of high throughput analysis, coupling variousprocesses to one system such as pre- and post-channel reactions and the possibility of doingparallel measurements in an easy way. The miniaturization, as compared to theelectrophoresis in capillaries, also enables utilization of valuable and precious samples.
In contrast to the advantages of such systems, two limiting factors are typical for chipsystems: (i) the shorter separation lengths (between 1-10 cm) have consequences of lowerseparation efficiency and (ii) detection sensitivity does not directly benefit from theminiaturization, particularly in the case of optical detection systems. As a result, thedevelopment of miniaturized detection and separation systems with high separationselectivity, detection sensitivity and fast response are important issues that need to beaddressed.
An example of the development of a highly selective method is presented here for thedetection of biogenic monoamines employing selective catalytic reactions on the detector.The challenge of the described method was the discovery and utilization of interactingmolecules that allow both the simultaneous separation of neurotransmitters (NT) withoutdisturbance of the amperometric detection mechanism. A further novel applications ofmicroanalytical systems without the classical, analytical questions is focused on affinitymeasurements, in which the features of microchip as “substantially limited separation way”and “insufficient detection sensitivity” are of subordinate importance in affinity capillaryelectrophoresis (ACE). For the first time we demonstrate the application of affinity chipelectrophoresis to various interacting systems.
1 Manz, A.; Harrison, D. J.; Verpoorte, E. M. J.; Fettinger, J. C.; Paulus, A.; Ludi, H.; Widmer, H. M. Journal ofChromatography A 1992, 593, 253-258, Planar Chips Technology for Miniaturization and Integration of SeparationTechniques into Monitoring Systems - Capillary Electrophoresis on a Chip.

4-3
4 OVERVIEW OF RESEARCH PROJECTSThe aim of the presented research is to investigate the potential and applicability ofmicrochip capillary electrophoresis, including the development of techniques whichovercome the current limitations. The research project has two different aims: (i) theutilization of the microchip as a separation tool and (ii) the quantification of noncovalentbinding on the microchip. The following topics have been addressed during the course ofthe research:
Investigations of enantiomeric separations on microchip (MC) (P1, P2) Increasing separation selectivity and separation efficiency with the help of new
complexing agents that interact selectively with analytes (P6) Improvement of sensitivity by catalytic reactions on an amperometric detector (P3,
P4) and application of Hadamard transform CE (capillary electrophoresis) (P5). Transfer of affinity measurements (ACE) of known systems from capillary to
microchip (P7) MC-application for characterization of novel interacting systems (P8, P9)
The following scheme gives an overview of the research and the relationship between sub-projects.
Chiral separation
ECR Neurotransmitter
Amp. Oxid.on Au
Simultaneousseparation/study of metabolism
ECRGOxGOx/NADH
HD-MCE
CNTCNT/COxCNT/COx/GOx
HPLC CapillaryChip
ACE on chip
ComparisonChip/Capillary
Artifical receptor/peptides
DetectionLOD
MEKC for theseparation of NT
oligonucleotide/metal ion
selectivity ofmetal ions
P1/P2
P5
P8
P6
P6
P4P3
P7/P10
P9
Overview of research projects. P1-P10 – relevant publications originated from this work, ECR - enzyme-catalyzed reaction, ACE - affinity capillary electrophoresis, NT - neurotransmitter, HD - Hadamardtransform, MCE – microchip capillary electrophoresis, GOx - glucose oxidase, NADH - nicotinamide adeninedinucleotide, COx – catechol oxidase, CNT – carbon nanotubes, MEKC – micellar electrokineticchromatography.

5-4
5 ELECTROPHORETIC SEPARATIONS ON MICROCHIP
5.1 The microchip as a separation deviceThe microfluidic device has a typical pattern of an elongated cross (Figure 1). The totallength of the separation channel is between 10 and 100 mm. Typically, the chip isconfigured with four reservoirs for sample, buffer and waste. The injection is often carriedout electrokinetically by simple cross or double tee structure. A simplified two-electrodearrangement for amperometric detection, as depicted in the Figure 1, has partly been usedin our experiments. In the simplified arrangement the electrophoretic ground electrode actsas a pseudoreference and amperometric counter electrode as well (more details in chapter5.2.2).
In general, all common detection methods for capillaries can be applied to planar microchipdevices. Detection methods can be classified into on-line channel (for spectrometricdetection there is no direct contact between the sensor and the solution: UV, fluorescence,(furthermore for EC: contactless conductivity), which are the most frequently used methodson microchips, end-channel (MS, EC (amperometry, conductivity andelectrochemiluminescence)), off-channel (EC: the electric voltage is decoupled beforedetection take place) and inside the channel (sometimes referred to on-channel,conductivity). Spectrometric on-channel detection can be carried out on one point ofmigration length (time as x-axis) or can record data over the whole channel (separationlength as x-axis).
buffer-reservoir
bufferreservoir
sample-reservoir
(mult iplex) sample injection(electrokinetical)
working electrode (Au)600-1300 mV
3 kV
1 kVcounter electrodereference electrode
HV-electrode
separation channel
HV-electrode
two-electrodepotentiostat
Figure 1: Typical microchip device for amperometric measurements (HV – high voltage).
5.2 Separation efficiencyThe speed of a separation is limited by the time required to transport a species of interestover a distance sufficiently long to separate it from other detectable components. Inchromatographic separations, the velocity of an analyte is restricted by its transfer ratesbetween solid and liquid phases. In contrast, capillary zone electrophoresis (CZE or highperformance (HP) CE) is not constrained by partitioning kinetics and, consequently, is idealfor analyses up to microsecond time scales with theoretical plate numbers of up to10’000’000 per meter (for solutes with a small diffusion coefficient and high electricfields). Contrary to the favorable features of HPCE, dispersion of analyte zone increases thepeak width and, consequently, decreases the mobility difference. Needless to say, thedispersion becomes important for separations in miniaturized separation systems.

5-5
Therefore, a short introduction describing all factors affecting the separation efficiency isgiven below.
Dispersion, the spread of the analyte zone, results from different molecule velocities withinone zone and can be defined by the peak width
3( -standard deviation in time, length or volume s, m, m4bw . The efficiency, expressed as the number
of theoretical plates2lN
, describes the relation of the effective migration length to the
peak width. Dispersion can be ascribed solely to longitudinal diffusion (moleculardiffusion), if separation and injection conditions are ideal. However, in practice otherdispersion processes are often present. The resulting sum of contributing variance for zonebroadening mechanism can be derived from Equation (1):
2 22 2 2 22temperature adsorptioninjectiondif det ectiofusio nnT ..... (1)
Black marked terms emphasize the unaltered variances when capillary systems arecompared to chip systems. It means that, under identical separation conditions (buffer,surface of separation channel/capillary and electric field) these terms will be constant forboth systems. In contrast, the variance contributions resulting from injection and detection( 2
injection and 2det ection ) become significant for chip separations with short separation
channels, due to relatively low resolution detectors and cross injection. This difficulty hasbeen described in detail (P7) but is briefly illustrated here, too.
In a first experiment, a capillary equipped with electrokinetic cross injection (typical forchip devices) has been applied for the investigation of the effect of this kind of injection onthe separation. Figure 2 (b)). Theoretical plate numbers are estimated as a function ofmigration length. With reduction of separation length (Figure 2 (a), 42 cm – 22 cm), asexpected, not only the migration time is decreased, but also the resolution is worsened. Incontrast to the separation efficiency, which increases linearly with applied separationvoltage, the voltage must be quadrupled to double the resolution ( N U ). The separationefficiency (theoretical plate numbers (N)) should be considered as a hypothetical constantin this experiment, since N is proportional to the product of E (electric field) and l (effective
separation length;2
ElN
D
). In other words, with a constant electric field, a shorter
separation length (l2) should result in lower theoretical plate numbers (N2) as given by2
2 11
lN N
l . However, a decrease in N at constant voltage has been observed with
shortening separation length (Figure 3).The injection time was 2 s (simplest injection, see chapter 5.2.1). With an EOF (electroosmotic flow) of 2 mm/s, a sample plug of about 4 mm length is hypothetically injected (inexact terms, the quantity loaded depends on the electrophoretic mobility of the individualspecies). Ideally, the sample plug should be less than the standard deviation for diffusion.The length of plug required for a high efficiency depends on both the diffusion coefficient(D) and the migration time (tm). If the plug length is significantly longer than diffusion , theseparation efficiency will be lower. For example, with a moderate diffusion coefficient of10-5 [cm2/s] and migration times of 60 s (8 cm, chip), 150 s (22 cm capillary) and 350 s (42

5-6
cm capillary), the variance of diffusion ( 2 mDtdiffusion ) can be calculated to be 0.34
mm, 0.54 mm and 0.83 mm, respectively. This means that for optimal conditions and highresolution separations, the analyte zones have to be smaller than the calculated diffusion . It is
evident that with a constant 2det ection (i.e. the same detection resolution), the relation
lanalytelseparation
is clearly unfavorable for short separation lengths (lseparation) at constant injection
volumes/length (lanalyte) and is responsible for the lower separation efficiency.
100 150 200 250 300 350 400 450 500 550
a
N = 17'230E = 0.6818 kV/cm
N = 38'500E = 0.405 kV/cm
N = 31'936E = 0.468 kV/cm
N = 47 629E = 0.357 kV/cm
8cm
cross in jection/chipN = 40' 536E = 0.375 kV/cm
20 40 60 80
41- 43s
time/sNME
MEMT
cross injection/capil laryU = 15 kV
22 cm
42cm
37 cm
32 cm
time/s
PEEK0.125 mm
Flow gatedinterface
Electrophoresis capillary
High voltage5-30 kV
UV
flushpump
Stainless steeltubing0.750 mm
Flush flow 0.05-1.5 ml/min
f low ofanalyte
50-100 nl/min
PEEK0.065 mm
waste
flushpump
b
Figure 2: (a): Reduction of separation length; metabolites of dopamine are separated under the sameconditions (electrokinetic cross injection) as used on microchip (right) and (b): the scheme of cross injectionfor standard capillary.
Contrary to advanced estimation of N , with microchip measurements partly highresolutions of 40’000 are obtained (Figure 2 (a), black electropherogram). N are typicallyaround 20’000 when a separation length of 8 cm is used. Furthermore, starting from Nobtained by measurements in the capillary of 42 cm, Nchip is expected to be in the range of10’000 in an electric field of the same intensity. What is the reason for the relatively highseparation efficiency in the chip experiment? Why is N decreased in the capillaryexperiment when using shorter separation length but not on a planar chip?

5-7
0.40.5
0.6
0.7
15000
20000
25000
30000
35000
40000
45000
50000
20
25
3035
4045
theo
retic
alpl
ate
num
bers
N
l [cm ]E [kV/cm]
Figure 3: The dependence of N (theoretical plate numbers) on E (electric field) and l (migration length).Results based on the experiment shown in Figure 2 (a).
Whereas the sample length injected on the capillary can be calculated precisely, the samplelength injected (electrokinetically with the simplest mode, see chapter 5.2.1) on aseparation channel can only be estimated approximately. The minimum injection plug isdetermined by the inner width of cross (0.05 mm). However, uncontrolled diffusionprocesses often occur both before and after the injection process depending on variousfactors such as the ionic strength of the buffer, the relation between currents in theseparation and the injection channel, and are responsible for an undefined broadening ofanalyte zone. In this case the sample plug seems to be significantly smaller than thecalculated diffusion and, in consequence, results in higher theoretical plate numbers. Asshown below and in P7 the non-reproducible injection procedure is one of the mostimportant factors which influences the resolution and separation efficiency on shortseparation channels. Regarding the difficulties of a precise injection of well defined sampleplugs, many efforts have been made for controlling fluidic flow and focusing of the analytezone (for detailed explanations see chapter 5.2.1) but still need to be fully established.
The variance as a consequence of molecular diffusion ( 2diffusion ) is the only term that profits
from the miniaturization of channels/capillaries. 2diffusion is directly proportional to the
migration length. The effect of migration time on diffusion is illustrated in Figure 4. If thetime needed for separation is markedly longer, as it is with chiral separations with longmigration-paths, the theoretical plate numbers are diminished drastically. This phenomenonof longitudinal diffusion is amplified by the additional complexing equilibrium - theinteraction with the chiral selector.

5-8
400 500 600 700 800 900 1000 1100
cross injection /capillaryE = 0.60 kV/cm
cross injection/chipE = 0.62 kV/cmseparation length: 8 cm
80 100 120 140 160
Microchip: sl = 8 cm, it = 2 s3.9 mg/ml SCD, HV: 4 kV
time/s
D-Normetanephrine
L-Normetanephrine
Methoxytyramin
D-MetanephrineL-Metanephrine
time/s
Figure 4: Comparison of a chiral separation of cation metabolites between microchip and capillary (Ncorresponds to D-Normetanephrine).
5.2.1 InjectionAn exact injection plug length and a narrow sample zone are important criteria for highlyefficient separations in electrophoresis. In microchip CE, injection of sample is generallyachieved through tee or cross like structures. From the standpoint of enhancing separationresolution, it is desirable to minimize the width of the injected sample plug. This can beachieved by reducing the cross-sectional dimensions of the microfluidic channel in thevicinity of the injection region. However, using geometry alone to reduce the injectedvolume also reduces the amount of sample injected. The challenge thus is to developtechniques capable of achieving simultaneous pre-concentration and focusing of theinjected sample.
Electrokinetic techniques using an applied electric field as a driving force are by far themost widely used injection schemes in microfabricated electrophoresis devices.Electrokinetic injection (EKI) is easy to implement on planar chip systems without greattechnical efforts. However, despite a satisfactory reproducibility of injected volume, EKIhas the disadvantage of discrimination between the analyte molecules. The component withsmaller electrophoretic mobility will be less injected than components with higher mobility.The sample volume and the length of the sample plug depends on three steps: the loadingof analyte into the sample channel, the injection into the intersection and finally theseparation of sample zone in the separation channel. All steps can be controlled byindependent voltage supplies. With regard to the applied voltage within every step, theinjection methods can be classified into simplest, gated, pinched and floating injection(Figure 5).
The simplest version of analyte injection by a tee- or cross-injector is carried out withoutvoltage control (inlet and outlet of sample and buffer vials), as shown in Figure 5 (simplestinjection). The sample length depends on the injection time and is also defined by injector

5-9
geometry. In comparison to injection methods that control the voltage during the injectionand separation phases (pinched voltage), the resolution (distorted peaks) and separationefficiency is decreased and the baseline is disturbed (continuous, slight flow of sampleentering the separation channel). In the floating and pinched injection modes, a pinchingvoltage is applied during the separation process to draw the analyte flow back to the samplereservoirs. The junction potential at the channel intersection not only results from theapplied voltages to buffer and sample reservoirs but also the resistance in all channels haveto be known. In contrast to the floating injection, the sample plug length injected bypinched injection is independent of injection time and is defined by injector geometry andthe magnitude of pinched voltage. Unlike the pinched/floating approach during gatedinjection the sample flows at a 90° angle (injection channel sample, waste). Once again,three different potentials are essential during the loading, injection and separation process(Figure 6 (a)-(c)).
A further improvement regarding the leakage of sample into the separation channel hasbeen demonstrated by applying narrow sample channel (NSC; cross and tee) injectors2
(the sample channel width is one-fifth of the separation channel width). Both the separationefficiency and sensitivity have been increased. Furthermore, no leakage control is necessary(pinched injection) and, consequently, the operation procedure is simplified.
Figure 5 (from 2): Schematic diagrams of CE procedures with pinched injection (top panels), floatinginjection (middle), and simplest injection mode (bottom).
Recently, pressure-based injection techniques have been proposed as alternatives toelectrokinetic injection, but they are still in infancy. Besides the hydrostatic injection(siphoning injection), created by different electrolyte/sample levels, hydrodynamicinjection (pressure pulse injection) has been demonstrated 3. Pressure pulsed (of few
2 Zhang, C.-X.; Manz, A. Analytical Chemistry 2001, 73, 2656-2662, Narrow sample channel injectors for capillaryelectrophoresis on microchip.3 Backofen, U.; Matysik, F. M.; Lunte, C. E. Analytical Chemistry 2002, 74, 4054-4059, A chip-based electrophoresissystem with electrochemical detection and hydrodynamic injection, Gai, H. W.; Yu, L. F.; Dai, Z. P.; Ma, Y. F.; Lin, B.

5-10
hundred milliseconds) injection coupled with electrokinetic control of fluids isdemonstrated in Figure 6. Pressure injection techniques do not depend on the charge ofanalyte molecule and are characterized by a strong reduction in discrimination betweenanions and cations.In the BGPI (back gated pressure injection) mode, the sample is electrokinetically driven(gated injection) to the channel junction and a pressure pulse exists in direction of the EOF.Similar to the BGPI mode is the loading of the sample by gated injection. However, theinjection in the separation channel is carried out with a pressure pulse opposite to the EOF.Both methods allow highly reproducible injection volumes with elimination of thediscrimination effect typical for electrokinetic injections.
Figure 6 (from 3): Schematic diagrams of the channel flow, loading and dispensing step on a EKI(electrokinetic injection) chip in gated injection flow (a–c), BGPI (back gated pressure injection) (d–f) andFGPI (front gated pressure injection) chip (g–i), respectively. P = pressure reservoir, S = sample reservoir,W=waste reservoir, B= buffer reservoir and A= analyte waste reservoir. The arrows in the channelsrepresent the EOF. The actuation is represented by a black arrow on the pressure reservoir while the inducedpressure is schematically represented by the double arrow.
5.2.2 Current detection methods on microchip – the advantage of EC-detectionLaser-induced-fluorescence (LIF) detection is commonly employed in microfluidicdevices because it provides relatively low detection limits and enables a direct focusing of alaser onto the small channel 4. Recently, Johnson and Landers 5 have reviewed
C. Electrophoresis 2004, 25, 1888-1894, Injection by hydrostatic pressure in conjunction with electrokinetic force on amicrofluidic chip, Lacharme, F.; Gijs, M. A. M. Sensors and Actuators B-Chemical 2006, 117, 384-390, Pressureinjection in continuous sample flow electrophoresis microchips.4 Ocvrik, G.; Tang, T.; Harrison, D. J. Analyst 1998, 123, 1429-1434, Optimization of confocal epifluoresscencemicroscopy for microchip-based miniaturized total analysis systemes.; Yi, C. Q.; Zhang, Q.; Li, C. W.; Yang, J.; Zhao,J. L.; Yang, M. S. Analytical and Bioanalytical Chemistry 2006, 384, 1259-1268, Optical and electrochemical detectiontechniques for cell-based microfluidic systems.5 Johnson, M. E.; Landers, J. P. Electrophoresis 2004, 25, 3513-3527, Fundamentals and practice for ultrasensitivelaser-induced fluorescence detection in microanalytical systems.

5-11
instrumentation and practice of LIF detection on microchips. Compared to direct detectionmethods, the disadvantage of LIF is the lack of fluorescent properties of most compounds.For example, proteins have to be derivatized for fluorescence detection and thus give onlyslightly better sensitivity than UV absorption. Also if LIF detection on microchip basedsystems is established as routine and is commercialized, there is a need for alternativedetection methods.
Absorbance detection is the most often used detection method in CZE and HPLC systems.However, this preference was not transferred to the microchip as the on-chip measurementof absorbing species has proven to be challenging, mainly because of the short optical pathlength (channel depth) in miniaturized systems and the difficulties in coupling the light intoand out of these channels.UV detection eliminates the need for sample derivatization; however, the short opticalpathlengths result in only limited sensitivity. One of the established fields in MCelectrophoresis is the analysis of biomacromolecules such as oligonucleotides. MC methodscompete with capillary CE and classical gel electrophoresis. This is also reflected in thecommercialization of microchip systems with integrated fluorescence detection (Agilent) orUV detection (Hitachi and Shimadzu). The MCE station from Shimadzu is equipped with alinear imaging UV detector that allows the monitoring of concentration profiles. Despitethis progressive technique, the detection sensitivity is limited and detection at analyteconcentrations below 0.5 mM is unreliable, especially for small molecules.
Electrochemical detection can be divided into four general areas: amperometric,voltammetric, conductometric and potentiometric techniques 6. Amperometric detectioncontinues to be the most popular method for electrophoretic separations on chip. Thesimplicity of amperometric detection and the accompanying high selectivity/sensitivity aswell as the potential for miniaturization makes it particularly attractive for microfabricateddevices 7. The most prevalent areas of application of amperometric detection areneurochemistry, enzyme/immunoassays, environmental analytics and clinical diagnostics(for a summary, see review 8). However, most publications deal with easily separablereference compounds.
Amperometric detection is based on measuring the oxidation or reduction currents ofanalytes at a working electrode. It has the advantage of generally good detection limits butis restricted to electroactive species. Conventional potentiostats for amperometricmeasurements employ a counter electrode and a reference electrode in addition to the
6 Schwarz, M. A.; Hauser, P. C. Lab on Chip 2001, 1, 1-6, Recent developments in detection methods formicrofabricated analytical devices.7 Wang, J.; Tian, B.; Sahlin, E. Analytical Chemistry 1999, 71, 3901-3904, Integrated electrophoresischips/amperometric detection with sputtered gold working electrodes, Wang, J.; Tian, B.; Sahlin, E. AnalyticalChemistry 1999, 71, 5436-5440, Micromachined electrophoresis chips with thick-film electrochemical detector, Wang,J.; Pumera, M. Analytical Chemistry 2002, 74, 5919-5923, Dual conductivity/amperometric detection system formicrochip capillary electrophoresis, Woolley, A. T.; Lao, K.; Glazer, A. N.; Mathies, R. A. Analytical Chemistry 1998,70, 684-688, Capillary electrophoresis chips with integrated electrochemical detection, Osbourn, D. M.; Lunte, C. E.Analytical Chemistry 2003, 75, 2710-2714, On-column electrochemical detection for microchip capillary electrophoresis.8 Vandaveer, W. R.; Pasas, S. A.; Fischer, D. J.; Frankenfeld, C. N.; Lunte, S. M. Electrophoresis 2004, 25, 3528-3549, Recent developments in electrochemical detection for microchip capillary electrophoresis, Vandaveer, W. R.;Pasas, S. A.; Martin, R. S.; Lunte, S. M. Electrophoresis 2002, 23, 3667-3677, Recent developments in amperometricdetection for microchip capillary electrophoresis.

5-12
working electrode. Together with the electrophoretic ground (EG), a total of four electrodeshave to be placed at the end of a channel or capillary, which is a very demandingconstruction. The research group of Hauser has developed a significantly simplified two-electrode detection system for capillaries 9. It requires only a working electrode and theelectrophoretic ground to complete the electrochemical cell. The EG acts simultaneously asa reference and a counter electrode. In particular, the elimination of a conventionalreference avoiding an internal electrolyte and liquid junction is a strong impetus for furtherminiaturization.
Figure 7: The simplified amperometric end-channel detection. The Teflon-coated Au-wire is positioned at thechannel end.
Such a simplified two-electrode unit could be successfully integrated into a micromachinedelectrophoretic separation device (see Figure 7). Its applicability has been proven by thedetermination of neurotransmitters, ascorbic acid and phenols with a micro-channelelectrophoresis device equipped with gold or platinum working electrodes 10. The analysisof carbohydrates, ascorbic acid and amino acids using copper working electrodes was alsodemonstrated, although the electrochemical oxidation of carbohydrates is not fullyunderstood. An addition of Cu2+ salts to the background electrolyte led to a nearly tenfoldincrease of the detection signal. This effect has not been reported previously and could beattributed to indirect oxidation of the analyte in the presence of catalytically acting Cu2+
ions 11. The resulting separation efficiency and sensitivity of the micro device werecomparable to that of a conventional capillary system with amperometric detection.Analysis time could be reduced by a factor of 10.
5.3 Separation selectivity of biogenic monoamines (P1, P2)The relative order of solute migration, the selectivity, can be controlled by differentseparation mechanisms. Often, the selectivity is altered by changing pH or with the help ofadditives in the running buffer. By altering the pH, the charge and migration behavior ofthe analyte are directly influenced. This means that similar analytes with similar pKA values
9 Kappes, T.; Galliker, B.; Schwarz, M. A.; Hauser, P. C. Trac-Trends Analytical Chemistry 2001, 20, 133-139,Portable capillary electrophoresis instruments with amperometric, potentiometric and conductometric detection.10 Schwarz, M. A.; Galliker, B.; Fluri, K.; Kappes, T.; Hauser, P. C. Analyst 2001, 126, 145-151, A two-electrodeconfiguration for simplified amperometric detection in a microfabricated electrophoretic separation device.11 Colon, L. A.; Dadoo, R.; Zare, R. N. Analytical Chemistry 1993, 65, 476-481, Determination of carbohydrates bycapillary zone electrophoresis with amperometric detection at a copper microelectrode.

5-13
cannot be separated by alteration of pH. For this reason, buffer additives with differentinteraction mechanisms such as surfactants (partition equilibria) or ligands (complexationequilibria) could be effective. Some CZE-methods are described according to the type ofbuffer additive (MEKC (micellar electrokinetic chromatography) for surfactants, chiralCZE if chiral selectors are used) and are discussed in literature separately concerning theirseparation mechanism.The choice of additives knows no bound. It can be assumed that in the future many novelbuffer ligands will be introduced, especially in the context of miniaturization of separationdevices (e.g. functionalized dendrimers and proteins). In the following section, resolution,time window and selectivity are optimized by applying complexing agents appropriate forthe demanding separation of amines and amino acids.
Selectivity can control the resolution, an important aspect for separations within shortmigration lengths. Figure 8 compares the microchip separation of the 3 neurotransmitters(dopamine (D), noradrenaline (NA) and adrenaline (A)) to the separation of the samespecies in standard capillary electrophoresis with amperometric detection. Dopamine,noradrenaline and adrenaline are amines based on a benzene ring with two vicinalhydroxyl-groups and are generically called catecholamines. Only the amine side chaindiffers, causing slight changes in ionic mobility.
Identical concentrations of the catecholamines were used and the channel cross-sectionswere similar in both cases (dimensions of the semicircular channel on the planar device areapproximately 50 µm width and 20 µm depth). The resolution was calculated as 1.66 and1.98 for the planar and conventional system, respectively (for peaks 1 and 3 in both cases);in this regard the performance is similar. On the planar arrangement the separation could beachieved approximately 6 times more rapidly.
The resolution but also the acceptable separation efficiency on microchip are contradictoryto the available time window for cations, neutral molecules and slow anions (relationbetween analyte zone and separation length) in which the analyte can be detected.Injections of further analytes with similar migration behavior, e.g. the metabolites, couldcause a sample overloading. Selective interacting buffer molecules are required, to use thefull capacity of the restricted time window. One of the aims was to develop separationmethods that are able to measure all monoamines and their metabolites (see Scheme 1) inone separation run.

5-14
Figure 8: Separation of (1) dopamine, (2) noradrenaline and (3) adrenaline on microchip (left, 8 cmseparation length, 0.3 kV/cm) and capillary (right, 104 cm separation length, 0.6 kV/cm); conditions: 50 mMMES/phosphate (pH 6.5), detection potential: 1100 mV
The determination of biogenic catecholamines and their metabolites is of high clinicalimportance in the diagnosis of various neurological diseases (e.g. Shy-Drager syndromeand Parkinson’s disease). Parkinson’s disease is a neurodegenerative disorder characterizedby selective loss of dopaminergic neurones in the substantia nigra resulting in progressivedisability. Therapy has focused on replacing depleted D via supplementation with L-DOPA(3,4-dihydroxyphenylalanine), often combined with CDOPA (peripheral decarboxylaseinhibitors). Dihydroxyphenylserine (DOPS), a synthetic amino acid, has a potential as anagent for NA precursor therapy. Despite a broad knowledge of fundamental metabolicpathways, little is known about physiological concentrations of metabolites in vivo. This islargely due to the unavailability of suitable analytical tools.
Catecholamines act via dopaminergic and adrenergic receptors and are involved in a varietyof regulatory processes. The structures and metabolic pathways of neurotransmitters in thehuman brain are shown in Scheme 1. The biogenic catecholamines (D, A, NA) arecatabolized by catechol-O-methyl-transferase (COMT) to the products normetanephrine(NME) and metanephrine(ME). Homovanillic acid (HVA) is the common end-product oftwo pathways for the metabolism of dopamine in the human brain. Most of theneurotransmitter is converted into dihydroxyphenylacetic acid (DOPAC) before beingmetabolized to HVA. A small portion of dopamine is converted into methoxytyramine(MT) and subsequently oxidized to HVA.
9.59.08.58.07.5time / min
1
2
3
1 nA
1009080706050time/s
2 nA
1 2
3

5-15
HO
HO
COOH
DOPAC
Scheme 1: The metabolic pathway of monoamines in the human brain and the structure of DOPAC.
Thus, it is of great interest to develop analytical methods for the direct simultaneousdetermination of these species in brain dialysates or in urine in order to monitor theconcentration of certain species (e.g. homovanillic acid and methoxytyramine) or todirectly study the effect in the blood plasma of any drug given. Electrophoretic methods areparticularly interesting due to the simple preparation of biological fluids; in the most casesthe sample can be analyzed without prior purification steps. To date HPLC methods withelectrochemical or fluorescence detection have been employed for these analysis.Compared to electrophoretic separation methods, relatively large volumes of sample areessential (about 100 μl) and the time required for one analysis is 30-45 min (CZE: ≈10min).
5.3.1 Separation selectivity modified by complexing equilibriaThe advantageous application of "complexing" agents (cyclodextrins, dendrimers and non-chiral crown ethers) could be demonstrated by the simultaneous separation of the biogenicmonoamines D, A, NA, their precursors DOPA and DOPS as well as metabolites(methoxytyramine, metanephrine, normetanephrine, homovanillic acid). Up to nowelectrophoretic separations have been investigated in noncomplexing media or with SDS(sodium dodecylsulfate) micelles12. In none of these studies have all species beenconsidered.
The separation of amines and amino acids is complicated due to their similarelectrophoretic migration behavior (Figure 9). Neither changes in pH nor in ionic strengthin the background buffer lead to a baseline separation. Addition of ligand molecules thatcan distinguish between the analytes on the basis of different complexation equilibria is one
12 Wallingford, R. A.; Ewing, A. G. Journal of Chromatography 1988, 441, 299-309, Retention of Ionic and Non-IonicCatechols in Capillary Zone Electrophoresis with Micellar Solutions, Wallingford, R. A.; Ewing, A. G. AnalyticalChemistry 1989, 61, 98-100, Separation of Serotonin from Catechols by Capillary Zone Electrophoresis withElectrochemical Detection, Wallingford, R. A.; Ewing, A. G. Analytical Chemistry 1988, 60, 258-263, AmperometricDetection of Catechols in Capillary Zone Electrophoresis with Normal and Micellar Solutions, Paxon, T. L.; Powell, P.R.; Lee, H. G.; Han, K. A.; Ewing, A. G. Analytical Chemistry 2005, 77, 5349-5355, Microcolumn separation of aminemetabolites in the fruit fly.
NH2
COOHHO
NH2
COOHHO
HO NH2HO
HO
NH2
HO
CH3O
COOH
HO
CH3O
NH2
OHHO
HO
NH2CH3OOH
HO
NHCH3OCH3
OH
HO
OH CH3NHHO
HO
L-DOPA
COMT
Dopamine-hydroxylase
COMT
COMT
DOPA-decarboxylase
Tyrosine-hydroxylase
L-Noradrenaline (NA)
NH2
COOH
OHHO
HOL-threo-DOPS
NH2
COOH
HO
HOL-DOPA
NHNH2
COOH
CH3HO
HO
L-Tyrosine
L-Normetanephrine (NME)
L-Metanephrine (ME) L-Adrenaline (A)
Homovanillic acid(HVA)
Methoxytyramine (MT)Dopamine (D)
L-CDOPA(Inhibitor)

5-16
way to separate them. As shown in Figure 9 (black electropherogram, (b)), the ionicmobility of adrenaline is more changed in the presence of SCD (sulfonated cyclodextrin)than that of L-DOPA. Furthermore, despite the relatively high pH (and a high EOF), A canbe separated into its enantiomers due to the capability of SCD to discriminate stericaldifferences. Normally, chiral separations are carried out in an acidic medium. In contrary tothe metabolites, all catecholamines show a strong binding to SCD.
Figure 9: MC-Electropherogram (red) of D, A, NA, ME, NME, MT, L-DOPA, DOPS, CDOPA and HVwithout any additives and (black) of L-DOPA and A in presence of SCD (3.9 mg/l, pH 6.7).
The separation of metabolites as well as the anionic precursors DOPA (for D) and DOPS(for NA) was successful only by using a combination of an anionic cyclodextrin and non-chiral crown ether in the background electrolyte resulting in the formation of a sandwichcomplex (see P2, figure 6). Complexation of analyte with CD and crown ether is alwaysreflected by longer migration times. The principle of the separation is the moderateinteraction between SCD and cationic metabolites (NME, ME and MT). In contrast, theanionic species HVA, DOPA and CDOPA are nearly unaffected, and only a chiralseparation of D/L-DOPA has been observed. Note, that the absence of chiral discriminationof the enantiomers is no evidence for the absence of interaction of the analyte with the CD.
Polyacidic dendrimers with an amido-based core have been used as a pseudostationaryphase for alteration of the separation selectivity of cationic catecholamines beside theirmetabolites (Figure 10). Dendrimers belong to a relatively new class of synthetic organicmacromolecules that could represent a satisfactory micellar environment for electrophoreticseparations.Dendrimers are synthetic, highly branched, nearly spherical and symmetricalmacromolecules with well-defined sizes and compositions. Compared to micelles,dendrimers feature higher homogeneity, the core is void and could be hydrophilic. Whereas
10080604020time / s
D, MT
NA, NME
A, ME
DOPA, DOPS,
HV
DOPA
L-A
D-A
2 nA
a
b
20 nA
CDOPA

5-17
micelles are an assembly of small molecules, dendrimers feature a more rigid structure.Tailored dendrimers can be synthesized by appropriate selection of the cores, connectingunits, branching sites and terminal groups. To date, dendrimers have become important in awide range of applications in catalysis, drug delivery and as biosensors but are alsobecoming utilized in analytics as selective stationary/pseudostationary phases.
Despite the good electrokinetic performance provided by dendrimers, relatively fewapplications have been described so far 13. Gray et al. demonstrated that novel sulfonicacid-modified STARBURST dendrimers can be used successfully for the separation ofneutral phenols 14. While the resolution is comparable with SDS micelles, dendrimers areresponsible for higher theoretical plate numbers and better peak shapes. To date, with theexception of the studies shown in P2, dendrimers alone, without further interactionmolecules, have been applied as pseudostationary phase. Further published studiesemploying dendrimers as analytes (characterization of poly(amidoamine) 15 and themeasurement of the ionic mobility of carboxylic acid-terminated dendrimers 16 as afunction of the pH and ionic strength) are of fundamental interest for the control of thehomogeneity and for understanding the separation mechanism.
By applying low concentrations of dendrimer of generation 1.5, the simultaneousdetermination of D, NA and A is possible (Figure 10 (b)). Interestingly, the presence ofdendrimers and cyclodextrins shows a synergistic effect on the electrophoretic resolution ofthe enantiomers of NA and A. Only a low concentration of CD is required in order to alterthe ionic mobility of the catecholamines in an acceptable migration window (Figure 10(c)). While a concentration of 1.2 mg/ml of CMCD (carboxymethylated CD) is satisfactoryfor a baseline separation of enantiomers (A, NA) if used in combination with dendrimer,without dendrimer a significantly higher concentration is essential (5.2 mg/ml, see Figure13). However, high CD concentrations should be avoided because dopamine forms stablehost-guest complexes that cannot be detected on the cathodic site (normal mode in CZE).A very careful optimization of the concentration of the modifiers as well as of the pH isrequired to achieve optimum separation. The strength of interaction can vary with pH dueto changes in the protonation state of the dendrimer and analyte. At neutral pH, thedendrimer is negatively charged and migrates against the EOF. At acidic pH and higherconcentrations of dendrimers, the analytes cannot be determined due to the strongassociation with dendrimer molecule.
13 Castagnola, M.; Zuppi, C.; Rossetti, D. V.; Vincenzoni, F.; Lupi, A.; Vitali, A.; Meucci, E.; Messana, I.Electrophoresis 2002, 23, 1769-1778, Characterization of dendrimer properties by capillary electrophoresis and their useas pseudostationary phases, Gao, H.; Carlson, J.; Stalcup, A. M.; Heineman, W. R. Journal of ChromatographicScience 1998, 36, 146-154, Separation of aromatic acids, DOPA, and methyl-DOPA by capillary electrophoresis withdendrimers as buffer additives, Gray, A. L.; Hsu, J. T. Journal of Chromatography A 1998, 824, 119-124, Novelsulfonic acid-modified Starburst dendrimer used as a pseudostationary phase in electrokinetic chromatography, Tanaka,N.; Fukutome, T.; Tanigawa, T.; Hosoya, K.; Kimata, K.; Araki, T.; Unger, K. K. Journal of Chromatography A1995, 699, 331-341, Structural Selectivity Provided by Starburst Dendrimers as Pseudostationary Phase in ElectrokineticChromatography.14 Gray, A. L.; Hsu, J. T. Journal of Chromatography A 1998, 824, 119-124, Novel sulfonic acid-modified Starburstdendrimer used as a pseudostationary phase in electrokinetic chromatography.15 Ebber, A.; Vaher, M.; Peterson, J.; Lopp, M. Ibid.2002, 949, 351-358, Application of capillary zone electrophoresisto the separation and characterization of poly(amidoamine) dendrimers with an ethylenediamine core.16 Huang, Q. R.; Dubin, P. L.; Moorefield, C. N.; Newkome, G. R. Journal of Physical Chemistry B 2000, 104, 898-904, Counterion binding on charged spheres: Effect of pH and ionic strength on the mobility of carboxyl-terminateddendrimers.

5-18
OO
O
OOO
(b)
(a)
(c)
N
O
NH
NHO
N
N
O NH
HN
O
O
HNNHO
N
N
N
N
O
O-
O
O-O
O
O-
O
O -
O -O
O
O
O-
O -
O-
Figure 10: left: Electropherogram of catecholamines and metabolites (a) with CMCD (10 mg/ml, pH=3) and18-crown-6 (38 mM), (b) dendrimers (5 mg/ml) and (c) CMCD (1.2 mg/ml) and dendrimers (1 mg/ml). Right:structure of (a) polyamidoamine dendrimer of generation 1.5, (b) 18-crown-6 and β-CD with variablesubstituents R..
Generally, the following conclusion could be derived from evaluated methods:
CDs interact more strongly with catecholamine than with methoxy-catecholamineor catechol amino acids
sulfonated CD shows a stronger binding than carboxylated CDs crown ethers distinguish between primary and secondary amines anionic dendrimers improve the separation of catecholamines; a synergistic effect
between CD and dendrimers has been proved at low pH and in the presence of CD the migration times are strongly delayed by
reduced EOF and by formation of stable complexes with catechol molecules
5.3.2 Separation selectivity modified by partition equilibria (MEKC, P6)In this section the use of MEKC to control the selectivity of the mentioned amines andamino acids is illustrated. As shown later, the methods using CD and crown ethers interferewith the detection characterized by an enzyme-catalyzed enhancement of amperometricoxidation current. The experiments were designed to achieve separations using a verycomplex system, containing two different pseudostationary phases (micelles anddendrimers) in order to enable the determination of cationic NT and M (metabolite) in brainhomogenate and urine. The challenge of method development comprised not only in the

5-19
finding of suitable molecules for an interaction with the analyte but also limitations arisingfrom the presence of the additives. Higher additive concentration induces a highelectrophoretic current and is a critical point in microchip separations. Here, we show forthe first time the simultaneous separation of all cationic NT and M species on the basis ofan electrophoretic separation that does not generate a high electrophoretic current and istherefore suitable for short separation lengths within 2-3 min, too.
By the addition of surfactants to the background electrolyte, new possibilities for solvingelectrophoretic separation problems are opened. This technique could also be applied to thestudy of interactions between surface active compounds and analyte molecules. The termMicellar Affinity Capillary Electrophoresis (MACE) has been used to describe the study ofsuch interactions employing the same phenomena as in MEKC 17.In MEKC as a separation tool mainly anionic surface active compounds, in particular SDS,have been used. SDS and all other anionic surfactants have a negative net charge,dependent on the pH and, therefore, the micelles have negative electrophoretic mobility andmigrate towards the anode (in the opposite direction to the EOF). Anionic species,including surfactants, do not interact electrostatically with the negatively charged surface ofthe capillary. Detection/separation strategies, analyte determinations and applications inmicellar electrokinetic capillary chromatography have been reviewed recently 18.
Theory: In analogy to chromatography the capacity factor (kP) can be defined as the ratio ofthe residence time of the analyte molecule in the mobile (aqueous) and "stationary" (=pseudostationary, micellar) phases (Nernstian distribution). KP (partition coefficient) and kPare derived as follows:
aqmcP P
mcaq
VAK k
VA
(2)
0
01A
P Pmc
s CMCk K
s CMC
(3)
([A]mc/[A] aq - concentration of analyte A in micellar or aqueous phase, [s0]-concentrationof surfactant, Vmc/ Vaq – volume of micellar or aqueous phase, v – partial molar volume ofmicelle, CMC – critical micelle concentration)
For Equation (3) it is assumed that the volume of the micellar phase is proportional to thetenside concentration and that the partial molar volume remains constant. It is also assumedthat the ionic mobility of the micellar phase does not change on taking up a solute (mc =const.). In contrast to HPLC, substances which have an infinitely high kP-values, i.e. whichare completely dissolved in the micellar phase, can be detected. In MEKC the samplemolecule migrates with the mobility of the pseudostationary phase, the micelle.
Separation of amines: The partition between the micellar and aqueous phase may be usedfor the separation of neurotransmitters. D, NA and A have been successfully separated in
17 Neubert, R. H. H.; Schwarz, M. A.; Mrestani, Y.; Platzer, M.; Raith, K. Pharmaceutical Research 1999, 16, 1663-1673, Affinity capillary electrophoresis in pharmaceutics.18 Pappas, T. J.; Gayton-Ely, M.; Holland, L. A. Electrophoresis 2005, 26, 719-734, Recent advances in micellarelectrokinetic chromatography.

5-20
TES (N-tris(hydroxymethyl)-methyl-2-amino-ethanesulfonic acid) buffer in the presence ofSDS micelles 19. Interaction with SDS micelles in combination with borate complexationwas also successfully applied for the simultaneous separation of the NT and other anionicmetabolites 20. In none of these investigations, the simultaneous separation of all cationicNT and M can be achieved with short migration lengths.
SDS
SDS/Borat
SDS (no separation)
G1.5
Borat
NT
M
Scheme 2: Alteration of the ionic mobility by micelles (SDS), complexation with borate and dendrimers.
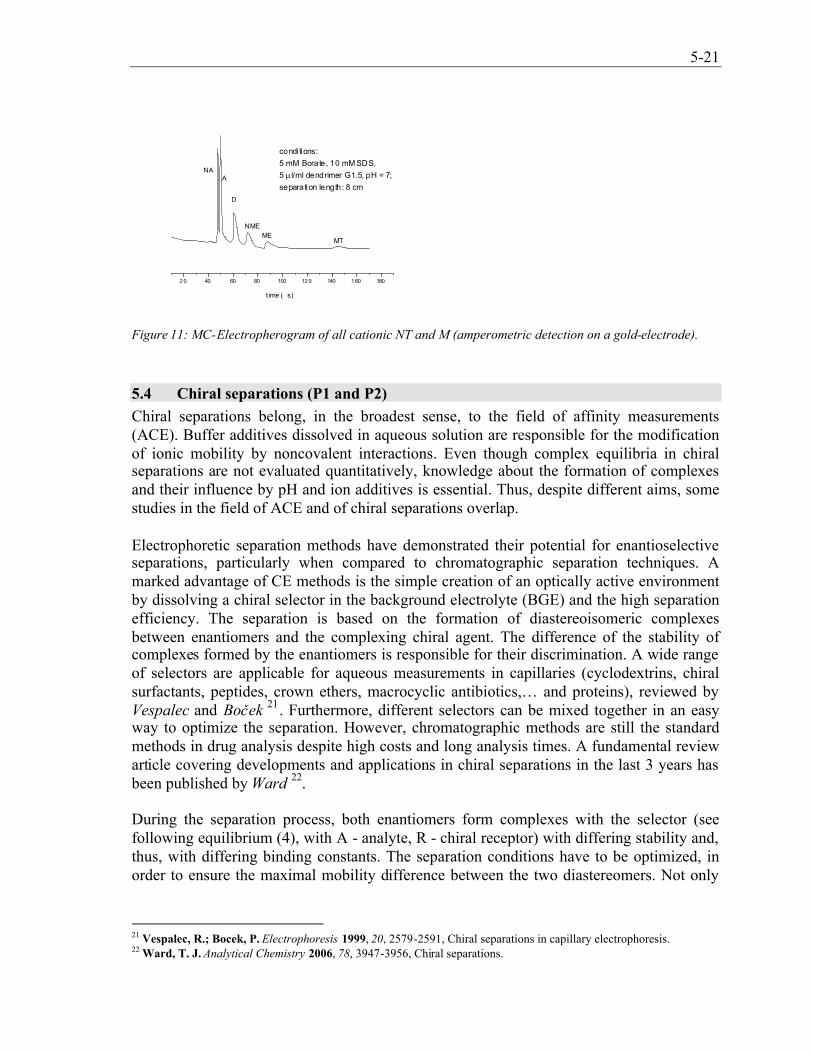
Neither by varying the SDS concentration nor by adjusting the borate concentration asuccessful separation of cationic NT and M was achieved; also with separation incapillaries of about 60 cm. As illustrated in Scheme 2, the addition of micelles causes astrong shift in ionic mobility of both cationic NT and M. According to their lipophilicity,A, NA and D, respectively, have been detected. The M mobilities are altered in the sameorder as the NT. Unfortunately, A/ME and NA/NME have nearly the same partitioncoefficients whereby the analytes cannot be distinguished.By extension of the existing partition equilibrium with a further complexing additive, suchas borate, the apparent ionic mobility of the cationic catecholamines can be increased.Borate forms stable, anionic complexes only with dihydroxyamines. However, at the ratioof 4/2 ([SDS]/[borate]) two analyte zones migrate with the same velocity. Furtherincreasing of borate concentration results in an extensive electrophoretic current with theconsequence of lower detection sensitivity as well as co-migration of A and NA zones.Only with a second pseudostationary phase present in the running buffer the separation wassuccessful (Figure 11). By using dendrimer G1.5 in combination of the SDS micellarphase, the metabolites have been shifted to longer detection times without affecting thepartition equilibrium with the SDS phase.
19 Ream, P. J.; Suljak, S. W.; Ewing, A. G.; Han, K. A. Analytical Chemistry 2003, 75, 3972-3978, Micellarelectrokinetic capillary chromatography-electrochemical detection for analysis of biogenic amines in Drosophilamelanogaster, Suljak, S. W.; Swanek, F. D.; Gavin, P. F.; Ewing, A. G. Journal of Separation Science 2003, 26, 61-68,Analysis of chemical processes at single bovine adrenergic chromaffin cells with micellar electrokinetic capillarychromatography and electrochemical detection.20 Wallingford, R. A.; Ewing, A. G. Analytical Chemistry 1989, 61, 98-100, Separation of serotonine from catechol bycapillary zone electrophoresis with electrochemical detection, Paxon, T. L.; Powell, P. R.; Lee, H. G.; Han, K. A.;Ewing, A. G. Analytical Chemistry 2005, 77, 5349-5355, Microcolumn separation of amine metabolites in the fruit fly.
5-21
2 0 40 60 80 100 12 0 140 1 60 180
MTME
NME
D
ANA
condi tions:5 mM Borate, 10 mM SDS,5 l/ml dendrimer G1.5, pH = 7;separation length: 8 cm
t ime (s)
Figure 11: MC-Electropherogram of all cationic NT and M (amperometric detection on a gold-electrode).
5.4 Chiral separations (P1 and P2)Chiral separations belong, in the broadest sense, to the field of affinity measurements(ACE). Buffer additives dissolved in aqueous solution are responsible for the modificationof ionic mobility by noncovalent interactions. Even though complex equilibria in chiralseparations are not evaluated quantitatively, knowledge about the formation of complexesand their influence by pH and ion additives is essential. Thus, despite different aims, somestudies in the field of ACE and of chiral separations overlap.
Electrophoretic separation methods have demonstrated their potential for enantioselectiveseparations, particularly when compared to chromatographic separation techniques. Amarked advantage of CE methods is the simple creation of an optically active environmentby dissolving a chiral selector in the background electrolyte (BGE) and the high separationefficiency. The separation is based on the formation of diastereoisomeric complexesbetween enantiomers and the complexing chiral agent. The difference of the stability ofcomplexes formed by the enantiomers is responsible for their discrimination. A wide rangeof selectors are applicable for aqueous measurements in capillaries (cyclodextrins, chiralsurfactants, peptides, crown ethers, macrocyclic antibiotics,… and proteins), reviewed byVespalec and Boček 21 . Furthermore, different selectors can be mixed together in an easyway to optimize the separation. However, chromatographic methods are still the standardmethods in drug analysis despite high costs and long analysis times. A fundamental reviewarticle covering developments and applications in chiral separations in the last 3 years hasbeen published by Ward 22.
During the separation process, both enantiomers form complexes with the selector (seefollowing equilibrium (4), with A - analyte, R - chiral receptor) with differing stability and,thus, with differing binding constants. The separation conditions have to be optimized, inorder to ensure the maximal mobility difference between the two diastereomers. Not only
21 Vespalec, R.; Bocek, P. Electrophoresis 1999, 20, 2579-2591, Chiral separations in capillary electrophoresis.22 Ward, T. J. Analytical Chemistry 2006, 78, 3947-3956, Chiral separations.

5-22
the magnitude of KB values is important for high resolution, but also the concentration ofchiral selector and the chemical environment are crucial factors.
B,D
B,L
K+ -n n-x+1D D
K+ -n n-x+1L L
A + xR A R
A + xR A R
(4)
To date, chiral separations on microchip are in their infancy and are restricted to aminoacids and a few biogenic amino compounds (P10, chapter "chiral separations"). Thus, it isnot surprising that only a few chiral additives have been investigated. With the exception ofthe results shown here, only cyclodextrins with different functionality have been studied.However, it can be expected that the number of chiral applications, in research as well as inindustry, will increase noticeably in the forthcoming.
A dramatic reduction of analysis time as well as a reduction in consumption of opticaladditives can be expected by employing microfluidic devices for electrophoreticseparations. The latter is especially important if expensive chiral complexing agents have tobe employed. As shown in Figure 12, with a fixed migration length and time of 2.5 cmwithin 10 s and in presence of sulfonated CD in the running buffer, metanephrineenantiomers can be partially separated. Complete baseline separation can be expected onlonger migration paths (other chip design) or with extended separation times (e.g. bydecreasing the EOF). With higher detergent (CD) concentration no further enhancement ofresolution has been obtained. However, a baseline chiral separation of the same analyte hasbeen achieved with a 8 cm separation length and decreased CD concentration at a lower pHvalue (Figure 4).For comparison, Ludwig et al. 23 presented enantiomeric separations (on the same platformwith a separation length of 2.5 cm) using highly sulfonated cyclodextrins and this is thefastest chiral separation ever reported. The results of these measurements show the high-performance and the great potential of microchips for high-speed chiral separations.
The following investigations focus on the demanding and complicate separation of NT.Both the selectivity to the different analytes and the selectivity for the enantiomers have tobe taken into account. Under the given conditions, chiral separations are achieved, eventhough the enantiomeric separation is usually not important for biological systems, whereoften only one enantiomer is present in living organisms. The study of the unnaturalenantiomers could be meaningful if metabolites of mixed, racemic drugs are monitored.
23 Ludwig, M.; Kohler, F.; Belder, D. Electrophoresis 2003, 24, 3233-3238, High-speed chiral separations on microchipwith UV-detection.

5-23
2 4 6 8 10 12 14 16 18 20 22 24
reference moleculeD/L-DOPA
reference moleculeDMSO
6 mg/ml sulfated CDpH=7.37E=280 v/cm
metanephrine
s epara tion length [mm]
Figure 12: Enantiomeric separation of metanephrine (ME) by sulfonated CD, separation time: 10 s.
Initial results (P1) have shown that the selection of a suitable buffer optimization of ionicstrength enables enantioselective separations with good sensitivities (amperometricdetection) and with short migration times. Addition of different anionic cyclodextrins atvarious pH-values allows the enantiomeric specific separation of A, NA andpseudoephedrine in the normal electrophoretic polarity mode. Furthermore, by using mixedadditive systems (HP-/M-CD (hydroxypropyl-/methyl-CD) and crown ethers) thesynergistic effect concerning the resolution of enantiomers has been demonstrated (P1,figure 4). With this approach, electrophoretically indistinguishable catecholamines could beseparated in one run (D, NA and A). In the presence of 18-crown-6, noradrenaline forms aselective inclusion complex (Scheme 3), due to the presence of a primary amine group onthe NA molecule (P1, figure 5).
OH
OH
H2N
OO
O
OO
O
CO
OH
HOS
3
Scheme 3: Sandwiched complex formed by crown ether, analyte and CD.
A more complex system is described for the separation of biogenic monoamines and theirmetabolites as summarized in Scheme 1 (P2). Two groups of analytes with similar ionicmobility and similar structure are distinguishable: cationic and anionic ions. In the absenceof a complexing environment in the CE buffer, only the separation of these two groups hasbeen obtained (see Figure 9).By forming sandwiched complexes (crown ether-analyte-CD) all cationic metabolites andanionic precursors/metabolites have been separated, including the separation of

5-24
enantiomers. The CD acts in this system not only as a chiral selector but, additionally, as areceptor with different affinity to all analytes. In this way, the ionic mobilities of cations aremore shifted in comparison to the anions, e.g. HVA (P2, figure 6). On the other hand,crown ethers are essential for a differentiation between primary and secondary amines. Thesame separation principle was implemented for a successful separation of A and NAenantiomers (Figure 13). By increasing the CD concentration, the enantiomers of bothanalytes can be baseline separated but overlapping peaks (D-NA, L-A) cannot be separated.Crown ethers serve as a further additive and result in a shift of the racemate NA and thus,allows the complete separation.
Figure 13: Method development for chiral separation of adrenaline beside noradrenalin on microchip ((a):without additives, (b): 2.6 mg/ml CMCD dissolved in the CE-buffer, (c): 5.2 mg/ml CMCD dissolved in theCE-buffer, (d): 5.2 mg/ml CMCD and 12 nM crown ether dissolved in the CE-buffer; pH 3.0, not publishedresults).
An even more demanding objective was the separation of adrenaline and noradrenalinebeside the remaining analytes, the cationic metabolites (P2, figure 5). For the first time,dendrimers combined with CD have been applied in capillary/chip electrophoresis and areresponsible for a successful determination of all species. An interesting phenomenon is thefact that in presence of dendrimers a minimum of CD is required. Obviously, the interplayof sulfonated/carboxylated CD and carboxylated dendrimers causes an improvement in thechiral recognition of the CD. It is conceivable that in the presence of dendrimers, thehydrophilic amine group of the analytes is bound to the terminal groups of dendrimers byelectrostatic interactions. Further investigations with dendrimers as selective complexingreagents with various surface functions and various lipophilicity of the core, could bepromising for a wide range of analytes.
170160150140130120time /s
5 nA
L-NA
D-NA
D-AL-A
d
5.2 mg/ml CMCD12 mM 18-crown-6
11010510095908580time / s
5 nAL-NA
D-NAL-A
D-A
c
5.2 mg/ml CMCD
9085807570time / s
5 nAL-NA
D-NA
L-A
D-A
b
2.6 mg/ml CMCD
7065605550time /s
A
NA
5 nA
a

6-25
6 SENSITIVITY AND SELECTIVITY FOR AMPEROMETRIC DETECTIONOF NEUROTRANSMITTERS
In the following scheme (Scheme 4) the concentration of neurotransmitters in biologicalfluids are listed in relation to developed detection methods applied on microchips. One ofthe major challenges in analytics is the often very low concentration of analytes. Theconcentration of neurotransmitters in plasma samples is 102-103 times lower than in urineand is in the sub-nanomolar range. Hence the analysis of these compounds demands highsensitivity and selectivity of detection systems. Despite sensitive fluorescence andelectrochemical detection methods enrichment steps prior to injection are often inevitable(by cation exchange).
LOD of neurotransmitters (dopamine)- log (c)
urine
cerebrospinal fluidsbrain dialysates
plasma
HPLC-EC, F
enrichmentHPLC- EC, F, R
HPLC-EC, F
methods usedin diagnostic
methods developedon microchip
Amperometry withsimplifed electrode
arrangemnent
Amperometryglucose oxidase/glucose
carbon nanotubes
Amperometryglucose oxidase/glucose
and NADH
10 -10 M-5 -6
10 -10 M-7 -8
10 -10 M-8 -9
Enzyme immobilizedCNT electrodes
10 -10 M-9 -10
Scheme 4: Concentrations of NT in biological samples (left) and LOD of different detection methods coupledwith MC (EC – electrochemical, F – fluorescence, R – radioisotopic detection)
With a common amperometric detection system neither urine samples nor brain dialysatescan be analyzed. As shown below in detail and in the corresponding reports (P3, P4, P5and P6) different strategies have been followed to decrease the limit of detection (LOD)and thereby allow the analysis of these species in biological samples.Attempts to reach the low nM detection range by combination of carbon nanotubes (CNT)modified electrodes and free dissolved glucose oxidase (GOx) or immobilized GOx on thecarbon electrode were unsuccessful. The explanation is given in a later section (6.4.1).
6.1 Enzyme-catalyzed reactionsThe utilization of enzyme-catalyzed reactions coupled with an amperometric detectionsystem can influence the amperometric current of catecholamines in a simple way and is auseful tool for selective and sensitive measurements of biogenic monoamines. Two

6-26
different principles can be used to decrease the LOD: (i) by increasing the coulombicefficiency of the analyte and/or (ii) by increasing the number of recycles of the analyte atthe electrode surface. Catecholamines can easily be oxidized and the resulting quinone canthan be reduced by the enzymes. The typical redox behavior of catecholamines (and alsotheir O-methoxylated metabolites) makes this group of amines appropriate candidates forsubstrate recycling systems inducing an amplification of oxidation current.
Several electrochemical biosensors based on this approach have been described in thecurrent literature. Cellobiose dehydrogenase 24, glucose PQQ (pyrroloquinoline quinone)-dehydrogenase 25, laccase 26 , and tyrosinase 27 are enzymes that can be immobilized at anelectrode surface. One of the most described and fully developed biosensors based onimmobilized glucose oxidase (GOx) serves for the selective determination of glucose, but isalso suitable for measuring catecholamines and their cationic metabolites 28. All reportedbiosensors are based on cyclic reactions of the analyte between the electrode and theenzyme, although two different amplification principles can be distinguished.
The first group of enzymes reacts with the oxidation product of the analyte produced on theelectrode and the original (reduced) compound is formed. This can then be repeatedlyoxidized on the electrode and in this way the amplified oxidation current is recorded by thedetector. Reducing enzymes (cellobiose dehydrogenase, glucose dehydrogenase andGOx) are regenerated by the reaction with the natural substrate (cellobiose or glucose act assubstrate in the scheme in Figure 14 (left)), which is added in large excess.The second group of enzymes (Figure 14 (right), laccase and tyrosinase) reacts withcatecholamines and oxidizes them to the corresponding o-quinones. These are then reducedback at the working electrode which is held at a negative potential. The reducedcatecholamines then act as the substrate for the repeated enzyme reduction. With thisprinciple, the reduction current registered by the detector is amplified. The enzyme for allthese types of biosensor is regenerated by a coupled reaction. Oxygen serves for theregeneration of oxidizing enzymes.
24 Stoica, L.; Lindgren-Sjolander, A.; Ruzgas, T.; Gorton, L. Analytical Chemistry 2004, 76, 4690-4696, Biosensorbased on cellobiose dehydrogenase for detection of catecholamines.25 Lisdat, F.; Wollenberger, U.; Makower, A.; Hortnagl, H.; Pfeiffer, D.; Scheller, F. W. Biosensors Bioelectronics1997, 12, 1199-1211, Catecholamine detection using enzymatic amplification.26 Ghindilis, A. L.; Gavrilova, V. P.; Yaropolov, A. I. Ibid.1992, 7, 127-131, Laccase-Based Biosensor forDetermination of Polyphenols - Determination of Catechols in Tea, Leite, O. D.; Fatibello, O.; Barbosa, A. D. Journalof the Brazilian Chemical Society 2003, 14, 297-303, Determination of catecholamines in pharmaceutical formulationsusing a biosensor modified with a crude extract of fungi laccase (Pleurotus ostreatus).27 Pravda, M.; Petit, C.; Michotte, Y.; Kauffmann, J. M.; Vytras, K. Journal of Chromatography A 1996, 727, 47-54,Study of a new solid carbon paste tyrosinase-modified amperometric biosensor for the determination of catecholamines byhigh-performance liquid chromatography.28 Mizutani, F.; Yabuki, S.; Asai, M. Biosensors Bioelectronics 1991, 6, 305-310, Highly-sensitive measurement ofhydroquinone with an enzyme electrode.

6-27
Medred
Medox
enzymeox
enzymered
substrate red
electrode+ mV
2e
substrateox
Med red
Medox
enzymeox
enzyme red
substrate (H O)red 2
electrode- mV
2e
substrate (O )ox 2
+ -2
+ + -
+ -
FADH FAD + 2H +2e
(NADH NAD + H + 2e )
quinone + 2H +2e catecholamine
Figure 14: Cyclic oxidation of the analyte (Med) at an electrode; (left): principle of signal amplification e.g.by glucose oxidase (FADH2) or NADH (see redox reactions) and (right) e.g. by laccase.
A further possibility is the use of bi-enzyme systems, in which both kinds of enzymes(reducing and oxidizing) are co-immobilized on the membrane of an oxygen electrode. Therecycling of the analyte by the enzymes and their regeneration leads to a consumption ofdissolved oxygen, which is monitored and is proportional to the concentration of theanalyte 25, 26.
6.1.1 Glucose oxidase/ glucose (P3)The GOx enzyme-catalyzed cyclic oxidation of analyte (mediator) on the surface of anamperometric electrode is a tool for the improvement of detection limits of catecholaminesbut also of the cationic O-methoxylated metabolites. The major advantage of the describedenzyme system is its ease of handling since neither modification of the channel surface norimmobilization of the electrode is necessary.
Reaction principle: GOx is a dimeric protein with a molecular weight of 160 kDa,containing flavin adenine dinucleotide (FAD) as redox active centre. FAD is aflavoprotein coenzyme that plays an important role in many reversible redox conversions inbiochemical reactions. FAD has an isoalloxazine ring as redox-active component. Thecoenzyme structure is not covalently bound and can be released from the holoenzyme(consists of the apoenzyme (protein) and the coenzyme (NADH)) during denaturation. GOxcatalyses highly specifically the oxidation of β-D-glucose to D-glucono-1,5-lactone andhydrogen peroxide, using molecular oxygen as electron acceptor (Figure 14, Medox). Otherstructures that serve as artificial electron acceptors can also participate in this reaction.
GOx modified electrodes 29 as well as free GOx dissolved in the buffer have been usedand differ merely in the location at which the reaction takes place. In this study, only freedissolved GOx has been considered to increase oxidation current of the analyte that alsoacts as mediator in this system. The utilization of GOx modified electrodes was not
29 Godet, C.; Boujtita, M.; Murr, N. E. New Journal of Chemistry 1999, 23, 795-797, Direct electron transfer involvinga large protein: glucose oxidase.

6-28
effective. However, under normal circumstances the transfer of electrons between theactive site of reduced form FADH2 and the electrode takes place slowly or not at all so thatwith this approach the amplification principle should work (transfer of electrons can bepromoted if small electron acceptors (mediators) are used). As shown later, immobilizedGOx on CNT-electrodes can be oxidized directly on the electrode surface, depending on theapplied voltage. Consequently, a hampered detection of the mediator is obtained.
Medred
Medox
+ GOx/FAD
GOx/FADH2
+ Glucose+ Gluconolacton
Au-electrode+ [mV]
NADH
+ NAD+
Medred
k2
k1
Figure 15: Amplification principle using two independently operating enzymes (GOx and NADH).
The reaction of an analyte (e.g. dopamine) with GOx dissolved in the CE-buffer is shownin Figure 14 and in Figure 15 and illustrates how the detection signal of the catecholamineis influenced. The oxidized form of dopamine (an o-quinone) can react with GOx/FADH2(generated in the presence of glucose) and thereby GOx/FAD is regenerated (P3, scheme1). This reaction is fast and the large catalytic current (detection signal) is a function ofthe concentration of both GOx/glucose and dopamine. Depending on the numbers of cycles(oxidation/reduction), the detection signal is amplified. In this study the pH optimum aswell as the influence of the applied electrode-voltage on the detection signal has beenstudied. Furthermore, the presence of SDS dissolved in the CE buffer has been studied andresults are shown in Figure 16.

6-29
20 40 60 80 100 120 140
with 8 mM SDS + GOx + NADH
with 8 mM SDS
NA
DA
without additives
20 nA
time (s)
Figure 16: Electropherogram of NT (0.5 mM) with (red and blue) and without (black) SDS dissolved in thebackground electrolyte. In presence of enzymes (blue electropherogram) the detection signal is increased.
Although the decreased detection potential leads to a smaller absolute analyte signal,sensitive measurements can still be achieved due to a higher amplification factor. Thiseffect could be an enormous advantage, especially if detection at low potential is required,e.g. in presence of interfering substances such as ascorbic acid which is oxidizable at higherpotentials. It is astonishing that for O-methoxylated metabolites, up to now not known asGOx-mediators, the highest amplification factor was obtained. For example at a detectionpotential of 1000 mV versus pseudoreference electrode (800 mV versus Ag/AgCl) a 200times higher oxidation current of methoxytyramine has been recorded in the presence ofGOx and glucose. The limit of detection is 10 times lower than in a blank buffer electrolyte(with a sensitivity of 0.119 nA). This experimental approach is only successful for a shortmigration length and, thus, relatively low separation voltages are applied. In contrast inmeasurements using capillaries of about 50 cm only slight amplifications have beenobtained for all analytes.The disadvantage of the utilization of GOx is the presence of relatively high protein contentin the CE-buffer (10 μM). Even though further increase of GOx concentration causesimproved detection sensitivity, protein adsorption processes on channel surface reduce theseparation efficiency. Hence, we have investigated a second coenzyme, NADH(nicotinamide adenine dinucleotide) that can exist independently of a holoenzyme.
6.1.2 Glucose oxidase/glucose/NADH (P4)NAD+ and NADH act as coenzymes in many biological oxidation/reduction processes, so itis not surprising that many electrochemical methods have been developed forcharacterizing the electrochemical behavior of NADH as well as for its determination.NAD+ acts as a hydrogen acceptor (oxidizing agent) by forming NADH (the reduced form).Similar to the amplification process of GOx, NADH can reduce the oxidized form of

6-30
catecholamines and O-methoxylated metabolites and, thus, enables their repeated oxidationat the electrode.
Indeed, in the presence of NADH in the CE-buffer, the oxidation current of all biogenicamines is amplified. An optimal NADH concentration of 5mM in the running buffer hasbeen found. Bi-enzymatic investigations with GOx and NADH have led to a limit ofdetection of about 10 nM that corresponds to an absolute amount of 1 fmol (P4, figure 4).In contrast to the GOx-investigations, the amplification factor is not influenced if thedetection voltage is increased (P4, figure 2). The highest amplification has been observedagain for the metabolite methoxytyramine with a factor of about 400 in the presence of bothamplification enzymes.
The highly selective and sensitive amplification principle presented here can be applied toany electrochemical detection system such as amperometric detection after achromatographic separation. Immobilization of both enzymes could also serve as a basis fora very sensitive NT-biosensor in the sub-nanomolar range.
6.2 Carbon nanotube modified amperometry (P6)The use of carbon nanotubes (CNT) also seems to be very promising for the improvementof amperometric sensitivity for biogenic amines. The electronic properties of CNT makethem suitable candidates for the promotion of heterogeneous electron transfer and, thus, forcatalytic oxidations. Furthermore they are promising agents for the immobilization oforganic macromolecules because of their good adsorption properties, their high surface areaand their good mechanical and chemical stability. Novel CNT materials are being evaluatedas stabilizers, transducers and mediators for the construction of amperometric detectors.These special properties of CNTs have attracted the interest of many researchers in the fieldof electrochemical sensors 30
Generally, two kinds of CNTs exist, single-wall (SW) and multi-wall (MW) CNT. Bothtypes of CNTs have the ability to mediate electron transfer reactions of electroactivespecies in solution when they are used as an electrode and show catalytic effects on theelectrochemical behavior of NT proteins, thiols and oxygen. For the fabrication of CNTfilms on an electrode the key step is to obtain a well-distributed and stable suspension ofCNT due to their practical insolubility in most solvents.
Besides the wide application area of CNT (as catalysts, in molecular electronics, forfiltration processes, as nanoreactors and electrode materials), CNT- and CNT/metal-baseddetectors have recently been coupled to CZE, MC electrophoresis and chromatography.The analytes include carbohydrates, aminophenols, dopamine, hydrazine, phenol, purine,amino acids and amines. The applications are, in fact, not really novel and serve only asexamples of the applicability of CNT modified detectors in analytics. However, thespectrum of applications in analytical chemistry will surely expand in the next years.
30 Merkoci, A.; Pumera, M.; Llopis, X.; Perez, B.; del Valle, M.; Alegret, S. Trac-Trends in Analytical Chemistry2005, 24, 826-838, New materials for electrochemical sensing VI: Carbon nanotubes.

6-31
The aim of this study was to develop a sensitive method for the simultaneous detection ofcatecholamines and their cationic metabolites by electrophoresis on the microchip as wellas in the capillary without the need of enzymatic systems. MW-CNT for the modificationof gold electrodes were in the first step functionalized and purified (removal of metallicimpurities) by refluxing in concentrated nitric acid. This functionalization led to theformation of carboxyl moieties on the surface of the nanotubes. Unpublished results shownin Figure 17 describe the amplification factor of one biogenic amine depending on thelayer thickness given by the number of immobilization steps. The detection signal can beamplified with a factor of about 10.
10 15 20 25 30 35 40 45 50 55 60 65 70 75
(1400 mV, 0)
CNT (1400 mV, 1)CNT (1400 mV, 10)
CNT (1400 mV, 15)
time [s]
Figure 17: Detection signal of a MW-CNT-modified electrode of methoxytyramine (0.2 mM) influenced by thenumber of preparation steps (0, 1, 10, 15 is the number of immobilization steps with MW-CNT suspension)
The simply prepared CNT-modified electrodes (suspension in N,N’-dimethylformamide)exhibit a rapid response, catalytic activity and sufficient stability for multiple runs. Asshown later, the principle of amperometric sensitivity enhancement by using CNTs isappropriate for sensitive measurements in biological fluids and tissues. Although thedetection selectivity is moderate, when compared with the enzyme amplification systems,this can be compensated by using a separation method with high separation selectivity.
6.3 Hadamard transform microchip - CE (P5)A different approach to enhance detection sensitivity is represented by the Hadamardtransformation (HD) implemented recently by our research group for microchip capillaryelectrophoresis. It is the first time that HD has been applied for amperometric detection.HD is a multiplex technique which improves signal to noise (S/N) ratio by mathematicsuperposition of several signals and, thus, improves the LOD. HD is easily applied tomicrochip electrophoresis due to the fact that sample injection is generally achievedthrough cross, double-tee or tee injector structures. Contrary to the previous Hadamard

6-32
applications described in the literature 31, the resolution (number of points per unit of time)of electropherograms obtained is independent of the number of injections. The feasibility ofHadamard windows which allows the independency between number of points and numberof injections is shown in P5. This is an important fact for separations in short channels andfor separations of analytes with similar ionic mobilities (e.g. chiral separations). We havedemonstrated that the S/N can be improved by a factor of 2-7.
6.4 Microchip separations of biological samples (P6)Many catecholaminergic pathways exhibit a wide range of functions in the central andperipheral nervous systems. The determination of biogenic catecholamines and theirmetabolites is of clinical importance in the diagnosis of various neurological diseases (inbrain homogenates, extracellular fluids 32 and lymphocytes 33) but also in the diagnosticsand in the tracking of cancers of the sympatho-adrenal system (in urine and plasma).
Bergquist et al. 34 have recently reviewed analytical methods for the determination ofneurotransmitters in biological samples. HPLC, GC and CZE have been coupled with highsensitive MS- (chemical ionization and electron capture are used for routine measurements)and fluorescence-detection systems. Both MS and LIF detection require the derivatizationof the samples. However, the HPLC method combined with EC-detection is still themethod of choice. Low cost, reliability, selectivity and primarily sufficient detectionsensitivity are the reasons CZE has become an attractive alternative to HPLC. However, upto now, no methods are available for the analysis of catecholamines and cationicmetabolites in the low nanomolar range.
The applicability of CZE to provide deeper molecular physiological and pharmacologicalunderstanding of the complex brain chemistry has evolved in recent decades. CZE is anexcellent separation technique for sampling biological samples having a complex matrix(since purification steps prior to injection are in most cases not essential). Homogenizedmixtures represent an average value and the result can be extrapolated to a single cell level.For the analysis of biogenic amines, amino acids, and neuropeptides in tissue samples andextracellular fluids various detection techniques have been coupled to CZE 32 includingLIF-detection, electrochemical oxidation (see P2) and mass spectrometry. UV-detection isless practical due to insufficient sensitivity.
Problems concerning a reliable and comprehensive analysis of cationic neurotransmittersand their metabolites can be ascribed to the difficulties to separate these species withelectromigration (see above) and adequate sensitivity and resolution of detection systems.
31 Hata, K.; Kichise, Y.; Kaneta, T.; Imasaka, T. Analytical Chemistry 2003, 75, 1765-1768, Hadamard transformmicrochip electrophoresis combined with diode laser fluorometry, Zhang, T.; Fang, Q.; Fang, Z. L. Chemical Journal ofChinese Universities - Chinese 2003, 24, 1775-1778, Enhancement of signal-to-noise ratio in chip-based capillaryelectrophoresis systems by a Hadamard transform approach.32 Powell, P. R.; Ewing, A. G. Analytical and Bioanalytical Chemistry 2005, 382, 581-591, Recent advances in theapplication of capillary electrophoresis to neuroscience.33 Rajda, C.; Bencsik, K.; Vecsei, L.; Bergquist, J. Journal of Neuroimmunology 2002, 124, 93-100, Catecholaminelevels in peripheral blood lymphocytes from multiple sclerosis patients.34 Bergquist, J.; Sciubisz, A.; Kaczor, A.; Silberring, J. Journal of Neuroscience Methods 2002, 113, 1-13,Catecholamines and methods for their identification and quantitation in biological tissues and fluids.

6-33
In contrast, in a number of reports, NT and anionic metabolites are detected inmicrodialysis samples. A representative electropherogram is shown in Figure 18. Withoutbuffer additives the cationic catecholamines as well as the anionic metabolites have beendetected in a single run. The content of catecholamines in the lymphocytes is given infmol/μg protein with a LOD of about 0.2 fmol/μg.
Figure 18 from 33: Electropherogram of catecholamines and anionic metabolites extracted from humanperipheral blood lymphocytes detected with amperometry (buffer MES, pH 5.6, analytes D, NA, E=A,UA -uric acid, DOPAC).
Despite sufficient resolution between all cationic catecholamines, in presence of ME, NMEand MT the oxidation current would interfere with the detection signals (note that a 65 cmcapillary is used).
6.4.1 Microchip separations in neuroscienceFast analytical methods and direct injection of filtrates without sample preparation arevaluable in the diagnostics of neuroendocrinological disorders in extracellular fluids (braindialysates) of the nervous system. Biogenic amines are being studied in relation to variousdiseases including tumors of the sympatho-adrenal system and Parkinson's disease (PD) 35.All experimental studies show that in PD patients some monoamine neurotransmitters andmetabolites (e.g. D, MT and HVA) are present in abnormal concentrations compared tohealthy persons. As stated earlier, quantification of catecholamines is also very useful in theinvestigation of drug actions on the dopaminergic system.
For the simultaneous analysis of monoamines in brain dialysates and brain homogenates,mainly HPLC methods combined with electrochemical 36 and fluorescence detection are
35 Tohgi, H.; Abe, T.; Saheki, M.; Yamazaki, K.; Murata, T. Journal of Neural Transmission 1997, 104, 441-449,Concentration of catecholamines and indoleamines in the cerebrospinal fluid of patients with vascular parkinsonismcompared to Parkinson's disease patients.36 Sarre, S.; Michotte, Y.; Herregodts, P.; Deleu, D.; Klippel, N. D.; Ebinger, G. Journal of Chromatography B 1992,575, 207-212, High-performance liquid chromatography with electrochemical detection for the determination of levodopa,catecholamines and their metabolites in ratbrain dialysates, Cheng, F.-C.; Kuo, J.-S.; Shih, Y.; Lai, J.-S. Journal ofChromatography B 1993, 615, 225-236, Simultaneous measurement of serotonin, catecholamines and their metabolites in

6-34
described in the current literature. Despite the sensitive measurements with low detectionlimits reached with these HPLC methods, long analysis is often required (up to 60 min). Incontrast, in CZE, separation selectivity as well as sensitivity are the limiting factors fordeveloping routine analysis and hence only few applications have been reported (P2).Derivatized biogenic amines have been detected by laser-induced fluorescence usingexcitation of a He-Cd laser and an Ar ion laser 37.
MC-investigations of biological fluids in general are at the beginning of theirdevelopment. A few reports have recently shown the electrophoretic separation of aminoacids, glucose, uric acid, creatinine, ascorbic acid, oxalate, applied drugs and carnitine inurine, serum, human plasma and cerebral spinal fluid (CSF) 38. None of these studies,regardless of the detection principle, investigated brain homogenates.In the literature, there is only one MC-application for the determination of dopamine inCSF (see Figure 19) 39. The sample has been spiked with dopamine (50 μM) and catechol.Combination of orthogonal detection schemes (LIF and electrochemical detection systems)have been used to accomplish high-throughput analysis and to improve samplecharacterization. In this experiment, the EC trace acted as an internal standard and thefluorescence trace monitored the labeled amines in the sample. Even though the detectionsensitivity could be high enough for the determination of catechols in CSF. Thedifferentiation between all cationic catecholamines and metabolites was impossible withthis method.
mouse brain homogenates by high-performance liquid chromatography with a microbore column and dual electrochemicaldetection.37 Gilman, S. D.; Ewing, A. G. Analytical Methods and Instrumentation 1995, 2, 133-141, Postcolumn Derivatization forCapillary Electrophoresis Using Naphthalene-2,3-Dicarboxaldehyde and 2-Mercaptoethanol, Chen, Z.; Wu, J.; Baker,G. B.; Parent, M.; Dovichi, N. J. Journal of Chromatography A 2001, 914, 293-298, Application of capillaryelectrophoresis with laser-induced fluorescence detection to the determination of biogenic amines and amino acids inbrain microdialysate and homogenate samples.38 Lee, H. L.; Chen, S. C. Talanta 2004, 64, 750-757, Microchip capillary electrophoresis with electrochemical detectorfor precolumn enzymatic analysis of glucose, creatinine, uric acid and ascorbic acid in urine and serum, Fanguy, J. C.;Henry, C. S. Electrophoresis 2002, 23, 767-773, The analysis of uric acid in urine using microchip capillaryelectrophoresis with electrochemical detection, Zuborova, M.; Masar, M.; Kaniansky, D.; Johnck, M.; Stanislawski,B. Electrophoresis 2002, 23, 774-781, Determination of oxalate in urine by zone electrophoresis on a chip withconductivity detection, Deng, Y. Z.; Zhang, N. W.; Henion, J. Analytical Chemistry 2001, 73, 1432-1439, Chip-basedquantitative capillary electrophoresis/mass spectrometry determination of drugs in human plasma, Deng, Y. Z.; Henion,J.; Li, J. J.; Thibault, P.; Wang, C.; Harrison, D. J. Analytical Chemistry 2001, 73, 639-646, Chip-based capillaryelectrophoresis/mass spectrometry determination of carnitines in human urine, Ramseier, A.; von Heeren, F.;Thormann, W. Electrophoresis 1998, 19, 2967-2975, Analysis of fluorescein isothiocyanate derivatized amphetamineand analogs in human urine by capillary electrophoresis in chip-based and fused-silica capillary instrumentation, Lapos,J. A.; Manica, D. P.; Ewing, A. G. Analytical Chemistry 2002, 74, 3348-3353, Dual fluorescence and electrochemicaldetection on an electrophoresis microchip.39 Lapos, J. A.; Manica, D. P.; Ewing, A. G. Analytical Chemistry 2002, 74, 3348-3353, Dual fluorescence andelectrochemical detection on an electrophoresis microchip.

6-35
Figure 19: Simultaneous (a) LIF (detection of amino acids) and (b) EC (detection of dopamine and catechol)dual detection of fluorescently labeled CSF samples of two unknown patients (A and B) and spiked withelectrochemically active dopamine and catechol.
Starting from the results of method development to separate cationic NT and metabolites byapplying MEKC with a second stationary phase (see 5.3.2) we have begun to investigateurine samples injected into a capillary. Detection has been accomplished by CNT-modifiedelectrodes as the only amplification factor for the detection signal (see chapter 6), contraryto the planned utilization of carbon nanotubes coupled with immobilized enzymes GOx orNADH. Immobilization of enzymes results in a strong increase of the background currentand consequently to a decrease in the analyte signals. It can be assumed that the reducedform of GOx is directly oxidized at the CNT modified electrode even in the absence ofsmall mediating molecules with enhanced electron transfer rate of the redox reaction 40.GOx dissolved in background buffer instead of a CNT-modified electrode is only suitableto a limited extent. In the case of high complexity of buffer composition (SDS, boric acid,dendrimers, GOx, glucose) the measurements are sensitive to environmental changes.
All cationic metabolites in urine have been detected without the interference of anionicmetabolites such as HVA and uric acid (see P6, figure 6 (b)). Also, the determination of Aand NA is unhindered. Only the peak of D overlaps with unknown anionic compounds.Sadly, injections of urine samples on microchips were not successful. The highconcentration of salt in urine samples is responsible for an induced high electrophoreticcurrent and, thus, disturbed the separation conditions.
In contrast, investigations of mouse brain homogenates are convincing. All cationic aminescould be detected after their separation on a chip. Further unknown detection signals couldbe attributed to the presence of HVA, vanillin mandelic acid (VMA) and serotonin (5-HT)in the brain sample. As demonstrated in Figure 20, detection on a gold electrode has beencompared with recording at a CNT-modified electrode. By utilization of CNT the detectionof the metabolites is amplified. The shift of migration time, especially for MT, can beattributed to the presence of proteins in the sample (Figure 20 right). The concentration ofproteins depends on the preparation steps prior to injection (e.g. rotation speed ofcentrifuge).
40 Liang, W.; Yuan, Z. B. Sensors 2003, 3, 544-554, Direct electrochemistry of glucose oxidase at a gold electrodemodified with single-wall carbon nanotubes.

7-36
40 60 80 100 120 140
Au-electrode
MTMENME HVA/VMANA, A
MT
ME
NMED
ANA
2 nA
time (s) 40 60 80 100 120 140 160 180
5-HTHVA/VMAEOF
MT
DOPAC
MENMEDNA, A
MTME
NMED
A
NA
CNT modified electrode
time (s)
2 nA
Figure 20: Electropherogram of mouse brain homogenate detected with amperometric detection on (left) aAu-electrode and (right) a CNT-modified electrode. Brain samples are from different mice so that variancesin metabolites are probable. Also, different equipment was used for preparing the samples (on the right side aless efficient centrifuge)
7 AFFINITY CAPILLARY ELECTROPHORESIS (ACE)Noncovalent interactions are an important part of many biochemical and chemical reactionsand form the basis of living systems. The assessment of such interactions is of fundamentalinterest in describing biochemical and physiological processes. Most biochemical functionsinvolve, at the molecular level, noncovalent bonding. For example the storage andreplication of genetic information and base stacking in the DNA double helix depend onhydrogen bonding, π-stacking and electrostatic forces. All reactions in cells are catalyzedby enzymes often requiring a reversible binding of the substrate to the enzyme. Forartificial noncovalently bound structures, molecular recognition is the basis for chiralcatalysis, sensors and separation principles in chromatography just to name a few.Furthermore in drug development the study of interactions with proteins, oligonucleotidesand artificial drug delivery substances are of great interest. It is not surprising that bigefforts have been made in the last two decades to develop methods which are able toqualify and quantify noncovalent interactions of different origin.
Methods for the measurement of binding parameters of a ligand to a receptor can beclassified into two categories: mixture-based (FTIR, Raman, NMR, UV, densimetrictechniques, potentiometric titrations and calorimetry) and separation-based (ultrafiltration-centrifugation, chromatography and electrophoresis). All these methods rely on thealteration of molecular or dynamic parameters during the titration by forming a receptor-ligand molecule. While with mixture-based methods selective detection systems arerequired for the evaluation of the formed complex, in separation-based methods theselectivity is given by dynamic parameters (retention, migration). Thus, with utilizationof flexible detection systems (UV, fluorescence, MS, amperometry) for the receptor-ligandcomplex, a wide range of interactions (electrostatic, hydrogen bonding and hydrophobic)are accessible for characterization. In contrast, with mixture-based studies the applications

7-37
are limited by the detection method. Certainly, these factors have contributed to the fastdevelopment of affinity capillary electrophoresis (ACE) as the method of choice for diverseinteracting systems. Note that the term ACE used here includes affinity studies in general,without consideration of the measurement conditions (eluting profiles) as described in thenext sub-chapter.
Several comprehensive reviews have recently summarized (i) important application areas ofACE and recent developments 41, (ii) recent advances in the study of biomolecularinteractions 42, (iii) the mathematical handling of equilibrium constants in various ACEmodes 43 and (iv) advantages and limitations of the different ACE modes in general 44 aswell as qualitative and quantitative aspects of the study of drug-protein interactions 45.
The general advantages of ACE are the speed and simplicity of measurement and thesensitivity and possibility to quantify the interactions described by effective bindingconstants. ACE-measurements are fundamentally different than methods withoutseparation, regarding the number of affinity-analyses possible in a single run. In principlemeasurements with more than one receptor are feasible. In recent years a lot of experiencehas been gained with the interpretation and analysis of complex equilibria (associatedequilibria) and higher order equilibria. Even though often only calculations of apparentbinding constants are practicable by ACE (stoichiometry parameters have to be assessed byreference methods), with an intelligent measurement strategy additional informationregarding the selectivity or the number of bound ligands can be obtained. In contrast to themixed-based methods, new species formed during the separation process in presence ofvarying ligand concentrations can be observed even if the ionic mobility is different fromthe expected mobility of complex. This fact is of particular interest if novel and unknowninteracting systems are studied. An example will be given in the context of characterizingDNA - metal ion interactions (chapter 7.4.3).
Affinity capillary electrophoresis has the potential to become a powerful tool for studyinginteractions of small molecules (drugs, inorganic cations, intercalators) and biologicalmacromolecules (proteins, DNA, enzymes). ACE is an analytical approach in which theelectrophoretic migration pattern/ peak area of the receptor or the receptor-ligand moleculesis evaluated to quantify and identify specific binding. In general two different modes ofcapillary electrophoresis are used – mobility change analysis (also named aselectrophoretic mobility shift assay (EMSA)) and concentration change evaluation.
41 Guijt-van Duijn, R. M.; Frank, J.; van Dedem, G. W. K.; Baltussen, E.; Schalkhammer, T. Electrophoresis 2001,22, 1247-1247, Recent advances in affinity capillary electrophoresis (vol 21, pg 3905, 2000), Heegaard, N. H. H.;Nilsson, S.; Guzmann, N. A. Journal of Chromatography B 1998, 715, 29-54, Affinity capillary electrophoresis:important application areas and some recent developments, Schou, C.; Heegaard, N. H. H. Electrophoresis 2006, 27, 44-59, Recent applications of affinity interactions in capillary electrophoresis.42 He, X. Y.; Ding, Y. S.; Li, D. Z.; Lin, B. C. Electrophoresis 2004, 25, 697-711, Recent advances in the study ofbiomolecular interactions by capillary electrophoresis, Chu, Y. H.; Cheng, C. C. Cellular and Molecular Life Sciences1998, 54, 663-683, Affinity capillary electrophoresis in biomolecular recognition.43 Tanaka, Y.; Terabe, S. Journal of Chromatography B-Analytical Technologies in the Biomedical and Life Sciences2002, 768, 81-92, Estimation of binding constants by capillary electrophoresis.44 Busch, M. H. A.; Kraak, J. C.; Poppe, H. Journal of Chromatography A 1997, 777, 329-353, Principles andlimitations of methods available for the determination of binding constants with affinity capillary electrophoresis.45 Busch, M. H. A.; Carels, L. B.; Boelens, H. F. M.; Kraak, J. C.; Poppe, H. Ibid., 311-328, Comparison of fivemethods for the study of drug-protein binding in affinity capillary electrophoresis.

7-38
Mobility-change analysis can be used to study low-affinity complexes with fast kinetics. Incontrast the evaluation of peak areas of pre-/ equilibrated samples can also be meaningfulfor high-affinity systems with slow complexation kinetics. In the following the mobilityshift assays and their mathematical description have been described in detail due to theirimportance in ACE studies and the potential transfer of EMSA to microchip systems withshort migration paths.
Although more than 300 applications, including several reviews, for the studies of non-specific and specific interacting equilibria have appeared in the literature since 1995, veryfew articles described the development of ACE analysis in MCE (MC-ACE) 46. Recently,we have reviewed affinity-measuring investigations on microchips (P10); however, theapplications embrace mainly immunoassays and enzyme assays that do not really belongto the ACE in the common sense and will not be discussed here in detail. In enzyme assay,the kinetics of enzyme reactions are studied by calculation of the Michaelis-Mentenconstant that also provides information about the affinity of substrate to enzyme. Often thestoichiometry is known and strong and specific interactions are assumed. Mostimmunoassays are measured under heterogeneous conditions and serve for theidentification of specific antigens or antibodies. One of the first ACE measurements onmicrochip in the classical EMSA mode is shown in chapter 7.3 (or P7). A comparisonbetween capillary and planar microsystems is given, including calculated binding constantsof cyclodextrins and catecholamines. A brief description of the modes of ACE and themathematical background of the mobility shift assay is given in the following sub-chapter.
7.1 Modes of Affinity capillary electrophoresisACE, including affinity capillary electrochromatography (ACEC, also termedelectrokinetic affinity chromatography or capillary electroaffinity chromatography), with avariety of experimental approaches, is a well-established method to study bindinginteractions. According to the chemical and physicochemical nature of the interactions andformed complexes, various methods are available. At present there are six ACE modesdeveloped for capillaries to measure binding constants and four to estimate the number ofligand molecules that bind to the different classes of binding sites. To avoid a confusionwith the term ACE (used here for affinity measurements in general), ACE-μ(ACE used asmobility shift assay) has been defined for this specific method (see Table 1)
Mobility shift assay (ACE-μ, Scheme 5) is the favorite method in CZE for theinvestigation of simple 1:1 complexes. The mobility of the injected component (fixedamount) is monitored when the ligand is dissolved in buffer in varying concentrations. Boththe ligand and the receptor can be injected as sample or added to the background buffer. Inmany cases the detectability of the compound with the installed detection system decideswhether ligand or receptor will be injected. The buffer additive should not decrease the
46 Stettler, A.; Schwarz, M. A. Ibid.2004, 1063, 217-225, Affinity capillary electrophoresis on chip, Le Saux, T.;Hisamoto, H.; Terabe, S. Journal of Chromatography A 2006, 1104, 352-358, Measurement of monomolecular bindingconstants of neutral phenols into the beta-cyclodextrin by continuous frontal analysis in capillary and microchipelectrophoresis via a competitive assay, Liu, X. J.; Liu, X.; Liang, A. Y.; Shen, Z.; Zhang, Y.; Dai, Z. P.; Xiong, B.H.; Lin, B. C. Electrophoresis 2006, 27, 3125-3128, Studying protein-drug interaction by microfluidic chip affinitycapillary electrophoresis with indirect laser-induced fluorescence detection.

7-39
sensitivity of sample detection. Here we use the descriptors S for solute (injected sample;in literature S is sometimes termed as receptor R) and L for ligand (solved in buffersolution). Note that the description is general, and S and L could be all types of moleculessuch as proteins, enzymes, inorganic ions etc.According to the equilibrium S L SL , the shift of the solute mobility is modified byincreasing L-concentrations in the background buffer (Figure 21, A). ACE-μis suitable formeasuring weak to intermediate affinities but is especially advantageous for the evaluationof weak binding. Later on a specific example is presented (P9).The shift in mobility induced by binding interactions can effectively be used to enhance theseparation selectivity. Typical applications are found in the MEKC and in chiralseparations.
Figure 21 (from 47): The principle of (A) ACE-μfor weak binding (B) and for tight binding systems byevaluating the peak area (S – reference molecule, P (protein) – solute, L - ligand).
The HD method (Hummel-Dreyer method) uses an identical experimental set-up as ACE-μ.The capillary is filled with a buffer containing [L], to be studied at varying concentrations.When a small amount of sample is injected, a typical elution profile is monitored (Scheme5). In contrast to ACE-μ, the peak area of [L] (ΔA) is evaluated for the determination of theconcentration of the bound ligand. A requirement for the application of the HD method is
S SL , so that the correct peak area of [L] is recorded. This approach offers thepossibility of checking the proposed stoichiometry model.
VACE (vacancy ACE) and VP (vacancy peak analysis) also use an identical experimentalset-up. However the electropherogram is treated differently. In VACE the shift in migrationtime of negative peaks is evaluated to measure the extent of binding (analogous to ACE-μ).The capillary is filled with buffer containing [S] and [L]. The concentration of oneinteracting partner is fixed and the concentration of the other is varied. Measuring ΔA aswell as Δμ of negative peaks could be demanding on microchips, because thereproducibility of the detection signal and the detection sensitivity is not sufficient for suchan approach.
47 Chu, Y. H.; Cheng, C. C. Cellular and Molecular Life Sciences 1998, 54, 663-683, Affinity capillary electrophoresisin biomolecular recognition.

7-40
Table 1: Overview of ACE-modes with measured parameters, conditions and procedures of measurement(those marked in red have been investigated on chip so far).
The experimental set up for frontal analysis (FA) is quite different compared to the othermethods described. The capillary is filled with buffer and a large sample plug ofequilibrated [S] and [L]. Also here, various cases have been considered in dependence onthe relation between the ionic mobility of [L], [S] and [SL]. Ideally S SL (in the caseof protein molecules as solute) and L differs sufficiently. Upon applying voltage, theanalyte zones (consisting of [L], [S] and [SL]) migrate corresponding to their velocity andform a typical elution profile containing two plateaus. One plateau is given by theconcentration of free solute [S] and the complex [SL]; the second plateau is related to the
Method Sample Buffer Measurementparameter
requirement/comment
Affinity capillary electrophoresis(ACE-μ)
[solute=S] Δ[ligand=L] ΔμS, μS, μSL
K weak-intermediate interactions S ≠ 1:1/1:2 interaction approximation [L] = [L0]
pseudostationary phase:e.g. micelles, liposomes,dendrimers
MEKC
mobile phase:e.g. cyclodextrins, peptides
chiral separations
Hummel-Dreyer method (HD) [solute] Δ [ligand] ΔAL, μSL or μL,Ki, ni
S = SL or L =SL
Vacancy affinity capillaryelectrophoresis (VACE)
empty buffer [solute] +Δ[ligand]
ΔμS, μS, μSL
K, n weak-intermediate interactions S ≠ SL
1:1 interaction approximation [L] = [L0] weak soluble ligands
Vacancy peak analysis (VP) empty buffer [solute] +Δ[ligand]
ΔAL,μS, μSL,Ki, ni
preferably S =SL
weak-intermediate interactions clear statistical interpretation
frontal analysis (FA) [solute] +Δ[l igand]
empty ΔhKi, ni
S = SL and μS ≠ μL
intermediate-strong interactions suitable for drug-protein studies
Frontal analysis continuouscapillary electrophoresis(FACCE)
[solute] +Δ[ligand] continuoussampling
empty ΔhKi, ni
S = SL and μS ≠ μL
lower detection limits) weak-intermediate interactions
preequilibration CE [solute] +Δ[ligand]
empty ΔAS, ΔAL, ΔASL,μS, μSL,Ki, ni
strong interactions
Free
solv
edse
lect
or
Partial-filling ACE [solute] Δ[ligand]-plug
ΔμS/ Δμreference
KAffinity capillaryelectrochromatography (ACEC)
[solute] empty ΔμS weak-strong interactions
stationary phase:immobilized channel wall
[solute]immobilizedon the wall
stationary phase:packed channel, monoliths
[solute]immobilizedon gel
Sel
ecto
ras
stat
iona
ryph
ase
MIP (molecular imprinting) [solute]imprinted inpolymer

7-41
free dissolved [L]. It is not astonishing that the limit of detection of this method issignificantly lower than by methods using narrower solute zone. FA is a method that has apotential for miniaturization 48.
Scheme 5: Schematic elution profiles of the ACE-methods
Analysis of binding using preequilibrated samples containing both interaction partners isonly suitable for strong interactions (Figure 21, B). Additionally, the complex formed hasalso to be stable in the electric field applied during the separation. Essential conditions forthis application (preequilibrated samples without additives in the buffer) are: i) a largebinding constant (e.g. hybridization of oligonucleotides, enzyme-substrate-binding), ii) asufficient mobility difference between the substrate and the complex, and iii) constant UV
48 Le Saux, T.; Hisamoto, H.; Terabe, S. Journal of Chromatography A 2006, 1104, 352-358, Measurement ofmonomolecular binding constants of neutral phenols into the beta-cyclodextrin by continuous frontal analysis in capillaryand microchip electrophoresis via a competitive assay.

7-42
absorption of the peaks to be quantified, especially in presence of more equilibriumreactions.
7.2 Theory of ACE-μThe determination of the ionic mobility of the solute in ACE-μis carried out underequilibrium conditions. By varying the ligand concentration, a shift in the mobility (μ)starting from μS approaching μSL is observed. Under the assumption of a simple 1:1equilibrium, the mobility shift can be derived from the ratios between free dissolved [S]and the concentration of formed complex [SL] (Equation (5)). For higher-order equilibria,Equation (5) must be extended to all complexes (differing in number of ligands) formed.
S S SL SLx x (5)The mole fraction of the species from Equation (5) is defined by:
andS SLS SL
x xS SL S SL
(6)
Using the definition of the binding constant for a 1:1 complex and the definition of thecapacity factor (kP), the ratio of bound to free substrate molecules can be derived (Equation(8)),
B
SLK
S L (7)
BSL
k K LS
(8)
The measured mobility can, thus, be expressed by the following two equations:
11
1S SL S SLS S SL
S SL S SL SL / S S SL
(9)
11 1
BS SL
B B
K LK L K L
(10)
Nonlinear regression analysis of a plot of μagainst [L] (Equation (11)) provides thebinding constant and the electrophoretic mobility of the complex SL derived from Δμmax.[L] can be approximated in the equation by the total ligand concentration under thecondition that the ligand concentration is much higher than the concentration of the soluteor that the binding constant is small.
or
1S B SL S
BB SL
K Lf L K L k
K L
(11)
Instead of a nonlinear fitting Equation (11) is often linearized. The linearized plot is knownas Scatchard or Bensi-Hildebrand plot.Furthermore, with the help of the binding constant the free standard reaction enthalpy(RG) can be calculated.
R BG RT ln K (12)In isothermal calorimetric experiments the standard reaction enthalpy is obtained. Asshown in Equation (13) RH (standard reaction enthalpy) can be calculated by an equationanalogous to the equation for evaluation of electrophoretic experiment. The parameterstandard reaction enthalpy corresponds to the ionic mobility of the formed complex inEquation (11). With the relation of R RG / H (Equation (14)) even the standard reaction

7-43
entropy (ΔRS°) can be estimated which represents a further interesting parameter for thecharacterization of noncovalent interactions (see also 7.4.1).
( )1
B R
B
K L HQ f ( L ) H QmaxRK L
(13)
R R RG H T S (14)
Higher-Order Equilibria: The fitting of a more complex reaction with more than onebound ligands by an equation valid for 1:1 fitting reflects neither the real interactionbetween receptor and ligand nor their real effect on the net mobility of receptor (solute).Biochemical interactions involving proteins and oligonucleotides often exhibit a higherstoichiometry, particularly if the ligand molecules are small. In a few cases, with acompleted titration curve (determination of SL by the plateau) and a known charge for theligand (e.g. metal ions) an estimation regarding the number of bound ligands can be made.In contrast, if the charge of the ligand or solute molecule is unknown, then the shift of ionicmobility cannot be directly obtained from the absolute charge and Equation (5) has to beextended with consequences for the binding constant. With an order higher than two andwith a nearly anticooperative (higher order of ligand are often hindered due to stericreasons) or noncooperative binding behavior, fittings of the corresponding equation arealmost impossible:
2 3
2 31 1 2 1 2 3
2 31 1 2 1 2 31
S SL B SL B B SL B B B
B B B B B B
K L K K L K K K L............
K L K K L K K K L
(15)
For a highly cooperative binding (the first binding step favors the following associationand it can be assumed that the solute exists only in the form of the complex with the higheststoichiometry), the following equation can be used as a simplification of Equation (15):
1n
nS B SL
nB
K [ L ]
K [ L ]
(16)
In this case, BK is the apparent overall binding constant (overall stability constant). Bowserand Chen 49 have discussed in detail the consistency of theory and experimental data. Intheir study, a 1:2 stoichiometry has been investigated and cooperative or anticooperativereaction types have been distinguished.
7.3 Characterization of ACE on microchips (P7)Recently, we have shown that ACE-μon microchips (MC-ACE-μ) is a suitable methodfor studying molecular interactions (P7). The high separation efficiency of CZE allows thetransfer affinity studies from capillary to miniaturized systems. Since the basic concept ofaffinity measurement is derived from capillary measurements, the applicability ofmicrochip investigations depends mainly on technology developments. One reason for thevery few applications describing the characterization of partition and complexationequilibria is the difficulty in electrokinetic control of the sample plug by the tee injector anddouble-tee injector. Another fact that influences the range and number of applications is thelimitation of detection systems available for planar systems. However, as we will show
49 Bowser, M. T.; Chen, D. D. Y. Analytical Chemistry 1998, 70, 3261-3270, Higher order equilibria and their effect onanalyte migration behavior in capillary electrophoresis.
7-44
below, a few interacting systems are suitable for their characterization on planarmicrosystems with the available technology.
A microchip electrophoresis instrument equipped with a UV-detector and a home-builtchip-station with electrochemical detection were used in our studies. Using UV-detection,the concentration profile along the separation channel is measured (a snap-shot at a definedtime) and the detection signal depended on the peak width (injected plug) and thedispersion. With recording the electrochemical detection signal at one point on the channel(as a function of time) the peak width is given by the width of the sample zone includingdispersion and the velocity with which the analyte migrates. Both detection modes torecord the signal, in contrast to fluorescence measurements, are appropriate for ACEstudies since no derivatization is necessary. Detection by fluorescence often needsderivatization of the analyte molecule with a suitable reagent; alternatively indirectdetection via displacement of a fluorescent species is possible. Both, the derivatization andthe addition of a fluorophore to the background buffer may distort the equilibrium inquestion as well as the molecular parameters can be changed.
A critical parameter in MC-ACE-μis the evaluation of the binding parameters. They canbe estimated in two different ways: by recording of the peak area and by recording of thechanged ionic mobility.By recording the peak areas (preequilibration CE, frontal analysis, Hummel-Dreyermethod and vacancy peak method) reproducibility of the detection signal is an importantfeature of the electrophoretic system and is easy to accomplish by hydrodynamic injectionfor traditional capillary electrophoresis. To date, efforts on chip have been concentrated onthe electrokinetically driven injection using intersecting channels, in which the diffusion ofanalyte into the separation channel is counteracted by pinching voltages. However, nocommercial chip-CE-systems are available that have the ability to control the injection andseparation process in this way. It can be presumed that applications using the evaluation ofthe detection signal will not be accepted before reliable and technically perfect injectionmethods are implemented on the chip device (see also 5.2.1).The change of ionic mobility with the ligand concentration is a characteristic feature ofACE-μand vacancy affinity capillary electrophoresis. Short migration times typical formicrochip systems require short and well defined sample plugs for high resolution and highefficiency separation. Beside the necessity of small sample plugs compared to theseparation length, a reference analyte that do not interact with any type of involvedmolecules is essential; a second independent reference molecule could contribute to moreaccurate calculations.Similar to measurements with capillaries, qualitatively meaningful results by ACE-μcanonly be achieved if the following preliminary prerequisites are fulfilled (marked in red arepoints of special importance for microchip measurements):

7-45
no interactions between the channel surface and the molecules under observation; low conductivity of the molecules (buffer as well as analyte); no interference of the background buffer with the detection signal; sufficient limit of detection of the solute for its detection at high concentrations of
ligand; significant differences between the ionic mobility of the ligand and the substrate; detectability of either the ligand or substrate (by UV or amperometry); at least one binding partner has to be charged.
Comparison between capillary and microchip. In Figure 22 a typical example of theionic mobility corresponding to Equation (11) plotted against increasing ligandconcentrations is presented. By forming a host-guest complex between a catecholamine anda negatively charged cyclodextrin, the mobility of the analyte (catecholamine) is alteredaccording the equilibrium A + CD A CD .If capillary and microchip are compared, the ionic mobility behaves similarly withincreasing concentrations of sulfonated CD in the background electrolyte. By shifting thecomplex-formation equilibrium to the side of the host-guest complex, the catecholaminemigrates slower towards the detector due to a faster anionic mobility. As neither the chargeof A nor of CD is precisely known, we cannot speculate about the stoichiometry, though a1:1 interaction is most likely. With both separation devices the migration behavior of theenantiomers of racemate A can be distinguished. The difference between calculated bindingconstants (KB-L – KB-D) has a magnitude of about 30 [l/mol] (for the shown example) andcorresponds to the limit of resolution on microchip. MC-ACE provides less precise datacompared to capillary and in consequence binding constants with a higher deviation.

7-46
0 2 4 6 8 10-0.00020
-0.00015
-0.00010
-0.00005
0.00000
chip, 2.5 cmseparation time: 10 spKB(D) = 2.94
capillary, 65 cmseparation time: 7 minpK
B(D) = 3.2
Concentration of sulfated -cyclodextrin [mM]
Ion
icm
obi
lity
ofE
N[c
m2V
-1s-1
]
Figure 22: 2 n2R-NH + n CD R-NH CD . The ionic mobility (racemic DL-adrenaline) is set in relation to
different concentrations of sCD in the electrophoresis-buffer (black: measured on capillary, red withmicrochip), corresponding equilibrium constant KB of D-enantiomer.
The higher deviation of KB and the smaller absolute KB-values arise from the higherinjection volume relative to the channel length and the incomplete titration curve. It islimited due to insufficient UV sensitivity at high CD concentrations where the mobilityplateau would be reached (P7, table 1).
7.4 MC-ACE Applications
7.4.1 Synthetic Receptors (P9)Molecular recognition plays a key role in biology. It is not surprising that the developmentof synthetic molecules which can interact noncovalently with biological systems is of greatinterest for fundamental understanding. While developing small synthetic molecules thatbind with high affinity to biomacromolecules (proteins, DNA, oligonucleotides) has beensuccessful, the development of synthetic receptors interacting with small biologicallyrelevant molecules in water with similarly high affinities has proven to be more difficult.
Here we demonstrate the determination of binding affinities between a water-solublesynthetic diketopiperazine receptor and a biomolecular counterpart by MC-ACE-μcompared with ITC (isothermal calorimetry) (P9). Diketopiperazine receptors consist of adiketopiperazine serving as a rigid, structure-directing template, and of two peptidic sidechains, the “receptor arms”. Whilst two-armed receptors bind tripeptides (arginine-richpeptides) with high sequence selectivity and binding affinities between ΔRG = -6 - (-4) kcalmol-1 in water, the strength of binding between a one-armed receptor and arginine-richpeptides is significantly lower. These results have been established with ACE-μbyevaluation of the ionic mobility of the receptor molecule dependent on concentration of the

7-47
peptides (Figure 23) and also with ITC where the reaction enthalpy of every titration pointis measured.
0.0 0.5 1.0 1.5 2.0-0.00042
-0.00040
-0.00038
-0.00036
-0.00034
-0.00032
-0.00030
-0.00028
dRG = -2.90 kcal /mol
dR
G = -3.97 kcal/mol
one-armed receptor
two-armed receptor
1:11:2
1:1
1:2
cTripeptide RRS[mM]
Ioni
cM
obili
tyo
fth
eR
ecep
tors
[cm
2V
-1s-1
]
Figure 23: Altered behavior of the ionic mobility with increasing peptide concentration (RSR) in the runningbuffer and fitted curves with a 1:1 and 1:2 stoichiometry.
In the case of the two-armed receptor, the calculated binding constants provided by the twoindependent methods are in satisfactory agreement. Both methods have shown that a RRR(for syntax see Figure 24) peptide binds stronger than RRS or RSR. In contrast, with theone-armed receptor the ionic mobility of the receptor is influenced by the peptides but thereaction enthalpies are too small for a reliable analysis. Two facts could be responsible forthe failure. First, the free reaction enthalpy is small or the reaction is entropy driven( R RG T S ). Further ACE investigations revealed that interactions between the one-armed receptor and serine containing peptides are entropy driven. Less conclusive are thenumber of bound ligands determined by ACE. The possibility of 1:2 interaction could notbe excluded (Figure 24).
(a)
(b)
peptide
peptide
two-armed receptor
one-armed receptor
Figure 24: Scheme of noncovalent interaction between (a) a two-armed receptor with a 1:1 stoichiometry and(b) a one-armed receptor with a 1:2 stoichiometry and peptides (RRR: Ac-Arg-Arg-Arg-NHPr, RRS: Ac-Arg-Arg-Ser-NHPr, RSR: Ac-Arg-Ser-Arg-NHPr ).

7-48
In contrast to ACE measurements on capillary with separation times of about 15 min, thetime required for one titration point on the chip is 20 s. A TRIS/boric acid buffer andsalicylic acid and ibuprofen as inert reference molecule have provided ideal conditions.
7.4.2 DNA-Metal Ion Interactions (P8)Studies of the interactions between small molecules and nucleotides, oligonucleotides or ss-DNA (single-stranded) are important to elucidate the functional mechanism of DNA andare critical to understanding the control of expression of the phenotype from the genotype.In recent years, great efforts have been made to develop and evaluate analytical methods toinvestigate and describe interactions between DNA or DNA fragments 50 and smallmolecules or ions. Even though the most important interactions with mono- and divalentcations including transition ions have already been studied, the investigations and theresulting conclusions are non-systematic and remain somewhat controversial. Furthermore,it is often difficult to correlate structures of metal ion-DNA or metal ion-oligonucleotidecomplexes measured in the solid state with investigations in aqueous solution in anequilibrated state. Additional complications arise from measurements carried out ininappropriate chemical environments. In particular, buffer components such as TRIS(tris(hydroxymethyl)aminomethane) or phosphate that are known to coordinate to metalions have often been used.
There are only a few electrophoretic studies describing the characterization andquantification of DNA-metal ion interactions. Apparent equilibrium constants have beendetermined for the interactions of Ag+, Mg2+, Ca2+ and Fe2+/3+ and double-stranded DNAmolecules (calf-thymus DNA) 51. With the exception of investigations with Fe2+ or 3+
cations in all of these studies the concentration (UV-absorbance) of the formed DNA-metalion complex has been measured. However, the evaluation of peak area or height of theformed complex can easily lead to inaccurate results. The UV absorption spectra of themetal ion-DNA complexes change with progressive coordination of metal ions and thebinding between the metal ions and the oligonucleotide is not strong enough for themigration of non-dissociated metal complexes in an electric field.
50 Sletten, E.; Froystein, N. A. NMR studies of oligonucleotide-metal ion interactions; 1996, Sigel, H.; Griesser, R.Chemical Society Reviews 2005, 34, 875-900, Nucleoside 5 '-triphosphates: self-association, acid-base, and metal ion-binding properties in solution, Ahmad, R.; Arakawa, H.; Tajmir-Riahi, H. A. Biophysical Journal 2003, 84, 2460-2466, A Comparative Study of DNA Complexation with Mg(II) and Ca(II) in Aqueous Solution: Major and MinorGrooves Bindings, Arakawa, H.; Neault, J. F.; Tajmir-Riahi, H. A. Biophysical Journal 2001, 81, 1580-1587, Silver(I)Complexes with DNA and RNA Studied by Fourier Transform Infrared Spectroscopy and Capillary Electrophoresis,Abrescia, N. G. A.; Huynh-Dinh, T.; Subirana, J. A. Journal of Biological Chemistry 2002, 7, 195-199, Nickel-guanineinteractions in DNA: crystal structure of nickel-d[CGTGTACACG]2, de la Fuente, M.; Hernanz, A.; Navarro, R.Journal of Biological Chemistry 2004, 9, 973-986, IR and Raman study on the interactions of the 5'-GMP and 5'-CMPphosphate groups with Mg(II), Ca(II), Sr(II), Ba(II), Cr(III), Co(II), Cu(II), Zn(II), Cd(II), Al(III) and Ga(III), Ouameur,A. A.; Tajmir-Riahi, H.-A. Journal of Biological Chemistry 2004, 279, 42041-42054, Structural Analysis of DNAInteractions with Biogenic Polyamines and Cobalt(III)hexamine Studied by Fourier Transform Infrared and CapillaryElectrophoresis.51 Arakawa, H.; Neault, J. F.; Tajmir-Riahi, H. A. Biophysical Journal 2001, 81, 1580-1587, Silver(I) Complexes withDNA and RNA Studied by Fourier Transform Infrared Spectroscopy and Capillary Electrophoresis, Ahmad, R.;Arakawa, H.; Tajmir-Riahi, H. A. Biophysical Journal 2003, 84, 2460-2466, A Comparative Study of DNAComplexation with Mg(II) and Ca(II) in Aqueous Solution: Major and Minor Grooves Bindings, Ouameur, A. A.;Arakawa, H.; Ahmad, R.; Naoui, M.; Tajmir-Riahi, H. A. DNA Cell Biol. 2005, 24, 394-401, A Comparative Study ofFe(II) and Fe(III) Interactions with DNA Duplex: Major and Minor Grooves Bindings.
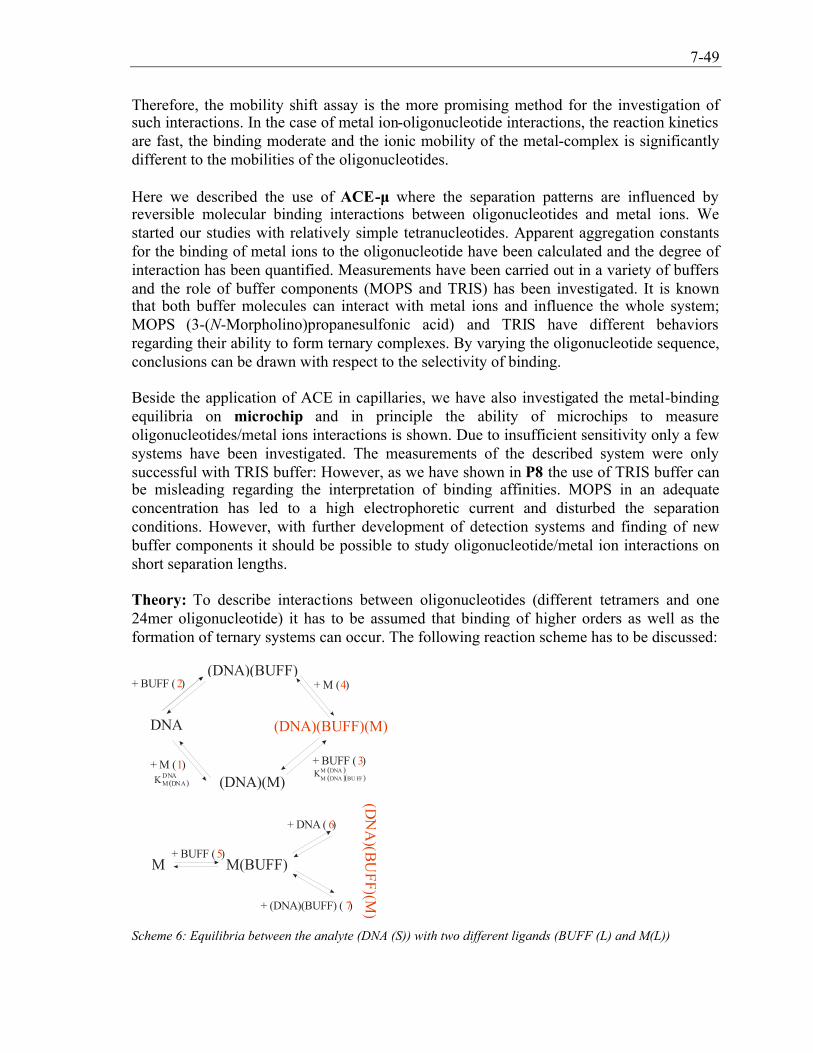
7-49
Therefore, the mobility shift assay is the more promising method for the investigation ofsuch interactions. In the case of metal ion-oligonucleotide interactions, the reaction kineticsare fast, the binding moderate and the ionic mobility of the metal-complex is significantlydifferent to the mobilities of the oligonucleotides.
Here we described the use of ACE-μwhere the separation patterns are influenced byreversible molecular binding interactions between oligonucleotides and metal ions. Westarted our studies with relatively simple tetranucleotides. Apparent aggregation constantsfor the binding of metal ions to the oligonucleotide have been calculated and the degree ofinteraction has been quantified. Measurements have been carried out in a variety of buffersand the role of buffer components (MOPS and TRIS) has been investigated. It is knownthat both buffer molecules can interact with metal ions and influence the whole system;MOPS (3-(N-Morpholino)propanesulfonic acid) and TRIS have different behaviorsregarding their ability to form ternary complexes. By varying the oligonucleotide sequence,conclusions can be drawn with respect to the selectivity of binding.
Beside the application of ACE in capillaries, we have also investigated the metal-bindingequilibria on microchip and in principle the ability of microchips to measureoligonucleotides/metal ions interactions is shown. Due to insufficient sensitivity only a fewsystems have been investigated. The measurements of the described system were onlysuccessful with TRIS buffer: However, as we have shown in P8 the use of TRIS buffer canbe misleading regarding the interpretation of binding affinities. MOPS in an adequateconcentration has led to a high electrophoretic current and disturbed the separationconditions. However, with further development of detection systems and finding of newbuffer components it should be possible to study oligonucleotide/metal ion interactions onshort separation lengths.
Theory: To describe interactions between oligonucleotides (different tetramers and one24mer oligonucleotide) it has to be assumed that binding of higher orders as well as theformation of ternary systems can occur. The following reaction scheme has to be discussed:
DNA
(DNA)(BUFF)
(DNA)(M)
(DNA)(BUFF)(M)
+ BUFF ( )2 + M ( )4
+ M ( )1 + BUFF ( )3
M+ BUFF ( )5
M(BUFF)
+ DNA ( )6
+ (DNA)(BUFF) ( )7
( )DNAM DNAK ( )( )
( )M DNAM DNA BU FF
K
Scheme 6: Equilibria between the analyte (DNA (S)) with two different ligands (BUFF (L) and M(L))

7-50
The oligonucleotide-free parent solution of metal salt in buffer (BUFF) will containaquated metal ions and metal buffer complexes M(BUFF) with the total metal ionconcentration [M]tot = [M(aq)] + [M(BUFF)] (Scheme 6, Eql. (5)). Also DNA-bufferinteractions (Eql. (2)) must be taken into account for the interpretation of the measuredmobility shift by forming ternary complexes (Eql. (4)). As Stellwagen et al. 52 have shown,buffers used to maintain neutral physiological pH values such as TRIS and zwitterionic“Good” buffers interact with DNA oligonucleotides. Upon the addition of theoligonucleotide (DNA) to the metal containing buffer, the complexes M(DNA) andM(BUFF)(DNA) will be formed.
Our experiments allow the determination of the overall binding constant (KB). Since
DNAM DNAK and
M DNAM DNA BUFFK are often published it is reasonable for a comparison with
published data to use Eql. (1) and (3) to describe the overall binding constant KB. The sumof Eql. (2) and (4) leads to the same result (see Equation (17)) as the sum of Eql. (1) and(3). In the case of higher binding orders [M] and [BUFF] have to be substituted by [M]n
and [BUFF]n.
DNA
M(DNA)(BUFF)BM( DNA )( BUFF )
K KBUFF M DNA
(17)
In binary systems KB corresponds to Equation (7).
Since DNA is injected as analyte the measured parameter μcan be expressed with Equation(18) (in presence of binary and ternary systems). The molar fraction of M(DNA) can beneglected, if only the ternary complexes are formed.
DNA DNA M ( DNA ) M ( DNA ) M ( DNA )( BUFF ) M ( DNA )( BUFF )x x x (18)With the formation of M(BUFF)/DNA(BUFF) and, in presence of M, with the formation ofM(DNA)(BUFF) the overall binding constant K B(Equation (17)) is applicable and thechange in mobility with increasing metal ion concentrations could be described byEquation (19). The buffer is in a large excess and therewith [BUFF] might be consideredconstant at all [M]. The calculated KB values in P8 (table 1) correspond to the term KB´[BUFF]. For multiple binding sites and with the assumption of a cooperative bindingEquation (19) can be extended to Equation (20)
1
DNA B M DNA BUFF
B
K M BUFFf M
K M BUFF
(19)
1
n nDNA B M DNA BUFF
n nB
K M BUFFf M
K M BUFF
(20)
Influence of the buffer components: The comparison of the two buffers TRIS and MOPSclearly shows an alteration in the ionic mobility over the whole range of total metal ionconcentration and reflects the buffer-modified interactions between certain cations and ss-
52 Stellwagen, N. C.; Bossi, A.; Gelfi, C.; Righetti, P. G. Analytical Biochemistry 2000, 287, 167-175, DNA andBuffers: Are There Any Noninteracting, Neutral pH Buffers?

7-51
DNA (Figure 25, P8, figure 2). In the following text we will discuss the plot of ionicmobilities against metal concentrations in the respective buffer.
0 2 4 6 8 10
-4.0x10⁻⁴
-3.5x10⁻⁴
-3.0x10⁻⁴
-2.5x10⁻⁴
-2.0x10⁻⁴ Ni, MOPS
Mn, MOPSMg, MOPS
Mn, TRISMg, TRISNi, TRIS
Concentration of Cations [mM]
Ioni
cM
obili
tyof
24b
ssD
NA
[cm
2V
-1s-1
]
Figure 25: Shift of ionic mobility of a 24mer oligonucleotide measured in TRIS and MOPS.
1.: The earlier approach to the limit of μ(the mobility of the formed complex μSL) in thepresence of TRIS compared to MOPS implies that the metal ion-oligonucleotide complex ismore stable in TRIS buffer solution; and hence that the ternary complex with TRIS isstabler than that with MOPS. The slope of μwith varying total metal ion concentrations is acrucial parameter that affects the value of the calculated binding constant.2.: In this case, where each bound metal ion results in a similar change in net charge, theabsolute maximum shift (|μSL|) depends on the total number of possible binding sites.Note that all changes in ionic mobility/charge of oligonucleotides are ascribed only fromthe addition of metal ions (in contrast to previous described applications the charge of the“ligand” – the metal ion – is known). A low value of |μSL| (plateau, curve MOPS) refers to ahigh degree of complexation of available binding sites.
Both, the order of metal ions (Ni, Mg, Mn in TRIS; Mg, Mn, Ni in MOPS) and the absolutechange of DNA ( >DNA DNA( MOPS ) (TRIS ) ) are implications of the differentcharacteristics of the formed ternary complexes. By calculation of absolute change ofcharge ( DNAq , see P8) and by considering the existing M(BUFF) species only oneconclusion seems logical. We conclude that in presence of TRIS, ternary complexes areformed whereas with MOPS as buffer component, only binary complexes, M(DNA), arepresent. Whilst for the ternary system a 1:1:1 stoichiometry has been assumed, wepostulate for the binary system a 1:2 stoichiometry (24mer oligonucleotide: metal ion).Using MOPS as a buffer component, the order of metal ions ranked by their absolute shiftsand calculated KB-values now agree well with the published strengths of interactionbetween earth alkali metal ions as well as transition metal ions and nucleotides (ATP, ADPand AMP). The different interaction behaviour can be ascribed to the minor participation of
M DNA
M DNA BUFFK on the sum of K, DNAM(DNA)(BUFF)K as pictured in Scheme 6. It can be summarized
that
DNA DNAM DNA M DNA> and <M DNA M DNA
M DNA BUFF M DNA BUFFK(TRIS ) K( MOPS ) K(TRIS ) K( MOPS ) .

7-52
However a comparison of DNAM(DNA)(BUFF)K in these two buffers is not meaningful due to
different dimensionality of the KB value.
Investigations of tetramers: In the following text we will quantify the interaction of thedifferent tetramer-nucleotides systems by means of graphical analysis and nonlinear fittingfor calculation the apparent binding constant. As an example, we have chosen Ni2+ toillustrate the selective binding of this metal to various sequences of tetranucleotides(Figure 26).
Two different potential binding sites exist for metal ions at the oligonucleotides: thephosphate group and the N7 (Figure 28) of the purine bases adenine and guanine. Thehigher electronegativity of the N7 of guanine is responsible for stronger interaction withcations than other nitrogen donors within the heterocycles. Hard cations prefer to bind tothe phosphate group of the backbone, whilst softer cations preferentially interact with thenitrogen donor of the purine bases. Binding of the metal ions may be direct or indirectthrough water molecules.
With the exception of d(TCAG) the affinity of the Ni2+ for d(GGGG) seems to be, bothfrom the calculated binding constants and from the graphical analysis shown in the Figure26, considerably higher compared to d(AAAA), d(TTTT) and d(CCCC). However, theapparently higher affinity does not necessarily have simple explanation.At first sight, it is surprising that the mobility of blank d(GGGG) is greater than themobilities obtained for all the other nucleotides. One explanation could be the spontaneousformation of a G-quadruplex, as has been described in the literature for G-containingoligonucleotides in presence of Group 1 and Group 2 metal ions (see Equation (21)) 53.Note that without added metal salts, the sodium salt of MOPS is present in the runningbuffer.
53 Simonsson, T. Biological Chemistry 2001, 382, 621-628, G-quadruplex DNA structures - Variations on a theme,Guschlbauer, W.; Chantot, J. F.; Thiele, D. Journal of Biomolecular Structure & Dynamics 1990, 8, 491-511, 4-Stranded Nucleic-Acid Structures 25 Years Later - from Guanosine Gels to Telomer DNA.

7-53
0 2 4 6 8 10
-6.0x10⁻⁴
-5.0x10⁻⁴
-4.0x10⁻⁴
-3.0x10⁻⁴
-2.0x10⁻⁴
-1.0x10⁻⁴
CCC CTTTT
GGGGAAAA
TCAG
GGGG - quad ruplex
x 10 -3
Concentration of Ni2+ [M]
Ion
icM
obi
lity
ofte
tram
ers
[cm
2V
-1s-1
]
Figure 26: Ni2+ induced shifst of different tetramers (P8, figure 3f)
The increased mobility of the G species (quadruplex) results from increasing of the charge-to-hydrodynamic radius ratio (fourfold increasing of charge). The ratio of hydrodynamicradius r between the formed quadruplex and the monomeric tetramer can be than
calculated from 2 1
1 2
4( quadruplex )
( monomer )
r *r
and is equal to 3.0. Thus, the observed metal affinity to
d(GGGG) corresponds to a significantly different receptor molecule compared tod(AAAA), d(TTTT) and d(CCCC) (Equation (22)).
4x-x-4 4 44G G (21)
-m+2nn+
4 4 24 4G + 2 M G MBKm (22)Another indication for the formation of a G-quadruplex is the similar interaction behaviorof Ni2+ and Mg2+/Ca2+ (soft vs. hard cations), despite the presence of N7. Assuming aquadruplex the N7 position is blocked by intermolecular interactions of GGGG and onlythe phosphate groups are available for binding and, thus, an interaction pattern similar tothat obtained for d(CCCC) and d(TTTT) is expected (P8, figures 3 c, d).
The change in mobility in presence of Ni2+, Ca2+ and Mg2+ is double that for othertetranucleotides (d(AAAA), d(CCCC) and d(TTTT)) and corresponds to a 4DNAq (difference in charge). This fact is a strong indicator that 2 metal ions bind to onequadruplex (Equation (22)), similarly to the results obtained for interactions between24mer oligonucleotide and metal ions in MOPS buffer.
MC-ACE-μ: In contrast to the measurements performed in the capillary, detection on themicrochip is realized over the whole length of the separation channel. Since the limit ofdetection (LOD) on the chip is drastically lower (the optical path is 20 μm vs. 50 μm) thesample concentration has to be higher (see Figure 27, red lines). This means that especiallyat the beginning of the “titration” the change in the ionic mobility is shallower. In the graph

7-54
there are two points marked on the Ni2+ curve. They indicate an analyte: ligand ratio of1:24. For both points the same ionic mobility can be measured. Above the markedconcentration range of metal ions, detection of the analyte was no more possible.Furthermore, only measurements with TRIS buffer were successful; MOPS induced a toohigh electrophoretic current at given separation voltage.
0 2 4 6 8 10
-0.00040
-0.00035
-0.00030
-0.00025
KB [l/mol]
an alyte :liga nd1: 24
MC:Ca
2+KA 277± 66.9
Mg2+ KA500 ± 102Ni2+KA 222± 50.6
CE:Ca2+ K
A1360± 109
Mg2+ KA
1750 ± 107Ni2+ K
A1410 ± 92.6
Ni2+
Ca2+; Ca2+; Mg 2+
Ni2+; Mg2+
Concentration of Cations [mM]
Ioni
cm
obili
tyof
ssD
NA
[cm
2V
-1s-1 ]
Figure 27 (from P8): Mobility shift of 24mer ss-DNA and various metal ions in TRIS buffer measured withcapillary (black) and chip (red), experimental conditions: CE see Figure 1, Microchip (MC): Electric field of- 280 V/cm, Separation time of 15s.
Due to the incomplete measurement limited by sufficient UV sensitivity at high metal ionconcentrations where the mobility plateau is reached, KB was calculated with a significantlyhigher deviation and therewith also lower KB-values has been obtained (the titration was notcompleted). Despite the lower KB-values on the chip compared to capillary measurements,the order of metal ions regarding their interacting strength is comparable (KB: Ca2+ (277 ±66.9 M-1) ≈Ni2+ (222 ± 50.6 M-1) < Mg2+ (500 ± 102 M-1)).
7.4.3 Selectivity of metal ionsThis part of research will be discussed in more details since the results have not beenpublished so far.Sequence-selective binding of metal ions, especially transition-metal ions are of greatinterest, is an active area of research particularly in the development of new antitumordrugs 54. Furthermore, the interactions of DNA with several natural products and syntheticdrugs are known to be metal-mediated. Metal cations are also required for the properfolding and function of many forms of RNA, including most ribozymes. Various sequencesand geometries alter the reactivity of the base as a consequence of fluctuation in thenucleophilicity of the G-N7. Variations of π-stacking interactions between base residuescan be responsible for changes in electron-donating properties.
54 Steinkopf, S.; Garoufis, A.; Nerdal, W.; Sletten, E. Acta Chemica Scandinavica 1995, 49, 495-502, Sequence-Selective Metal-Ion Binding to DNA Oligomers.

7-55
First studies of oligonucleotide interactions with Zn2+ and Mn2+ by NMR spectroscopyhave shown that metal ions bind selectively to guanines present in d(CGCGAATTCGCG)2
with a binding pattern of G4G2, G10 and G12. In another study the following bindingorder 5'-GG > 5'-GA > 5'-GT 55 has been found. However, neither these nor other publishedresults can be transferred to the binding behaviour of short ss-oligonucleotides and ss-DNA.
Regarding the discussion about binding selectivity of metal ions to ss-tetramers, thefollowing questions have to be considered:
Which nucleotide is preferred by which metal (it is known that Ni2+ prefers G,however, for Ca2+ interactions there is no preference among the bases)?
Which role does the direct neighborhood play and which influence do thenucleotides in indirect neighborhood (β and γ position): 2 1 1 1Y Y S X X have?Here S represents the active binding site: Y S X
Which of both S does bind to the metal ion: 2 1 1 1Y Y S S X X (in the case of twoadjacent active sites)?
TCAG, TACG, TGAC, TGCA: In the previous investigations it has been found that twoNi2+ ions can bind to one TCAG oligonucleotide. This is in contrast to Mg2+ and Ca2+
measurements but also to the tetramers containing only one type of nucleotide. The 1:2stoichiometry can only be explained by a binding to two different binding sites, theterminal phosphate group of oligonucleotide and the base residue of nucleotides. The baseresidue itself is ambivalent, e.g. guanine offers the N1, N3 and N7 sites (see Figure 28) forbinding to a metal ion. Furthermore it is well known that metal ions bound to the terminalphosphate group may interact with N7 of purine-nucleotide 3'- monophosphate (3'-end) orwith N7 of purine-nucleotide5'- monophosphate (5'-end) by forming macrochelatecomplexes 56. Note that oligonucleotides used in our experiments possess neither at the 5'-end nor at the 3'-end a terminal phosphate group (see Figure 28).
Until now, the description of equilibria assumed that the binding with 1:2 stoichiometry iscooperative. However, the experimental data and the estimated binding constants of thestudied homogeneous tetramers and mixed tetramers do not give clear conclusions. For theinvestigated mixed tetranucleotides the binding parameters can be calculated with acooperative and a noncooperative behavior, but KB (noncooperative) describes the curveprogression of the measured ionic mobility in a better way. For a cooperative behavior thestrongly simplified Equation (19) can be used (see also chapter 7.2). Calculations for anoncooperative complexation have to differentiate between the first, second and nth binding
55 Steinkopf, S.; Sletten, E. Ibid.1994, 48, 388-392, Sequence-Selective Metal-Ion Binding to DNA Hexamers, Vinje, J.;Sletten, E.; Parkinson, J. A.; Sadler, P. J. Journal of Inorganic Biochemistry 2003, 96, 245-245, Sequence-selectivemetallation of double-helical oligodeoxyribonucleotides with Pt(II), Mn(II) and Zn(II).56 Sigel, H.; Massoud, S. S.; Corfu, N. A. Journal of the American Chemical Society 1994, 116, 2958-2971, Comparisonof the Extent of Macrochelate Formation in Complexes of Divalent Metal-Ions with Guanosine (GMP(2-)), Inosine(IMP(2-)), and Adenosine 5'-Monophosphate (AMP(2-)) - the Crucial Role of N-7 Basicity in Metal Ion-Nucleic BaseRecognition, Reily, M. D.; Hambley, T. W.; Marzilli, L. G. Journal of the American Chemical Society 1988, 110, 2999-3007, Macrochelate Complexes of Purine 5'-Nucleotide Triphosphates and Monophosphates - Definitive MultinuclearNMR Evidence Supported by Molecular Mechanics Calculations.

7-56
step. As results from Equations (15) and (23) the macroscopic equilibrium constants KB1and KB2 are the calculable binding parameters (Table 2).
2
21 1 2
21 1 21
S SL SLK L K K L.......
K L K K L
(23)
Additionally, the estimation of binding constants requires the knowledge of thestoichiometry of the complexing reactions. As described above and in P8 with the maximalshift of ionic mobility, the absolute change of oligonucleotide-charge is known and, thus,the number of binding metal ions. If tetramers containing T, A, C and G are compared(Figure 29 left, for Ni2+) with homogeneous tetramers, the maximum shift of ionic mobilityis about twice compared to the measurements with e.g. d(CCCC). Arising from thecalculation of absolute changes in the oligonucleotide-charge by addition of Ni2+, a 1:2interaction can be assumed for all considered tetranucleotides.By comparison of tetramers differing in their sequence of A, C, G, and T, surprisingobservations have been obtained. With exception of TCAG-Ni2+ and TACG-Ni2+, bindingconstants KB1 are in the range between 90-450 M-1 for Ca2+, Mg2+ and Ni2+ (Table 2). Incontrast, for complexes formed between tetramers with a 3'-terminal G and Ni2+
considerably higher binding constant has been calculated (870-1680 M-1). In the case ofNi2+ a second binding constant has been obtained. However, KB2 is significantly lower thanKB1 for the first complexing step.
NH
O
ON
O
HO
HH
HH
PO
O
HO
O-
NH
N
N
O
NH2N
O
H
HH
HHO
PO
O
O-
N
NH2
ON
O
HO
HH
HH
PO
O
O-
N
NN
N
NH2
O
HOH
HH
HH
NH
O
ON
O
HO
HH
HH
PO
O
HO
O-
NH
N
N
O
NH 2N
O
H
HHHH
O
PO
O
O-
N
NH2
ON
O
HOH
HH
HH
N
NN
N
NH 2
O
HO
HHHH
PO
O
OH
K(Ni, TG CA)>K(Ni, TGAC)
71
3
9
a
c
b
3' -end
5'-end
3
Figure 28: Chemical structure of tetramers d(TGCA) and d(TGAC)
The highest affinity was observed when G was at the 3'-end position of the oligonucleotide-molecule. Starting from the assumption that KB1 corresponds to the binding to G-N7 (in ourcase no terminal phosphate groups are present) and KB2 describes the affinity to any baseresidue, it is conspicuous that KB1 for d(TACG), d(TCAG) is significantly larger than KB1for d(TGAC), d(TGCA). The reason can be that in addition to the N7 coordination ofpurine, the metal ions may interact with the phosphate group (see Figure 28 (a)) byforming intramolecular macrochelates with considerably higher stability constants. When Ais located in direct neighborhood of terminal G (d(TCAG)) the binding constant KB1 is

7-57
decreased. This effect can be ascribed to stacking interactions between adenine and guanineand in consequence a blocking of the possible binding sites N7 and N3.G in an other position than at the 3'- end effects a drastic reduction of KB1 (d(TGCA)). Alsohere the same phenomenon of diminishing the binding strength, when A is in the α-positionto G, can be observed. With adenosine in terminal position the KB1 value is lower comparedto guanosine since formed A-macrochelates are more instable. Furthermore, these studiesreflect that the 3'-end and the terminal pyrimidine bases T and C are not able to formstabilized macrochelates and, in consequence, lower binding constants are obtained.
0 2 4 6 8 10-3.5x10 -4
-3.0x10⁻⁴
-2.5x10⁻⁴
-2.0x10⁻⁴
-1.5x10 -4
-1.0x10 -4
x 10-3
TCAGTACGTGACTGCA
CCCC
c of Ni2+ [M]
Ioni
cM
obili
tyof
the
olig
onuc
leot
ide
[cm
2V
-1s-1
]
0 2 4 6 8 10
-3.5x10⁻⁴
-3.0x10⁻⁴
-2.5x10⁻⁴
-2.0x10-4
x 10-3
TCA GCCCCTACGTGACTGAC
Concentration of Ca2+ [M]
Ioni
cM
obilit
yof
olig
onuc
leot
ide
[cm
2V-1
s-1]
Figure 29: Mobility shifts of various tetranucleotides measured with capillary ((left) Ni2+ and (right) Ca2+).
Sequence KB [M-1] Ca2+ KB [M-1] Mg2+ KB1 [M-1] Ni2+ KB2 [M-1] Ni2+
d(TACG) 363 ± 74.6 170 ± 17.6 1'680 ± 16.3 100 ± 12.6d(TCAG) 140 ± 13.3 104 ± 8.93 873 ± 62.1 178 ± 24.1d(TGAC) 162 ± 22.2 158 ± 21.0 291 ± 56.0 198 ± 40.8d(TGCA) 91.1 ± 4.46 145 ± 4.50 444 ± 13.7 232 ± 18.2Table 2: Equilibrium constants for mixed tetramers interacting with Ca2+, Mg2+ and Ni2+(marked in red:proposed first binding site).
A comparison of the metal ions leads to the conclusion that earth alkali ions bind more orless unspecific with a stoichiometry of 1:1 (Figure 30). The binding constants are in thesame range as for the homogeneous sequences.
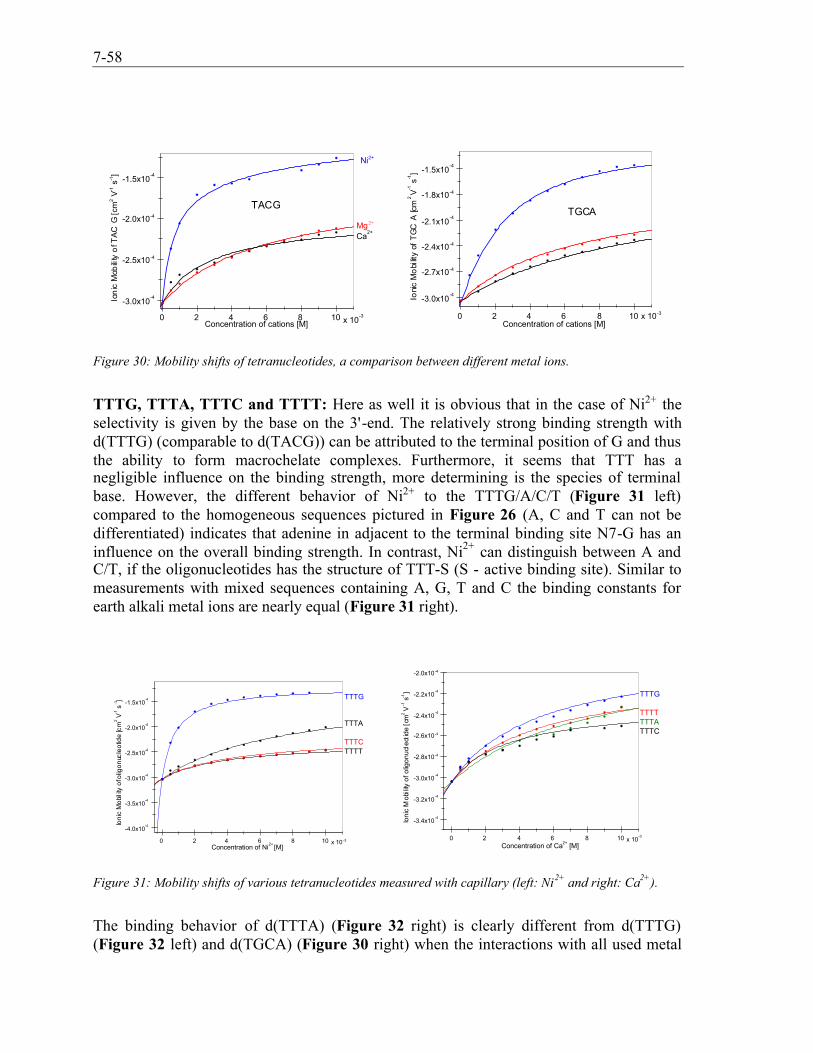
7-58
0 2 4 6 8 10
-3.0x10⁻⁴
-2.5x10⁻⁴
-2.0x10⁻⁴
-1.5x10⁻⁴
TACG
Ca2+
Ni2+
Mg2+
x 10-3
Concentration of cations [M]
Ion
icM
obili
tyo
fTA
CG
[cm
2V
-1s-1
]
0 2 4 6 8 10
-3.0x10⁻⁴
-2.7x10⁻⁴
-2.4x10⁻⁴
-2.1x10⁻⁴
-1.8x10⁻⁴
-1.5x10⁻⁴
TGCA
x 10-3
Concentration of cations [M]
Ioni
cM
obi
lity
ofT
GC
A[c
m2V
-1s-1
]
Figure 30: Mobility shifts of tetranucleotides, a comparison between different metal ions.
TTTG, TTTA, TTTC and TTTT: Here as well it is obvious that in the case of Ni2+ theselectivity is given by the base on the 3'-end. The relatively strong binding strength withd(TTTG) (comparable to d(TACG)) can be attributed to the terminal position of G and thusthe ability to form macrochelate complexes. Furthermore, it seems that TTT has anegligible influence on the binding strength, more determining is the species of terminalbase. However, the different behavior of Ni2+ to the TTTG/A/C/T (Figure 31 left)compared to the homogeneous sequences pictured in Figure 26 (A, C and T can not bedifferentiated) indicates that adenine in adjacent to the terminal binding site N7-G has aninfluence on the overall binding strength. In contrast, Ni2+ can distinguish between A andC/T, if the oligonucleotides has the structure of TTT-S (S - active binding site). Similar tomeasurements with mixed sequences containing A, G, T and C the binding constants forearth alkali metal ions are nearly equal (Figure 31 right).
0 2 4 6 8 10
-4.0x10⁻⁴
-3.5x10⁻⁴
-3.0x10⁻⁴
-2.5x10⁻⁴
-2.0x10⁻⁴
-1.5x10⁻⁴ TTTG
TTTA
TTTCTTTT
x 10 -3
Concentration of Ni2+ [M]
Ioni
cM
obili
tyof
olig
onuc
leot
ide
[cm
2V-1
s-1]
0 2 4 6 8 10
-3.4x10⁻⁴
-3.2x10⁻⁴
-3.0x10⁻⁴
-2.8x10 -4
-2.6x10 -4
-2.4x10⁻⁴
-2.2x10⁻⁴
-2.0x10 -4
x 10-3
TTTG
TTTTTTTATTTC
Concentration of Ca2+ [M]
Ioni
cM
obili
tyof
olig
onuc
leot
ide
[cm
2V
-1s-1
]
Figure 31: Mobility shifts of various tetranucleotides measured with capillary (left: Ni2+ and right: Ca2+).
The binding behavior of d(TTTA) (Figure 32 right) is clearly different from d(TTTG)(Figure 32 left) and d(TGCA) (Figure 30 right) when the interactions with all used metal

7-59
ions are compared. Even though a weak macrochelate complex can probably be formedwith Ni2+, the estimated binding constants are similar for all metal ions. Calculated bindingparameters are summarized in Table 3. With exception of d(TTTG) a 1:1 stoichiometry isthe basis for the calculation of the binding constants.
0 2 4 6 8 10
-3.0x10⁻⁴
-2.5x10⁻⁴
-2.0x10⁻⁴
-1.5x10⁻⁴
TTTG
Ni2+
Mg2+
Ca2+
x 10-3
Concentration of cations [M]
Ioni
cM
obilit
yof
TTT
G[c
m2
V-1
s-1]
0 2 4 6 8 10
-3.0x10⁻⁴
-2.8x10⁻⁴
-2.6x10⁻⁴
-2.4x10⁻⁴
-2.2x10⁻⁴
-2.0x10⁻⁴
TTTA
Ni2+
Mg2+
Ca2+
x 10-3
Concentration of cations [M]
Ioni
cM
obilit
yof
TTT
A[c
m2
V-1s-1
]Figure 32: Mobility shifts of tetranucleotides, a comparison between different metal ions.
AGGA, AGAG, GAAG, GAGA (Figure 33 left): Clear interpretations to explain obtainedbinding parameters of tetramers containing only A and G are difficult. As expected, Ni2+
has a significantly different behavior compared to the earth alkali metals. For alltetranucleotide variations with Ni2+ a binding stoichiometry of 1:2 has been obtained. Thepresence of G in the terminal position with A as a neighbor results in a similar equilibriumconstant as for d(TCAG) (see Table 3) and reflects the same stacking effect when A is in α-position. Why in investigations with d(AGGA) the affinity to Ni2+ is considerably higher,although A is in 3'-terminal position, cannot be answered yet. Maybe, the GG sequence hasan amplified influence on the A-macrochelate equilibrium. It is not surprising thatd(AGAG) behaves significantly differently than d(GAGA). The activity of 5'-G is notidentical with 3'-G because the formation of a stable, intramolecular macrochelate is notpreferred in the terminal 5'-position.
TTT-X(G, A, C, T)-TTT: The ability to bind two Ni2+ ions disappears when hepta-oligonucleotides with only one guanine are used. The clearly different affinities whenheptamers are compared to TTTG are shown in Figure 33 (right). d(TTT-G-TTT) behavessimilarly as d(TTTT). In the case of d(TTT-G-TTT) it is not clear which binding site, theterminal phosphate group or base residues within the chain, is the active centre.

7-60
0 2 4 6 8 10-4.0x10⁻⁴
-3.0x10⁻⁴
-2.0x10⁻⁴
-1.0x10⁻⁴
0.0
AG AG
GAGAAGGA
GAAG
AGAG
Ni 2+
Ni 2+
Ni 2+
Ni 2+
Mg2+
Ca 2+
x 10-3
Concentration of cations [M]
Ioni
cM
obilit
yof
olig
onuc
leot
ide
[cm
2V-1
s-1]
0 2 4 6 8 10-3.5x10
-4
-3.0x10⁻⁴
-2.5x10⁻⁴
-2.0x10⁻⁴
-1.5x10⁻⁴
-1.0x10⁻⁴
G
d(T TT G), Ni2+
d(T TT XT T T), Ni2+
x10-3
GACT
Concentration of Ni2+ [M]
Ioni
cM
obilit
yof
TTT
XTT
T[c
m2
V-1s-1
]
Figure 33: Mobility shifts of various tetranucleotides measured with capillary (left: tetramers and right:heptamers with the structure TTT-X(G, A, C, T)-TTT).
Sequence KB [M-1] Ca2+ KB [M-1] Mg2+ KB1 [M-1] Ni2+ KB2 [M-1] Ni2+
d(TTTA) 117 ± 32.4 242 ± 31.5 133 ± 16.2d(TTTC) 293 ± 50.9 172 ± 27.1 234 ± 21.2d(TTTG) 191 ± 17.9 212 ± 18.4 1'200 ± 73.6 384 ± 56.5d(TTTT) 187 ± 20.9 127 ± 11.3 261 ± 20.0d(AGAG) 50.4 ± 7.62 22.3 ± 6.02 816 ± 88.0 283 ± 48.5d(AGGA) 168 ± 18.5 130 ± 15.3 1'370 ± 50.3 125 ± 9.41d(GAAG) 11.2 ± 8.03 17.5 ± 5.22 360 ± 21.6 41.1 ± 9.62d(GAGA) 27.0 ± 16.1 27.5 ± 0.735 291 ± 16.1 88.6 ± 10.4d(TTTCTTT) 196 ± 28.2d(TTTGTTT ?) 164 ± 55.5d(TTTTTTT) 135 ± 31.3d(TTTATTT) 234 ± 16.5
Table 3: Equilibrium constants for mixed tetramers and heptamers interacting with Ca2+, Mg2+ and Ni2+
(marked in red: proposed first binding site).
To recapitulate, Under the assumption of a 1:2 interaction (see Scheme 7.1.), the calculated binding
affinities for d(TTTG) are in the same range as the quadruplex d(GGGG)4. Adenine in adjacent to guanine (S), independent on position of S (terminal or within
the chain), results in a lower binding affinity (see Scheme 7.3./4.) as a result of basestacking effects between adenine and guanine.
The β-position of the binding site seems to be important; even with S as a terminal,two further adenines in neighborhood cause a drastic decrease in the bindingconstant (see Scheme 7.5.)
If S is surrounded by XXX on both sides, S does not differentiate between A, G, Tand C in respect to the interacting metal ion (Ni2+) (see Scheme 7.2.)
Up to now, only the formation of intramolecular macrochelates between N7/N3 ofthe purine base and a 5'-terminal phosphate group has been reported; the results

7-61
presented here indicate that intramolecular interactions are also possible between 3'-terminal purine bases and the next phosphate group (at the 5' position) within thechain.
2+1 1 2 1 2
2+
2+
XXX-S SSSS (S active binding site)
XXX-S >XXX-S -XXX XXX-S -XXX (S =G and S =A, C and T; for Ni )
XAX-G XXX-G >XXA-G (for Ni )
X-S-XA >X-S-AX (S = G and Ni )
A-G-G-A >A-G-A-G > G-AA
1.
2.
3.
4.
5. -
2+G G-A-G-A (for Ni )
Scheme 7: Interaction scheme of tetra-/ heptanucleotides and metal ions.
It has been shown that ACE measurements provide a great deal of information includingaffinity strength and stoichiometry, but also establish the formation of new species duringthe complexation process (e.g. the formation of quadruplexes). The behavior of Ni2+ isdifferent to alkali earth metal ions when tetramers are considered and is characterized bythe formation of macrochelates and the tendency to multiple binding.

8-62
8 CONCLUSIONThe shortening of analytical processes by miniaturizing separation devices is an on-goingtrend. Primarily the consumption of chemical reagents can be reduced, for someapplications also a shorter separation time is important. To date, it seems thatmicroanalytical systems for electrophoretic processes cannot compete with the classicalcapillary methods in all areas of analytical chemistry. On the other hand, microchips couldbe established in various fields of analytics, which require multi-step processes or fastseparation times. However, up to now, no commercial devices are available which allowmeasurements in free dissolved solutions with an appropriate development environment.Additionally, the reproducibility of measurements by controlling the flow of fluids has notbeen fully solved yet. Because no suitable detection systems with adequate LODs areavailable, the development of channels with dimensions in the nanometer range is notuseful, even if further miniaturizing would result in higher separation efficiencycomparable to capillaries usually used. Beside the need for technical development, highersensitivity and selectivity could also be achieved by employing chemical amplificationsystems as demonstrated here. Classic CZE and HPLC can also benefit from the novelprinciples of improved detection sensitivity and separation selectivity.The research presented here, and current state-of-the-art science and technologydemonstrate that microchips can be successfully implemented in the fields of:
1. Rapid chiral MC-separations: for development of active chiral catalysts and for qualitycontrol of drugs in pharmaceutics2. Cost- and time-saving development of separation methods in general: as aconsequence of reduced separation times (about 10-50 times) new methods as well as newbuffer components for selective separation can be tested for analysis subsequentlyperformed with classic CZE or HPLC even if full separation is not achieved on microchip.With such investigations, reasonable predictions can be made with respect to successfulseparations and optimal migration times.3. Fast affinity MC-measurements: for the development of enzyme-, immunoassays orfor fundamental studies in molecular biochemistry.

9-63
9 ACKNOWLEDGMENTSI am very grateful for the support of many people and institutions in my life and my career:Edwin C. Constable, Albert Enz, Beatrice Erismann, Pia Etter, Katharina Fromm, LutzFügener, Conrad Gentsch, Gabrielle Girau Pieck, Malgorzata Gonciarz, Markus Hauri,Peter C. Hauser, Catherine E. Housecroft, Susan Kaderli, Kinderkrippe der UniversitätBasel, Michael Oehme, Urs Rüttimann, Antoinette Schneider, André Scholer, Alexandra R.Stettler, Eva Schwarz, Heinz Schwarz, Katharina Schwarz, Katharina H. Schwarz, IngeburgSchwarz, Markéta Vlčková, Helma Wennemers, Wolf-D. Woggon and Andreas D.Zuberbühler. I would like to thank the Swiss National Science Foundation and ShimadzuCorp .(Germany) for their finical support.

10-64
10 APPENDIX
10.1 Publications
Publications (those marked in red indicates the current research project cited in the „Habilitation“):
1. J. Schiewe, S. Göbel, M. A. Schwarz und R. H. H. NeubertApplication of capillary zone electrophoresis for analyzing biotin in pharmaceutical formulations - acomparative study.JOURNAL OF PHARMACEUTICAL AND BIOPHARMACEUTICAL ANALYSIS14, 435-439 (1996).
2. M. A. Schwarz, R. H. H. Neubert und G. DongowskiCharacterization of interactions between bile salt and drug by micellar electrokinetic capillarychromatography. Part IPHARMACEUTICAL RESEARCH13 (8), 1174-1180 (1996).
3. M. A. Schwarz, R. H. H. Neubert und H. H. RüttingerApplication of capillary electrophoresis for characterizing interactions between drugs and bile salt. Part IIJOURNAL OF CHROMATOGRAPHY A745, 135-143 (1996).
4. R. H. H. Neubert, Y. Mrestani, M. A. Schwarz und B. ColinApplication of micellar electrokinetic chromatography for analyzing antiviral drugs in pharmaceuticalsemisolid formulations.JOURNAL OF PHARMACEUTICAL AND BIOPHARMACEUTICAL ANALYSIS16, 893-897 (1998).
5. M. A. Schwarz, K. Raith, H. H. Rüttinger, G. Dongowski und R. H. H. NeubertInvestigations of the interactions between drugs and mixed bile salt/lecithin micelles - a characterization byMicellar Affinity Capillary Electrophoresis. Part IIIJOURNAL OF CHROMATOGRAPHY A781, 377-389 (1997).
6. G. Dongowski, R. H. H. Neubert, B. Schorrenberger, M. Plätzer und M. A. SchwarzInteractions between Food Components and Drugs. Part 5: Effect of Acetylation and Amidation on theInteraction with Propranolol.INTERNATIONAL JOURNAL OF PHARMACEUTICS.158, 99-107 (1997).
7. G. Dongowski, R. H. H. Neubert, M. A. Schwarz, B. Schorrenberger und H. AngerInteraction between Food Components and Drug. Part 6: Influence of Starch Degradation Products onPropranolol Absorption.PHARMAZIE12, 871-875 (1998).
8. M. A. Schwarz, K. Raith, G. Dongowski und R. H. H. NeubertEffect on the partition equilibrium of various drugs by the formation of mixed bilesalt/phosphatidylcholine/fatty acid micelles - a characterization by Micellar Affinity CapillaryElectrophoresis. Part IVJOURNAL OF CHROMATOGRAPHY A809, 219-229 (1998).

10-65
9. G. Dongowski, M.A. Schwarz, B. Schorrenberger und R. H. H. NeubertIn-vitro interactions between drugs and acetylated and amidated pectins.FASEB JOURNAL12, 2999-3005 (1998).
10. M. Plätzer, M. A. Schwarz und R. H. H. NeubertDetermination of formation constants of cyclodextrin-inclusion complexes using capillary electrophoresis.JOURNAL OF MICROCOLUMN SEPARATIONS.11, 215-222 (1998).
11. M. A. Schwarz, K. Raith und R. H. H. NeubertCharacterization of simple and mixed bile salt micelles by means of CZE.ELECTROPHORESIS19, 2145-2150 (1998).
12. M. A. SchwarzVeröffentlichung der DissertationCharakterisierung von Wechselwirkungen zwischen Wirkstoffen und Gallensalzmizellen mittels mizellarerelektrokinetischer Affinitätschromatographie (MEAC).TECTUM VERLAG MARBURGISBN 3-8288-0389-X (1998).
13. R. H. H. Neubert, M. A. Schwarz, Y. Mrestani, M. Plätzer und K. RaithUse of Affinity Capillary Electrophoresis in Pharmaceutics (Review).PHARMACEUTICAL RESEARCH19, 1663-1673 (1999).
14. M. A. Schwarz , B. Galliker, K. Fluri, T. Kappes und P. C. HauserA two-electrode configuration for simplified amperometric detection in a microfabricated electrophoreticseparation device.ANALYST126, 147-151 (2001).
15. T. Kappes, B. Galliker, M. A. Schwarz und P. C. HauserPortable capillary electrophoresis instrument with amperometric, potentiometric and conductometricdetection.TRAC-TRENDS IN ANALYTICAL CHEMISTRY20, 133-139 (2001).
16. M. A. Schwarz und P. C. HauserRapid chiral on-chip separation with simplified amperometric detection.JOURNAL OF CHROMATOGRAPHY A928, 225-232 (2001).
17. M. A. Schwarz und P. C. HauserRecent developments in detection methods for microfabricated analytical devices.LAB ON CHIP-MINIATURISATION FOR CHEMISTRY AND BIOLOGY1, 1-6 ( 2001).
18. J. Tanyanyiwa, B. Galliker, M. A. Schwarz and P. C. HauserImproved capacitively coupled conductivity detector for capillary electrophoresis.ANALYST127, 214-218 (2002).

10-66
19. M. A. Schwarz und P. C. HauserChapter “Micelles”ACE in Pharmaceutics and Biopharmaceutics.PUBLISHED BY MARCEL DEKKER (NEW YORK, BASEL)(January, 2003).
20. M. A. Schwarz und P. C. HauserChiral on-chip separation of neurotransmitters.ANALYTICAL CHEMISTRY75, 4691-4695 (2003).
21. M. A. Schwarz•
Enzyme-catalyzed amperometric oxidation of neurotransmitter in chip-capillary electrophoresis.ELECTROPHORESIS25, 1916-1922 (2004).
22. A.R. Stettler and M. A. Schwarz •
Affinity capillary electrophoresis on chip.JOURNAL OF CHROMATOGRAPHY A1063, 217-225 (2004).
23. M. Vlčková and M. A. Schwarz•
Enzymatic Sensitivity Enhancement of Biogenic Monoamines on Chip.ELECTROPHORESIS26, 2701-2707 (2005)
24. R. Guchardi and M. A. Schwarz•
Modified Hadamard transform Microchip electrophoresis.ELECTROPHORESIS26, 3151-3159 (2005)
25. A.R. Stettler, M. Vlčková and M.A. Schwarz•
Microchip Affinity capillary electrophoresis: applications and recent advances, Review.CHROMATOGRAPHY & RELATED TECHNOLOGIES29, 1047-1076 (2006)
26. A.R. Stettler, V. Chaurin, E.C. Constable, C.E. Housecroft and M.A. Schwarz•
Quantification of single-stranded nucleic acid and oligonucleotide interactions with metal ions by affinitycapillary electrophoresis. Part IJOURNAL OF BIOLOGICAL INORGANIC CHEMISTRY (2006)In press.
27. A.R. Stettler, Ph. Krattiger, H. Wennemers and M. A. Schwarz•
Electrophoretic Affinity Measurements on Microchip – Determination of Binding Affinities betweenDiketopiperazine Receptors and Peptide Ligands.ELECTROPHORESIS(2006)In press.
28. A.R. Stettler and M. A. Schwarz •
Quantification of single-stranded nucleic acid and oligonucleotide interactions with metal ions by affinitycapillary electrophoresis. Part IIJOURNAL OF BIOLOGICAL INORGANIC CHEMISTRY (2006)In preparation.

10-67
29. M. Vlčková and M. A. Schwarz•
Determination of cationic neurotransmitters and metabolites in brain homogenates by microchipelectrophoresis and carbon nanotubes modified amperometry.JOURNAL OF CHROMATOGRAPHY A (2006)In press.
30. K. Fromm, M. Mayor, M. Schwarz and A. ZuberbühlerEinführung in die Chemie I, Repetitorium (Kapitel: Chemische Gleichgewichte, Kinetik, Elektrochemie)Orell Füssli Verlag, ZürichIn preparation.
Patents:R.H.H. Neubert und M.A. SchwarzVehikelsysteme für lipophile und extrem lipophile Arzneistoffe.(A 61 K 9 - 127, DE 19722831.3 - 41, 12.06.97)
R.H.H. Neubert und M. SchwarzVehikelsysteme für Arzneistoff.(A 61 K 9 - 127, DE 19722831.5 - 41, 12.06.97)

10-68
10.2 Curriculum Vitae
Persönliche Information Dr. Maria Anna Schwarz, geb. LampadiusFamilienstand: ledigStaatsangehörigkeit: Bundesrepublik DeutschlandGeburtstag: 05.11.1969Geburtsort: DresdenKinder: Tochter (geboren am 08.03.2004)
Ausbildung 01.1995- 01.1998 Martin-Luther-Universität (Halle/Deutschland)Dr. rer. nat.Charakterisierung von Wechselwirkungen zwischen Wirkstoffen undGallensalzmizellen mittels mizellarer elektrokinetischer Affinitäts-chromatographie (MEAC), Note: summa cum laude (ausgezeichnet)
09.1988 - 07.1993 Martin-Luther-Universität (Halle/Deutschland)Diplom ChemikerEntwicklung von Analyseverfahren zur Bestimmung vonSchwefelverbindungen im Abwasser, Note (Gesamt): 1.16 (sehr gut)
09.1986 - 06.1988 Spezialklassen Chemie (Merseburg/Deutschland)Erweitertes Abitur für Naturwissenschaften
Berufserfahrung 12.2006 - heute Solvias (Basel/Schweiz)Projektleiter, senior scientist.
03.2000 - 11.2006 Universität Basel (Basel/Schweiz)Habilitand, AssistentDepartement ChemieEntwicklung mikroanalytischer Analysenmethode
09.1998 - 02.1999 Martin-Luther-Universität (Halle/Deutschland)Wissenschaftlicher MitarbeiterFachbereich PharmazieVorbereitung für Habilitation
01.1998 - 08.1998 SerCon/IBM (Wiesbaden/Deutschland)SAP-Programmierer
08.1993 - 12.1994 Martin-Luther-Universität (Halle/Deutschland)Wissenschaftlicher MitarbeiterInstitut für Analytik und Umweltchemie
LehrePraktikum
Vorlesung /Kolloquium/Übungen
Anorganische Chemie, Leitung (ab 2001) Nebenfachpraktika (Biologie, Pharmazie, 2000-2003)
Bioanalytical Science (ab 10.2006) Übungen für Chemiker und Nebenfachstudenten,
Allgemeine Chemie(ab 2001), Leitung (ab 2004)
Trends in der Analytik (ab 10.2003) Vertretung Analytische Chemie III (2002)

10-69
Kolloquium zum Praktikum Anorg. Chemie (ab 2001)
Weitere Berufstätigkeiten/Weiterbildung
08.2002 - 08.2004 Dozent f. Chemie (Basel/Schweiz)Fachschule
05.2002 - 04.2003 Novartis/Universität Basel (Basel/Schweiz)Mentorenprogramm WIN
09.2001 Universität Basel (Basel/Schweiz)Wissenschaftsmanagement für angehende Professorinnen
03.1999 - 02.2000 Jugendschiff „Ruach“First Mate und AusbilderJugendheim Sternen (Schweiz)
Auszeichnungen/Listenpositionen (LP)
Bewilligtes Habilitationsstipendium der DFG (DFG, SCHW 771/1-1)Entwicklung von Arzneistoffträgern für lipophile Arzneistoffe
Luther-Medaille , 25.06.1998
Stipendium des Graduiertenkollegs der DeutschenForschungsgemeinschaft Thema „Transport von Wirkstoffen inbiologischen Systemen“ (1995-1998)
Akademische Mittelbaustelle (Nachfolge Prof. Pretsch) inAnalytischer Chemie, ETH-Zürich, LP: 1, 01.2004
W2-professureship, Philipps-University Marburg , LP: 3, 2006Patente undVeröffentlichungen
Vorträge/Postereingeladen
nicht eingeladen
siehe Aufstellung
ANAKON, 03. 2005 (Regensburg, D)Schwarz, M.A.Mikrochip-Kapillarelektrophorese
ETH Zürich, 01.2004Schwarz, M.A.On-Chip Separations with Amperometric Detection
Universität Tübingen, 11.2003Schwarz, M.A.
ANAKON, 04.2003 (Konstanz, D)Schwarz, M.A.Fast Chiral On-Chip Separations with Amperometric Detection
Novartis, 08.2002 (Basel, CH)Schwarz, M.A.Mikroanalytische Systeme
ADUC Chemiedozententagung, 04.2006 (Hamburg, D)Schwarz, M.A

11-70
4th International Symposium on Separations in BioSciences, 9.2005(Utrecht, Netherlands)Vlčková, M., Schwarz, M.ASensitive enzyme based amperometric detection of neurotransmitterson a chip
ADUC Chemiedozententagung, 03.2005 (München, D)Schwarz, M.A.
HPCE`04, (Salzburg, A)Stettler, A., Schwarz, M.A.Affinity Capillary Electrophoresis on Microchip
NanoTech 2001, 11.2002 (Montreux, CH)Schwarz, M.A. and Hauser, P.
HPCE´97, 01.1997 (Anaheim, California, USA)
HPCE´96, 01.1996 (Orlando, Florida, USA)
Zusammenarbeiten Applikationszentrum, Mikrotechnik Jena (Frauenhofer Institute, Jena,Deutschland)
Prof. E. Constable (Inst. Anorganische Chemie, Universität Basel,Basel, Schweiz)
Prof. H. Wennemers (Inst. Organische Chemie, Universität Basel,Basel, Schweiz)
Dr. A. Enz (Novartis, Basel, Schweiz)Begutachtung vonwissenschaftlichenZeitschriften
CHEMOSPHEREELECTROPHORESISJ. CHROMATOGRAPHY APOLYHEDRONSENSORS AND ACTUATORS BTALANTA
Aktuelles SNF-Forschungsprojekt
“Chip-based bioanalytical microsystems: new applications”, Laufzeit:07.2004-08.2008, Schweizerischer Nationalfonds, 1 PhD,Finanzvolumen: 240’000,- SFr
11 PUBLICATIONS
ACE as a separation tool P1: Rapid chiral on-chip separation with simplified amperometric detection (J.
Chromatogr. A, 928, 2001, 225-232) P2: Chiral on-chip separation of neurotransmitters (Anal. Chem., 75, 2003, 4691-
4695) P3: Enzyme-catalyzed amperometric oxidation of neurotransmitter in chip-capillary
electrophoresis (Electrophoresis, 25, 2004, 1916-1922) P4: Enzymatic sensitivity enhancement of biogenic monoamines on chip
(Electrophoresis, 26, 2005, 2701-2707)

11-71
P5: Modified Hadamard transform microchip electrophoresis (Electrophoresis, 26,2005, 3151-3159)
P6: Determination of cationic neurotransmitters and metabolites in brainhomogenates by microchip electrophoresis and carbon nanotubes modifiedamperometry (J. Chromatogr. A, in press)
ACE for characterizing interactions P7: Affinity capillary electrophoresis on chip (J. Chromatogr. A, 1063, 2005, 217-
225) P8: Quantification of single-stranded nucleic acid and oligonucleotide interactions
with metal ions by affinity capillary electrophoresis. Part I (J. Biol. Inorg. Chem., inpress)
P9: Electrophoretic affinity measurements on microchip – determination of bindingaffinities between diketopiperazine receptors and peptide ligands (Electrophoresis,in press)
P10: Microchip affinity capillary electrophoresis: applications and recentadvances, Review (J. Liq. Chromatogr. Relat. Technol., 29, 2006, 1047-1076)