mari, x., e. rochelle-newall, j.-p. torréton, o. pringault ... 2007.pdf · tions. chlorophyll a...
TRANSCRIPT

Water residence time: A regulatory factor of the DOM to POM transfer efficiency
Xavier Mari, Emma Rochelle-Newall, Jean-Pascal Torreton, Olivier Pringault, and Aymeric JouonIRD, UR 103, Noumea Center, BP A5, NC-98848 Noumea, New Caledonia
Christophe MigonObservatoire Oceanologique de Villefranche-sur-Mer, Laboratoire d’Oceanographie de Villefranche-sur-Mer, UMR 7093,La Darse, B.P. 8, F-06238 Villefranche-sur-Mer Cedex, France
Abstract
The pools of dissolved (DOM) and particulate organic matter (POM) and of transparent exopolymericparticles (TEP) were studied along two sampling gradients in the lagoon of New Caledonia in relation to theresidence time of the water masses. The efficiency of the transfer of material from the dissolved to the particulatephase via TEP formation, indicating the physicochemical reactivity of organic matter, was investigated. DOM,POM, and TEP concentration increased along the sampling gradients, but their relative proportions varied. Thecontribution of the TEP pool to POM increased from 20% to 60%, from the most oligotrophic stations to themore anthropogenically affected bays. According to the low density of TEP and to the observed variations of theproportion of TEP compared with more conventional and solid particles, the aggregates formed inside the bayswould be either neutrally or positively buoyant, whereas in the vicinity of the coral barrier, they would benegatively buoyant. As a result, the downward export of organic matter inside the bays might be greatly reduced,thereby prolonging the residence time of organic matter in the water column. The efficiency of the DOM/TEPtransformation and the TEP turnover rate dropped drastically when the residence time increased from 0 to 50 d,suggesting that the reactivity of organic matter is reduced as it ages. The very high residence time of the watermass inside the bays, constrained by the hydrodynamic circulation inside the lagoon, favors the installation ofa feedback system in which organic matter is not exported and is continuously degraded, leading to the formationof refractory DOM with a low physicochemical reactivity. In contrast, organic matter produced in areas in whichwater mass has a low residence time (i.e., near the coral barrier) is rapidly exported because of its highphysicochemical reactivity.
A large fraction (,30%) of the dissolved organic matter(DOM) released by phytoplankton is of high molecularweight (HMW; Carlson et al. 1985; Benner et al. 1992;Amon and Benner 1994), and about half of this HMW-DOM fraction is constituted by highly reactive polysac-charides (Benner et al. 1992). Transparent exopolymericparticles (TEP) are formed by coagulation of DOM (Zhouet al. 1998; Mari 1999; Passow 2000), particularly the morereactive fraction (i.e., HMW-DOM; Zhou et al. 1998).Furthermore, it has been suggested that TEP exist alonga size continuum from molecules of .1 kDa (HMW-DOM) to particles of hundreds of microns and that thedefinition of this pool of organic matter should be extendedto include both size fractions to form a single reservoir ofTEP (Mari et al. 2001).
The transfer of organic matter from the dissolved to theparticulate phases via the TEP pathway is driven bycollision mechanisms followed by adhesion. Although
collisions are mostly controlled by external constraints,such as TEP concentration and turbulence, adhesion isdriven by the intrinsic sticking properties of TEP pre-cursors. The sticking properties of TEP and, to a largerextent, the surface-active properties of polysaccharidesconstituting the HMW-DOM fraction are linked to theirchemical composition. The high fraction of polysaccharideswith sulfate half-ester groups in the HMW-DOM fractionexplains the strong propensity of these polysaccharides toform cationic bridges (Kloareg and Quatrano 1988) andhydrogen bonds (Chin et al. 1998). These highly surface-active polysaccharides are known to be the source of TEP(Zhou et al. 1998). However, because the chemicalcomposition of the exudates released by phytoplanktonvaries as a function of species and physiological status(Aluwihare and Repeta 1999), the primary composition ofTEP and, thus, the sticking properties might also vary asa function of the same factors. Another process that couldalter the composition, and thus the reactivity of TEP, isbacterial degradation. TEP are always colonized bybacteria (Alldredge et al. 1993; Passow and Alldredge1994; Mari and Kiørboe 1996) and, thus, could exhibit veryhigh bacterial activities, such as that observed withinmarine snow aggregates (Muller-Niklas et al. 1994). Thisprocess could lead to the dissolution of aggregates (Smith etal. 1992), to a modification of the composition of theattached bacterial assemblages (Moeseneder et al. 2001),and to a modification of its chemical composition byselectively removing bioreactive components (Aluwihare
AcknowledgmentsWe thank the crew of the R/V Coris for their assistance during
sampling and P. Gerard for providing the nutrient data. We aregrateful to S. Ouillon and P. Douillet for helpful discussions onthe hydrodynamic parameters. Thanks are due to E. A. Canueland two anonymous reviewers for constructive comments on themanuscript.
This research was supported by the French National ResearchAgency (ANR-ECCO program) and by the French ResearchInstitute for Development (IRD).
Limnol. Oceanogr., 52(2), 2007, 808–819
E 2007, by the American Society of Limnology and Oceanography, Inc.
808

and Repeta 1999; Amon et al. 2001) leading to theproduction of recalcitrant DOM (Ogawa et al. 2001).Because of their central role in carbon cycling, DOM andTEP exert a significant effect on the vertical flux ofelements in the ocean and on their burial to the deep ocean(Engel et al. 2004). However, the influence of polysaccha-ride aggregation is closely linked to the reactivity of TEPand DOM, which can vary in response to its age and stageof degradation. Other than remineralization, a majordeterminant of DOM export is by water mass transportIn cases in which input rates of DOM match hydrody-namically driven removal rates, DOM will be controlled toa greater extent by physical rather than by biogeochemicalprocesses. However, if input and removal of DOM becauseof low water mass renewal rates (i.e., long residence times)is imbalanced, the DOM pool will be largely controlled bydegradation processes. In other words, long residence timeshould lead to prolonged bacterial degradation of DOM.Because of topographic constraints, flows are often re-stricted in estuarine and coastal zones, leading to increasedresidence times. Although the residence time of a watermass potentially controls the biogeochemistry of coastaland estuarine areas, the relationship between hydrodynam-ics and DOM reactivity has long been neglected.
In this study, we investigated the reactivity of DOM andits tendency to form TEP by monitoring both pools oforganic matter along two sampling gradients in a lagoon inNew Caledonia. To link the reactivity of DOM with its ageand stage of degradation, variations of the DOM versusTEP equilibrium were correlated with the residence time ofthe water mass.
Materials and methods
The study site—The southwest lagoon of New Caledoniais an enclosed, relatively shallow site (,20 m) surroundedby oligotrophic oceanic water. In contrast to the oligo-trophy observed near the coral barrier, the nearshoreenvironment is subject to terrestrial inputs and to bothindustrial and urban effluents in the bays around the city ofNoumea. This results in well-defined gradients of eutro-phication that last throughout the year (Jacquet et al.2006). Eutrophication in Sainte-Marie Bay (east ofNoumea) is mostly due to wastewater outfalls from theSainte-Marie area (i.e., urban origin). Eutrophication inGrande Rade Bay (west of Noumea) is mainly of industrialorigin from the close proximity of a large nickel smelt. Inaddition to the continuous input of inorganic nutrients andorganic matter in the bays, the permanence of this structureis strengthened by a gradient of water mass residence time.
Residence time of the water masses—The parameter usedto describe the residence time of the water mass is the locale-flushing time (LeFT, d). The replacement efficiency ofwater masses can be revealed in the study area by thecomputation of LeFT. The LeFT is a synthetic parameterthat indicates the time required for a tracer mass containedwithin the station (control volume) to be reduced bya factor 1/e (Jouon et al. 2006) by waters coming fromoutside the lagoon. The shorter the LeFT, the faster the
water masses at the location will be replaced. In contrast, atlonger LeFT, water masses are replaced more slowly,leading to higher residence times. The annual average ofLeFT at the different stations was calculated froma hydrodynamic model adapted to the studied area takinginto account topographic constraints, average wind condi-tion in the lagoon, and tidal cycle (Jouon et al. 2006). Thismodeling exercise provides estimates of the renewal rates ofthe water masses in the lagoon (i.e., LeFT), which can beregarded as mean values because the initial parameters usedin the model are annual averages of wind conditions.During the sampling period, wind conditions were similarto those used as input parameters in the hydrodynamicmodel (i.e., well-established trade winds of about 8–10 m s21); thus, the annual average of LeFT is applicableto the sampling campaigns.
Sampling—Seawater samples were collected during foursampling occasions in November 2004 with a Teflon pumpat 5 m depth for 10 stations. These stations covered twogradients that started in two distinct eutrophied bays(Sainte Marie and Grande Rade) around the city ofNoumea and extended to the exterior of the barrier reef(Fig. 1). The sites were divided into six groups (i.e., openocean, near barrier, middle of the lagoon, mouth of thebays, middle of the bays, and head of the bays). CTD castswere used on each sampling occasion to determine thepresence of vertical stratification. After sampling, seawatersamples were kept in 30-liter polycarbonate bottles out ofdirect sunlight until returned to the laboratory within 1–2 h. Each transit was studied twice over a 2-week period,and all stations along each transit were sampled within 1 h.
Pigments and nutrients—Unfiltered replicate 40-mLsamples were immediately frozen pending nitrate + nitrite
Fig. 1. Map of the study area with position of the samplingstations. The stations D and N are localized in the bays of GrandeRade and of Sainte Marie, respectively.
DOM reactivity and eutrophication 809

(NOx), and phosphate (PO 324 ) analyses. Silicate was
determined on one 60-mL subsample, which was immedi-ately frozen after sampling. Nitrate and nitrite concentra-tions were determined according to Raimbault et al. (1990)on a Bran+Luebbe Autoanalyzer III with an averagecoefficient of variation (C.V.) of 3% (eutrophic) to 8%(oligotrophic) between replicates. Phosphate and totalsilicate (dissolved and colloidal) concentrations were de-termined according to Grasshoff et al. (1983). Phosphateconcentrations were determined on a Bran+Luebbe Auto-analyzer III with an average C.V. of 6% to 11% betweenreplicates. The N : P molar ratios (mmol L21 : mmol L21)were calculated as the sum of dissolved nitrite, nitrate, andammonia concentrations divided by phosphate concentra-tions. Chlorophyll a (Chl a) was determined fluorometri-cally from duplicate 200-mL subsamples filtered onto 25-mm Whatman GF/F filters.
Nutrient measurements were conducted on unfilteredsamples to avoid contamination during filtration. Thisprocedure is similar to the method used for DOCmeasurements in oligotrophic waters. A test conductedwith filtered and unfiltered samples collected in the middleof the lagoon and in the bay of Sainte Marie showed thatNOx and PO 32
4 concentrations were not significantlydifferent in the lagoon (t-test, p . 0.05) whether thesamples were filtered or not, whereas they were significant-ly different (t-test, p , 0.05) with the samples from the bay.For the bay samples, the concentration of NOx increasedslightly when the samples were filtered (i.e., from 0.855 60.011 to 0.924 6 0.043 mmol L21 for the unfiltered andthe filtered samples, respectively). On the contrary, theconcentration of PO 32
4 decreased very slightly when thesamples were filtered (i.e., from 0.267 6 0.003 to 0.247 60.011 mmol L21 for the unfiltered and the filtered samples,respectively). This test shows that filtration increasesvariability, which suggests that filtration rather thanfreezing alters nutrient concentrations in oligotrophicwaters.
Microscopic TEP determination—TEP were stained withAlcian blue (Alldredge et al. 1993) and TEP size spectrawere determined from 5- and 10-mL subsamples filteredonto 0.2-mm polycarbonate filters after transfer of theparticles retained onto a microscope slide (Passow andAlldredge 1994). TEP size spectra were determined for eachslide by counting and sizing TEP at two successivemagnifications (3250 and 3400) with a compound lightmicroscope. Ten images were taken per slide and for eachmagnification. The equivalent spherical diameter of eachTEP (dp, mm) was calculated by measuring its cross-sectional area with an image analysis system (ImageProPlus, MediaCybernetics), and counts were combined andclassified into 20 logarithmic size classes (Mari and Burd1998). TEP size distributions were described by a powerrelation of the type dN=d(dp) ~ kdd
p, where dN is the
number of particles per unit volume in the size range dp to
[dp + d(dp)]. The spectral slope, d, describes the size
distribution and was estimated from regressions of
log[dN/d(dp)] versus log(dp). The TEP volume concentra-
tion was calculated from the TEP size spectra assuming
a spherical volume for each particle.
Colorimetric TEP determination—The semiquantitativecolorimetric TEP method, developed by Passow andAlldredge (1995), allows the determination of TEPconcentration (TEPspectro; xanthan equivalents per liter)by measuring the total amount of Alcian blue adsorbed toall particles, including TEP, that contain carboxylated andsulfated polysaccharides. Two aliquots (100 and 200 mL)of each sample were filtered through 0.4-mm pore sizepolycarbonate filters at low and constant vacuum pressure(,150 mbar). Particles retained on filters were stained with500 mL of Alcian blue solution. After staining, filters wererinsed with Milli-Q water and were frozen for later analysis.Filters were transferred to 20-mL polyethylene scintillationvials with 6 mL of H2SO4 and were soaked for .2 h.During this period, the vials were agitated to ensure TEPdissolution. The amount of dye bound to particles wasdetermined by measuring adsorption at 787 nm (wave-length of adsorption maximum of Alcian blue) witha spectrophotometer (Perkin-Elmer, Lambda 20). Blankswere taken between each sample with 5 mL of distilledwater.
TEP carbon concentration—Estimates of TEP carbonconcentration (TEP-C) were calculated two ways. First, bycombining TEP size spectra with the relationship giving thecarbon content of a given TEP particle according to its size(Mari 1999). Thus, TEP carbon concentration (TEP-Cmicro,mg C L21) is given by TEP-Cmicro 5 0.25 31026
Pi nir
2:55i ;
where ni and ri are, respectively, the concentration ofparticles and the equivalent spherical radius of the TEPparticle in size class i. Second, TEP carbon concentration(TEP-Cspectro, mg C L21) was calculated from colorimetricdeterminations (Engel and Passow 2001) as follows: TEP-Cspectro 5 0.75TEPspectro/V, where TEPspectro is the TEPconcentration (mg xanthan equivalent L21) and V is thevolume filtered (mL).
Dissolved organic carbon, nitrogen, and phosphorusdetermination—Dissolved organic carbon (DOC) analyseswere performed on 10-mL subsamples collected in pre-combusted (450uC, overnight) 10-mL glass ampoules,preserved with 12 mL of 85% phosphoric acid (H3PO4),and flame sealed. Samples were stored in the dark untilanalysis. DOC concentration was measured on a ShimadzuTOC VCPH analyzer with potassium phthalate calibrationstandards over the measurement range 0–250 mmol C L21.Certified reference materials (Hansell Laboratory, Univer-sity of Miami, Florida) were also used to assess theperformance of the instrument on and between measure-ment days. The machine blank was between 5 and10 mmol C L21 for the measurement days. Total organicnitrogen (TON) and phosphorous (TOP) were determinedfrom unfiltered replicate 120-mL samples immediatelyfrozen until analysis. After mineralization of organicmaterial by wet oxidation (Raimbault et al. 1999),phosphate and nitrate were measured as described above.Dissolved organic nitrogen (DON) and phosphorous
810 Mari et al.

(DOP) were computed by subtracting correspondingdissolved inorganic and particulate organic nutrients fromTON or TOP. The C : N : P molar ratios were obtained interms of DOC : DON : DOP from the bulk dissolvedfraction.
Particulate organic carbon, nitrogen, and phosphorusdetermination—Particulate organic carbon (POC) andparticulate nitrogen (PN) were measured from 2.5-Lsubsamples (one for each sampling station) immediatelyfiltered onto 25-mm Whatman GF/F filters precombustedat 550uC for 2 h. After filtration, the filters were dried at60uC for 24 h and then frozen for later analysis. Analyseswere carried out with a LECO-900 CHN analyzercalibrated with ethylenediaminetetraacetic acid standards.For the determination of organic carbon, carbonates wereremoved with 100-mL of 2 mol L21 HCl and renewed untilthere was no longer any effervescence. Acidified sampleswere kept in a drying oven (60–70uC) for 24 h. Detectionlimits were 40 and 10 mg for carbon and nitrogen,respectively. Particulate organic phosphorus (POP) wasmeasured by an autoanalyzer from 500-mL subsamples(one for each sampling station) filtered on GF/F Whatmanfilters (Mullin and Riley 1955). The C : N : P molar ratioswere obtained in terms of POC : PN : POP from the bulkparticulate fraction.
Particulate and dissolved primary production—Particulateand dissolved primary production (PP and DPP, respec-tively) were measured according to NaH14CO3 (Maranonet al. 2005). Duplicate 63-mL water samples were in-oculated with either 0.22, 0.44, or 0.66 MBq of 14C,depending on the anticipated trophic status of the sample,and incubated in a flowing seawater incubation system.Neutral density screening was used to provide a gradient ofirradiance. After 4 h of incubation, samples were carefullyfiltered at low vacuum pressure onto 0.4-mm polycarbonatefilters (Whatman Cyclopore). After acidification anddrying, 5 mL of scintillation cocktail (Ultima Gold,Packard Instruments) was added. The amount of 14Cincorporated into the particulate phase (PP) was calculatedwith the use of an inorganic carbon concentration of25,700 mg C L21 (Maranon et al. 2004). For the DPPmeasurement, 5 mL of filtrate was collected, acidified with100 mL of 5 mol L21 HCl, and left for 12 h on a horizontalagitator table. A test before the incubations showed thatthe volume of acid and agitation time was sufficient toremove all the inorganic 14C remaining in the filtrate. Afteracidification, 15 mL of scintillation cocktail (Ultima GoldXR, Packard Instruments) was added, and the sampleswere counted. The values of PP and DPP were transformedinto water column integrated rates by the trapezoidalmethod (Maranon et al. 2004), taking in account the watercolumn light distribution of the sample site and the actualirradiation received by the samples.
Reactivity of DOM—Because TEP are produced bycoagulation of precursors of colloidal size, the TEP pooltakes its roots in the dissolved phase. Because TEP areformed from DOC via coagulation of dissolved and
colloidal polysaccharides, the TEP-C : DOC ratio can beused to estimate the fraction of reactive DOC that couldenter into coagulation mechanisms. In addition, consider-ing that the carbon content of a given TEP particle isa conservative property and assuming that TEP stainabilitydepends on its solid volume and, thus, its carbon content,both approaches used to estimate TEP-C (microscopic andcolorimetric) should give similar results. Discrepancybetween the results obtained from the two methods couldresult if (1) Alcian blue is retained by particles other thanTEP or (2) TEP stainability varies (e.g., because ofbacterial degradation or modification of TEP composition)(Mari et al. 2005). Therefore, the ratio between TEP-Cconcentrations estimated spectrophotometrically (TEP-Cspectro, mmol L21) and microscopically (TEP-Cmicro,mmol L21) was used to indicate an alteration of TEPcomposition and structure.
Results
Physical characteristics, nutrients, and pigments—Thephysical characteristics were relatively conservative alongthe two transects (Table 1). Temperature and salinityaveraged (mean 6 SD) 24.3 6 0.7uC and 36.0 6 0.2,respectively, and no vertical stratification was observed(data not shown). The somewhat higher salinity in GrandeRade and Sainte Marie Bays relative to the open ocean sitesis probably linked to longer residence times in the bays,providing more time for evaporation to take place.
Nutrient concentrations increased continuously from theopen ocean to the head of the bays (Table 1). Maximumconcentrations (mean 6 SD) of inorganic nitrogen (0.29 60.06 mmol L21) and phosphorus (0.10 6 0.00 mmol L21)were recorded in the head of Sainte Marie Bay (stationN04). Maximum concentrations of silicates (7.87 62.58 mmol L21) were measured at the head of GrandeRade Bay (station D01). Both transects were characterizedby an inorganic nitrogen limitation (N : P , 5; Table 1).The distribution of pigments largely follows that ofnutrients, with maximum concentrations in the head ofthe bays (1.68 6 0.63 mg Chl a L21 and 0.21 6 0.10 mgphaeopigments L21; mean 6 SD) that rapidly decrease toreach a minimum outside the bays (Table 1).
The estimated LeFT at the different stations varies from0 to ,50 days for the open ocean and the head of theGrande Rade Bay stations, respectively (Table 1). One ofthe two studied bays (Grande Rade Bay) is semienclosed,and the water mass renews very slowly (LeFT . 30 d)compared with the other stations. The LeFT is .10 dinside the two bays and varies between 0 and 10 d at thestudied stations in the middle of the lagoon. By definition,the LeFT of the water mass outside the lagoon (stationM41) is set to zero (initial parameter of the model).
Elemental composition of DOM and particulate organicmatter—The DOM and particulate organic matter (POM)pools had an average C : N : P stoichiometry (mean 6 SD)of 425 (6129) : 32 (68) : 1 and of 70 (630) : 10 (64) : 1,respectively (Fig. 2). The average C : P, N : P, and C : N forboth the dissolved and the particulate phase varied between
DOM reactivity and eutrophication 811
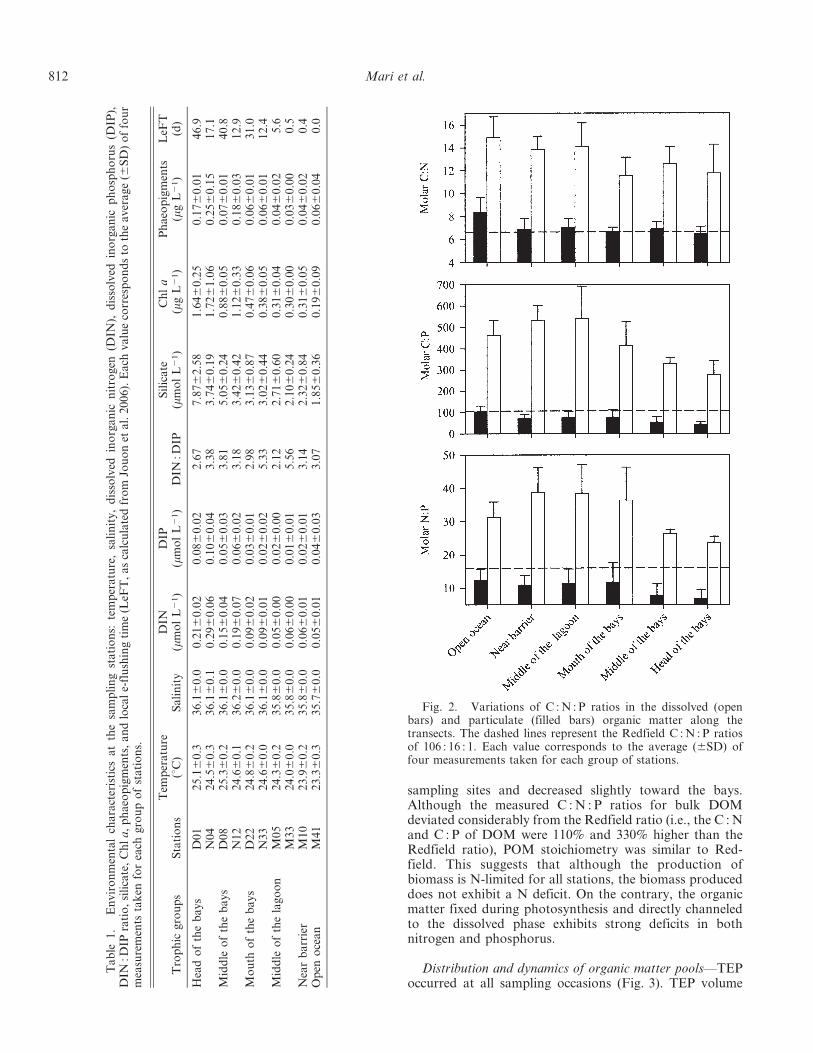
sampling sites and decreased slightly toward the bays.Although the measured C : N : P ratios for bulk DOMdeviated considerably from the Redfield ratio (i.e., the C : Nand C : P of DOM were 110% and 330% higher than theRedfield ratio), POM stoichiometry was similar to Red-field. This suggests that although the production ofbiomass is N-limited for all stations, the biomass produceddoes not exhibit a N deficit. On the contrary, the organicmatter fixed during photosynthesis and directly channeledto the dissolved phase exhibits strong deficits in bothnitrogen and phosphorus.
Distribution and dynamics of organic matter pools—TEPoccurred at all sampling occasions (Fig. 3). TEP volume
Fig. 2. Variations of C : N : P ratios in the dissolved (openbars) and particulate (filled bars) organic matter along thetransects. The dashed lines represent the Redfield C : N : P ratiosof 106 : 16 : 1. Each value corresponds to the average (6SD) offour measurements taken for each group of stations.
Table
1.
En
vir
on
men
tal
cha
ract
eris
tics
at
the
sam
pli
ng
sta
tio
ns:
tem
per
atu
re,
sali
nit
y,
dis
solv
edin
org
an
icn
itro
gen
(DIN
),d
isso
lved
ino
rga
nic
ph
osp
ho
rus
(DIP
),D
IN:D
IPra
tio
,si
lica
te,
Ch
la,
ph
aeo
pig
men
ts,
an
dlo
cal
e-fl
ush
ing
tim
e(L
eFT
,a
sca
lcu
late
dfr
om
Jou
on
eta
l.2
00
6).
Ea
chv
alu
eco
rres
po
nd
sto
the
av
era
ge
(6S
D)
of
fou
rm
easu
rem
ents
tak
enfo
rea
chg
rou
po
fst
ati
on
s.
Tro
ph
icg
rou
ps
Sta
tio
ns
Tem
per
atu
re(u
C)
Sa
lin
ity
DIN
(mm
ol
L2
1)
DIP
(mm
ol
L2
1)
DIN
:DIP
Sil
ica
te(m
mo
lL
21)
Ch
la
(mg
L2
1)
Ph
aeo
pig
men
ts(m
gL
21)
LeF
T(d
)
Hea
do
fth
eb
ay
sD
01
25
.16
0.3
36
.16
0.0
0.2
16
0.0
20
.086
0.0
22
.67
7.8
76
2.5
81
.646
0.2
50
.176
0.0
14
6.9
N0
42
4.5
60
.33
6.1
60
.10
.296
0.0
60
.106
0.0
43
.38
3.7
46
0.1
91
.726
1.0
60
.256
0.1
51
7.1
Mid
dle
of
the
ba
ys
D0
82
5.3
60
.23
6.1
60
.00
.156
0.0
40
.056
0.0
33
.81
5.0
56
0.2
40
.886
0.0
50
.076
0.0
14
0.8
N1
22
4.6
60
.13
6.2
60
.00
.196
0.0
70
.066
0.0
23
.18
3.4
26
0.4
21
.126
0.3
30
.186
0.0
31
2.9
Mo
uth
of
the
ba
ys
D2
22
4.8
60
.23
6.1
60
.00
.096
0.0
20
.036
0.0
12
.98
3.1
36
0.8
70
.476
0.0
60
.066
0.0
13
1.0
N3
32
4.6
60
.03
6.1
60
.00
.096
0.0
10
.026
0.0
25
.33
3.0
26
0.4
40
.386
0.0
50
.066
0.0
11
2.4
Mid
dle
of
the
lag
oo
nM
05
24
.36
0.2
35
.86
0.0
0.0
56
0.0
00
.026
0.0
02
.12
2.7
16
0.6
00
.316
0.0
40
.046
0.0
25
.6M
33
24
.06
0.0
35
.86
0.0
0.0
66
0.0
00
.016
0.0
15
.56
2.1
06
0.2
40
.306
0.0
00
.036
0.0
00
.5N
ear
ba
rrie
rM
10
23
.96
0.2
35
.86
0.0
0.0
66
0.0
10
.026
0.0
13
.14
2.3
26
0.8
40
.316
0.0
50
.046
0.0
20
.4O
pen
oce
an
M4
12
3.3
60
.33
5.7
60
.00
.056
0.0
10
.046
0.0
33
.07
1.8
56
0.3
60
.196
0.0
90
.066
0.0
40
.0
812 Mari et al.

concentrations varied between 0.05 6 0.03 and 6.62 61.56 ppm (mean 6 SD) and increased from the coralbarrier toward the head of the bays. As indicated by theincrease of the TEP spectral slope, d, the observed increasein TEP volume concentration likely results from anincrease of the large TEP fraction.
The carbon trend (mean 6 SD) within the different poolsof organic matter increased along the offshore gradient,from 0.5 6 0.1 to 3.9 6 0.3 mmol L21, from 2.8 6 1.4 to 7.96 3.5 mmol L21, and from 63.1 6 3.1 to 74.7 66.1 mmol L21 for TEP, POC, and DOC, respectively(Fig. 4). TEP-C concentration was positively correlated toboth DOC (DOC 5 3.9TEP-C + 58, r2 5 0.85, p , 0.05, n5 10) and POC concentrations (POC 5 1.54TEP-C + 1.65,r2 5 0.84, p , 0.05, n 5 10), and POC concentration waspositively correlated to DOC concentration (POC 52.2TEP-C + 56, r2 5 0.80, p , 0.05, n 5 10). BecauseTEP are formed from DOC, the y-intercept of theregression line of DOC versus TEP-C represents theminimum DOC concentration required to sustain TEPproduction (i.e., TEP are only formed when the criticalDOC concentration of ,60 mmol L21 is reached). Theabove relationships were used to determine the relativefraction of each pool of organic matter along the gradient.The pools of TEP-C and of POC represented, respectively,,1% and 4% of DOC at the open ocean station andincreased up to ,5% and 10% in the head of the bays. The
Fig. 3. Variations of TEP volume concentration and of TEPspectral slopes, d, along the sampling gradient. Each valuecorresponds to the average (6SD) of four measurements takenfor each group of stations.
Fig. 4. Variations of TEP-carbon, POC, and DOC concentrations along the samplinggradient. Each value corresponds to the average (6SD) of four measurements taken for eachgroup of stations.
DOM reactivity and eutrophication 813

contribution of TEP to POC was low at the mostoligotrophic stations (18%) and reached a plateau in thelagoon and in the bays at about 60%.
Organic matter reactivity—The TEP-C : DOC ratio, usedto estimate the fraction of reactive DOC entering intocoagulation mechanisms and fuelling the TEP pool, wasplotted against the LeFT to estimate DOC reactivity asa function of the residence time of the water mass. Thevariations of the TEP-C : DOC ratio as a function of theLeFT was best described by a hyperbolic relation (Fig. 5).The TEP-C : DOC ratio increased when the LeFT increased(i.e., the formation of TEP-C from DOC becomes lessefficient as residence time increases). The reactivity ofDOM can be evaluated by calculating the derivative of theratio TEP-C : DOC versus LeFT, which gives the relativeproduction rate of TEP-C from DOC per day (Fig. 5). Thisexercise shows that DOM reactivity decreases rapidly as theresidence time of the water mass increases, to reach itsminimum in the head of the semienclosed bay of GrandeRade. The variations of the TEP-Cspectro : TEP-Cmicro ratiosupport this view (Fig. 6). The observed decrease of theTEP-Cspectro : TEP-Cmicro ratio as a function of theresidence time of the water mass indicates that TEPstainability is reduced when the LeFT increases; sucha diminution being most likely because of the long-termdegradation of organic material. TEP turnover rates werecalculated as a function of the LeFT from (1) theconcentrations of TEP-C and of DOC extrapolated fromTEP-C and DOC versus LeFT regression lines and (2) fromthe relative production rates of TEP-C from DOC per day.The estimated TEP turnover rate drops from 0.3 to 0.0 d21
when the residence time of the water mass increases (i.e.,
when the LeFT increases from 0 to 50 d), and suchturnover rates require a minimum primary production ofd i s so l ve d o rg a n ic c ar b o n (D P P ) o f 0 .2 0 to0.02 mmol L21 d21 (Fig. 7). The theoretical minimumDPP required to sustain the calculated TEP turnover ratewas estimated from (1) TEP-C and DOC versus LeFT
Fig. 5. DOC reactivity as estimated by the TEP-C : DOC ratio (solid line) and TEPproduction rate (dashed line, estimated as the derivative of the hyperbolic fitting of TEP-C : DOCratio vs. LeFT) as a function of LeFT. The hyperbolic regression line (solid line) was fitted tothe data.
Fig. 6. Relationship between TEP-C concentrations estimat-ed from the colorimetric and the microscopic methods asa function of LeFT.
814 Mari et al.

regression lines and the (2) calculated TEP turnover rates.Over the range of primary production of DOC and POCmeasured in the lagoon for water mass with different LeFT,the fraction of DPP going into TEP production decreasedfrom 42.4 6 16.5% (LeFT , 10 d) to 3.4 6 4.9% (LeFT .10 d), which represented a diminution from 9.1 6 1.8% to0.5 6 0.4% of the total PP (Fig. 8).
Discussion
Characteristics of the sampling gradient—The twotransects were characterized by a well-established nutrientgradient, as already reported by Jacquet et al. (2006). Theconcentration gradients of nitrogen and phosphorus reflectthe dominance of nutrient inputs from an urban origin inSainte Marie Bay and the dominance of nutrient inputsfrom an industrial origin in Grande Rade Bay. Thetemporal variability of nutrient concentrations along thetransects is believed to be controlled by sources external tothe lagoon (atmospheric input, surrounding oceanic waters,land drainage). Insofar as oceanic waters exhibit lownutrient concentrations, the land-based input is much morelikely to affect nutrient concentration levels, as revealed bythe gradient of silicates from the head of the bays to thebarrier. The similarities observed between lagoonal (exceptmiddle and head of the bays) and oceanic waters could bedue to substantial water exchange through the passes.However, water exchange between oceanic and lagoonalwaters greatly depends on the hydrodynamic circulation,which is controlled by topographic constraints, windcondition, and tidal cycle. In semienclosed bays, such asthe bay of Grande Rade, water exchange with lagoonal
water and, to a larger extent with oceanic water, is a veryslow process. Therefore, the land-based input of nutrientsin such bays might mostly fuel a local production and canbe recycled several times before being exported to moreoligotrophic waters.
DOC production variability—Previous studies havedemonstrated that the percentage of extracellular release(PER) ranges from 5% to 30% of total carbon fixed (Bainesand Pace 1991; Biddanda and Benner 1997; Maranon et al.2005). We observed an average PER of 27 6 14%(minimum 10%, maximum 43%), and no specific trendwas observed along the sampling gradient similar to therecent results of Moran et al. (2004). In contrast, thepercentage of DOC production ending in TEP ranged from3% to 40% in nutrient-rich and oligotrophic waters,respectively. This suggests that although the relative rateof production of DOC does not vary in a consistent mannerwith nutrient concentrations, the fate of that DOC doesdepend on the nutrient conditions. Why this might be isundoubtedly related to the physicochemical properties ofthe DOM precursor material for TEP.
One caveat needs to be kept in mind in the interpretationof these data. The primary production measurements werenot made contemporaneously with the other measure-ments; however, it is improbable that there existed a largedifference in trophic status between the two samplingperiods that differed only by a few weeks (Jacquet et al.2006).
Effects of the residence time on DOC reactivity—In thisstudy, we used the efficiency of the DOC/TEP trans-formation as an index of the physicochemical reactivity ofDOM. Our results strongly suggest that reactivity is
Fig. 7. TEP turnover rate (solid line) and minimum dissolvedprimary production (DPP; dashed line) required to sustain theestimated TEP turnover rates as a function of LeFT andcompared with measured DPP (open circles). DPP are integratedvalues on the water column.
Fig. 8. Estimated fraction of dissolved and total primaryproduction fated to TEP production as a function of LeFT.
DOM reactivity and eutrophication 815

lowered when DOC ages because of prolonged retention(i.e., at long residence times). The peculiar hydrodynamiccirculation inside the lagoon and especially in semienclosedbays allows the accumulation and aging of DOM, as well asthe subsequent loss of physicochemical reactivity caused bybacterial degradation processes. Such a feedback system inwhich organic matter is continuously degraded could leadto the formation of refractory DOM with low physico-chemical reactivity. The observed discrepancy betweenestimates of TEP-C obtained from the microscopic andspectrophotometric methods shows that TEP retain lessAlcian blue in the bays than in water masses characterizedby low LeFT, supporting the hypothesis that the observeddecrease of organic matter reactivity is caused by prolongedbacterial degradation. Such a reduction in TEP stainabilitybecause of increasing porosity leads to an overestimation ofthe TEP-C concentration by the microscopic method, thelatter only relying on the apparent structure of the particlesand not on their carbon content. This mechanism ofincreasing porosity of TEP has already been described atthe end of Phaeocystis blooms (Mari et al. 2005), duringwhich high bacterial degradation and low TEP productionoccur. Although a reduction of DOC reactivity is not likelyto occur in the surface layer of open ocean sites becauseDOC turnover is high (Hopkinson and Vallino 2005), itcould well occur on a vertical scale as DOC ages during itstransport to the deep ocean.
One of the alternative reasons for the presence of DOMwith different reactivities in the bay heads could be becauseof the proximity of potential terrestrial and riverineinfluences. However, the effects of terrestrial and riverineinputs on the two bays studied are probably minimal.Indeed, riverine influences are extremely weak relative tothe oceanic influences in this environment, as is easily seenin the lack of a significant salinity gradient even at the bayheads. Nevertheless, a small degree of terrestrial or riverineinfluence of DOM characteristics cannot be completelyruled out because we did observe an increase in long-wavelength absorption of CDOM in the samples (data notshown). This can be interpreted as evidence of a terrestrialcomponent in the DOM pool. However, as pointed out byRochelle-Newall et al. (2004), increases in long-waveabsorption of CDOM cannot always be interpreted asbeing indicative of the presence of terrestrial DOM becausediagenetically altered DOM can also exhibit the samesignature. Therefore, given the low riverine and terrestrialinfluences on these two sites, it is improbable that a largeproportion of the DOM present is of terrestrial origin.Thus, the DOM present in the bays is probably derivedfrom another source.
Other mechanisms could potentially lead to a reductionof the transfer efficiency from DOM to POM. The chemicalcomposition of exopolymers released by phytoplankton(Aluwihare and Repeta 1999) or bacterioplankton (Stoder-egger and Herndl 1998) varies as a function of species andphysiological status. Because the chemical composition ofexopolymers determines their physicochemical properties,one might expect a modification of DOM reactivitydepending on its source. Therefore, variations in bacterio-and phytoplankton community composition along the
gradients (Jacquet et al. 2006) could also play a role inthe observed variations of DOM reactivity. Finally,because metals bind to exopolymers, these elements mightaffect their surface charge distribution and their confor-mation, which in turn, would most likely alter their stickingproperties and their tendency to coagulate. Therefore, thetransfer efficiency of DOM to POM in the bays aroundNoumea might also be modified because of the high metalconcentrations resulting from industrial pollution.
Potential consequences for vertical flux of POM—It hasbeen shown that TEP density ranged from 0.70 to0.84 g cm23 and, thus, was lower than that of seawateror that of more conventional particles (Azetsu-Scott andPassow 2004). As a result, the relative proportions of TEP,solid particles (i.e., non-TEP particles) and interstitial waterwithin an aggregate, as well as their respective densities,govern its vertical transport velocity and direction (upwardor downward; Azetsu-Scott and Passow 2004). Assume fora moment that the relative proportions of TEP and solidparticles within aggregates relate to their relative propor-tions in seawater. Because the contribution of TEP to thebulk POC decreased from 60% to ,20%, from the head ofthe bays to the open ocean, the contribution of TEP withinorganic aggregates might also decrease in the sameproportions along the studied transects. Therefore, onecould hypothesize that an aggregate from the head of thestudied bays we studied should be composed of 60% TEP-C and 40% non–TEP-C, whereas it should be composed of,20% TEP-C in the vicinity of the coral barrier. Assumingthat the non-TEP fraction of the POC is mainly composedof protist plankton, the volume occupied by non-TEPparticles can be estimated from the non–TEP-C as [C] 50.760V0.819, where [C] (pg C) is the carbon concentration ofthe non-TEP fraction of POC and V (mm3) is the volumeoccupied (Menden-Deuer and Lessard 2000). According tothe above assumptions, the non-TEP fraction wouldoccupy from 1.7 to 3.4 ppm compared with 0.1 to6.6 ppm for the TEP fraction, respectively, from the openocean to the head of the bays. This means that aggregatesoccurring in the head of the bays could consist of ,65%TEP and 35% non-TEP in terms of volume, whereas TEPvolume content inside aggregates occurring in the vicinityof the coral barrier could drop down to 3%. Over the rangeof measured densities for solid matter of large aggregates(i.e., from 1.095 to 1.497 g cm23; Azetsu-Scott andJohnson 1992) and assuming that aggregates contain nointerstitial water, aggregates occurring inside the bayswould encompass a range from neutrally to positivelybuoyant, and they would become negatively buoyant in thevicinity of the coral barrier (Fig. 9). A consequence wouldbe a rapid sinking of aggregates and an efficient downwardexport of organic matter near the coral reef. On thecontrary, the downward export of organic matter inside thebays could simply come to a stop, and even reverse (i.e.,upward flux of matter), thereby prolonging the residencetime of organic matter in the water column. These twoopposing pathways probably play an important role inregulating the export versus recycling balance in areasstructured by strong hydrodynamic constraints.
816 Mari et al.

Implication for DOM cycling in the coastal zone—Thedecreasing reactivity of DOM during aging of the watermasses could corroborate the observed accumulation ofDOM in the coastal zone. DOC accumulation has beenreported in various areas in the coastal zone (e.g., Zweifel etal. 1995), and it has been shown that the fraction of DOCthat accumulated was mainly composed of polysaccharides(e.g., Biersmith and Benner 1998). Various explanationshave been proposed to account for the observed accumu-lation in the coastal zone, such as a malfunctioningmicrobial loop caused by nutrient limitation (Thingstad etal. 1997). The present data give a new insight into this issueand might help complete the puzzle, because the accumu-lation of DOM caused by positively buoyant TEP inpoorly renewed water masses might also lead to the buildupof a large C-rich (and N- and P-poor) pool of organicmatter. Interestingly, the occurrence of giant mucusparticles in the northern Adriatic Sea (Herndl 1992) might
be the result of very low renewal rate of the water masses(Grilli et al. 2005). Hence, the excess DOM producedwould somehow be trapped in areas in which the residencetime of the water masses is high, promoting degradation ofthe labile fraction and a loss of reactivity. Thus, theaccumulation of DOM in the coastal zone would beconstrained by both the biological activity and hydrody-namics. This scheme is contradictory to the presentparadigm that DOM occurring in the coastal zone is highlylabile and reactive because it is produced locally from DPPfuelled by terrestrial nutrient inputs. As a result, in coastalecosystems characterized by low renewal rates of water, thepathway for DOM would be unbalanced from export tolocal remineralization.
The results of this work highlight the relevance ofknowing the chemical composition of DOM along resi-dence time gradients to determine whether specific biomo-lecules in DOM vary accordingly along the same pattern asdescribed along depth gradients. Depth profile studies havedemonstrated that total hydrolysable neutral sugars, aminoacids, and amino sugars decrease from the surface to deepwaters, from .200 to ,50 nmol L21, from .200 to,160 nmol L21, and from .40 to ,10 nmol L21, re-spectively (Benner 2002). Shifts in the relative proportion ofbiomolecules can be used as an indicator of the degree ofalteration of DOM (Dauwe et al. 1999). Clearly, data onthe concentrations and distributions of biomolecules alongresidence time gradients are needed to further investigatethe link between the renewal rate of water masses and thetransfer efficiency from DOM to POM. The study of themechanisms leading to a diminution of the bioreactivity ofDOM along horizontal gradients of residence time mighthelp us understand the mechanisms by which refractoryDOM is formed with increasing depth.
References
ALLDREDGE, A. L., U. PASSOW, AND B. E. LOGAN. 1993. Theabundance and significance of a class of large, transparentorganic particles in the ocean. Deep-Sea Res. I 40: 1131–1140.
ALUWIHARE, L. I., AND D. J. REPETA. 1999. A comparison of thechemical characteristics of oceanic DOM and extracellularDOM produced by marine algae. Mar. Ecol. Prog. Ser. 186:105–117.
AMON, R. M. W., AND R. BENNER. 1994. Rapid cycling of high–molecular-weight dissolved organic matter in the ocean.Nature 369: 549–552.
———, H.-P. FITZNAR, AND R. BENNER. 2001. Linkages amongthe bioreactivity, chemical composition, and diagenetic stateof marine dissolved organic matter. Limnol. Oceanogr. 46:287–297.
AZETSU-SCOTT, K., AND B. D. JOHNSON. 1992. Measuring physicalcharacteristics of particles: A new method of simultaneousmeasurement for size, settling velocity and density ofconstituent matter. Deep-Sea Res. 39: 1057–1066.
———, AND U. PASSOW. 2004. Ascending marine particles:Significance of transparent exopolymer particles (TEP) inthe upper ocean. Limnol. Oceanogr. 49: 741–748.
BAINES, S. B., AND M. L. PACE. 1991. The production of dissolvedorganic matter by phytoplankton and its importance tobacteria: Patterns across marine and freshwater systems.Limnol. Oceanogr. 36: 1078–1090.
Fig. 9. Model depicting the density of aggregates as a func-tion of the TEP and solid particle volume fractions in aggregatesand of the solid particle density (rs) (from Azetsu-Scott andPassow 2004). The two density lines indicate the relationshipsbetween the volume fractions of TEP and of solid particles forneutrally buoyant aggregates, as calculated for the upper (rs 51.497 g cm23; dashed line) and lower (rs 5 1.095 g cm23; dottedline) limits of measured solid particle densities inside largeaggregates. The solid line describes aggregates for which there isno interstitial water (i.e., aggregates only composed of TEP andsolid particles). The estimated densities of aggregates occurring atthe different sampling stations are represented. Aggregates witha density occurring in the domain constrained above a specificdensity line for solid matter will be positively buoyant, whereasbelow this line, aggregates will be negatively buoyant. Aggregatesoccurring in the bays of Grande Rade and Sainte Marie should befrom neutrally to positively buoyant, assuming a density for thesolid matter of rs 5 1.095 g cm23. Inversely, aggregates occurringfrom the middle of the lagoon to the open ocean should sink. Thevalue for station M10 is the same as for station M41.
DOM reactivity and eutrophication 817
BENNER, R. 2002. Chemical composition and reactivity, p. 59–90.In D. A. Hansell and G. A. Carlson [eds.], Biochemistry ofmarine dissolved organic matter. Academic Press.
———, J. D. PAKULSKY, M. MCCARTHY, J. I. HEDGES, AND P. G.HATCHER. 1992. Bulk chemical characteristics of dissolvedorganic matter in the ocean. Science 255: 1561–1564.
BIDDANDA, B., AND R. BENNER. 1997. Carbon, nitrogen, andcarbohydrate fluxes during the production of particulate anddissolved organic matter by marine phytoplankton. Limnol.Oceanogr. 42: 506–518.
BIERSMITH, A., AND R. BENNER. 1998. Carbohydrates in phyto-plankton and freshly-produced dissolved organic matter.Mar. Chem. 63: 131–144.
CARLSON, C. A., M. L. BRANN, T. H. MAGUE, AND L. MAYER.1985. Molecular weight distribution of dissolved organicmatter in seawater determined by ultrafiltration: A reexami-nation. Mar. Chem. 16: 155–171.
CHIN, W., M. W. ORELLANA, AND P. VERDUGO. 1998. Spontaneousassembly of marine dissolved organic matter into polymergels. Nature 391: 568–570.
DAUWE, B., J. J. MIDDELBURG, P. M. J. HERMAN, AND C. H. R.HEIP. 1999. Linking diagenetic alteration of amino acids andbulk organic matter reactivity. Limnol. Oceanogr. 44:1809–1814.
ENGEL, A., AND U. PASSOW. 2001. Carbon and nitrogen content oftransparent exopolymer particles (TEP) in relation to theirAlcian blue adsorption. Mar. Ecol. Prog. Ser. 219: 1–10.
———, S. THOMS, U. RIEBESELL, E. ROCHELLE-NEWALL, AND I.ZONDERVAN. 2004. Polysaccharide aggregation as a potentialsink of marine dissolved organic carbon. Nature 428:929–932.
GRASSHOFF, K., M. EHERHARDT, AND K. KREMLING. 1983.Methods of seawaters analysis, 2nd ed. Verlag Chemie.
GRILLI, F., E. PASCHINI, R. PRECALI, A. RUSSO, AND N. SUPIC.2005. Circulation and horizontal fluxes in the northernAdriatic Sea in the period June 1999–July 2002. Part I:Geostrophic circulation and current measurement. Sci. TotalEnviron. 353: 57–67.
HERNDL, G. J. 1992. Marine snow in the northern Adriatic Sea:Possible causes and consequences for a shallow ecosystem.Mar. Microb, Food Webs 6: 149–172.
HOPKINSON, C. S. JR., AND J. J. VALLINO. 2005. Efficient export ofcarbon to the deep ocean through dissolved organic matter.Nature 433: 142–145.
JACQUET, S., B. DELESALLE, J.-P. TORRETON, AND J. BLANCHOT.2006. Responses of the phytoplankton communities toincreased anthropogenic influences (Southwestern Lagoon,New Caledonia). Mar. Ecol. Prog. Ser. 320: 65–78.
JOUON, A., P. DOUILLET, S. OUILLON, AND P. FRAUNIE. 2006.Calculations of hydrodynamic time parameters in a semi-opened coastal zone using a 3D hydrodynamic model. Cont.Shelf Res. 26: 1395–1415.
KLOAREG, B., AND R. S. QUATRANO. 1988. Structure of cell walls ofmarine algae and ecophysiological functions of the matrixpolysaccharides. Oceanogr. Mar. Biol. Annu. Rev. 26:259–315.
MARANON, E., P. CERMENO, E. FERNANDEZ, J. RODRIGUEZ, AND L.ZABALA. 2004. Significance and mechanisms of photosyntheticproduction of dissolved organic carbon in a coastal eutrophicecosystem. Limnol. Oceanogr. 49: 1652–1666.
———, ———, AND V. PEREZ. 2005. Continuity in the photo-synthetic production of dissolved organic carbon fromeutrophic to oligotrophic waters. Mar. Ecol. Prog. Ser. 299:7–17.
MARI, X. 1999. Carbon content and C : N ratio of transparentexopolymeric particles (TEP) produced by bubbling exudatesof diatoms. Mar. Ecol. Prog. Ser. 183: 59–71.
———, S. BEAUVAIS, R. LEMEE, AND M. L. PEDROTTI. 2001. Non-Redfield C : N ratio of transparent exopolymeric particles inthe northwestern Mediterranean Sea. Limnol. Oceanogr. 46:1831–1836.
———, AND A. BURD. 1998. Seasonal size spectra of transparentexopolymeric particles (TEP) in a coastal sea and comparisonwith those predicted using coagulation theory. Mar. Ecol.Prog. Ser. 163: 63–76.
———, AND T. KIØRBOE. 1996. Abundance, size distribution andbacterial colonization of transparent exopolymeric particles(TEP) during spring in the Kattegat. J. Plankton Res. 18:969–986.
———, F. RASSOULZADEGAN, C. P. D. BRUSSAARD, AND P.WASSMANN. 2005. Dynamics of transparent exopolymericparticles (TEP) production by Phaeocystis globosa under N-or P-limitation: A controlling factor of the retention/exportbalance. Harmful Algae 4: 895–914.
MENDEN-DEUER, S., AND E. J. LESSARD. 2000. Carbon to volumerelationships for dinoflagellates, diatoms, and other protistplankton. Limnol. Oceanogr. 45: 569–579.
MOESENEDER, M. M., C. WINTER, AND G. J. HERNDL. 2001.Horizontal and vertical complexity of attached and free-livingbacteria of the eastern Mediterranean Sea, determined by 16SrDNA and 16S rRNA fingerprints. Limnol. Oceanogr. 46:95–107.
MORAN, X. A. G., E. FERNANDEZ, AND V. PEREZ. 2004. Size-fractionated primary production, bacterial production andnet community production in subtropical and tropicaldomains of the oligotrophic NE Atlantic in autumn. Mar.Ecol. Prog. Ser. 274: 17–29.
MULLER-NIKLAS, G., S. SCHUSTER, E. KALTENBOCK, AND G. J.HERNDL. 1994. Organic content and bacterial metabolism inamorphous aggregations of the northern Adriatic Sea.Limnol. Oceanogr. 39: 58–68.
MULLIN, J. B., AND J. P. RILEY. 1955. The spectrophotometricdetermination of silicate-silicon in natural waters with specialreference to sea water. Anal. Chim. Acta 12: 162–170.
OGAWA, H., Y. AMAGAI, I. KOIKE, K. KAISER, AND R. BENNER.2001. Production of refractory dissolved organic matter bybacteria. Science 292: 917–920.
PASSOW, U. 2000. Formation of transparent exopolymer particles,TEP, from dissolved precursor material. Mar. Ecol. Prog. Ser.192: 1–11.
———, AND A. L. ALLDREDGE. 1994. Distribution, size andbacterial colonization of transparent exopolymer particles(TEP) in the ocean. Mar. Ecol. Prog. Ser. 113: 185–198.
———, AND ———. 1995. A dye-binding assay for thespectrophotometric measurement of transparent exopoly-meric particles (TEP). Limnol. Oceanogr. 40: 1326–1335.
RAIMBAULT, P., F. DIAZ, W. POUVESLE, AND B. BOUDJELLAL. 1999.Simultaneous determination of particulate organic carbon,nitrogen and phosphorus collected on filters, using a semi-automatic wet-oxidation method. Mar. Ecol. Prog. Ser. 180:289–295.
———, G. SLAWYK, B. COSTE, AND J. C. FRY. 1990. Feasibility ofmeasuring an automated colorimetric procedure for thedetermination of seawater nitrate in the 0 to 100 nM range:Examples from field and culture. Mar. Biol. 104: 347–351.
ROCHELLE-NEWALL, E., AND oTHERS. 2004. Chromophoric dis-solved organic matter in experimental mesocosms maintainedunder different pCO2 levels. Mar. Ecol. Prog. Ser. 272: 25–31.
818 Mari et al.

SMITH, D. C., M. SIMON, A. L. ALLDREDGE, AND F. AZAM. 1992.Intense hydrolytic enzyme activity on marine aggregates andimplications for rapid particle dissolution. Nature 359:139–141.
STODEREGGER, K., AND G. J. HERNDL. 1998. Production andrelease of bacterial capsular material and its subsequentutilization by marine bacterioplankton. Limnol. Oceanogr.43: 877–884.
THINGSTAD, T. F., A. HAGSTROM, AND F. RASSOULZADEGAN. 1997.Accumulation of degradable DOC in surface waters: Is itcaused by a malfunctioning microbial loop? Limnol. Ocea-nogr. 42: 398–404.
ZHOU, J., K. MOPPER, AND U. PASSOW. 1998. The role of surface-active carbohydrates in the formation of transparent exopo-lymer particles by bubble adsorption of seawater. Limnol.Oceanogr. 43: 1860–1871.
ZWEIFEL, U. L., J. WIKNER, A. HAGSTROM, E. LUNDBERG, AND B.NORRMAN. 1995. Dynamics of dissolved organic carbon ina coastal ecosystem. Limnol. Oceanogr. 40: 299–305.
Received: 6 February 2006Amended: 26 October 2006Accepted: 27 October 2006
DOM reactivity and eutrophication 819