marci l. ryvicker, cpa, cfa harrisburg, pa april 2011 please see page 82 for rating definitions,...
Post on 20-Dec-2015
214 views
TRANSCRIPT
Marci L. Ryvicker, CPA, CFA
Harrisburg, PA
April 2011
Please see page 82 for rating definitions, important disclosures and required analyst certifications.
Wells Fargo Securities, LLC does and seeks to do business with companies covered in its research reports. As a result, investors should be aware that the firm may have a conflict of interest that could affect the objectivity of the report and investors should consider this report as only a single factor in making their investment decision.
Cable: A Look At Trends & OpportunitiesCable: A Look At Trends & OpportunitiesPast, Present and FuturePast, Present and Future
22
AGENDAAGENDA
Source: Company websites, and Wells Fargo Securities, LLCSource: Company websites, and Wells Fargo Securities, LLC
I.I. SUBSCRIBER TRENDS SUBSCRIBER TRENDS
II.II. ARPU TRENDSARPU TRENDS
III.III. 2010 THEMES2010 THEMES
IV.IV. OPPORTUNITIES FOR GROWTHOPPORTUNITIES FOR GROWTH
V.V. INVESTOR FOCUSINVESTOR FOCUS
VI.VI. WHAT ABOUT…..?WHAT ABOUT…..?
VII.VII. YOUR QUESTIONSYOUR QUESTIONS
33
SUBSCRIBER TRENDSSUBSCRIBER TRENDS
Source: Company websites, and Wells Fargo Securities, LLCSource: Company websites, and Wells Fargo Securities, LLC
BASIC VIDEOBASIC VIDEO
HIGH SPEED DATAHIGH SPEED DATA
TELEPHONY TELEPHONY

BASIC VIDEOBASIC VIDEO
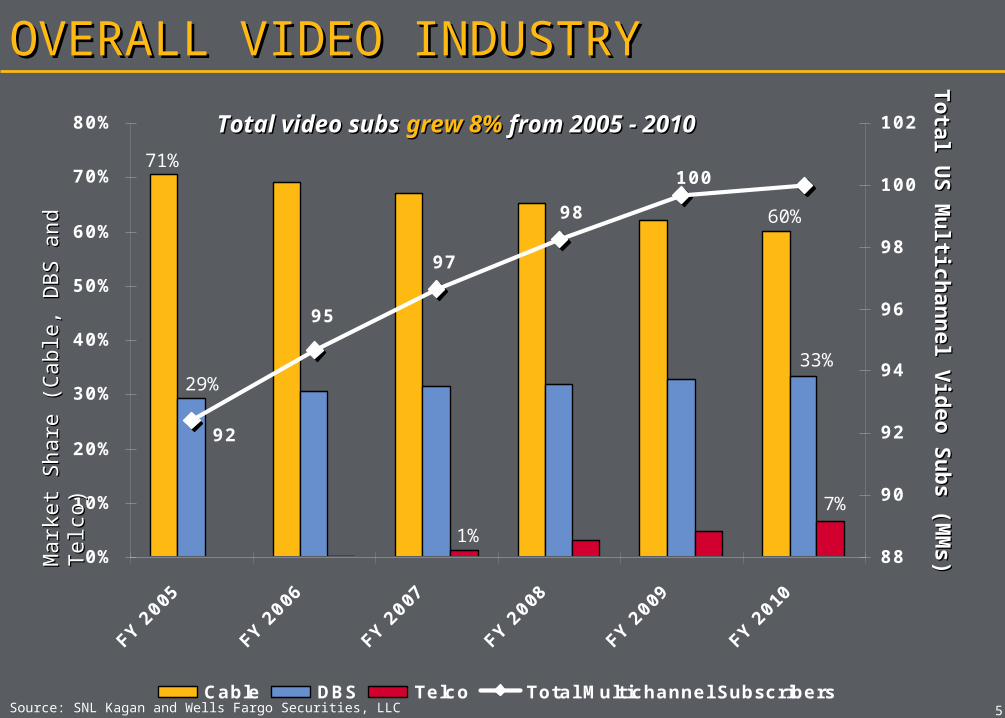
100
92
95
98
97
0%
10%
20%
30%
40%
50%
60%
70%
80%
FY 2
005
FY 2
006
FY 2
007
FY 2
008
FY 2
009
FY 2
010
88
90
92
94
96
98
100
102
Cable DBS Telco Total Multichannel Subscribers55
OVERALL VIDEO INDUSTRYOVERALL VIDEO INDUSTRY
Source: SNL Kagan and Wells Fargo Securities, LLC
Mark
et
Share
(C
able
, D
BS a
nd T
elc
o)
Mark
et
Share
(C
able
, D
BS a
nd T
elc
o)
Tota
l US
Mu
ltich
an
nel V
ideo S
ub
s (M
Ms)
Tota
l US
Mu
ltich
an
nel V
ideo S
ub
s (M
Ms)
Total video subs Total video subs grew 8%grew 8% from 2005 - from 2005 - 2010201071%
29%
1%
7%
33%
60%
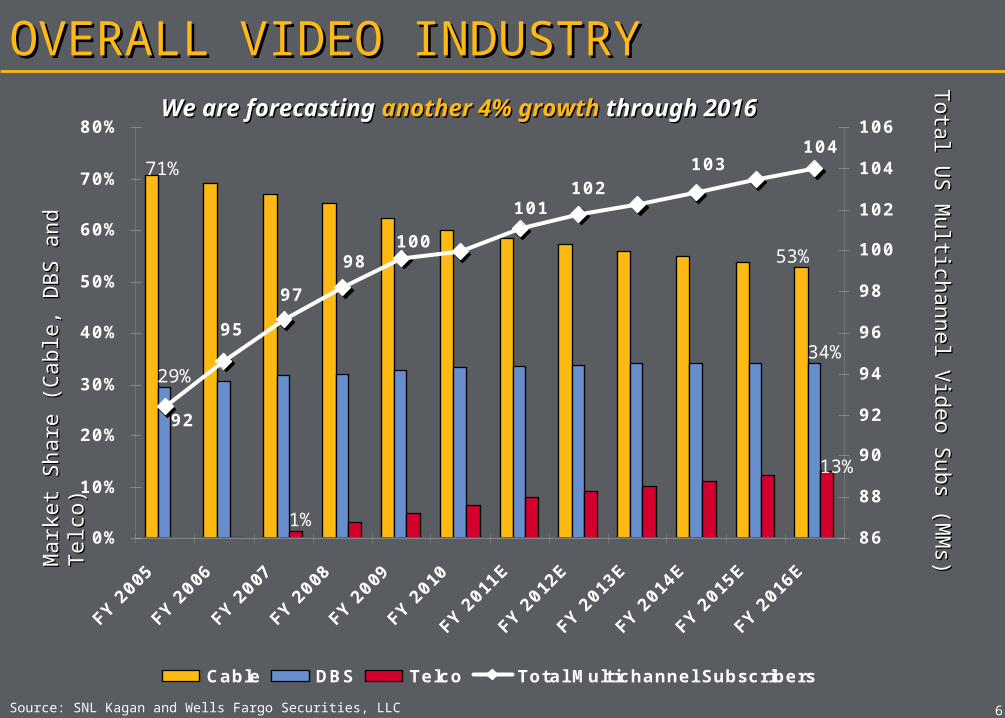
104103
102101
100
92
95
98
97
0%
10%
20%
30%
40%
50%
60%
70%
80%
FY 2
005
FY 2
006
FY 2
007
FY 2
008
FY 2
009
FY 2
010
FY 2
011E
FY 2
012E
FY 2
013E
FY 2
014E
FY 2
015E
FY 2
016E
86
88
90
92
94
96
98
100
102
104
106
Cable DBS Telco Total Multichannel Subscribers
66
OVERALL VIDEO INDUSTRYOVERALL VIDEO INDUSTRY
Source: SNL Kagan and Wells Fargo Securities, LLC
Mark
et
Share
(C
able
, D
BS a
nd T
elc
o)
Mark
et
Share
(C
able
, D
BS a
nd T
elc
o)
Tota
l US M
ultich
annel V
ideo S
ubs (M
Ms)
Tota
l US M
ultich
annel V
ideo S
ubs (M
Ms)
We are forecasting We are forecasting another 4% growthanother 4% growth through through 20162016
71%
29%
1%
53%
34%
13%
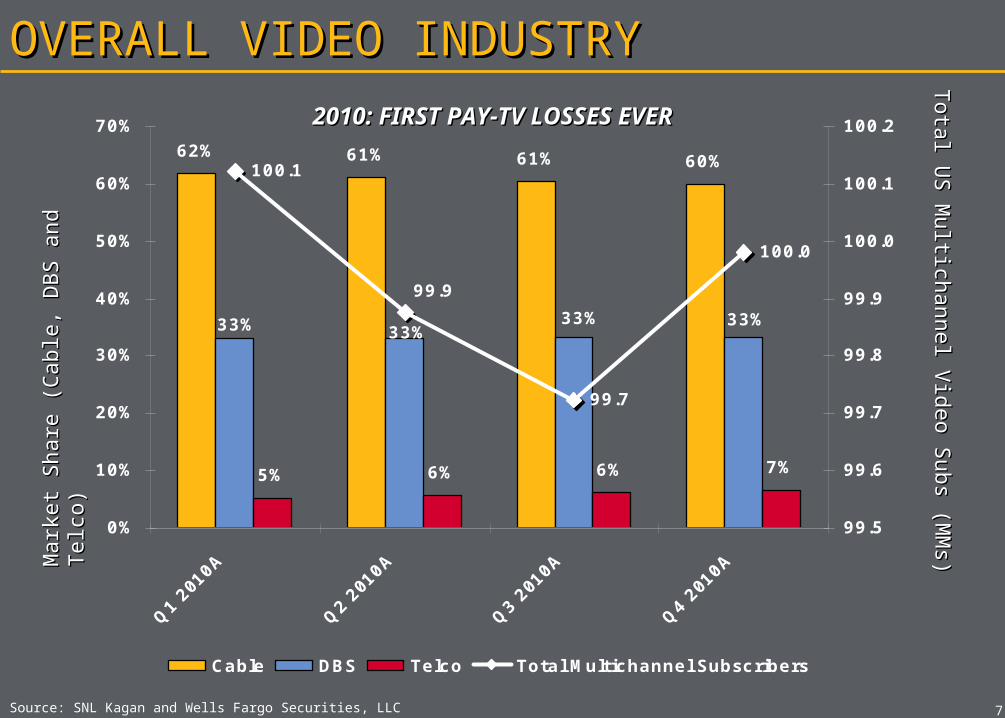
62% 61% 61% 60%
5% 6% 6% 7%
33%33%33% 33%
100.1
99.7
100.0
99.9
0%
10%
20%
30%
40%
50%
60%
70%
Q1
2010
A
Q2
2010
A
Q3
2010
A
Q4
2010
A
99.5
99.6
99.7
99.8
99.9
100.0
100.1
100.2
Cable DBS Telco Total Multichannel Subscribers
77
OVERALL VIDEO INDUSTRYOVERALL VIDEO INDUSTRY
Source: SNL Kagan and Wells Fargo Securities, LLC
Mark
et
Share
(C
able
, D
BS a
nd T
elc
o)
Mark
et
Share
(C
able
, D
BS a
nd T
elc
o)
Tota
l US M
ultich
annel V
ideo S
ubs (M
Ms)
Tota
l US M
ultich
annel V
ideo S
ubs (M
Ms)
2010: FIRST PAY-TV LOSSES EVER2010: FIRST PAY-TV LOSSES EVER

Company Basic Subs Y/Y Change Net Adds Y/Y Change Market Share
1 Comcast 22,802 (3.2%) (757) (21.5%) 23%
2 Time Warner Cable 12,422 (3.4%) (437) (108.1%) 12%
3 Cox 4,868 (3.7%) (185) 32.2% 5%
4 Charter 4,520 (6.3%) (304) (43.2%) 5%
5 Cablevision 3,314 (1.6%) (53) (5.0%) 3%
6 Brighthouse 2,187 (3.4%) (76) (73.4%) 2%
7 Suddenlink 1,193 (3.7%) (15) 49.8% 1%
8 Mediacom 1,193 (3.6%) (45) 43.8% 1%
9 Insight 692 (3.4%) (25) (383.9%) 1%
10 CableOne 647 (3.3%) (22) (4,300.0%) 1%
88
TOP CABLE VIDEO PROVIDERSTOP CABLE VIDEO PROVIDERS
Source: SNL Kagan and Wells Fargo Securities, LLC
2010 Top Cable Provider Snapshot2010 Top Cable Provider Snapshot
Note: Figures in thousands, except percentage data

Company Basic Subs Y/Y Change Net Adds Y/Y Change Market Share
1 DirecTV 19,223 3.6% 663 (29.4%) 19%
2 DISH Network 14,133 0.2% 33 (92.2%) 14%
3 Verizon FiOS 3,472 21.4% 611 (35.2%) 3%
4 AT&T U-Verse 2,985 44.6% 921 (9.6%) 3%
99
TOP DBS/TELCO VIDEO PROVIDERSTOP DBS/TELCO VIDEO PROVIDERS
Source: SNL Kagan and Wells Fargo Securities, LLC
2010 Top DBS/Telco Provider Snapshot2010 Top DBS/Telco Provider Snapshot
Note: Figures in thousands, except percentage data

HIGH SPEED DATAHIGH SPEED DATA
80
76
71
65
56
45
0%
10%
20%
30%
40%
50%
60%
70%
FY 2
005
FY 2
006
FY 2
007
FY 2
008
FY 2
009
FY 2
010
40
45
50
55
60
65
70
75
80
85
Cable DSL Fiber Total Broadband Subscribers
1111
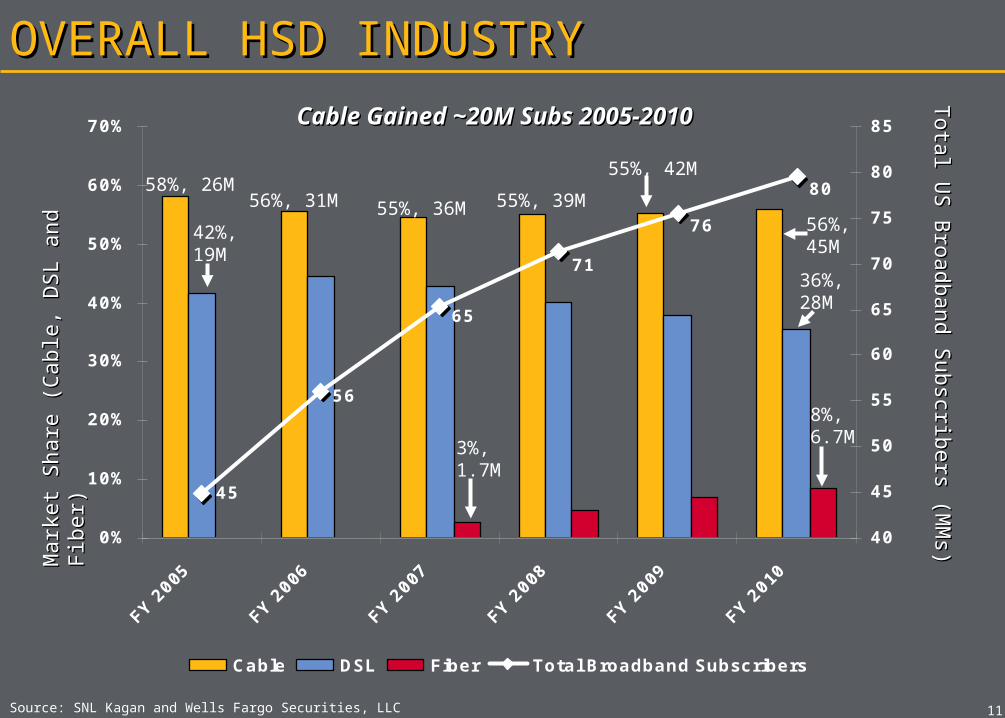
OVERALL HSD INDUSTRYOVERALL HSD INDUSTRY
Source: SNL Kagan and Wells Fargo Securities, LLC
Mark
et
Share
(C
able
, D
SL
and F
iber)
Mark
et
Share
(C
able
, D
SL
and F
iber)
Tota
l US B
roadband S
ubscrib
ers (M
Ms)
Tota
l US B
roadband S
ubscrib
ers (M
Ms)
58%, 26M56%, 31M 55%, 36M 55%, 39M
55%, 42M
56%, 45M
8%, 6.7M
42%, 19M
3%, 1.7M
36%, 28M
Cable Gained ~20M Subs 2005-2010Cable Gained ~20M Subs 2005-2010
101
9895
9288
8480
76
71
65
56
45
0%
10%
20%
30%
40%
50%
60%
70%
FY 2
005
FY 2
006
FY 2
007
FY 2
008
FY 2
009
FY 2
010
FY 2
011E
FY 2
012E
FY 2
013E
FY 2
014E
FY 2
015E
FY 2
016E
40
50
60
70
80
90
100
110
Cable DSL Fiber Total Broadband Subscribers
1212
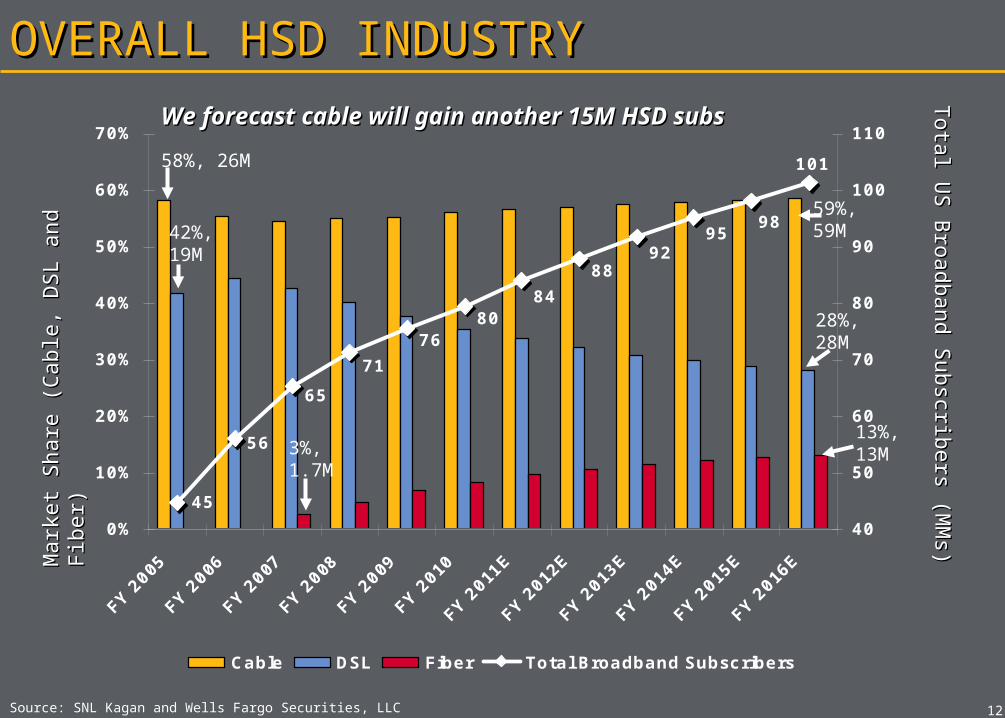
OVERALL HSD INDUSTRYOVERALL HSD INDUSTRY
Source: SNL Kagan and Wells Fargo Securities, LLC
Mark
et
Share
(C
able
, D
SL
and F
iber)
Mark
et
Share
(C
able
, D
SL
and F
iber)
Tota
l US B
roadband S
ubscrib
ers (M
Ms)
Tota
l US B
roadband S
ubscrib
ers (M
Ms)
59%, 59M
28%, 28M
13%, 13M
58%, 26M
42%, 19M
3%, 1.7M
We forecast cable will gain another 15M HSD subsWe forecast cable will gain another 15M HSD subs

56% 56% 56% 56%
37% 36% 36%
7% 8% 8% 8%
36%
79.5
78.4
77.4
76.8
0%
10%
20%
30%
40%
50%
60%
Q1
2010
A
Q2
2010
A
Q3
2010
A
Q4
2010
A
75.0
75.5
76.0
76.5
77.0
77.5
78.0
78.5
79.0
79.5
80.0
Cable DSL Fiber Total Broadband Subscribers
1313
OVERALL HSD INDUSTRYOVERALL HSD INDUSTRY
Source: SNL Kagan and Wells Fargo Securities, LLC
Mark
et
Share
(C
able
, D
SL
and F
iber)
Mark
et
Share
(C
able
, D
SL
and F
iber)
Tota
l US B
roadband S
ubscrib
ers (M
Ms)
Tota
l US B
roadband S
ubscrib
ers (M
Ms)
, 43M
, 29M
, 6M
, 28M
, 45M
, 7M
Cable gained 3 M HSD subs in Cable gained 3 M HSD subs in 20102010
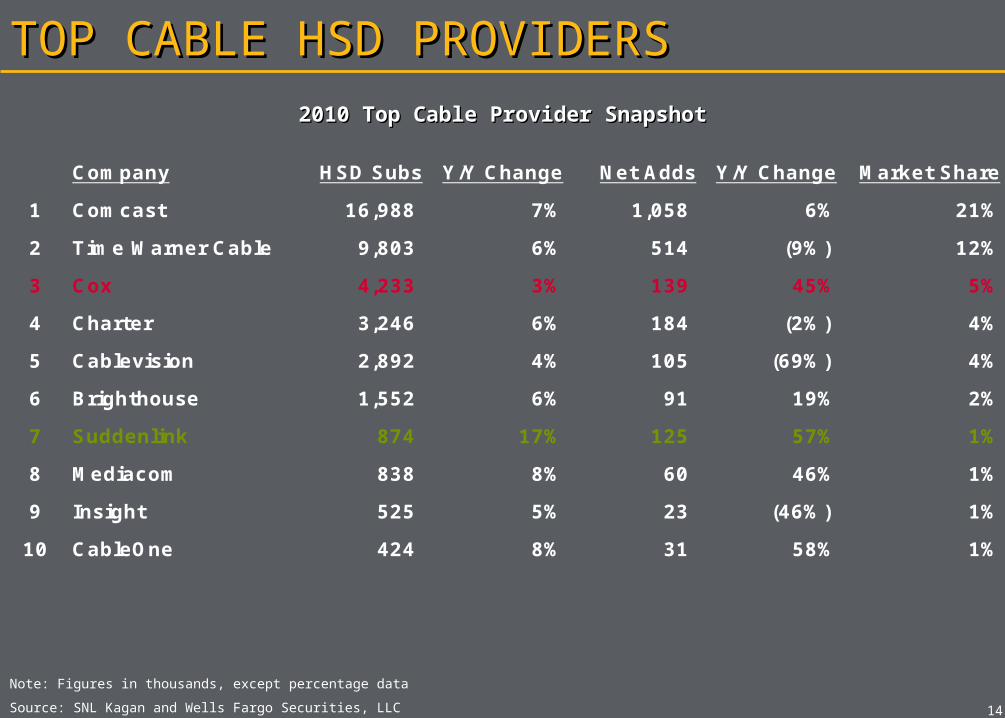
Company HSD Subs Y/Y Change Net Adds Y/Y Change Market Share
1 Comcast 16,988 7% 1,058 6% 21%
2 Time Warner Cable 9,803 6% 514 (9%) 12%
3 Cox 4,233 3% 139 45% 5%
4 Charter 3,246 6% 184 (2%) 4%
5 Cablevision 2,892 4% 105 (69%) 4%
6 Brighthouse 1,552 6% 91 19% 2%
7 Suddenlink 874 17% 125 57% 1%
8 Mediacom 838 8% 60 46% 1%
9 Insight 525 5% 23 (46%) 1%
10 CableOne 424 8% 31 58% 1%
1414
TOP CABLE HSD PROVIDERSTOP CABLE HSD PROVIDERS
Source: SNL Kagan and Wells Fargo Securities, LLC
2010 Top Cable Provider Snapshot2010 Top Cable Provider Snapshot
Note: Figures in thousands, except percentage data

Company HSD Subs Y/Y Change Net Adds Y/Y Change Market Share
1 AT&T 16,310 3% 521 (27%) 21%
AT&T U-Verse 2,612 45% 806 (10%) 3%
AT&T DSL 13,698 (2%) (285) (59%) 17%
2 Verizon 8,392 2% (828) (251%) 11%
Verizon FiOS 4,082 19% 649 (32%) 5%
Verizon DSL 4,310 (8%) (477) (18%) 5%
3 Qwest 2,914 (2%) (60) (147%) 4%
4 CenturyTel 2,394 7% 158 (14%) 3%
5 Frontier 1,697 (4%) 61 9% 2%
6 Windstream 1,303 15% 171 11% 2%
1515
TOP TELCO HSD PROVIDERSTOP TELCO HSD PROVIDERS
Source: SNL Kagan and Wells Fargo Securities, LLC
2010 Top Telco Provider Snapshot2010 Top Telco Provider Snapshot
Note: Figures in thousands, except percentage data

TELEPHONYTELEPHONY
76
79
8182
83
86
0%
10%
20%
30%
40%
50%
60%
70%
FY 2005 FY 2006 FY 2007 FY 2008 FY 2009 FY 2010
70
72
74
76
78
80
82
84
86
88
Cable Telco Wireless Total Cable/Telco Phone Subs
1717
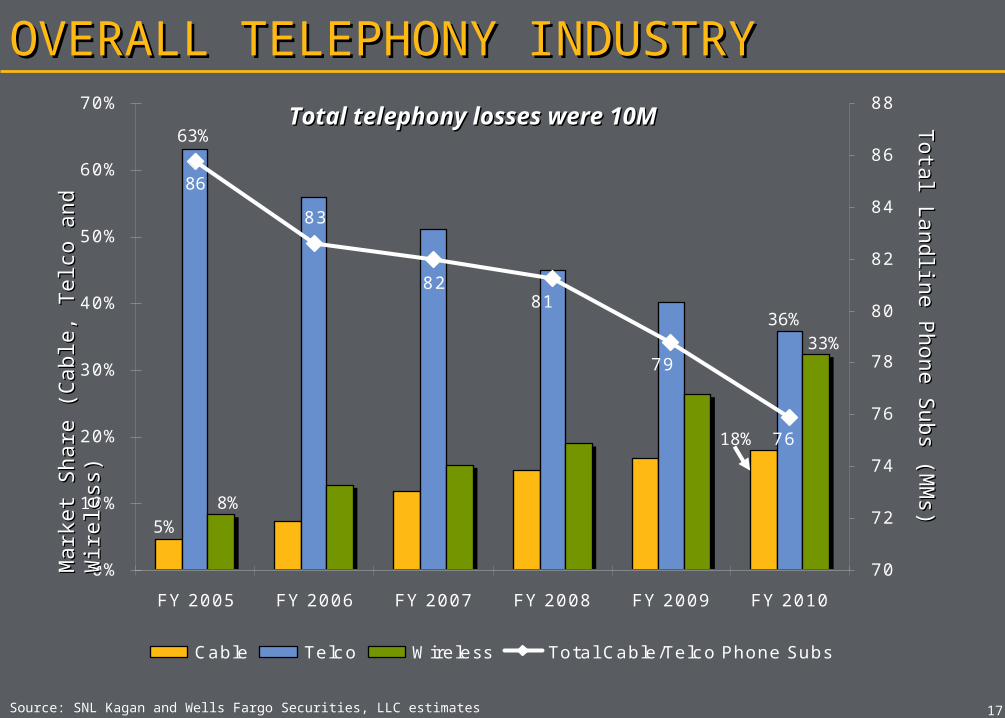
OVERALL TELEPHONY INDUSTRYOVERALL TELEPHONY INDUSTRY
Source: SNL Kagan and Wells Fargo Securities, LLC estimates
Mark
et
Share
(C
able
, Telc
o a
nd W
irele
ss)
Mark
et
Share
(C
able
, Telc
o a
nd W
irele
ss) T
ota
l Landlin
e P
hone S
ubs (M
Ms)
Tota
l Landlin
e P
hone S
ubs (M
Ms)
Total telephony losses were 10MTotal telephony losses were 10M
8%5%
18%
36%33%
63%
86
65666769717376
798182
8386
0%
10%
20%
30%
40%
50%
60%
70%
FY 2005
FY 2006
FY 2007
FY 2008
FY 2009
FY 2010
FY 2011
E
FY 2012
E
FY 2013
E
FY 2014
E
FY 2015
E
FY 2016
E
-
10
20
30
40
50
60
70
80
90
100
Cable Telco Wireless Total Cable/Telco Phone Subs
1818
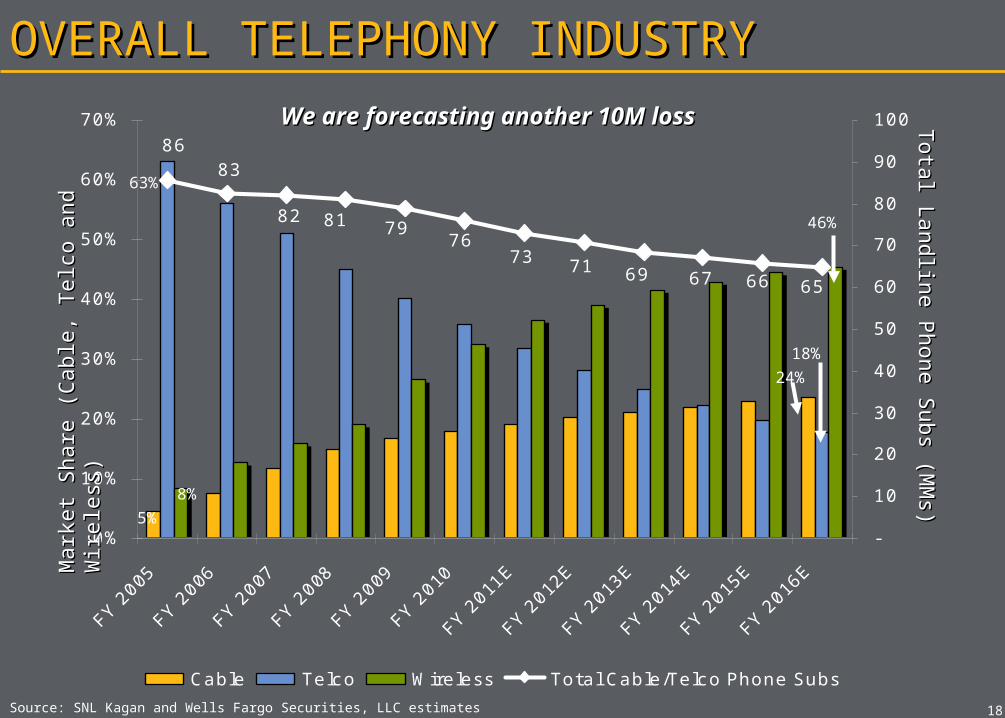
OVERALL TELEPHONY INDUSTRYOVERALL TELEPHONY INDUSTRY
Source: SNL Kagan and Wells Fargo Securities, LLC estimates
Mark
et
Share
(C
able
, Telc
o a
nd W
irele
ss)
Mark
et
Share
(C
able
, Telc
o a
nd W
irele
ss) T
ota
l Landlin
e P
hone S
ubs (M
Ms)
Tota
l Landlin
e P
hone S
ubs (M
Ms)
We are forecasting another 10M We are forecasting another 10M lossloss
5%
8%
63%
18%
24%
46%
75.9
78.1
76.3
77.4
0%
5%
10%
15%
20%
25%
30%
35%
40%
45%
Q1
2010
A
Q2
2010
A
Q3
2010
A
Q4
2010
A
74.5
75.0
75.5
76.0
76.5
77.0
77.5
78.0
78.5
Cable Telco Wireless Total Subs
1919
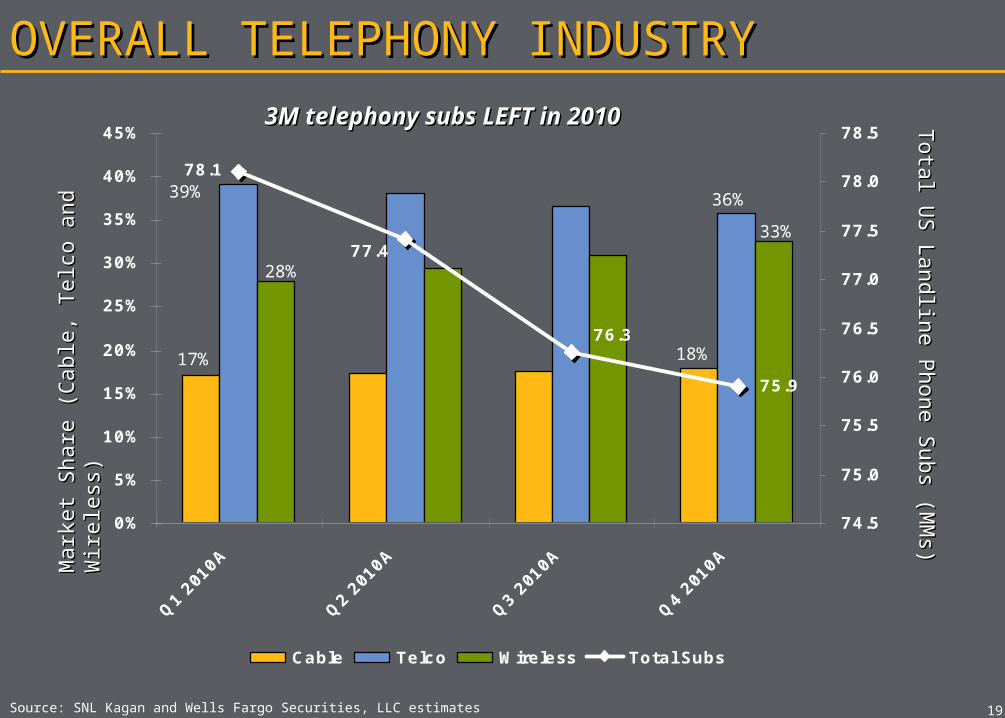
OVERALL TELEPHONY INDUSTRYOVERALL TELEPHONY INDUSTRY
Source: SNL Kagan and Wells Fargo Securities, LLC estimates
Tota
l US La
ndlin
e P
hone S
ubs (M
Ms)
Tota
l US La
ndlin
e P
hone S
ubs (M
Ms)
3M telephony subs LEFT in 20103M telephony subs LEFT in 2010
17%
28%
39%
33%
36%
18%
Mark
et
Share
(C
able
, Telc
o a
nd W
irele
ss)
Mark
et
Share
(C
able
, Telc
o a
nd W
irele
ss)
Company HSD Subs Y/Y Change Net Adds Y/Y Change Market Share
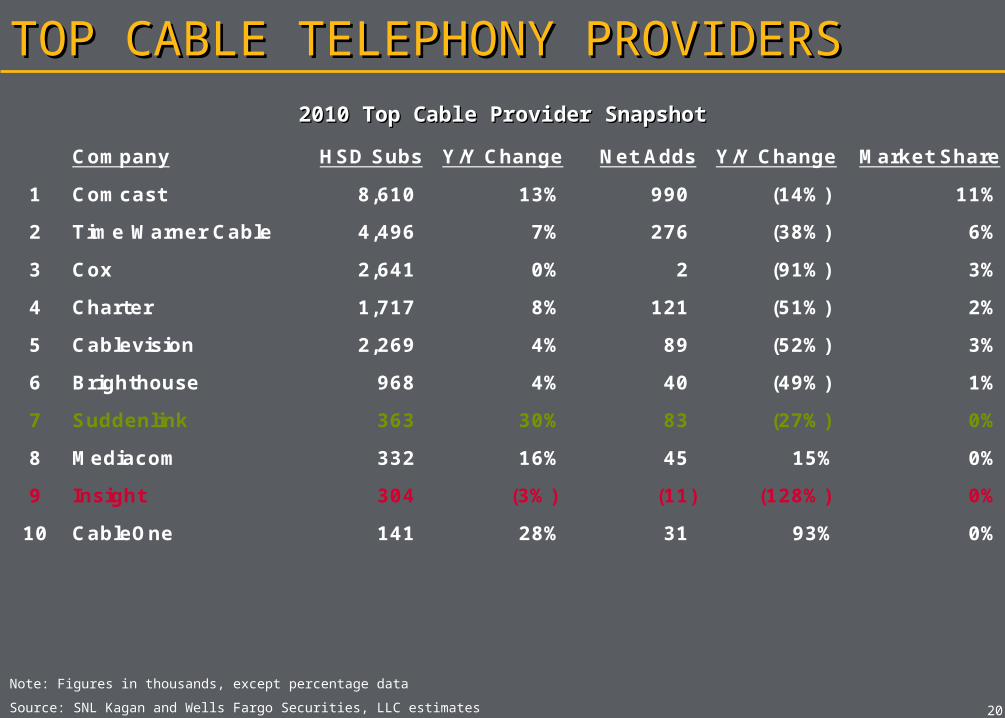
1 Comcast 8,610 13% 990 (14%) 11%
2 Time Warner Cable 4,496 7% 276 (38%) 6%
3 Cox 2,641 0% 2 (91%) 3%
4 Charter 1,717 8% 121 (51%) 2%
5 Cablevision 2,269 4% 89 (52%) 3%
6 Brighthouse 968 4% 40 (49%) 1%
7 Suddenlink 363 30% 83 (27%) 0%
8 Mediacom 332 16% 45 15% 0%
9 Insight 304 (3%) (11) (128%) 0%
10 CableOne 141 28% 31 93% 0%
2020
TOP CABLE TELEPHONY PROVIDERSTOP CABLE TELEPHONY PROVIDERS
Source: SNL Kagan and Wells Fargo Securities, LLC estimates
2010 Top Cable Provider Snapshot2010 Top Cable Provider Snapshot
Note: Figures in thousands, except percentage data
2121
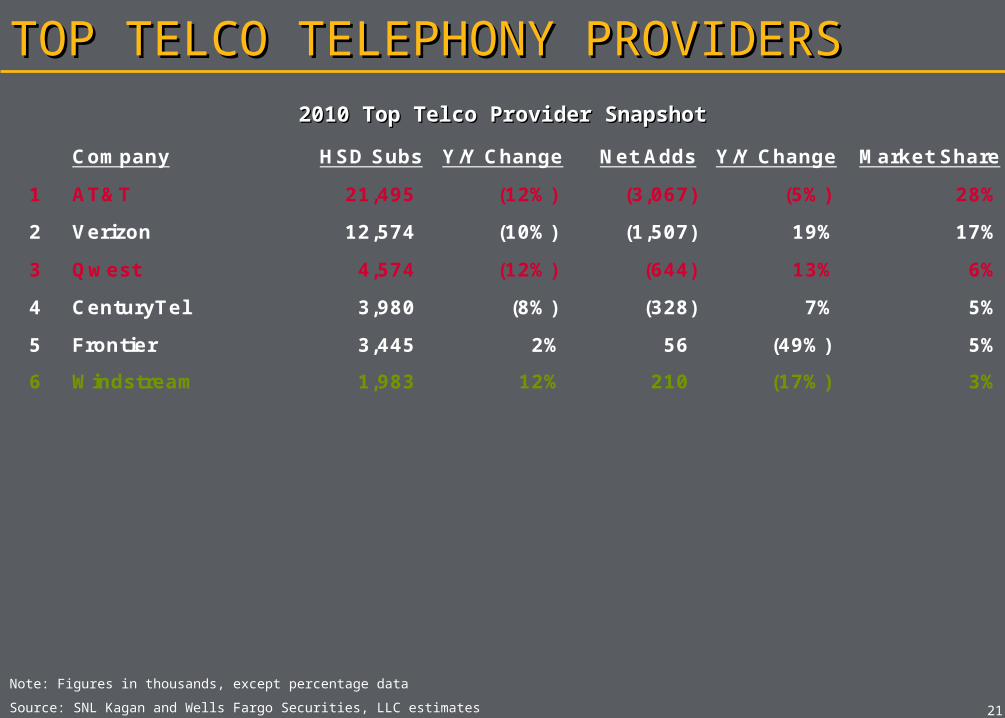
TOP TELCO TELEPHONY PROVIDERSTOP TELCO TELEPHONY PROVIDERS
Source: SNL Kagan and Wells Fargo Securities, LLC estimates
2010 Top Telco Provider Snapshot2010 Top Telco Provider Snapshot
Note: Figures in thousands, except percentage data
Company HSD Subs Y/Y Change Net Adds Y/Y Change Market Share
1 AT&T 21,495 (12%) (3,067) (5%) 28%
2 Verizon 12,574 (10%) (1,507) 19% 17%
3 Qwest 4,574 (12%) (644) 13% 6%
4 CenturyTel 3,980 (8%) (328) 7% 5%
5 Frontier 3,445 2% 56 (49%) 5%
6 Windstream 1,983 12% 210 (17%) 3%
2222
ARPU TRENDSARPU TRENDS
TOTAL ARPUTOTAL ARPU
BASIC VIDEOBASIC VIDEO
HIGH SPEED DATAHIGH SPEED DATA
TELEPHONY TELEPHONY

TOTAL ARPUTOTAL ARPU
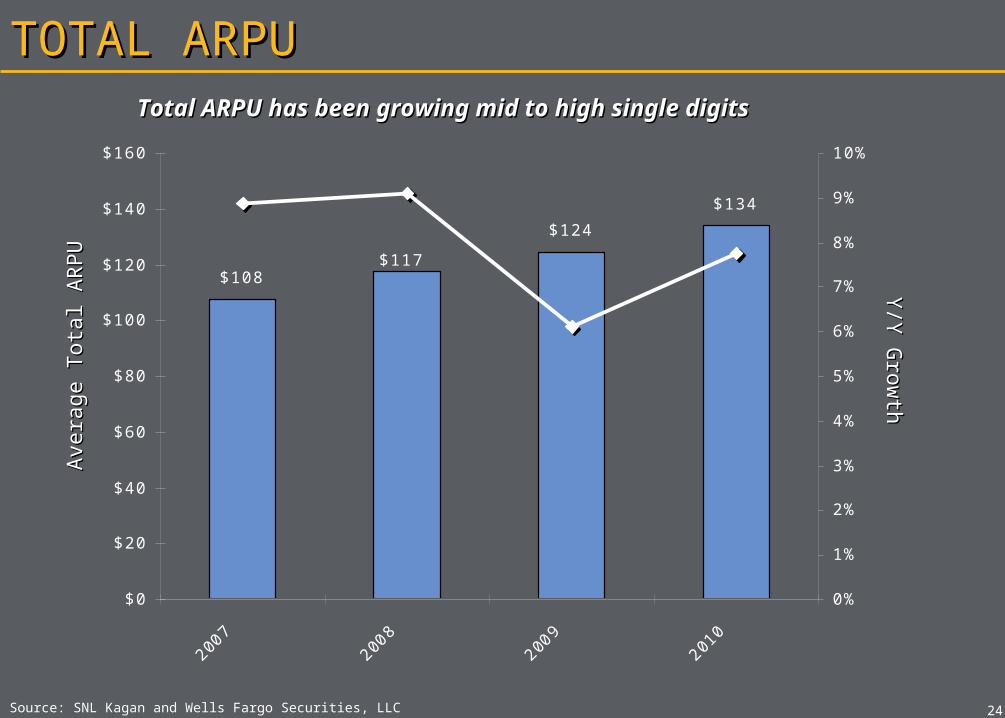
$108
$124
$134
$117
$0
$20
$40
$60
$80
$100
$120
$140
$160
2007
2008
2009
2010
0%
1%
2%
3%
4%
5%
6%
7%
8%
9%
10%
2424
TOTAL ARPUTOTAL ARPU
Source: SNL Kagan and Wells Fargo Securities, LLC
Avera
ge T
ota
l A
RPU
Avera
ge T
ota
l A
RPU
Y/Y
Gro
wth
Y/Y
Gro
wth
Total ARPU has been growing mid to high single Total ARPU has been growing mid to high single digitsdigits

$108
$124$134
$142$151
$160$170
$179$189
$117
$0
$20
$40
$60
$80
$100
$120
$140
$160
$180
$200
2007
2008
2009
2010
2011E
2012E
2013E
2014E
2015E
2016E
0%
1%
2%
3%
4%
5%
6%
7%
8%
9%
10%
2525
TOTAL ARPUTOTAL ARPU
Source: SNL Kagan and Wells Fargo Securities, LLC estimates
Avera
ge T
ota
l A
RPU
Avera
ge T
ota
l A
RPU
Y/Y
Gro
wth
Y/Y
Gro
wth
We expect growth to stabilize in the mid single digit We expect growth to stabilize in the mid single digit rangerange
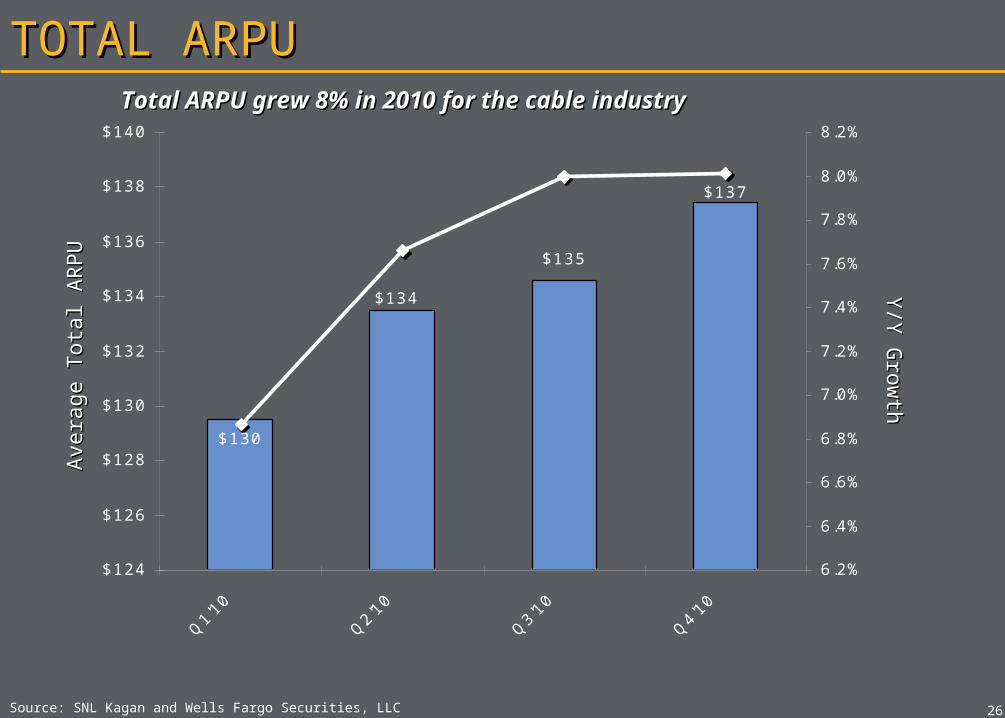
$135
$137
$130
$134
$124
$126
$128
$130
$132
$134
$136
$138
$140
Q1'1
0
Q2'1
0
Q3'1
0
Q4'1
0
6.2%
6.4%
6.6%
6.8%
7.0%
7.2%
7.4%
7.6%
7.8%
8.0%
8.2%
2626
TOTAL ARPUTOTAL ARPU
Source: SNL Kagan and Wells Fargo Securities, LLC
Avera
ge T
ota
l A
RPU
Avera
ge T
ota
l A
RPU
Y/Y
Gro
wth
Y/Y
Gro
wth
Total ARPU grew 8% in 2010 for the cable industryTotal ARPU grew 8% in 2010 for the cable industry

2007 2008 2009 2010 2011E 2012E 2013E 2014E 2015E 2016E CAGR
Cablevision $121 $133 $140 $150 $156 $164 $172 $180 $188 $196 5%
Comcast $102 $111 $118 $128 $137 $147 $155 $165 $174 $184 6%
Time Warner Cable $100 $108 $115 $124 $134 $143 $153 $164 $175 $187 7%
Charter $93 $105 $114 $125 N/A N/A N/A N/A N/A N/A N/A
Mediacom $91 $95 $99 N/A N/A N/A N/A N/A N/A N/A N/A
Average cable peers $101 $110 $117 $132 $142 $151 $160 $170 $179 $189 6%
Y /Y Change 9% 6% 12% 8% 6% 6% 6% 5% 6%
Dish Network $66 $69 $70 $74 $78 $79 $82 $84 $87 $89 3%
DirecTV $79 $84 $86 $89 $93 $97 $100 $103 $106 $109 3%
Average DBS peers $73 $77 $78 $82 $86 $88 $91 $93 $96 $99 3%
2727
TOTAL ARPUTOTAL ARPU
Source: SNL Kagan and Wells Fargo Securities, LLC estimates
Note: N/A – Not available; CAGR is a 6-year CAGR between 2011E and 2016E
2828
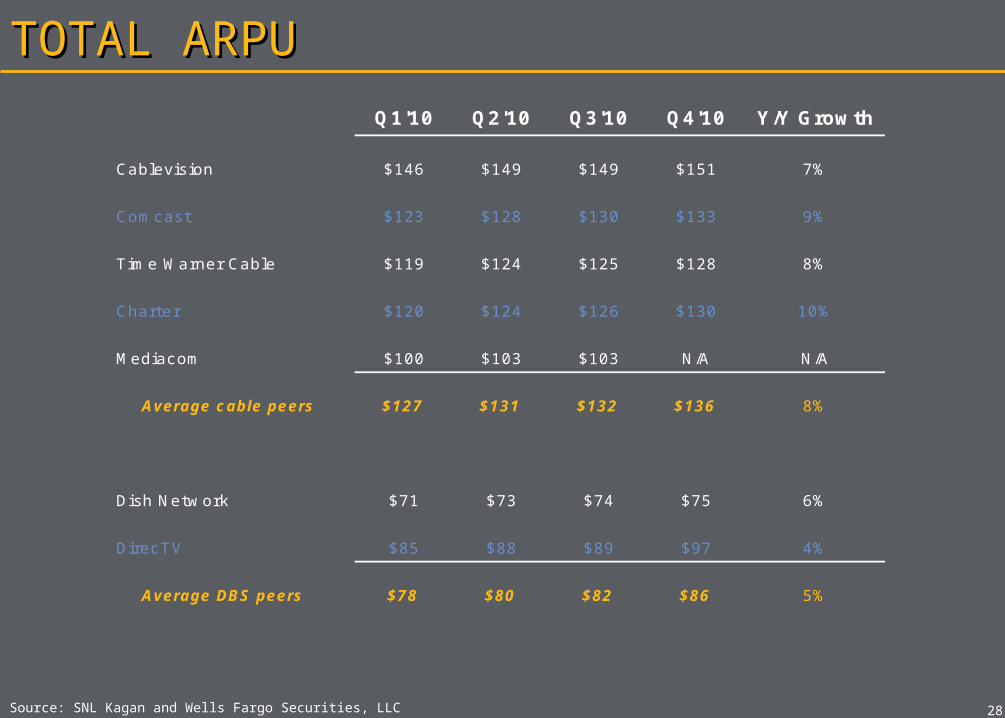
TOTAL ARPUTOTAL ARPU
Source: SNL Kagan and Wells Fargo Securities, LLC
Q1'10 Q2'10 Q3'10 Q4'10 Y/Y Growth
Cablevision $146 $149 $149 $151 7%
Comcast $123 $128 $130 $133 9%
Time Warner Cable $119 $124 $125 $128 8%
Charter $120 $124 $126 $130 10%
Mediacom $100 $103 $103 N/A N/A
Average cable peers $127 $131 $132 $136 8%
Y /Y Change 12% 13% 13% 13%
Dish Network $71 $73 $74 $75 6%
DirecTV $85 $88 $89 $97 4%
Average DBS peers $78 $80 $82 $86 5%

BASIC VIDEOBASIC VIDEO
$73$77 $78
$77$73$70
$66
$82
$0
$10
$20
$30
$40
$50
$60
$70
$80
$90
2007
2008
2009
2010
0%
1%
2%
3%
4%
5%
6%
7%
8%
Cable Avg Satellite Avg Cable Y /Y Change Satellite Y /Y Change
3030
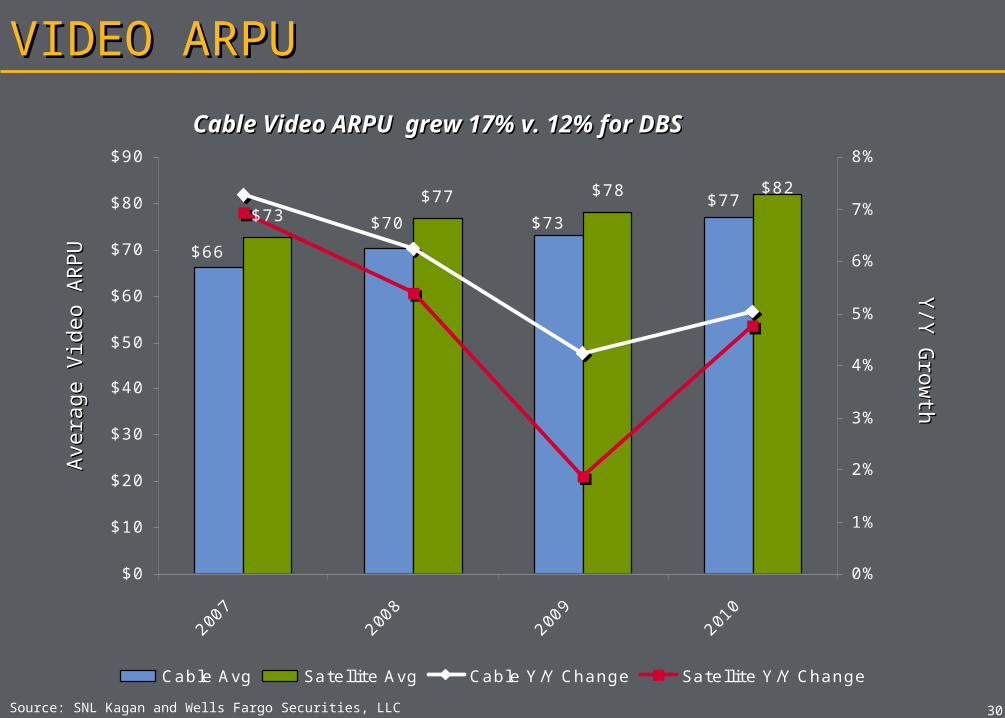
VIDEO ARPUVIDEO ARPU
Source: SNL Kagan and Wells Fargo Securities, LLC
Cable Video ARPU grew 17% v. 12% for Cable Video ARPU grew 17% v. 12% for DBSDBS
Avera
ge V
ideo A
RPU
Avera
ge V
ideo A
RPU
Y/Y
Gro
wth
Y/Y
Gro
wth
$73$77 $78
$86 $88 $91$93 $96
$99$98$94
$91$87
$84$80$77
$73$70
$66
$82
$0
$20
$40
$60
$80
$100
$120
2007
2008
2009
2010
2011E
2012E
2013E
2014E
2015E
2016E
0%
1%
2%
3%
4%
5%
6%
7%
8%
Cable Avg Satellite Avg Cable Y /Y Change Satellite Y /Y Change
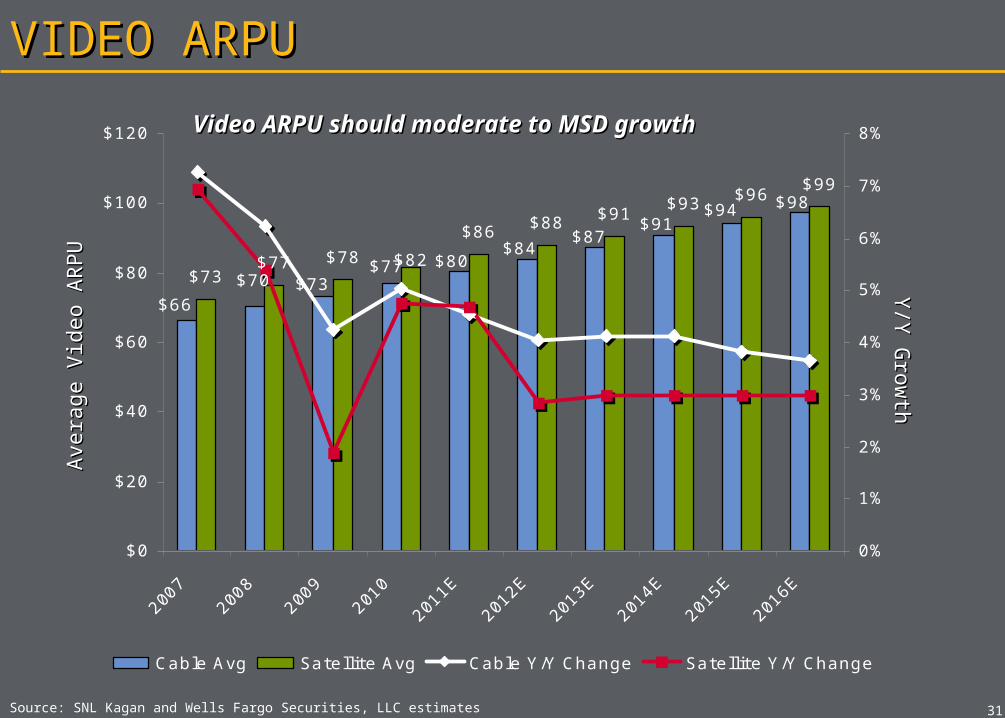
3131
VIDEO ARPUVIDEO ARPU
Source: SNL Kagan and Wells Fargo Securities, LLC estimates
Avera
ge V
ideo A
RPU
Avera
ge V
ideo A
RPU
Y/Y
Gro
wth
Y/Y
Gro
wth
Video ARPU should moderate to MSD Video ARPU should moderate to MSD growthgrowth

3232
VIDEO ARPUVIDEO ARPU
Source: SNL Kagan and Wells Fargo Securities, LLC
Cable Video ARPU grew 5% v. 4% for DBSCable Video ARPU grew 5% v. 4% for DBS
Avera
ge V
ideo A
RPU
Avera
ge V
ideo A
RPU
Y/Y
Gro
wth
Y/Y
Gro
wth
$78
$80
$82
$78$77$77
$76
$86
$70
$72
$74
$76
$78
$80
$82
$84
$86
$88
Q1'1
0
Q2'1
0
Q3'1
0
Q4'1
0
0%
1%
2%
3%
4%
5%
6%
Cable Avg Satellite Avg Cable Y /Y Change Satellite Y /Y Change
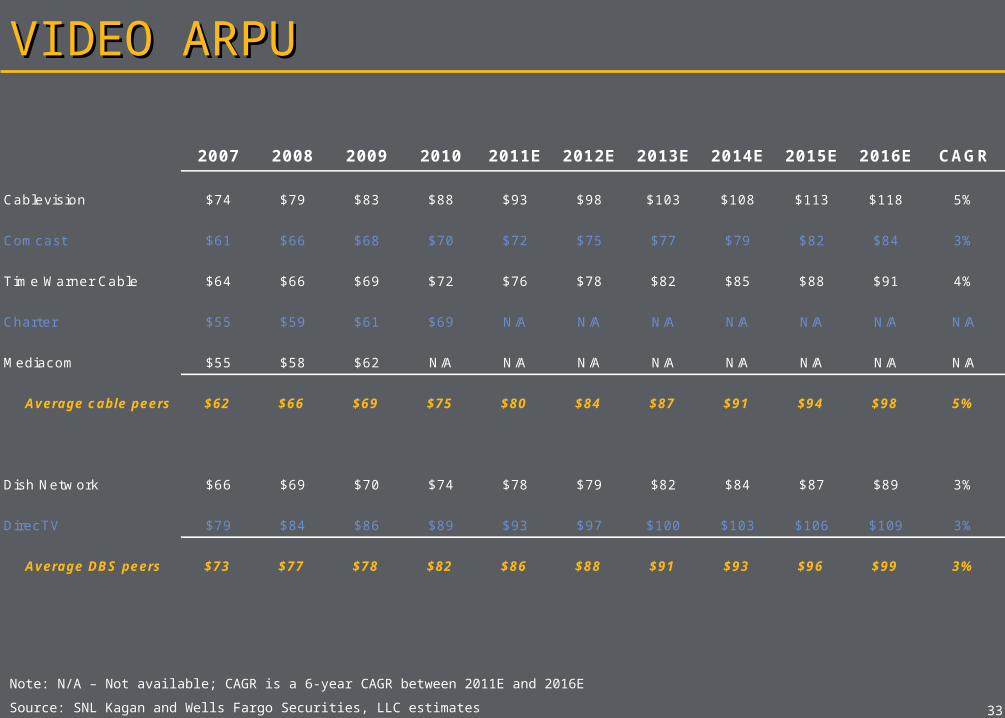
2007 2008 2009 2010 2011E 2012E 2013E 2014E 2015E 2016E CAGR
Cablevision $74 $79 $83 $88 $93 $98 $103 $108 $113 $118 5%
Comcast $61 $66 $68 $70 $72 $75 $77 $79 $82 $84 3%
Time Warner Cable $64 $66 $69 $72 $76 $78 $82 $85 $88 $91 4%
Charter $55 $59 $61 $69 N/A N/A N/A N/A N/A N/A N/A
Mediacom $55 $58 $62 N/A N/A N/A N/A N/A N/A N/A N/A
Average cable peers $62 $66 $69 $75 $80 $84 $87 $91 $94 $98 5%
Y /Y Change 6% 5% 9% 7% 4% 4% 4% 4% 4%
Dish Network $66 $69 $70 $74 $78 $79 $82 $84 $87 $89 3%
DirecTV $79 $84 $86 $89 $93 $97 $100 $103 $106 $109 3%
Average DBS peers $73 $77 $78 $82 $86 $88 $91 $93 $96 $99 3%
3333
VIDEO ARPUVIDEO ARPU
Source: SNL Kagan and Wells Fargo Securities, LLC estimates
Note: N/A – Not available; CAGR is a 6-year CAGR between 2011E and 2016E
3434
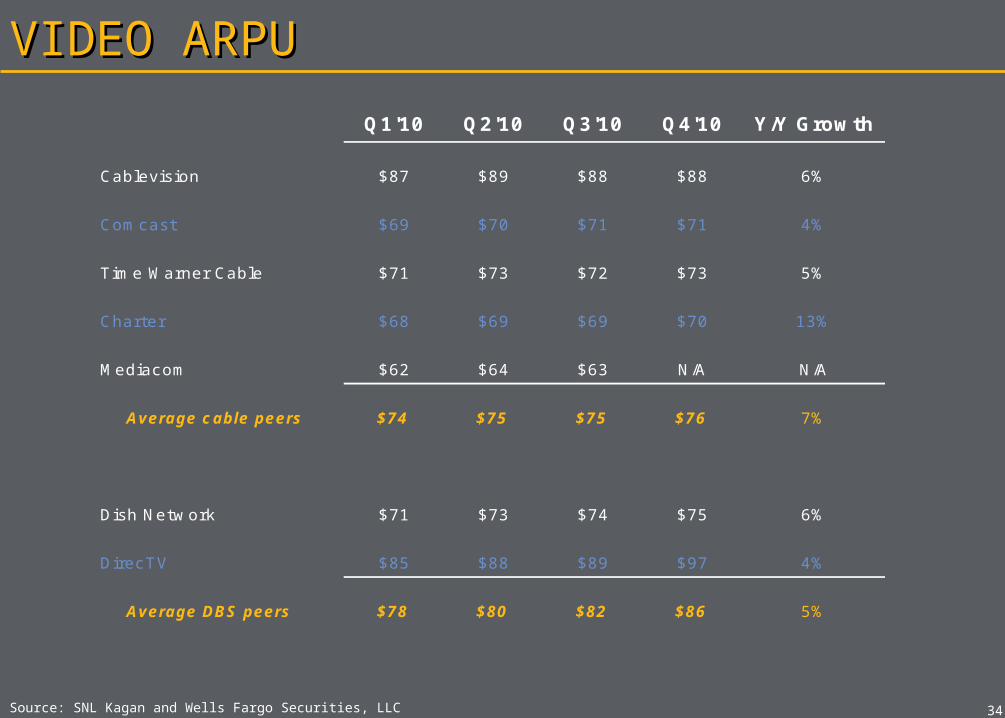
VIDEO ARPUVIDEO ARPU
Source: SNL Kagan and Wells Fargo Securities, LLC
Q1'10 Q2'10 Q3'10 Q4'10 Y/Y Growth
Cablevision $87 $89 $88 $88 6%
Comcast $69 $70 $71 $71 4%
Time Warner Cable $71 $73 $72 $73 5%
Charter $68 $69 $69 $70 13%
Mediacom $62 $64 $63 N/A N/A
Average cable peers $74 $75 $75 $76 7%
Y /Y Change 9% 10% 10% 9%
Dish Network $71 $73 $74 $75 6%
DirecTV $85 $88 $89 $97 4%
Average DBS peers $78 $80 $82 $86 5%

HIGH SPEED DATAHIGH SPEED DATA
$40.62
$41.51 $41.56
$40.66
$40.00
$40.20
$40.40
$40.60
$40.80
$41.00
$41.20
$41.40
$41.60
$41.80
2007
2008
2009
2010
(3%)
(2%)
(1%)
0%
1%
2%
3%
4%
5%
3636
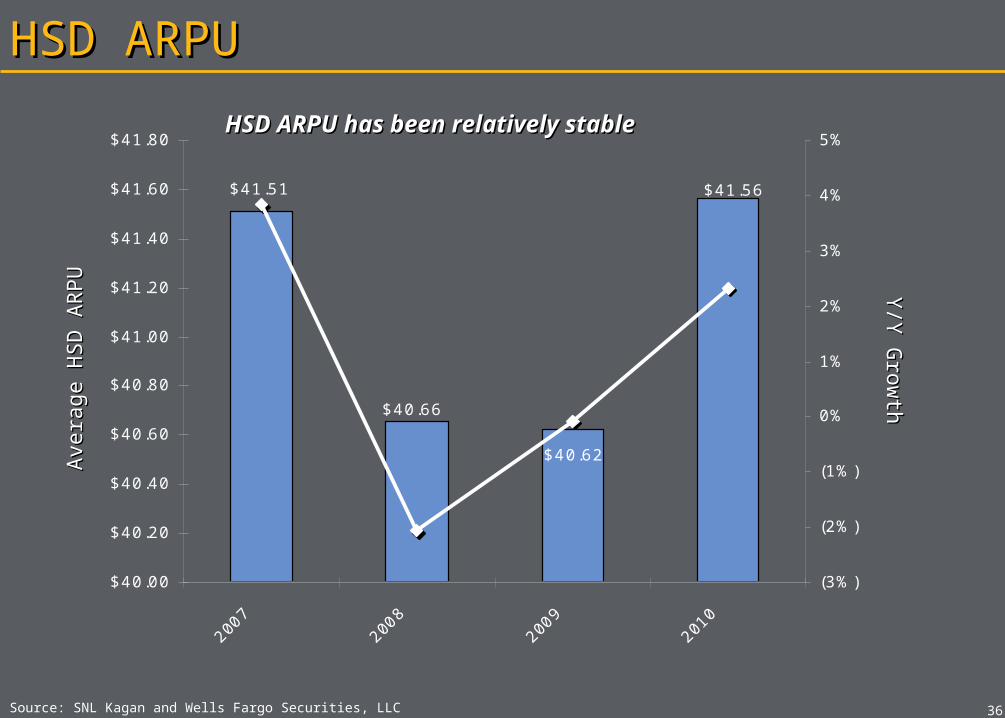
HSD ARPUHSD ARPU
Source: SNL Kagan and Wells Fargo Securities, LLC
Avera
ge H
SD
AR
PU
Avera
ge H
SD
AR
PU
Y/Y
Gro
wth
Y/Y
Gro
wth
HSD ARPU has been relatively stableHSD ARPU has been relatively stable

3737
HSD ARPUHSD ARPU
Source: SNL Kagan and Wells Fargo Securities, LLC estimates
Avera
ge H
SD
AR
PU
Avera
ge H
SD
AR
PU
Y/Y
Gro
wth
Y/Y
Gro
wth
$48.97
$40.62
$46.45
$43.94$41.51
$45.19
$41.56
$47.71
$42.63$40.66
$0.00
$10.00
$20.00
$30.00
$40.00
$50.00
$60.00
2007
2008
2009
2010
2011E
2012E
2013E
2014E
2015E
2016E
(3%)
(2%)
(1%)
0%
1%
2%
3%
4%
5%We are We are conservatively conservatively forecasting slight forecasting slight increasesincreases
$41.41$41.42
$41.24
$41.00
$40.70
$40.80
$40.90
$41.00
$41.10
$41.20
$41.30
$41.40
$41.50
Q1'1
0
Q2'1
0
Q3'1
0
Q4'1
0
0.0%
0.5%
1.0%
1.5%
2.0%
2.5%
3.0%
3838
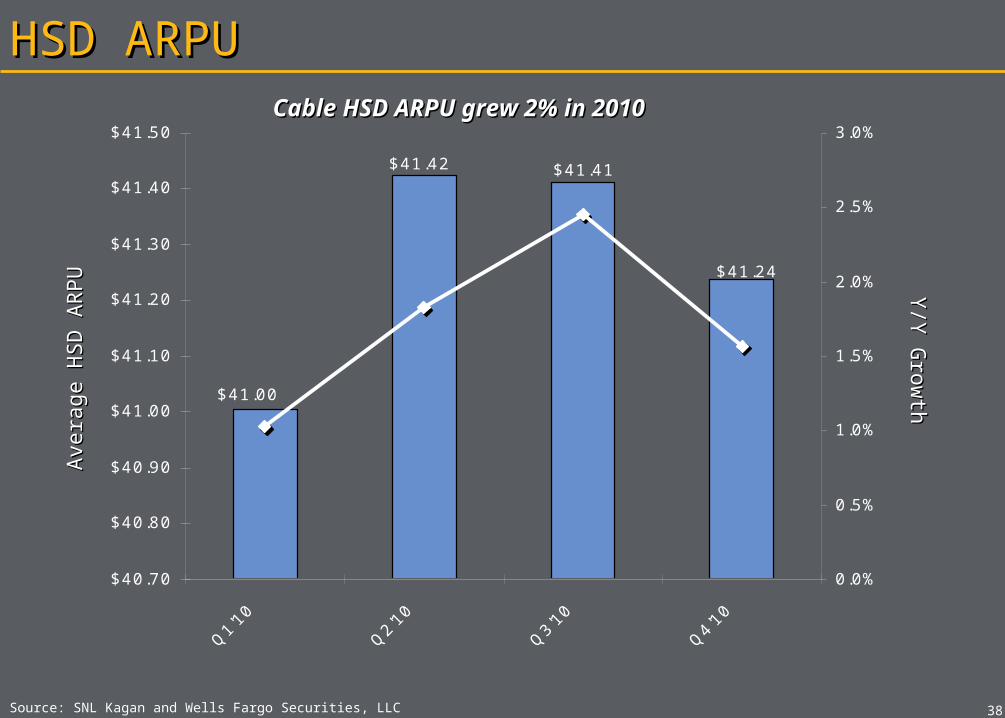
HSD ARPUHSD ARPU
Source: SNL Kagan and Wells Fargo Securities, LLC
Avera
ge H
SD
AR
PU
Avera
ge H
SD
AR
PU
Y/Y
Gro
wth
Y/Y
Gro
wth
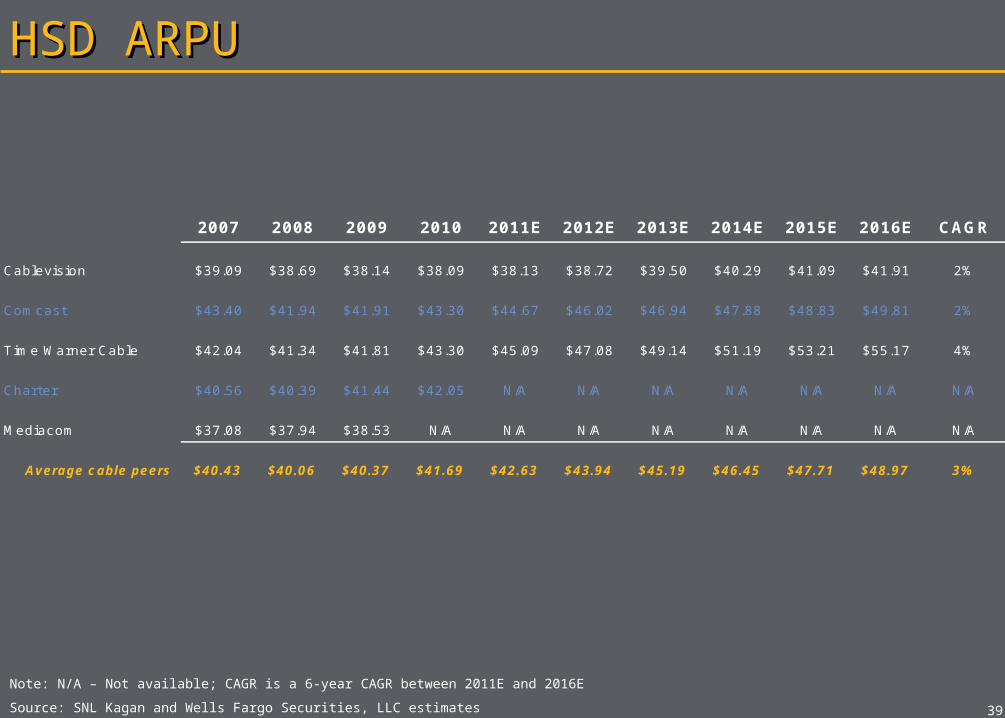
Cable HSD ARPU grew 2% in 2010Cable HSD ARPU grew 2% in 2010
3939
HSD ARPUHSD ARPU
Source: SNL Kagan and Wells Fargo Securities, LLC estimates
2007 2008 2009 2010 2011E 2012E 2013E 2014E 2015E 2016E CAGR
Cablevision $39.09 $38.69 $38.14 $38.09 $38.13 $38.72 $39.50 $40.29 $41.09 $41.91 2%
Comcast $43.40 $41.94 $41.91 $43.30 $44.67 $46.02 $46.94 $47.88 $48.83 $49.81 2%
Time Warner Cable $42.04 $41.34 $41.81 $43.30 $45.09 $47.08 $49.14 $51.19 $53.21 $55.17 4%
Charter $40.56 $40.39 $41.44 $42.05 N/A N/A N/A N/A N/A N/A N/A
Mediacom $37.08 $37.94 $38.53 N/A N/A N/A N/A N/A N/A N/A N/A
Average cable peers $40.43 $40.06 $40.37 $41.69 $42.63 $43.94 $45.19 $46.45 $47.71 $48.97 3%
Note: N/A – Not available; CAGR is a 6-year CAGR between 2011E and 2016E
4040
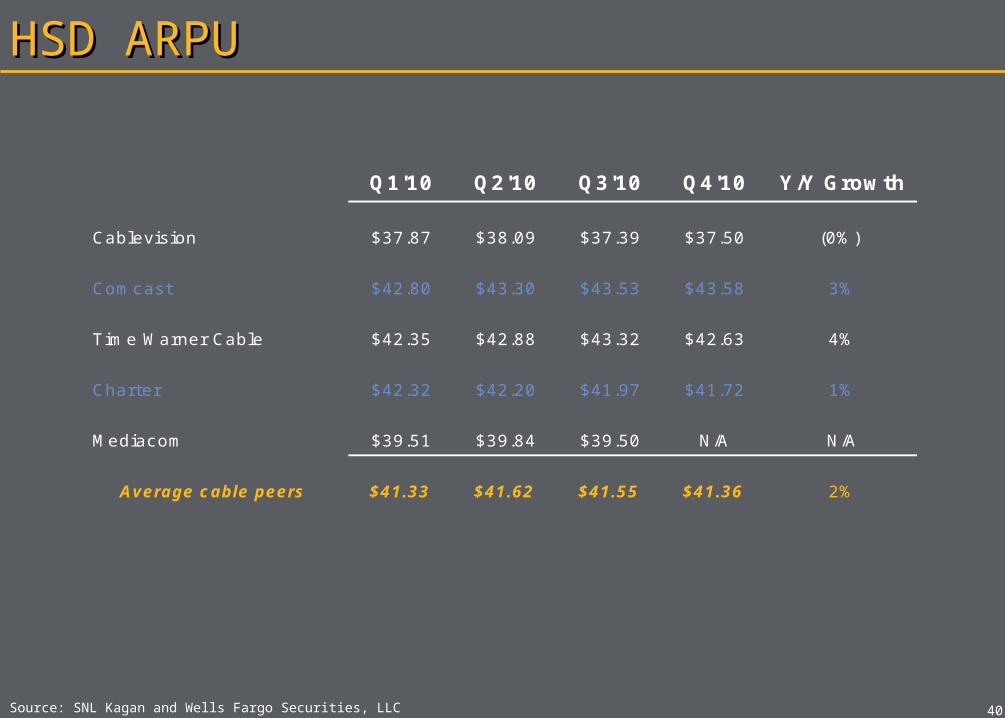
HSD ARPUHSD ARPU
Source: SNL Kagan and Wells Fargo Securities, LLC
Q1'10 Q2'10 Q3'10 Q4'10 Y/Y Growth
Cablevision $37.87 $38.09 $37.39 $37.50 (0%)
Comcast $42.80 $43.30 $43.53 $43.58 3%
Time Warner Cable $42.35 $42.88 $43.32 $42.63 4%
Charter $42.32 $42.20 $41.97 $41.72 1%
Mediacom $39.51 $39.84 $39.50 N/A N/A
Average cable peers $41.33 $41.62 $41.55 $41.36 2%

TELEPHONYTELEPHONY
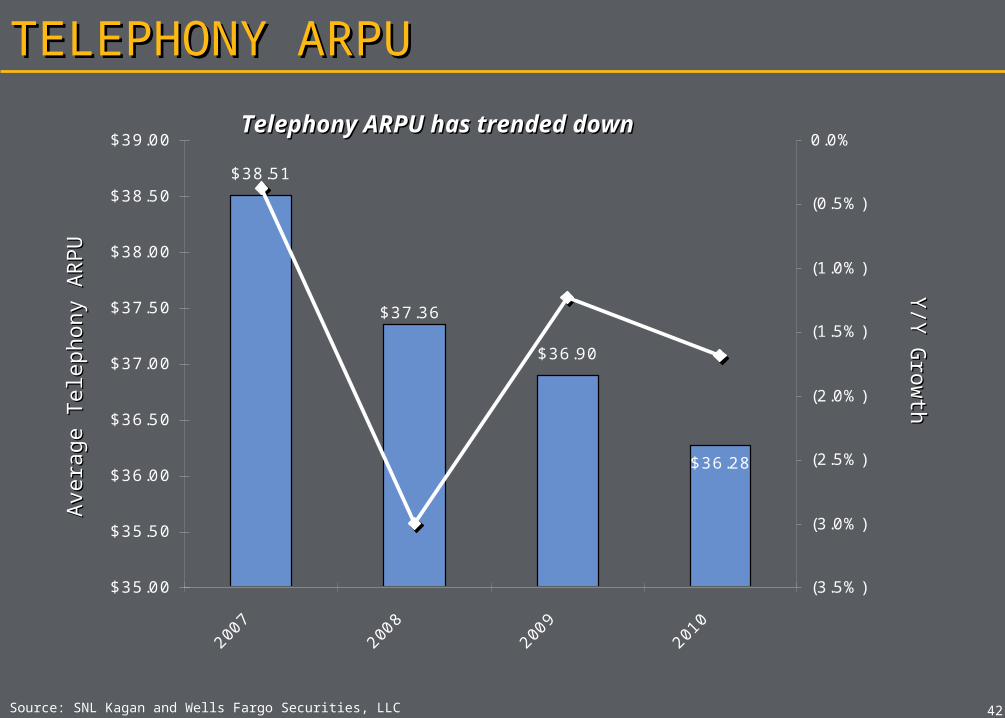
4242
TELEPHONY ARPUTELEPHONY ARPU
Source: SNL Kagan and Wells Fargo Securities, LLC
Avera
ge T
ele
phony A
RPU
Avera
ge T
ele
phony A
RPU
Y/Y
Gro
wth
Y/Y
Gro
wth
$38.51
$36.90
$36.28
$37.36
$35.00
$35.50
$36.00
$36.50
$37.00
$37.50
$38.00
$38.50
$39.00
2007
2008
2009
2010
(3.5%)
(3.0%)
(2.5%)
(2.0%)
(1.5%)
(1.0%)
(0.5%)
0.0%Telephony ARPU has trended downTelephony ARPU has trended down
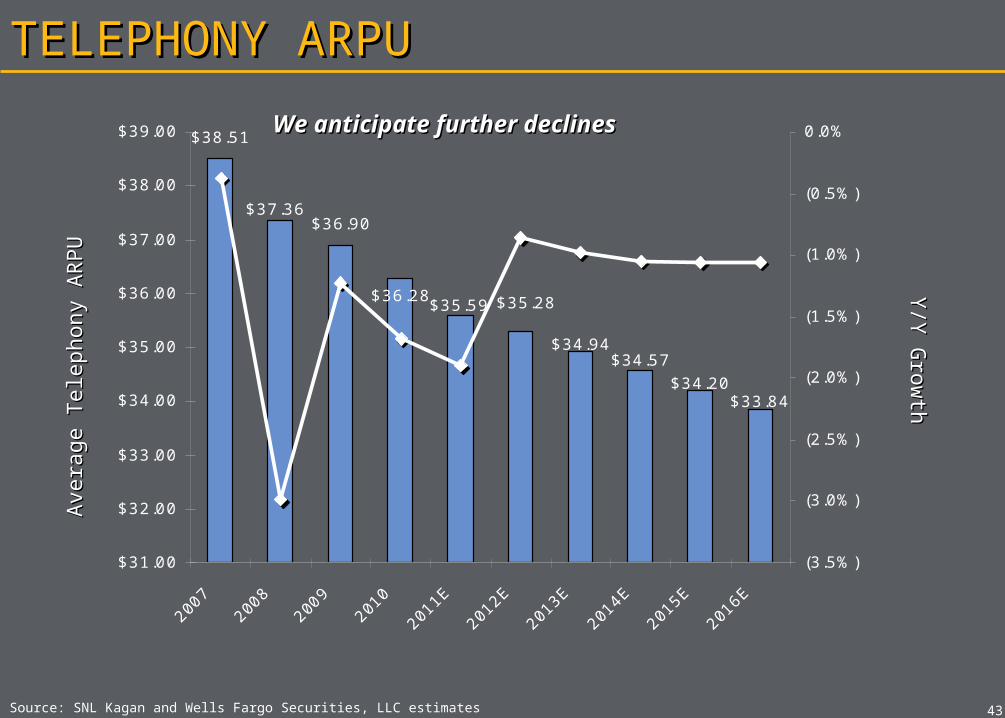
$38.51
$36.90
$36.28
$34.57
$33.84
$35.28
$34.94
$37.36
$35.59
$34.20
$31.00
$32.00
$33.00
$34.00
$35.00
$36.00
$37.00
$38.00
$39.00
2007
2008
2009
2010
2011E
2012E
2013E
2014E
2015E
2016E
(3.5%)
(3.0%)
(2.5%)
(2.0%)
(1.5%)
(1.0%)
(0.5%)
0.0%
4343
TELEPHONY ARPUTELEPHONY ARPU
Source: SNL Kagan and Wells Fargo Securities, LLC estimates
Y/Y
Gro
wth
Y/Y
Gro
wth
Avera
ge T
ele
phony A
RPU
Avera
ge T
ele
phony A
RPU
We anticipate further declinesWe anticipate further declines
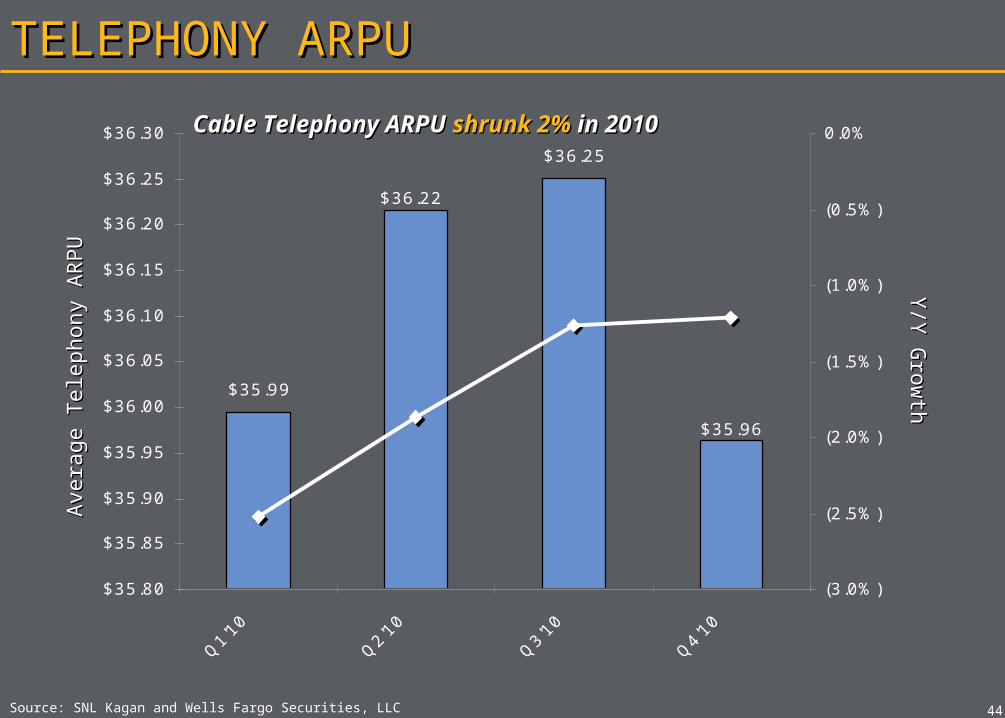
$35.99
$36.25
$36.22
$35.96
$35.80
$35.85
$35.90
$35.95
$36.00
$36.05
$36.10
$36.15
$36.20
$36.25
$36.30
Q1'1
0
Q2'1
0
Q3'1
0
Q4'1
0
(3.0%)
(2.5%)
(2.0%)
(1.5%)
(1.0%)
(0.5%)
0.0%
4444
TELEPHONY ARPUTELEPHONY ARPU
Source: SNL Kagan and Wells Fargo Securities, LLC
Avera
ge T
ele
phony A
RPU
Avera
ge T
ele
phony A
RPU
Y/Y
Gro
wth
Y/Y
Gro
wth
Cable Telephony ARPU Cable Telephony ARPU shrunk 2%shrunk 2% in 2010 in 2010
4545
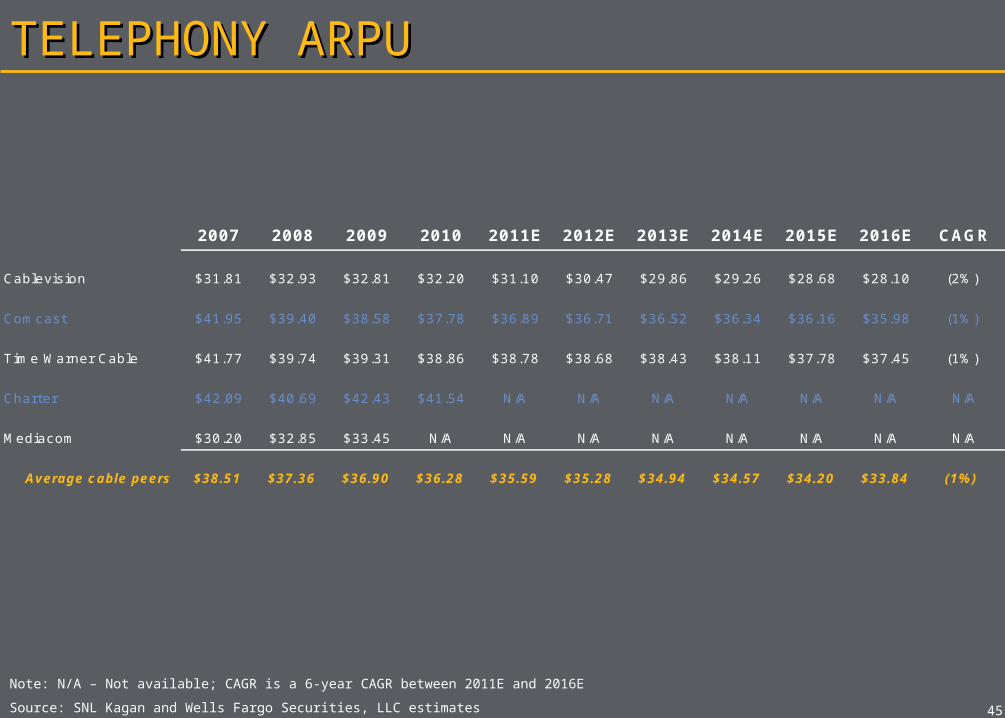
TELEPHONY ARPUTELEPHONY ARPU
Source: SNL Kagan and Wells Fargo Securities, LLC estimates
Note: N/A – Not available; CAGR is a 6-year CAGR between 2011E and 2016E
2007 2008 2009 2010 2011E 2012E 2013E 2014E 2015E 2016E CAGR
Cablevision $31.81 $32.93 $32.81 $32.20 $31.10 $30.47 $29.86 $29.26 $28.68 $28.10 (2%)
Comcast $41.95 $39.40 $38.58 $37.78 $36.89 $36.71 $36.52 $36.34 $36.16 $35.98 (1%)
Time Warner Cable $41.77 $39.74 $39.31 $38.86 $38.78 $38.68 $38.43 $38.11 $37.78 $37.45 (1%)
Charter $42.09 $40.69 $42.43 $41.54 N/A N/A N/A N/A N/A N/A N/A
Mediacom $30.20 $32.85 $33.45 N/A N/A N/A N/A N/A N/A N/A N/A
Average cable peers $38.51 $37.36 $36.90 $36.28 $35.59 $35.28 $34.94 $34.57 $34.20 $33.84 (1%)
4646
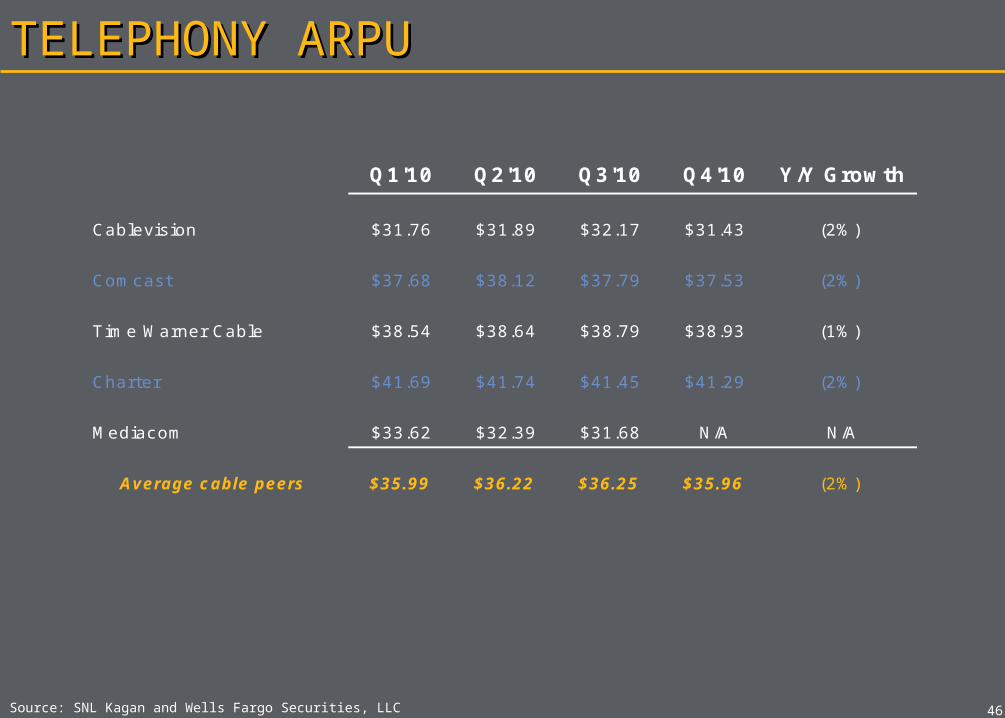
TELEPHONY ARPUTELEPHONY ARPU
Source: SNL Kagan and Wells Fargo Securities, LLC
Q1'10 Q2'10 Q3'10 Q4'10 Y/Y Growth
Cablevision $31.76 $31.89 $32.17 $31.43 (2%)
Comcast $37.68 $38.12 $37.79 $37.53 (2%)
Time Warner Cable $38.54 $38.64 $38.79 $38.93 (1%)
Charter $41.69 $41.74 $41.45 $41.29 (2%)
Mediacom $33.62 $32.39 $31.68 N/A N/A
Average cable peers $35.99 $36.22 $36.25 $35.96 (2%)
4747
2010 THEMES2010 THEMES
TITLE 2TITLE 2
OVER THE TOPOVER THE TOP
THE ECONOMYTHE ECONOMY
COMCAST-NBCUCOMCAST-NBCU

TITLE 2TITLE 2
4949
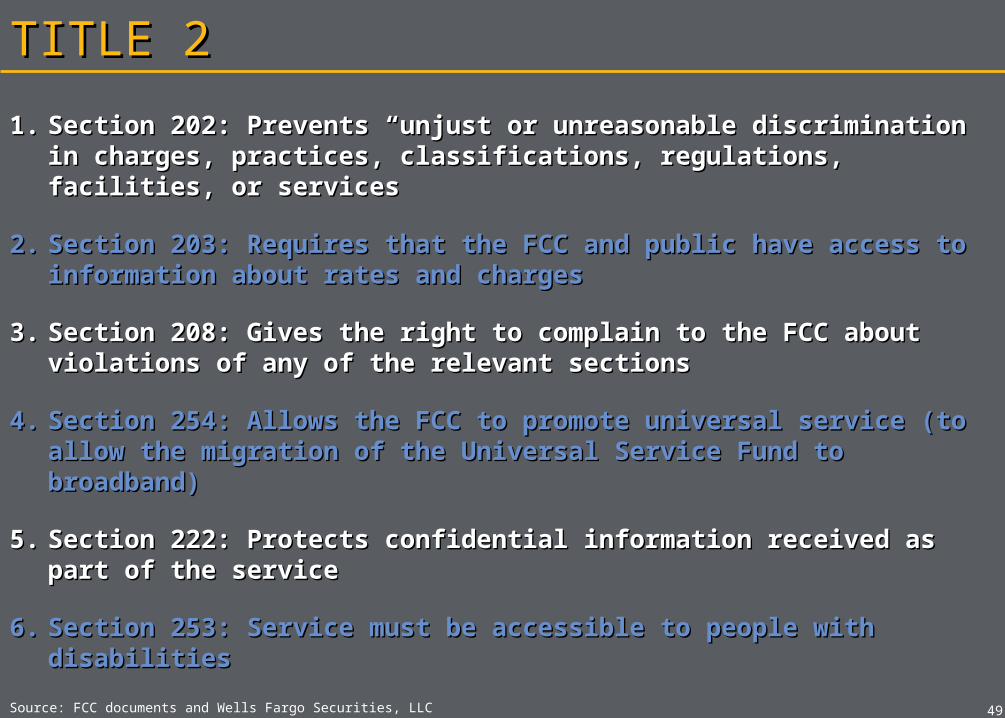
TITLE 2TITLE 2
1.1. Section 202: Prevents “unjust or unreasonable discrimination Section 202: Prevents “unjust or unreasonable discrimination in charges, practices, classifications, regulations, facilities, or in charges, practices, classifications, regulations, facilities, or servicesservices
2.2. Section 203: Requires that the FCC and public have access to Section 203: Requires that the FCC and public have access to information about rates and chargesinformation about rates and charges
3.3. Section 208: Gives the right to complain to the FCC about Section 208: Gives the right to complain to the FCC about violations of any of the relevant sectionsviolations of any of the relevant sections
4.4. Section 254: Allows the FCC to promote universal service (to Section 254: Allows the FCC to promote universal service (to allow the migration of the Universal Service Fund to allow the migration of the Universal Service Fund to broadband)broadband)
5.5. Section 222: Protects confidential information received as Section 222: Protects confidential information received as part of the servicepart of the service
6.6. Section 253: Service must be accessible to people with Section 253: Service must be accessible to people with disabilitiesdisabilities
Source: FCC documents and Wells Fargo Securities, LLC
5050
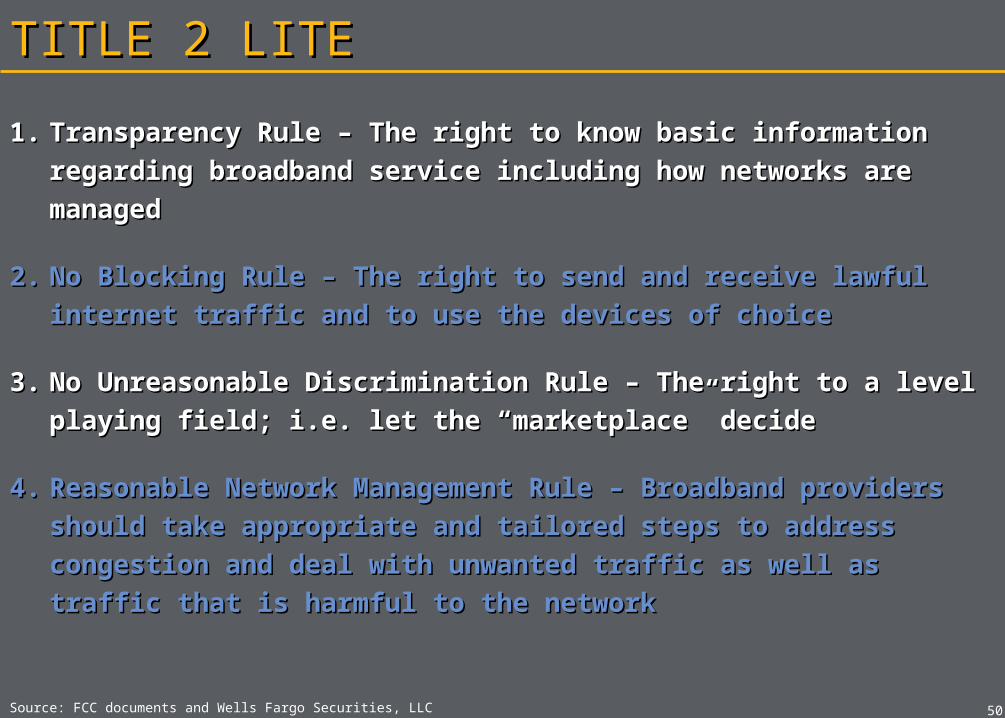
TITLE 2 LITETITLE 2 LITE
1.1. Transparency Rule – The right to know basic information Transparency Rule – The right to know basic information
regarding broadband service including how networks are regarding broadband service including how networks are
managedmanaged
2.2. No Blocking Rule – The right to send and receive lawful No Blocking Rule – The right to send and receive lawful
internet traffic and to use the devices of choiceinternet traffic and to use the devices of choice
3.3. No Unreasonable Discrimination Rule – The right to a level No Unreasonable Discrimination Rule – The right to a level
playing field; i.e. let the “marketplace” decideplaying field; i.e. let the “marketplace” decide
4.4. Reasonable Network Management Rule – Broadband providers Reasonable Network Management Rule – Broadband providers
should take appropriate and tailored steps to address should take appropriate and tailored steps to address
congestion and deal with unwanted traffic as well as traffic congestion and deal with unwanted traffic as well as traffic
that is harmful to the networkthat is harmful to the network
Source: FCC documents and Wells Fargo Securities, LLC
5151
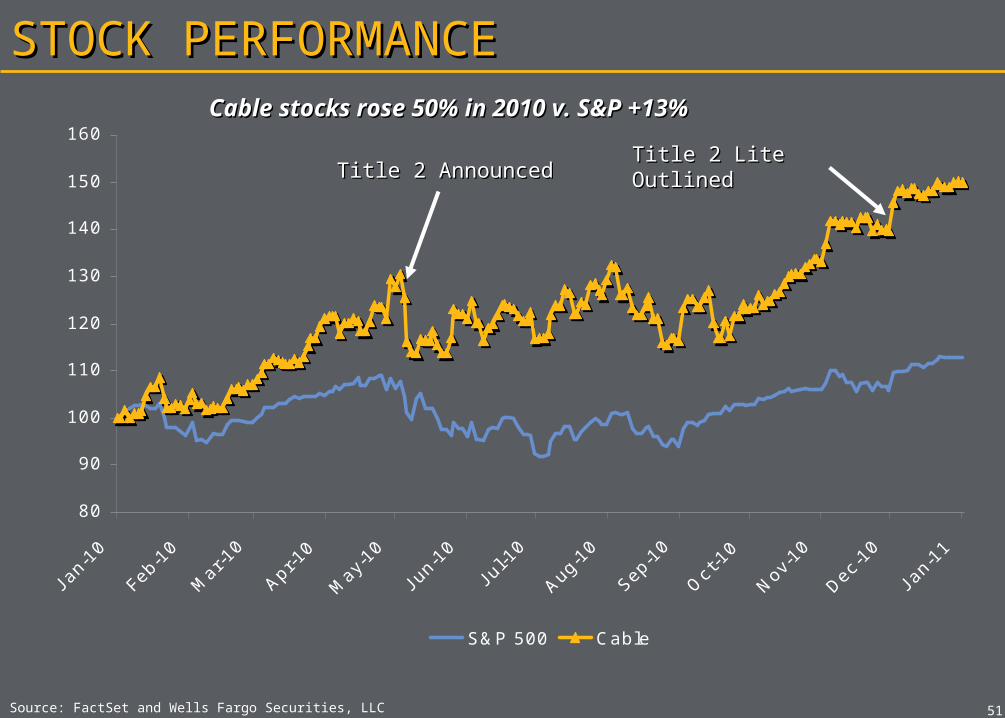
STOCK PERFORMANCESTOCK PERFORMANCE
Source: FactSet and Wells Fargo Securities, LLC
80
90
100
110
120
130
140
150
160
J an-
10
Feb-
10
Mar
-10
Apr-1
0
May
-10
J un-
10
J ul-1
0
Aug-1
0
Sep-1
0
Oct
-10
Nov
-10
Dec-1
0
J an-
11
S&P 500 Cable
Title 2 AnnouncedTitle 2 AnnouncedTitle 2 Lite OutlinedTitle 2 Lite Outlined
Cable stocks rose 50% in 2010 v. S&P Cable stocks rose 50% in 2010 v. S&P +13%+13%

OVER THE TOPOVER THE TOP
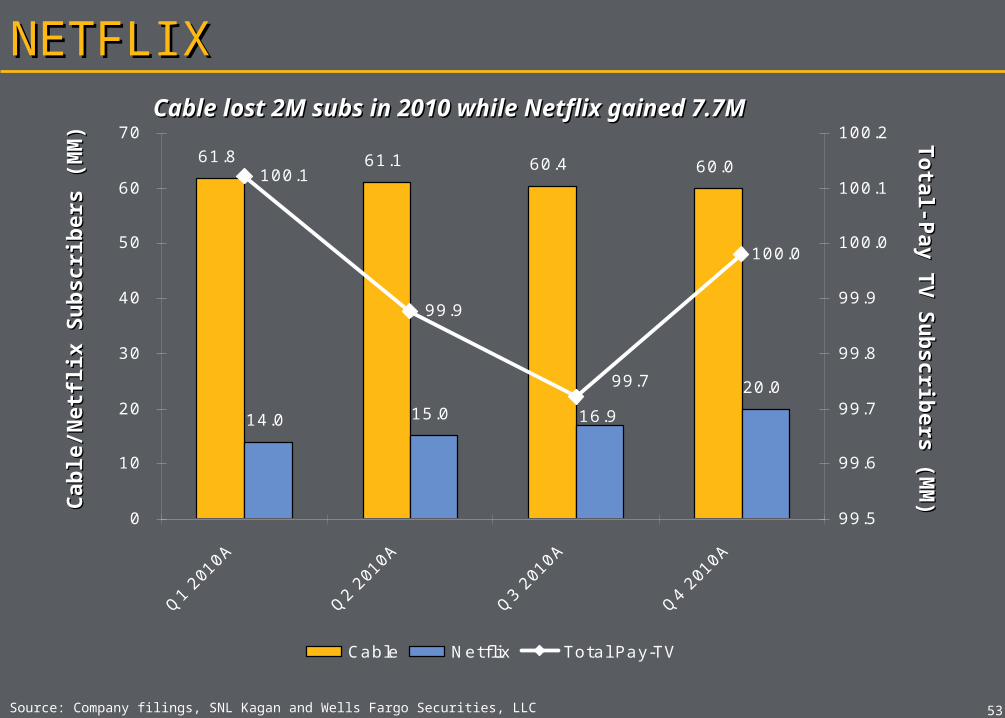
61.8 61.1 60.4 60.0
14.0 15.0
20.0
16.9
100.1
99.9
99.7
100.0
0
10
20
30
40
50
60
70
Q1 2
010A
Q2 2
010A
Q3 2
010A
Q4 2
010A
99.5
99.6
99.7
99.8
99.9
100.0
100.1
100.2
Cable Netflix Total Pay-TV
5353
NETFLIXNETFLIX
Source: Company filings, SNL Kagan and Wells Fargo Securities, LLC
Tota
l-Pay T
V S
ub
scrib
ers
(MM
)Tota
l-Pay T
V S
ub
scrib
ers
(MM
)Cab
le/N
etfl
ix S
ub
scri
bers
(M
M)
Cab
le/N
etfl
ix S
ub
scri
bers
(M
M)
Cable lost 2M subs in 2010 while Netflix gained Cable lost 2M subs in 2010 while Netflix gained 7.7M7.7M
5454
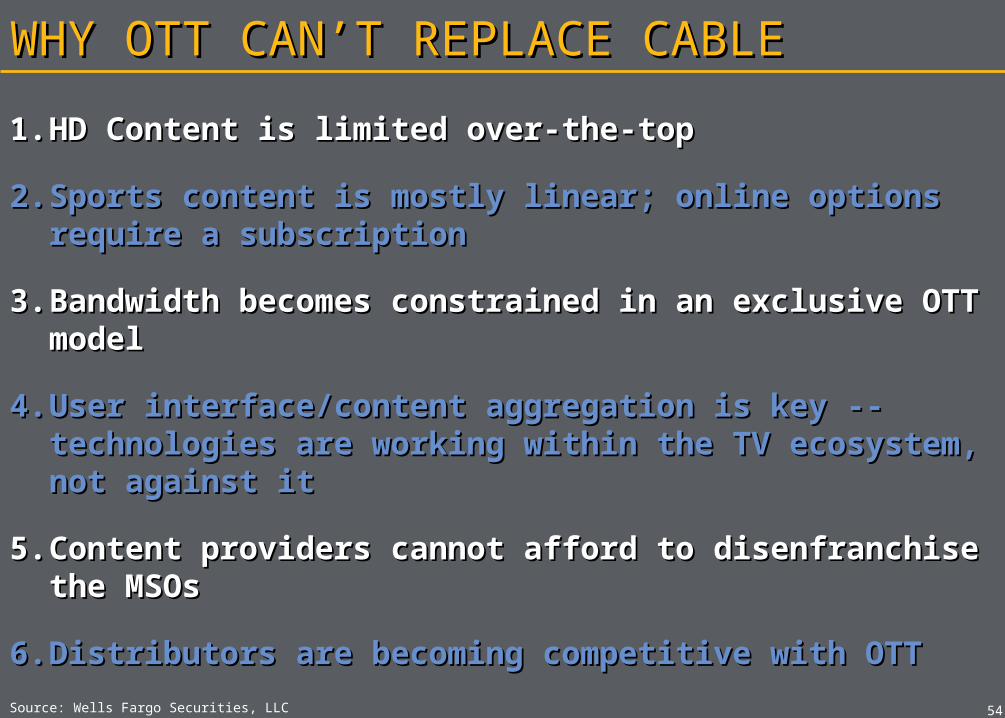
WHY OTT CAN’T REPLACE CABLEWHY OTT CAN’T REPLACE CABLE
1.1. HD Content is limited over-the-topHD Content is limited over-the-top
2.2. Sports content is mostly linear; online options Sports content is mostly linear; online options require a subscriptionrequire a subscription
3.3. Bandwidth becomes constrained in an exclusive Bandwidth becomes constrained in an exclusive OTT modelOTT model
4.4. User interface/content aggregation is key -- User interface/content aggregation is key -- technologies are working within the TV ecosystem, technologies are working within the TV ecosystem, not against itnot against it
5.5. Content providers cannot afford to disenfranchise Content providers cannot afford to disenfranchise the MSOsthe MSOs
6.6. Distributors are becoming competitive with OTTDistributors are becoming competitive with OTT
Source: Wells Fargo Securities, LLC
5555
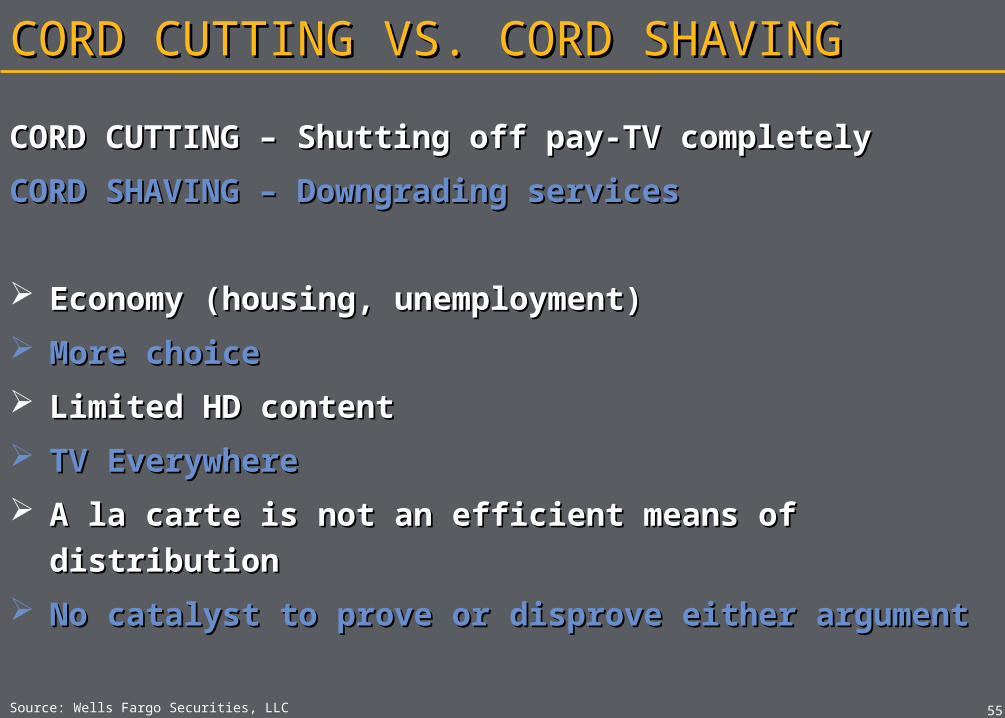
CORD CUTTING VS. CORD SHAVINGCORD CUTTING VS. CORD SHAVING
CORD CUTTING – Shutting off pay-TV completelyCORD CUTTING – Shutting off pay-TV completely
CORD SHAVING – Downgrading servicesCORD SHAVING – Downgrading services
Economy (housing, unemployment)Economy (housing, unemployment)
More choiceMore choice
Limited HD contentLimited HD content
TV EverywhereTV Everywhere
A la carte is not an efficient means of distributionA la carte is not an efficient means of distribution
No catalyst to prove or disprove either argumentNo catalyst to prove or disprove either argument
Source: Wells Fargo Securities, LLC

THE ECONOMYTHE ECONOMY
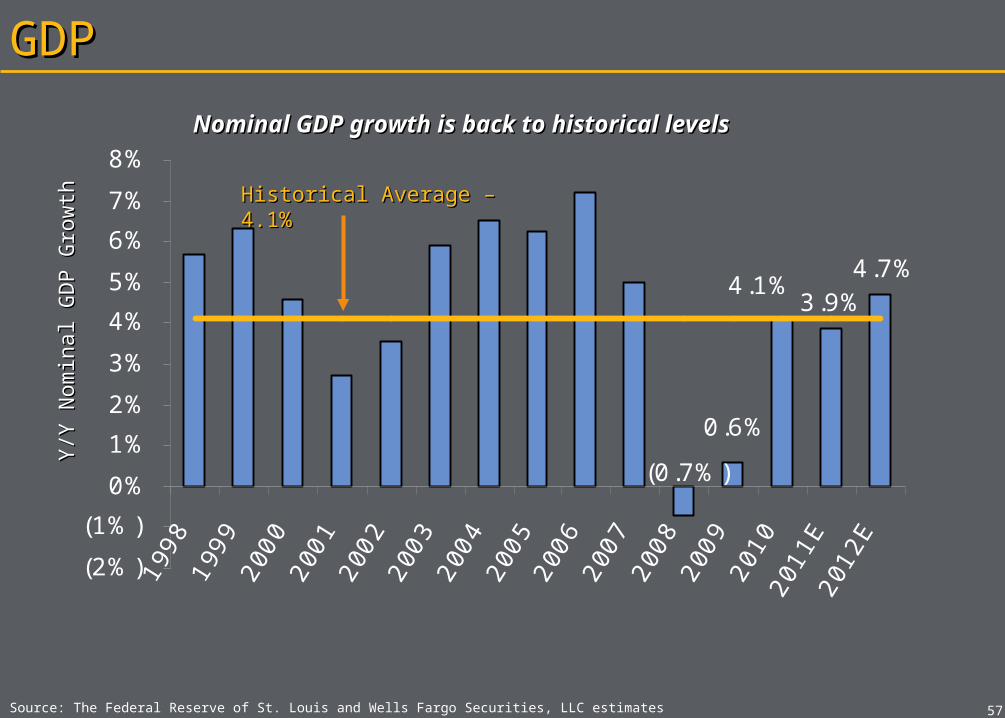
(0.7%)
4.1%3.9%
4.7%
0.6%
(2%)
(1%)
0%
1%
2%
3%
4%
5%
6%
7%
8%199
8199
9200
0200
1200
2200
3200
4200
5200
6200
7200
8200
9201
0201
1E
201
2E
5757
GDPGDPY/Y
Nom
inal G
DP G
row
thY/Y
Nom
inal G
DP G
row
th
Historical Average – 4.1%Historical Average – 4.1%
Source: The Federal Reserve of St. Louis and Wells Fargo Securities, LLC estimates
Nominal GDP growth is back to historical Nominal GDP growth is back to historical levelslevels
5858
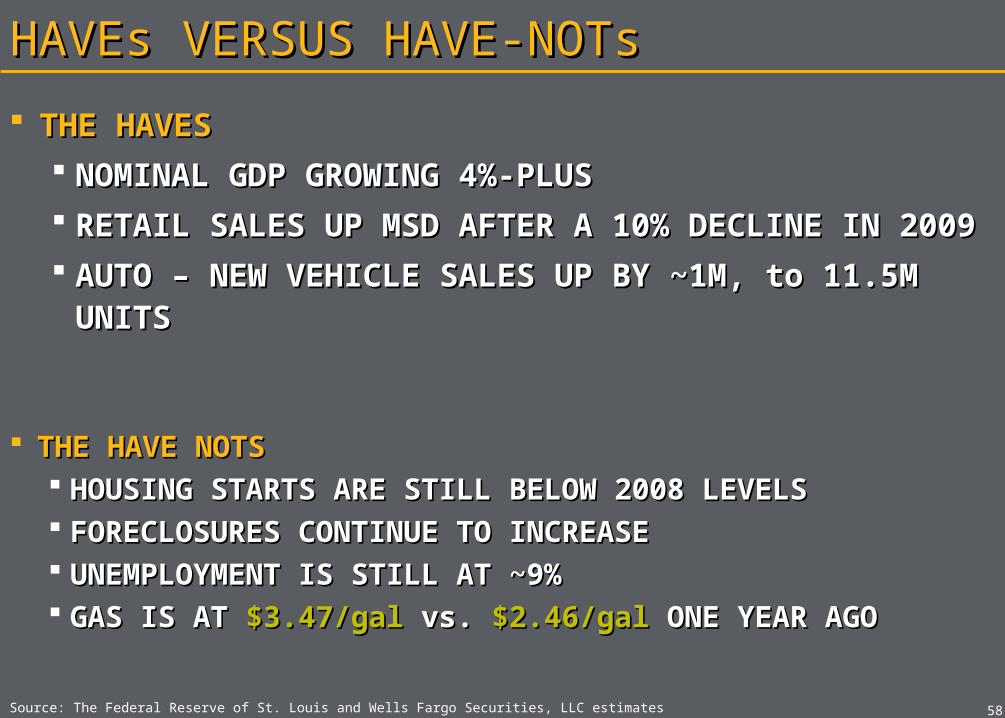
HAVEs VERSUS HAVE-NOTsHAVEs VERSUS HAVE-NOTs
THE HAVE NOTSTHE HAVE NOTS HOUSING STARTS ARE STILL BELOW 2008 LEVELSHOUSING STARTS ARE STILL BELOW 2008 LEVELS FORECLOSURES CONTINUE TO INCREASEFORECLOSURES CONTINUE TO INCREASE UNEMPLOYMENT IS STILL AT ~9%UNEMPLOYMENT IS STILL AT ~9% GAS IS AT GAS IS AT $3.47/gal$3.47/gal vs. vs. $2.46/gal$2.46/gal ONE YEAR AGO ONE YEAR AGO
THE HAVESTHE HAVES NOMINAL GDP GROWING 4%-PLUS NOMINAL GDP GROWING 4%-PLUS RETAIL SALES UP MSD AFTER A 10% DECLINE IN RETAIL SALES UP MSD AFTER A 10% DECLINE IN
20092009 AUTO – NEW VEHICLE SALES UP BY ~1M, to 11.5M AUTO – NEW VEHICLE SALES UP BY ~1M, to 11.5M
UNITSUNITS
Source: The Federal Reserve of St. Louis and Wells Fargo Securities, LLC estimates

0
500
1,000
1,500
2,000
2,500
1998199
9200
0200
1200
2200
3200
4200
5200
6200
7200
8200
9201
0
2011E
2012E
5959
HOUSING STARTSHOUSING STARTS
Source: The Federal Reserve of St. Louis and Wells Fargo Securities, LLC estimates
Historical Average – 1.4MHistorical Average – 1.4M
U.S
. H
ousi
ng S
tart
s (‘
00
0s)
U.S
. H
ousi
ng S
tart
s (‘
00
0s)
2010A: 590k2010A: 590k
The housing market has been slow to recoverThe housing market has been slow to recover
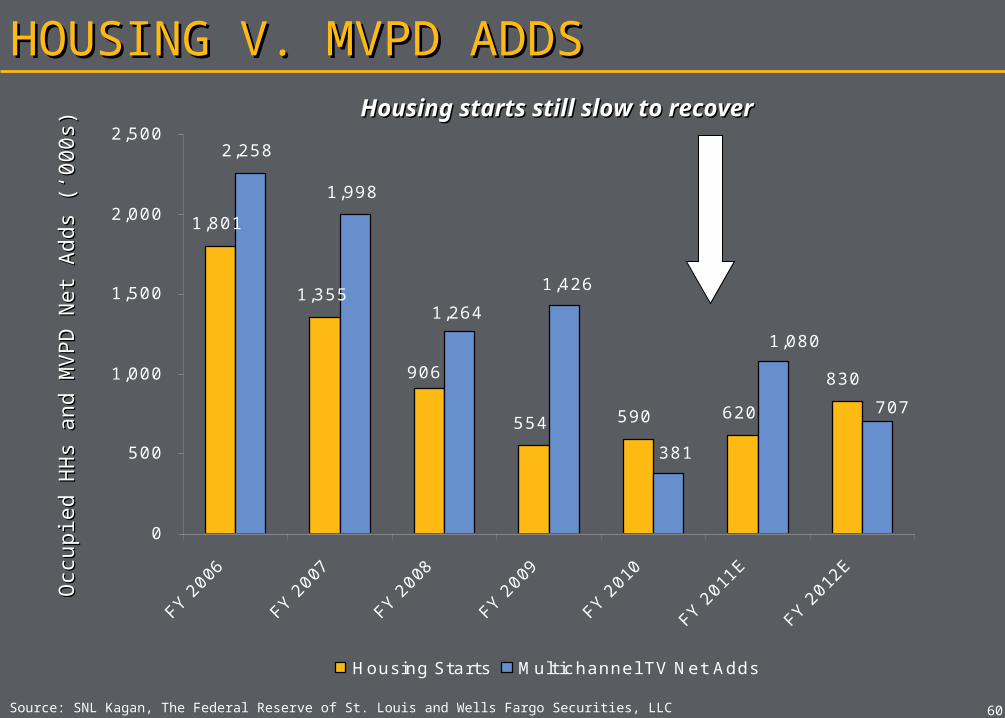
1,801
1,355
554 590 620
830
2,258
1,998
906
1,426
381
1,264
707
1,080
0
500
1,000
1,500
2,000
2,500
FY 2006
FY 2007
FY 2008
FY 2009
FY 2010
FY 2011
E
FY 2012
E
Housing Starts Multichannel TV Net Adds
6060
HOUSING V. MVPD ADDSHOUSING V. MVPD ADDSO
ccupie
d H
Hs
and M
VPD
Net
Adds
(‘0
00
s)O
ccupie
d H
Hs
and M
VPD
Net
Adds
(‘0
00
s)
Source: SNL Kagan, The Federal Reserve of St. Louis and Wells Fargo Securities, LLC
Housing starts still slow to recoverHousing starts still slow to recover
0%1%2%3%4%5%6%7%8%9%
10%
1998
1999200
0200
1200
2200
3200
4200
5200
6200
7200
8200
9201
0
2011E
2012E
6161
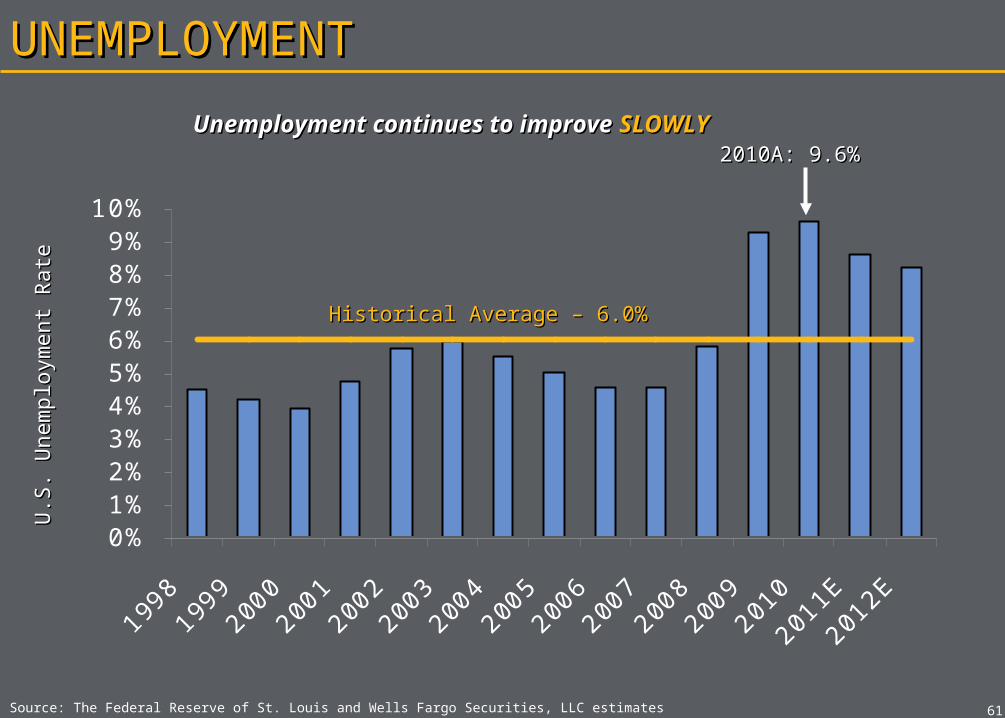
UNEMPLOYMENTUNEMPLOYMENTU
.S. U
nem
plo
ym
ent
Rate
U.S
. U
nem
plo
ym
ent
Rate
Historical Average – 6.0%Historical Average – 6.0%
2010A: 9.6%2010A: 9.6%
Source: The Federal Reserve of St. Louis and Wells Fargo Securities, LLC estimates
Unemployment continues to improve Unemployment continues to improve SLOWLYSLOWLY
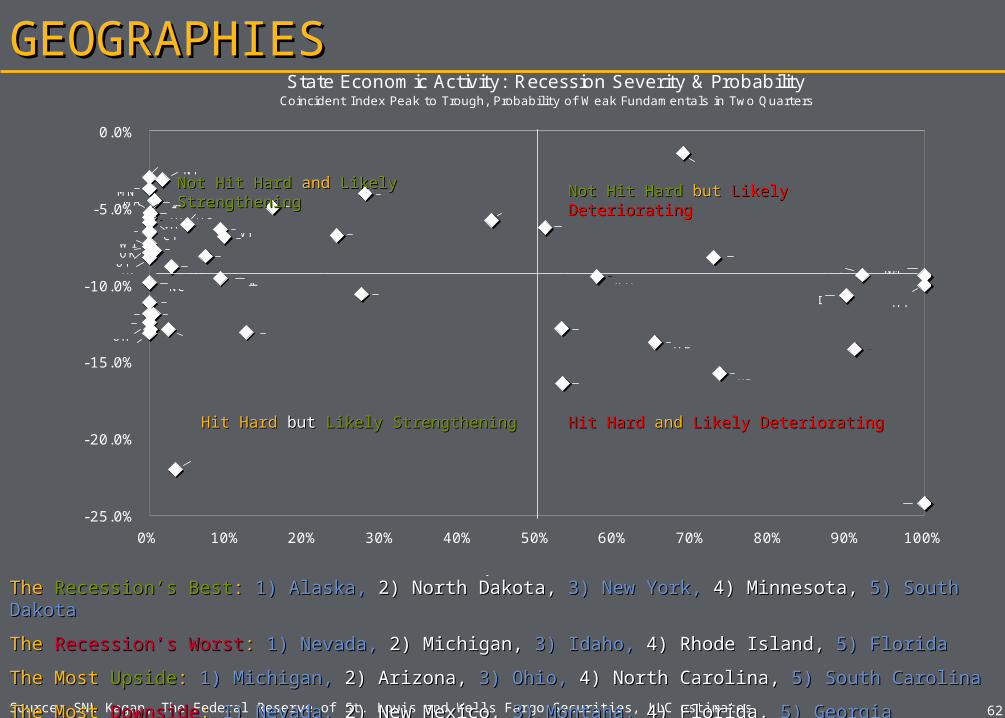
State Economic Activity: Recession Severity & ProbabilityCoincident Index Peak to Trough, Probability of Weak Fundamentals in Two Quarters
-25.0%
-20.0%
-15.0%
-10.0%
-5.0%
0.0%
0% 10% 20% 30% 40% 50% 60% 70% 80% 90% 100%
B - Not Severe Recession, Weak Economic Fundamentals
NV
TN
MNIA
MI
SC
IN
CA
NY
SD
NH, AR
OH
KY
NC
MA
MD
WV
OKUT
CT
DEORAL
ME
KSWY
PA
AK
LATX MS
NJ
ND
MO
HI
WA
IDRI
FL
VT
MT
NM
NE
GACO
WI
VA
C - Severe Recession, Improving Economic Fundamentals D - Severe Recession, Weak Economic Fundamentals
A - Not Severe Recession, Improving Economic Fundamentals
Probability of Weak Fundamentals
Severi
ty o
f R
ece
ssio
n
IL
AZ
State Average: -9.3%
6262
GEOGRAPHIESGEOGRAPHIES
Source: SNL Kagan, The Federal Reserve of St. Louis and Wells Fargo Securities, LLC estimates
The The Recession’s BestRecession’s Best: : 1) Alaska,1) Alaska, 2) North Dakota,2) North Dakota, 3) New York,3) New York, 4) Minnesota,4) Minnesota, 5) South Dakota5) South Dakota
The The Recession’s WorstRecession’s Worst: : 1) Nevada,1) Nevada, 2) Michigan,2) Michigan, 3) Idaho,3) Idaho, 4) Rhode Island,4) Rhode Island, 5) Florida5) Florida
The Most The Most UpsideUpside:: 1) Michigan, 1) Michigan, 2) Arizona, 2) Arizona, 3) Ohio, 3) Ohio, 4) North Carolina, 4) North Carolina, 5) South Carolina5) South Carolina
The Most The Most DownsideDownside:: 1) Nevada, 1) Nevada, 2) New Mexico, 2) New Mexico, 3) Montana, 3) Montana, 4) Florida, 4) Florida, 5) Georgia5) Georgia
Hit Hard Hit Hard and and Likely DeterioratingLikely DeterioratingHit HardHit Hard but but Likely StrengtheningLikely Strengthening
Not Hit HardNot Hit Hard butbut Likely Deteriorating Likely DeterioratingNot Hit HardNot Hit Hard andand Likely StrengtheningLikely Strengthening
6363
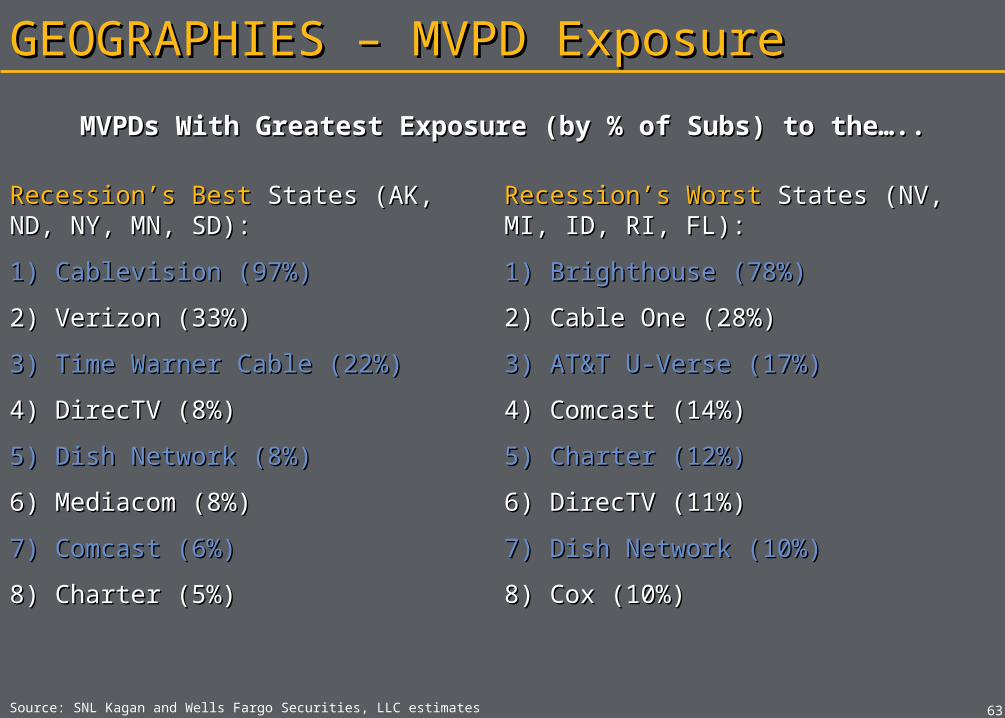
GEOGRAPHIES – MVPD ExposureGEOGRAPHIES – MVPD Exposure
Source: SNL Kagan and Wells Fargo Securities, LLC estimates
Recession’s BestRecession’s Best States (AK, ND, NY, States (AK, ND, NY, MN, SD):MN, SD):
1) Cablevision (97%)1) Cablevision (97%)
2) Verizon (33%)2) Verizon (33%)
3) Time Warner Cable (22%)3) Time Warner Cable (22%)
4) DirecTV (8%)4) DirecTV (8%)
5) Dish Network (8%)5) Dish Network (8%)
6) Mediacom (8%)6) Mediacom (8%)
7) Comcast (6%)7) Comcast (6%)
8) Charter (5%)8) Charter (5%)
Recession’s WorstRecession’s Worst States (NV, MI, ID, States (NV, MI, ID, RI, FL):RI, FL):
1) Brighthouse (78%)1) Brighthouse (78%)
2) Cable One (28%)2) Cable One (28%)
3) AT&T U-Verse (17%)3) AT&T U-Verse (17%)
4) Comcast (14%)4) Comcast (14%)
5) Charter (12%)5) Charter (12%)
6) DirecTV (11%)6) DirecTV (11%)
7) Dish Network (10%)7) Dish Network (10%)
8) Cox (10%)8) Cox (10%)
MVPDs With Greatest Exposure (by % of Subs) to the…..MVPDs With Greatest Exposure (by % of Subs) to the…..

6464
GEOGRAPHIES – MVPD ExposureGEOGRAPHIES – MVPD Exposure
Source: SNL Kagan and Wells Fargo Securities, LLC estimates
Most UpsideMost Upside States (MI, AZ, OH, NC, States (MI, AZ, OH, NC, SC):SC):
1) Insight (32%)1) Insight (32%)
2) Time Warner Cable (27%)2) Time Warner Cable (27%)
3) Cox (24%)3) Cox (24%)
4) Charter (19%)4) Charter (19%)
5) AT&T U-Verse (15%)5) AT&T U-Verse (15%)
6) DirecTV (14)6) DirecTV (14)
7) Dish Network (13%)7) Dish Network (13%)
8) Verizon FiOS (0%)8) Verizon FiOS (0%)
Most DownsideMost Downside States (NV, NM, MT, States (NV, NM, MT, FL, GA):FL, GA):
1) Brighthouse (74%)1) Brighthouse (74%)
2) Mediacom (15%)2) Mediacom (15%)
3) Comcast (10%)3) Comcast (10%)
4) AT&T U-Verse (9%)4) AT&T U-Verse (9%)
5) DirecTV (9%)5) DirecTV (9%)
6) Cox (9%)6) Cox (9%)
7) Dish Network (8%)7) Dish Network (8%)
8) Verizon FiOS (7%)8) Verizon FiOS (7%)
MVPDs With Greatest Exposure (by % of Subs) to the…..MVPDs With Greatest Exposure (by % of Subs) to the…..

COMCAST-NBCUCOMCAST-NBCU
6666
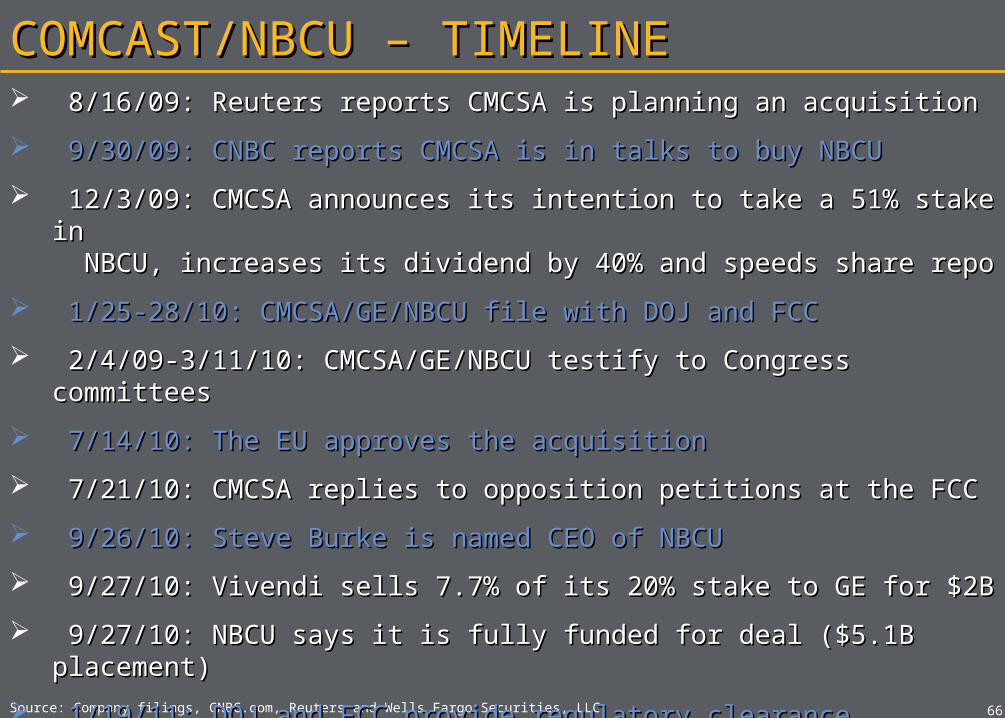
COMCAST/NBCU – TIMELINECOMCAST/NBCU – TIMELINE
Source: Company filings, CNBC.com, Reuters and Wells Fargo Securities, LLC
8/16/09: Reuters reports CMCSA is planning an acquisition8/16/09: Reuters reports CMCSA is planning an acquisition
9/30/09: CNBC reports CMCSA is in talks to buy NBCU9/30/09: CNBC reports CMCSA is in talks to buy NBCU
12/3/09: CMCSA announces its intention to take a 51% stake in12/3/09: CMCSA announces its intention to take a 51% stake in NBCU, increases its dividend by 40% and speeds share repo NBCU, increases its dividend by 40% and speeds share repo
1/25-28/10: CMCSA/GE/NBCU file with DOJ and FCC1/25-28/10: CMCSA/GE/NBCU file with DOJ and FCC
2/4/09-3/11/10: CMCSA/GE/NBCU testify to Congress committees2/4/09-3/11/10: CMCSA/GE/NBCU testify to Congress committees
7/14/10: The EU approves the acquisition7/14/10: The EU approves the acquisition
7/21/10: CMCSA replies to opposition petitions at the FCC7/21/10: CMCSA replies to opposition petitions at the FCC
9/26/10: Steve Burke is named CEO of NBCU9/26/10: Steve Burke is named CEO of NBCU
9/27/10: Vivendi sells 7.7% of its 20% stake to GE for $2B9/27/10: Vivendi sells 7.7% of its 20% stake to GE for $2B
9/27/10: NBCU says it is fully funded for deal ($5.1B placement)9/27/10: NBCU says it is fully funded for deal ($5.1B placement)
1/19/11: DOJ and FCC provide regulatory clearance1/19/11: DOJ and FCC provide regulatory clearance
1/28/11: CMCSA/NBCU officially closed1/28/11: CMCSA/NBCU officially closed

60
70
80
90
100
110
120
130
140
150
160
J an-
09
Mar
-09
May
-09
J ul-0
9
Sep-0
9
Nov
-09
J an-
10
Mar
-10
May
-10
J ul-1
0
Sep-1
0
Nov
-10
J an-
11
Mar
-11
S&P 500 CMCSA
6767
COMCAST/NBCU – STOCK PRICECOMCAST/NBCU – STOCK PRICE
CNBC reports that CMCSA is planning to CNBC reports that CMCSA is planning to buy 51% of NBCUbuy 51% of NBCU
CMCSA announces it will CMCSA announces it will acquire 51% of NBCUacquire 51% of NBCU
GE reports Q3 reports GE reports Q3 reports and that NBCU deal will and that NBCU deal will close by year-endclose by year-end
Deal officially Deal officially closescloses
Source: FactSet and Wells Fargo Securities, LLC
CMCSA is +57% since the deal was “leaked” v. the S&P, CMCSA is +57% since the deal was “leaked” v. the S&P, +27%+27%
6868
COMCAST/NBCU – POSITIVES, IN OUR VIEW COMCAST/NBCU – POSITIVES, IN OUR VIEW
Source: Wells Fargo Securities, LLC
CREATIVE DEAL STRUCTURECREATIVE DEAL STRUCTURE
FINANCIALLY ACCRETIVEFINANCIALLY ACCRETIVE
SPURS INNOVATIONSPURS INNOVATION
REGULATORY PRECEDENCEREGULATORY PRECEDENCE
6969
COMCAST/NBCU – CONCERNS COMCAST/NBCU – CONCERNS
Source: Wells Fargo Securities, LLC
BIGGER MAY NOT BE BETTERBIGGER MAY NOT BE BETTER
DIVERGENCE FROM PEERSDIVERGENCE FROM PEERS
OVER-THE-TOPOVER-THE-TOP
CONCESSIONS SET A PRECEDENCECONCESSIONS SET A PRECEDENCE

7070Source: Wells Fargo Securities, LLCSource: Wells Fargo Securities, LLC
OPPORTUNITIESOPPORTUNITIES

7171
RESIDENTIAL HSDRESIDENTIAL HSD
Source: Wells Fargo Securities, LLCSource: Wells Fargo Securities, LLC
ARPUARPU
USAGE BASED PRICINGUSAGE BASED PRICING
‘ ‘NAKED’ HSD SUBSCRIBERSNAKED’ HSD SUBSCRIBERS

TVE – WHY IS IT IMPORTANT?TVE – WHY IS IT IMPORTANT?
Source: Company websites and Wells Fargo Securities, LLCSource: Company websites and Wells Fargo Securities, LLC
CUSTOMER RETENTIONCUSTOMER RETENTION
POTENTIAL SUBSCRIPTION MODELPOTENTIAL SUBSCRIPTION MODEL
ADDITIONAL ADVERTISING $sADDITIONAL ADVERTISING $s
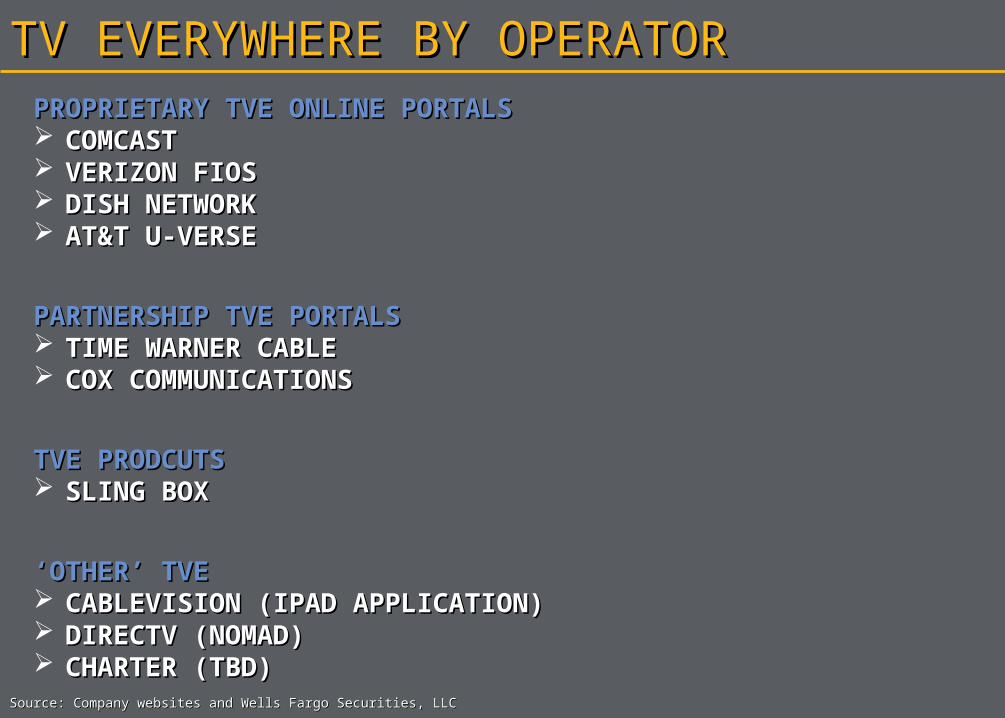
TV EVERYWHERE BY OPERATORTV EVERYWHERE BY OPERATORPROPRIETARY TVE ONLINE PORTALSPROPRIETARY TVE ONLINE PORTALS COMCASTCOMCAST VERIZON FIOSVERIZON FIOS DISH NETWORKDISH NETWORK AT&T U-VERSEAT&T U-VERSE
PARTNERSHIP TVE PORTALS PARTNERSHIP TVE PORTALS TIME WARNER CABLETIME WARNER CABLE COX COMMUNICATIONSCOX COMMUNICATIONS
TVE PRODCUTSTVE PRODCUTS SLING BOXSLING BOX
‘‘OTHER’ TVEOTHER’ TVE CABLEVISION (IPAD APPLICATION)CABLEVISION (IPAD APPLICATION) DIRECTV (NOMAD)DIRECTV (NOMAD) CHARTER (TBD)CHARTER (TBD)
Source: Company websites and Wells Fargo Securities, LLCSource: Company websites and Wells Fargo Securities, LLC
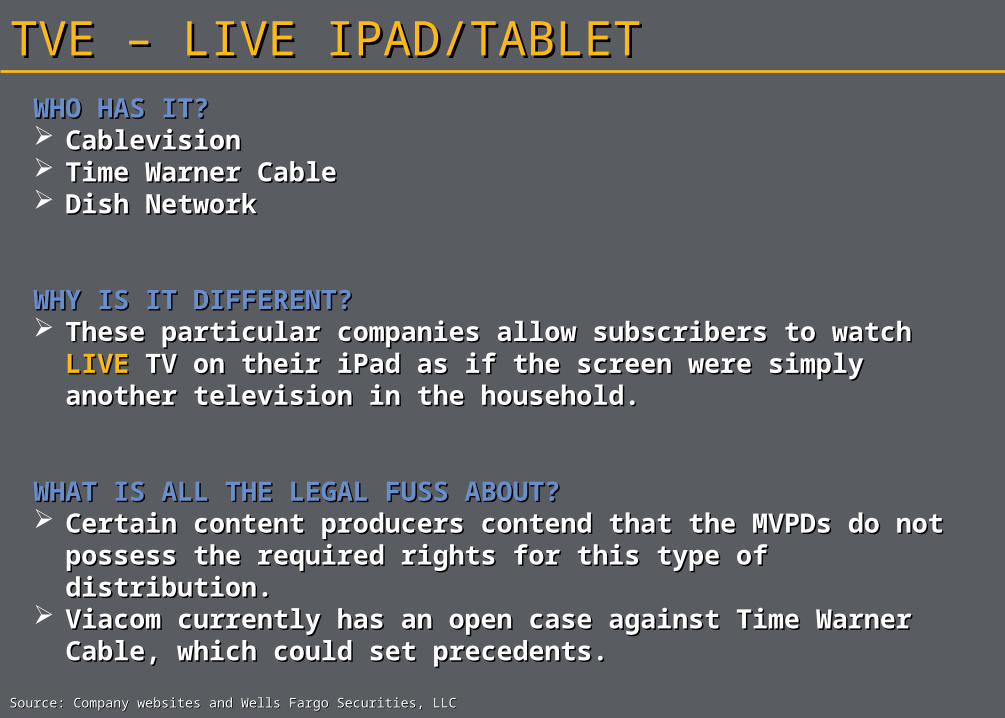
TVE – LIVE IPAD/TABLETTVE – LIVE IPAD/TABLETWHO HAS IT?WHO HAS IT? CablevisionCablevision Time Warner CableTime Warner Cable Dish NetworkDish Network
WHY IS IT DIFFERENT?WHY IS IT DIFFERENT? These particular companies allow subscribers to watch These particular companies allow subscribers to watch LIVELIVE
TV on their iPad as if the screen were simply another TV on their iPad as if the screen were simply another television in the household.television in the household.
WHAT IS ALL THE LEGAL FUSS ABOUT?WHAT IS ALL THE LEGAL FUSS ABOUT? Certain content producers contend that the MVPDs do not Certain content producers contend that the MVPDs do not
possess the required rights for this type of distribution.possess the required rights for this type of distribution. Viacom currently has an open case against Time Warner Viacom currently has an open case against Time Warner
Cable, which could set precedents.Cable, which could set precedents.
Source: Company websites and Wells Fargo Securities, LLCSource: Company websites and Wells Fargo Securities, LLC
$0
$10,000
$20,000
$30,000
$40,000
$50,000
$60,000
'91-'9
2
'92-'9
3
'93-'9
4
'94-'9
5
'95-'9
6
'96-'9
7
'97-'9
8
'98-'9
9
'99-'0
0
'00-'0
1
'01-'0
2
'02-'0
3
'03-'0
4
'04-'0
5
'05-'0
6
'06-'0
7
'07-'0
8
'08-'0
9
'09-'1
0
0
10
20
30
40
50
60
Cable Ad $s Broadcast Ad $s
Cable Ratings ABC/CBS/NBC Broadcast Ratings
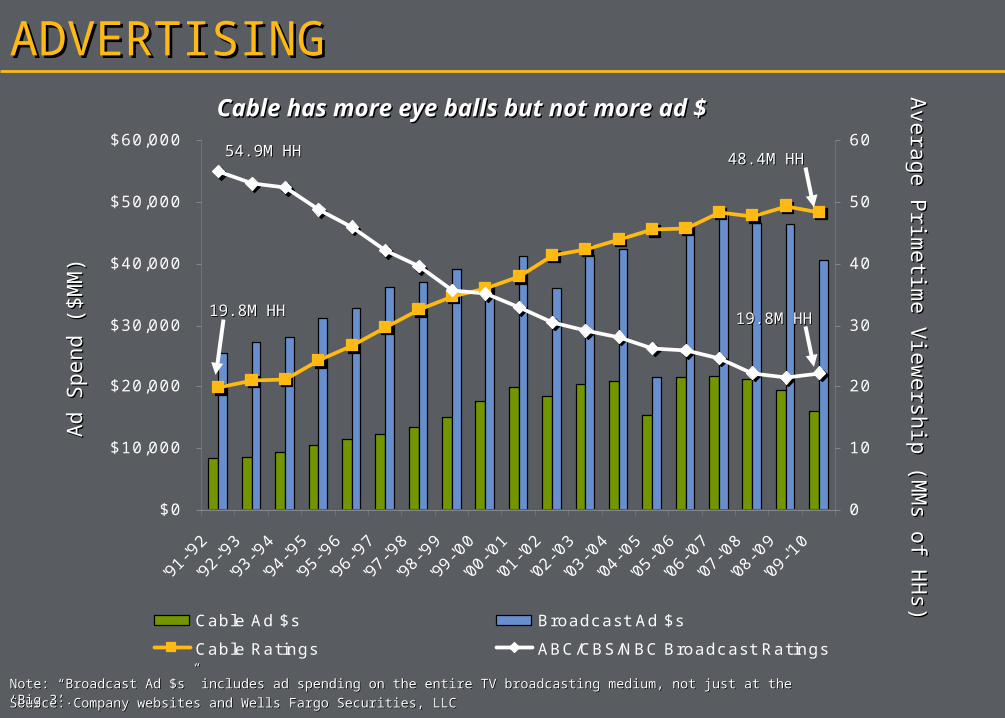
ADVERTISINGADVERTISING
Source: Company websites and Wells Fargo Securities, LLCSource: Company websites and Wells Fargo Securities, LLC
Ad S
pend (
$M
M)
Ad S
pend (
$M
M)
Avera
ge P
rimetim
e V
iew
ersh
ip (M
Ms o
f HH
s)A
vera
ge P
rimetim
e V
iew
ersh
ip (M
Ms o
f HH
s)Cable has more eye balls but not more ad Cable has more eye balls but not more ad $$
Note: “Broadcast Ad $s” includes ad spending on the entire TV broadcasting medium, not just at the ‘Big 3’.Note: “Broadcast Ad $s” includes ad spending on the entire TV broadcasting medium, not just at the ‘Big 3’.
54.9M HH54.9M HH 48.4M HH48.4M HH
19.8M HH19.8M HH 19.8M HH19.8M HH

$8.20
$5.15
$7.01
$16.09
$14.07
$4.18
$10.07
$13.20
$2.97
$6.94
$8.74
$0
$2
$4
$6
$8
$10
$12
$14
$16
$18
Early AM Daytime Early News Prime-time Late Evening Daytime Late Fringe Prime Access Daytime Early/late
Fringe
Prime-time
Broadcast Networks Syndication Cable
Television
ADVERTISING – CPM COMPARABLESADVERTISING – CPM COMPARABLES
Source: Company websites and Wells Fargo Securities, LLCSource: Company websites and Wells Fargo Securities, LLC
2009 Average TV CPM Rates2009 Average TV CPM Rates
Both broadcast and syndication have higher CPMs than cableBoth broadcast and syndication have higher CPMs than cable
COMMERCIAL SEGMENTCOMMERCIAL SEGMENT
Source: Company websites and Wells Fargo Securities, LLCSource: Company websites and Wells Fargo Securities, LLC
HIGHER ARPUHIGHER ARPU
HIGHER MARGINSHIGHER MARGINS
“ “BETTER VALUE” PROPOSITION, IN OUR BETTER VALUE” PROPOSITION, IN OUR VIEWVIEW
CELLULAR BACKHAULCELLULAR BACKHAUL
7878
OPPORTUNITIESOPPORTUNITIES
Source: Company websites, and Wells Fargo Securities, LLC
RESIDENTIAL HSDRESIDENTIAL HSD
TV EVERYWHERETV EVERYWHERE
ADVERTISINGADVERTISING
COMMERCIALCOMMERCIAL
7979
INVESTOR FOCUSINVESTOR FOCUS
Source: Company websites, and Wells Fargo Securities, LLC
SUBSCRIBERSSUBSCRIBERS
PROFITABILITYPROFITABILITY
CAPITAL RETURNSCAPITAL RETURNS
CAPITAL INTENSITYCAPITAL INTENSITY
M&AM&A
COMPETITIONCOMPETITION

8080
CAPITAL RETURNSCAPITAL RETURNS
Source: Company websites, and Wells Fargo Securities, LLCSource: Company websites, and Wells Fargo Securities, LLC
SHARE REPURCHASESSHARE REPURCHASES
Cablevision ($0.5B, 5% of shares outstanding)Cablevision ($0.5B, 5% of shares outstanding)
Comcast ($3B, 5% of shares outstanding)Comcast ($3B, 5% of shares outstanding)
DirecTV ($6B, 17% of shares outstanding)DirecTV ($6B, 17% of shares outstanding)
Dish Network ($1B, 10% of shares outstanding)Dish Network ($1B, 10% of shares outstanding)
Time Warner Cable ($4B, 17% of shares outstanding)Time Warner Cable ($4B, 17% of shares outstanding)
RECURRING DIVIDENDRECURRING DIVIDEND
Cablevision (1.52% Yield)Cablevision (1.52% Yield)
Comcast (1.88% Yield)Comcast (1.88% Yield)
Time Warner Cable (2.65%Yield)Time Warner Cable (2.65%Yield)
Note: Yields and current share repurchase plans as of 4/18/11Note: Yields and current share repurchase plans as of 4/18/11
8181
WHAT ABOUT…..?WHAT ABOUT…..?
Source: Company websites, and Wells Fargo Securities, LLC
THE ECONOMYTHE ECONOMY
WIRELESS DATAWIRELESS DATA
PROGRAM COSTSPROGRAM COSTS
OVER THE TOPOVER THE TOP
TELEPHONYTELEPHONY
REGULATORY ENVIRONMENTREGULATORY ENVIRONMENT

QUESTIONS?QUESTIONS?

83
DisclosuresDisclosures
83
To view price charts for all companies rated in this document, please go to https://www.wellsfargo.com/research or write to 7 Saint Paul Street, 1st Floor, R1230-011, Baltimore, MD 21202
ATTN: Research Publications Additional Information Available Upon Request
I certify that:1) All views expressed in this research report accurately reflect my personal views about any and all of the subject securities or issuers discussed; and 2) No part of my compensation was, is, or will be, directly or indirectly, related to the specific recommendations or views expressed by me in this research report.Wells Fargo Securities, LLC maintains a market in the common stock of Belo Corp., Cablevision Systems Corp., CBS Corporation, Clear Channel Outdoor Holdings, Inc., Comcast Corporation, DISH Network Corporation, Entercom Communications Corp., Gray Television, Inc., Lamar Advertising Company, LIN TV Corporation, Saga Communications, Inc., Sinclair Broadcast Group, Inc., The DIRECTV Group, Inc., Time Warner Cable Inc. Wells Fargo Securities, LLC or its affiliates managed or comanaged a public offering of securities for CBS Corporation, Gray Television, Inc., LIN TV Corporation, Time Warner Cable Inc. within the past 12 months. Wells Fargo Securities, LLC or its affiliates intends to seek or expects to receive compensation for investment banking services in the next three months from Belo Corp., CBS Corporation, Comcast Corporation, DISH Network Corporation, Gray Television, Inc., LIN TV Corporation, Sinclair Broadcast Group, Inc., The DIRECTV Group, Inc., Time Warner Cable Inc. Wells Fargo Securities, LLC or its affiliates received compensation for investment banking services from CBS Corporation, Clear Channel Outdoor Holdings, Inc., Comcast Corporation, Gray Television, Inc., LIN TV Corporation, Sinclair Broadcast Group, Inc., Time Warner Cable Inc. in the past 12 months. Wells Fargo Securities, LLC and/or its affiliates, have beneficial ownership of 1% or more of any class of the common stock of CBS Corporation, Clear Channel Outdoor Holdings, Inc. CBS Corporation, Clear Channel Outdoor Holdings, Inc., Comcast Corporation, Gray Television, Inc., LIN TV Corporation, Sinclair Broadcast Group, Inc., Time Warner Cable Inc. currently is, or during the 12-month period preceding the date of distribution of the research report was, a client of Wells Fargo Securities, LLC. Wells Fargo Securities, LLC provided investment banking services to CBS Corporation, Clear Channel Outdoor Holdings, Inc., Comcast Corporation, Gray Television, Inc., LIN TV Corporation, Sinclair Broadcast Group, Inc., Time Warner Cable Inc. CBS Corporation, Clear Channel Outdoor Holdings, Inc., Comcast Corporation currently is, or during the 12-month period preceding the date of distribution of the research report was, a client of Wells Fargo Securities, LLC. Wells Fargo Securities, LLC provided noninvestment banking securities-related services to CBS Corporation, Clear Channel Outdoor Holdings, Inc., Comcast Corporation. Gray Television, Inc. currently is, or during the 12-month period preceding the date of distribution of the research report was, a client of Wells Fargo Securities, LLC. Wells Fargo Securities, LLC provided nonsecurities services to Gray Television, Inc. Wells Fargo Securities, LLC received compensation for products or services other than investment banking services from CBS Corporation, Clear Channel Outdoor Holdings, Inc., Comcast Corporation, Gray Television, Inc. in the past 12 months. Wells Fargo Securities, LLC or its affiliates may have a significant financial interest in Belo Corp., Cablevision Systems Corp., CBS Corporation, Clear Channel Outdoor Holdings, Inc., Comcast Corporation, DISH Network Corporation, Entercom Communications Corp., Gray Television, Inc., Lamar Advertising Company, LIN TV Corporation, Saga Communications, Inc., Sinclair Broadcast Group, Inc., The DIRECTV Group, Inc., Time Warner Cable Inc.

84
DisclosuresDisclosures
84
STOCK RATING1=Outperform: The stock appears attractively valued, and we believe the stock's total return will exceed that of the market over the next 12 months. BUY2=Market Perform: The stock appears appropriately valued, and we believe the stock's total return will be in line with the market over the next 12 months. HOLD3=Underperform: The stock appears overvalued, and we believe the stock's total return will be below the market over the next 12 months. SELL
SECTOR RATINGO=Overweight: Industry expected to outperform the relevant broad market benchmark over the next 12 months.M=Market Weight: Industry expected to perform in-line with the relevant broad market benchmark over the next 12 months.U=Underweight: Industry expected to underperform the relevant broad market benchmark over the next 12 months.
VOLATILITY RATINGV = A stock is defined as volatile if the stock price has fluctuated by +/-20% or greater in at least 8 of the past 24 months or if the analyst expects significant volatility. All IPO stocks are automatically rated volatile within the first 24 months of trading.As of: 4/18/2011 45% of companies covered by Wells Fargo Securities, LLC Equity Research are rated Outperform. Wells Fargo Securities, LLC has provided investment banking services for 38% of its Equity Research Outperform-rated companies. 52% of companies covered by Wells Fargo Securities, LLC Equity Research are rated Market Perform.Wells Fargo Securities, LLC has provided investment banking services for 47% of its Equity Research Market Perform-rated companies. 3% of companies covered by Wells Fargo Securities, LLC Equity Research are rated Underperform. Wells Fargo Securities, LLC has provided investment banking services for 42% of its Equity Research Underperform-rated companies.
Important Information for Non-U.S. Recipients EEA – The securities and related financial instruments described herein may not be eligible for sale in all jurisdictions or to certain categories of investors. For recipients in the EEA, this report is distributed by Wells Fargo Securities International Limited (“WFSIL”). WFSIL is a U.K. incorporated investment firm authorized and regulated by the Financial Services Authority. For the purposes of Section 21 of the UK Financial Services and Markets Act 2000 (“the Act”), the content of this report has been approved by WFSIL a regulated person under the Act. WFSIL does not deal with retail clients as defined in the Markets in Financial Instruments Directive 2007. The FSA rules made under the Financial Services and Markets Act 2000 for the protection of retail clients will therefore not apply, nor will the Financial Services Compensation Scheme be available. This report is not intended for, and should not be relied upon by, retail clients.
Marci L. Ryvicker, CPA, CFA
Harrisburg, PA
April 2011
Please see page 82 for rating definitions, important disclosures and required analyst certifications.
Wells Fargo Securities, LLC does and seeks to do business with companies covered in its research reports. As a result, investors should be aware that the firm may have a conflict of interest that could affect the objectivity of the report and investors should consider this report as only a single factor in making their investment decision.
Cable: A Look At Trends & OpportunitiesCable: A Look At Trends & OpportunitiesPast, Present and FuturePast, Present and Future