march 31, 2018 simplicity is the ultimate sophistication · simplicity is the ultimate...
TRANSCRIPT
ADVISOR SEMINAR MATERIALSADVISOR SEMINAR MATERIALS
MARCH 31, 2018
Simplicity Is the Ultimate SophisticationHartford Balanced Income Fund

The Golden Ratio in art Leonardo da Vinci wrote about the Golden Ratio extensively and featured it in his paintings to achieve simple beauty. Michelangelo applied it in “The Creation of Adam” on the ceiling of the Sistine Chapel. When you view a work of art in its frame, the Golden Ratio is often apparent.
1
The Golden Ratio is a special number that speaks to beauty,
symmetry, and proportionality in art, architecture, and nature.
Originally discovered by mathematicians, the Golden Ratio can be
observed in objects as simple as a flower and as enduring as the
Great Pyramids in Egypt. Its dimensions provide a sense of balance,
beauty, and order, and it’s a timeless example of the power of using
simple solutions to tackle complex challenges.
Investing today can feel like a complex challenge. But it doesn’t have
to be. Let’s explore some concepts that can help make you a better
investor, and a simple strategy that has historically provided a positive
experience for investors: Hartford Balanced Income Fund.
1
“Simplicity Is the Ultimate Sophistication.”— Leonardo da Vinci
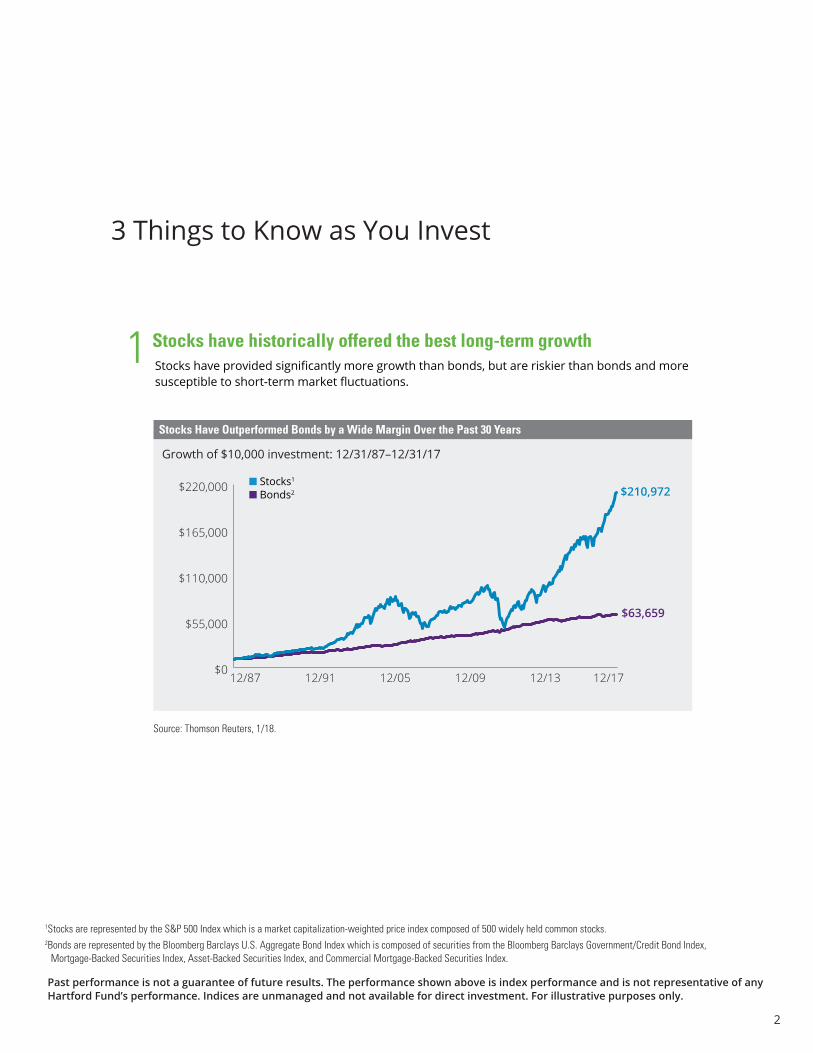
Stocks have historically offered the best long-term growthStocks have provided significantly more growth than bonds, but are riskier than bonds and more susceptible to short-term market fluctuations.
Source: Thomson Reuters, 1/18.
3 Things to Know as You Invest
Past performance is not a guarantee of future results. The performance shown above is index performance and is not representative of any Hartford Fund’s performance. Indices are unmanaged and not available for direct investment. For illustrative purposes only.
2
$210,972
$63,659
$0
$55,000
$110,000
$165,000
$220,000
5/00 5/03 5/06 5/09 5/12 12/14
0%
2%
4%
6%
8%
10%
12/87 12/91 12/05 12/09 12/13 12/17
12/87 12/91 12/05 12/09 12/13 12/17
-37.00%
-2.02%
-22.10%
-11.89%-9.10%
-0.82%-2.92%-3.10% -3.10-9.10
-11.89
-22.10
-37.00
-2.92 -0.82 -2.02
n Stocks1
n Bonds2
Growth of $10,000 investment: 12/31/87–12/31/17
1Stocks are represented by the S&P 500 Index which is a market capitalization-weighted price index composed of 500 widely held common stocks. 2Bonds are represented by the Bloomberg Barclays U.S. Aggregate Bond Index which is composed of securities from the Bloomberg Barclays Government/Credit Bond Index,
Mortgage-Backed Securities Index, Asset-Backed Securities Index, and Commercial Mortgage-Backed Securities Index.
1
Stocks Have Outperformed Bonds by a Wide Margin Over the Past 30 Years
3
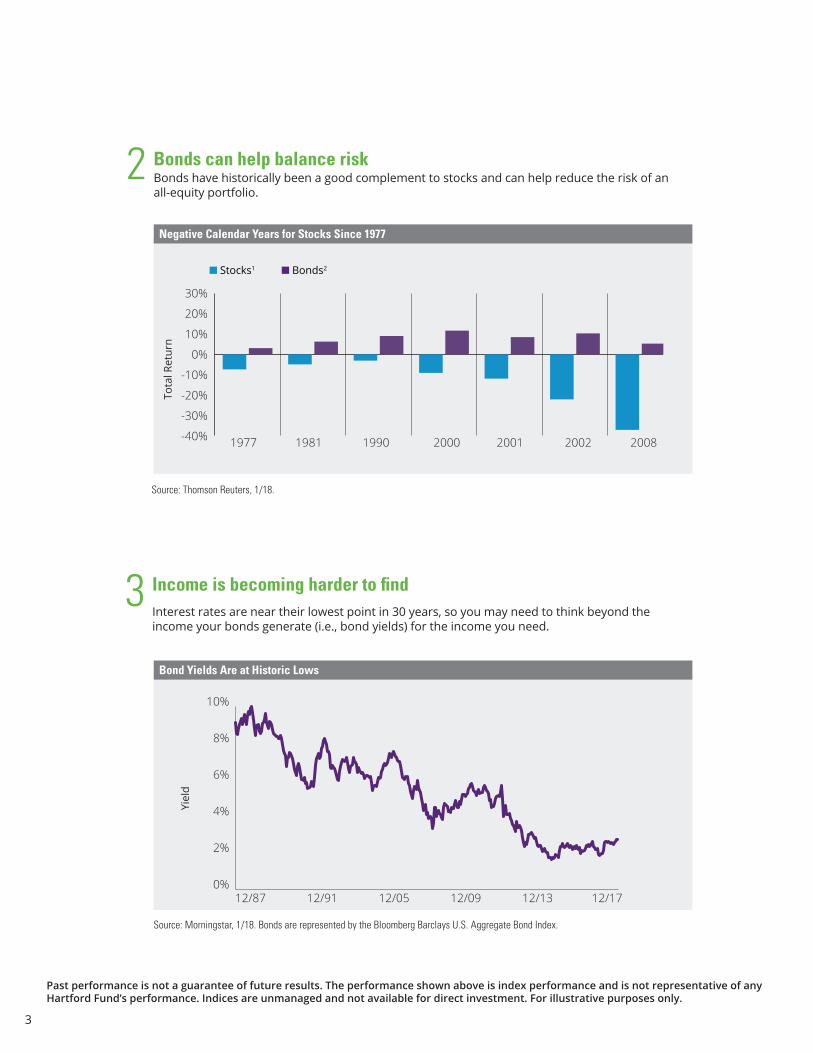
Bonds can help balance risk
Income is becoming harder to find
Bonds have historically been a good complement to stocks and can help reduce the risk of an all-equity portfolio.
Interest rates are near their lowest point in 30 years, so you may need to think beyond the income your bonds generate (i.e., bond yields) for the income you need.
Source: Morningstar, 1/18. Bonds are represented by the Bloomberg Barclays U.S. Aggregate Bond Index.
n Stocks1 n Bonds2
$210,972
$63,659
$0
$55,000
$110,000
$165,000
$220,000
5/00 5/03 5/06 5/09 5/12 12/14
0%
2%
4%
6%
8%
10%
12/87 12/91 12/05 12/09 12/13 12/17
12/87 12/91 12/05 12/09 12/13 12/17
-37.00%
-2.02%
-22.10%
-11.89%-9.10%
-0.82%-2.92%-3.10% -3.10-9.10
-11.89
-22.10
-37.00
-2.92 -0.82 -2.02
-40%
-30%
-20%
-10%
0%
10%
20%
30%
1977 1981 1990 2000 2001 2002 2008
-40%
-30%
-20%
-10%
0%
10%
20%
30%
1977 1981 1990 1994 1999 2000 2001 2002 2008
Source: Thomson Reuters, 1/18.
2
3
Tota
l Ret
urn
Yiel
d
Past performance is not a guarantee of future results. The performance shown above is index performance and is not representative of any Hartford Fund’s performance. Indices are unmanaged and not available for direct investment. For illustrative purposes only.
Please take a look at the placement of disclosures above, thanks!
Negative Calendar Years for Stocks Since 1977
Bond Yields Are at Historic Lows
-0.2% 14.8% 29.8%2.4%
5.9%
9.4%
3.50% 9.50% 15.50% 21.50%1.65%
5.65%
9.65%
5.0% 12.5% 20.0%3.0%
6.0%
9.0%
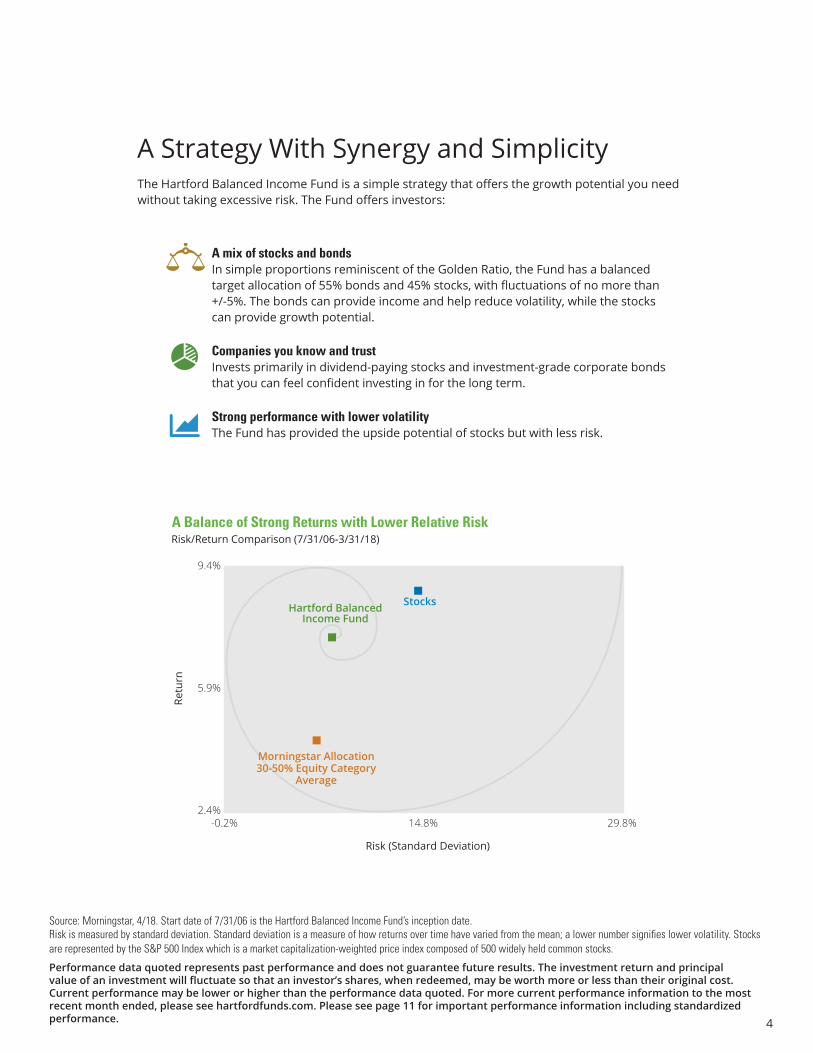
The Hartford Balanced Income Fund is a simple strategy that offers the growth potential you need without taking excessive risk. The Fund offers investors:
A Strategy With Synergy and Simplicity
4
A Balance of Strong Returns with Lower Relative Risk
Hartford Balanced Income Fund
Morningstar Allocation 30-50% Equity Category
Average
Stocks
Risk (Standard Deviation)
Retu
rn
Source: Morningstar, 4/18. Start date of 7/31/06 is the Hartford Balanced Income Fund’s inception date.Risk is measured by standard deviation. Standard deviation is a measure of how returns over time have varied from the mean; a lower number signifies lower volatility. Stocks are represented by the S&P 500 Index which is a market capitalization-weighted price index composed of 500 widely held common stocks.
Performance data quoted represents past performance and does not guarantee future results. The investment return and principal value of an investment will fluctuate so that an investor’s shares, when redeemed, may be worth more or less than their original cost. Current performance may be lower or higher than the performance data quoted. For more current performance information to the most recent month ended, please see hartfordfunds.com. Please see page 11 for important performance information including standardized performance.
A mix of stocks and bonds In simple proportions reminiscent of the Golden Ratio, the Fund has a balanced target allocation of 55% bonds and 45% stocks, with fluctuations of no more than +/-5%. The bonds can provide income and help reduce volatility, while the stocks can provide growth potential.
Companies you know and trust Invests primarily in dividend-paying stocks and investment-grade corporate bonds that you can feel confident investing in for the long term.
Strong performance with lower volatility The Fund has provided the upside potential of stocks but with less risk.
Risk/Return Comparison (7/31/06-3/31/18)
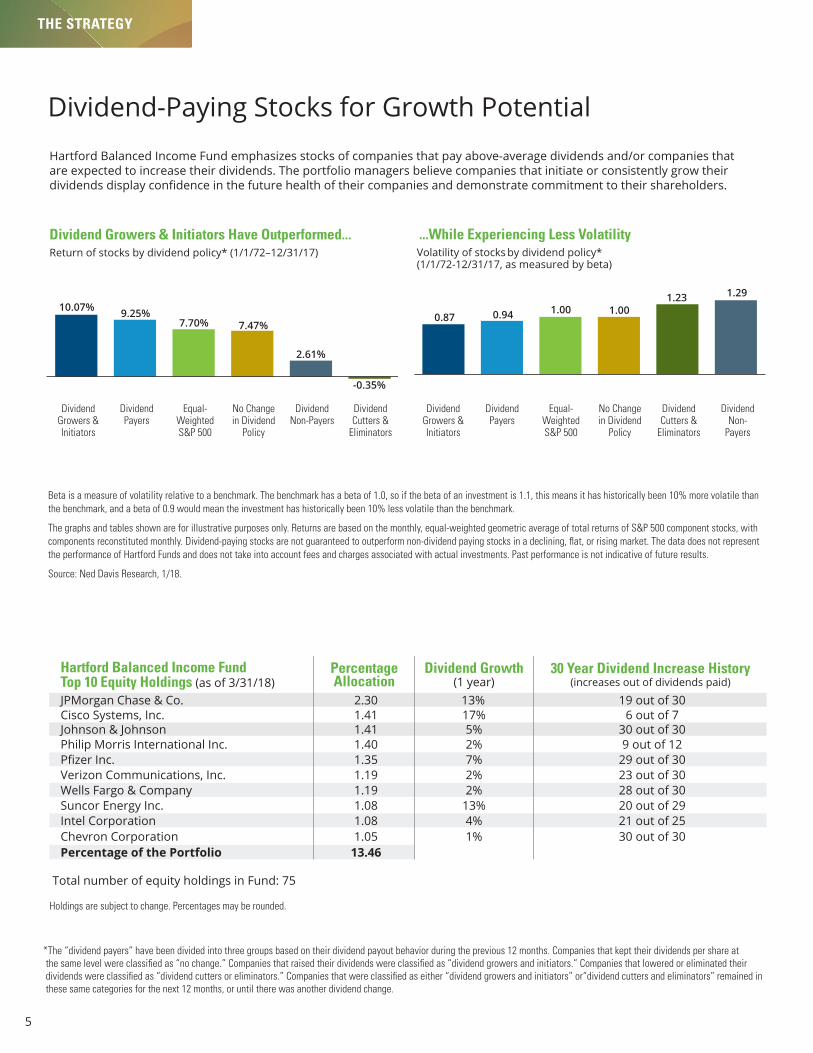
Dividend-Paying Stocks for Growth Potential
Dividend Growers & Initiators Have Outperformed...
Dividend Growers & Initiators
Dividend Payers
Equal-Weighted S&P 500
No Change in Dividend
Policy
Dividend Non-Payers
Dividend Cutters &
Eliminators
0.0%
0.3%
0.6%
0.9%
1.2%
1.5% 1.291.231.001.000.940.87
10.07% 9.25%7.70% 7.47%
2.61%
-0.35%0.0%
0.3%
0.6%
0.9%
1.2%
1.5% 1.291.231.001.000.940.87
10.07% 9.25%7.70% 7.47%
2.61%
-0.35%
Return of stocks by dividend policy* (1/1/72–12/31/17) ...While Experiencing Less VolatilityVolatility of stocks by dividend policy* (1/1/72-12/31/17, as measured by beta)
Dividend Growers & Initiators
Dividend Payers
Equal-Weighted S&P 500
No Change in Dividend
Policy
Dividend Cutters &
Eliminators
Dividend Non-
Payers
5
Beta is a measure of volatility relative to a benchmark. The benchmark has a beta of 1.0, so if the beta of an investment is 1.1, this means it has historically been 10% more volatile than the benchmark, and a beta of 0.9 would mean the investment has historically been 10% less volatile than the benchmark.
The graphs and tables shown are for illustrative purposes only. Returns are based on the monthly, equal-weighted geometric average of total returns of S&P 500 component stocks, with components reconstituted monthly. Dividend-paying stocks are not guaranteed to outperform non-dividend paying stocks in a declining, fl at, or rising market. The data does not represent the performance of Hartford Funds and does not take into account fees and charges associated with actual investments. Past performance is not indicative of future results.
Source: Ned Davis Research, 1/18.
*The “dividend payers” have been divided into three groups based on their dividend payout behavior during the previous 12 months. Companies that kept their dividends per share at the same level were classifi ed as “no change.” Companies that raised their dividends were classifi ed as “dividend growers and initiators.” Companies that lowered or eliminated their dividends were classifi ed as “dividend cutters or eliminators.” Companies that were classifi ed as either “dividend growers and initiators” or“dividend cutters and eliminators” remained in these same categories for the next 12 months, or until there was another dividend change.
THE STRATEGY
Total number of equity holdings in Fund: 75
Hartford Balanced Income FundTop 10 Equity Holdings (as of 3/31/18)
Percentage Allocation
Dividend Growth (1 year)
30 Year Dividend Increase History(increases out of dividends paid)
JPMorgan Chase & Co. 2.30 13% 19 out of 30Cisco Systems, Inc. 1.41 17% 6 out of 7Johnson & Johnson 1.41 5% 30 out of 30Philip Morris International Inc. 1.40 2% 9 out of 12Pfi zer Inc. 1.35 7% 29 out of 30Verizon Communications, Inc. 1.19 2% 23 out of 30Wells Fargo & Company 1.19 2% 28 out of 30Suncor Energy Inc. 1.08 13% 20 out of 29Intel Corporation 1.08 4% 21 out of 25Chevron Corporation 1.05 1% 30 out of 30Percentage of the Portfolio 13.46
Hartford Balanced Income Fund emphasizes stocks of companies that pay above-average dividends and/or companies that are expected to increase their dividends. The portfolio managers believe companies that initiate or consistently grow their dividends display confi dence in the future health of their companies and demonstrate commitment to their shareholders.
Holdings are subject to change. Percentages may be rounded.
The Golden Ratio in architecture Many celebrated buildings reflect the Golden Ratio in their proportions. Architects believed simple rectangular facades and dimensions were most pleasing to the eye.
6
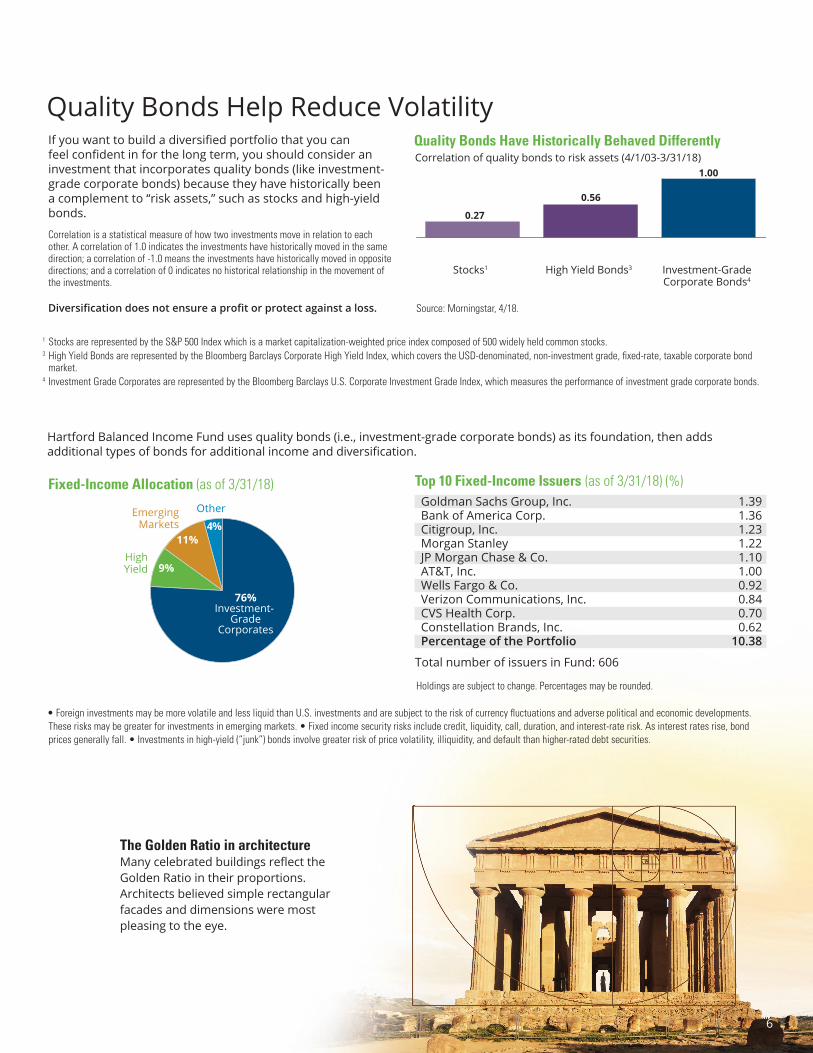
Hartford Balanced Income Fund uses quality bonds (i.e., investment-grade corporate bonds) as its foundation, then adds additional types of bonds for additional income and diversification.
Quality Bonds Help Reduce VolatilityQuality Bonds Have Historically Behaved Differently
0.56
1.00
0.27
0.57
1.00
0.24
0.69
1.00
0.21
0.75
1.00
0.07
-15.81
-33.53
-3.32
0.660.19
Stocks1 High Yield Bonds3 Investment-Grade Corporate Bonds4
Top 10 Fixed-Income Issuers (as of 3/31/18) (%)Goldman Sachs Group, Inc. 1.39Bank of America Corp. 1.36Citigroup, Inc. 1.23Morgan Stanley 1.22JP Morgan Chase & Co. 1.10AT&T, Inc. 1.00Wells Fargo & Co. 0.92Verizon Communications, Inc. 0.84CVS Health Corp. 0.70Constellation Brands, Inc. 0.62Percentage of the Portfolio 10.38
11%
76%Investment-
GradeCorporates
4%
9%HighYield
OtherEmergingMarkets
10%
80%Investment
Grade
10%HighYield
EmergingMarkets
Fixed-Income Allocation (as of 3/31/18)
Correlation of quality bonds to risk assets (4/1/03-3/31/18)
Total number of issuers in Fund: 606
Source: Morningstar, 4/18.
1 Stocks are represented by the S&P 500 Index which is a market capitalization-weighted price index composed of 500 widely held common stocks.3 High Yield Bonds are represented by the Bloomberg Barclays Corporate High Yield Index, which covers the USD-denominated, non-investment grade, fixed-rate, taxable corporate bond
market.4 Investment Grade Corporates are represented by the Bloomberg Barclays U.S. Corporate Investment Grade Index, which measures the performance of investment grade corporate bonds.
• Foreign investments may be more volatile and less liquid than U.S. investments and are subject to the risk of currency fluctuations and adverse political and economic developments. These risks may be greater for investments in emerging markets. • Fixed income security risks include credit, liquidity, call, duration, and interest-rate risk. As interest rates rise, bond prices generally fall. • Investments in high-yield (“junk”) bonds involve greater risk of price volatility, illiquidity, and default than higher-rated debt securities.
Correlation is a statistical measure of how two investments move in relation to each other. A correlation of 1.0 indicates the investments have historically moved in the same direction; a correlation of -1.0 means the investments have historically moved in opposite directions; and a correlation of 0 indicates no historical relationship in the movement of the investments.
Diversification does not ensure a profit or protect against a loss.
If you want to build a diversified portfolio that you can feel confident in for the long term, you should consider an investment that incorporates quality bonds (like investment-grade corporate bonds) because they have historically been a complement to “risk assets,” such as stocks and high-yield bonds.
Holdings are subject to change. Percentages may be rounded.
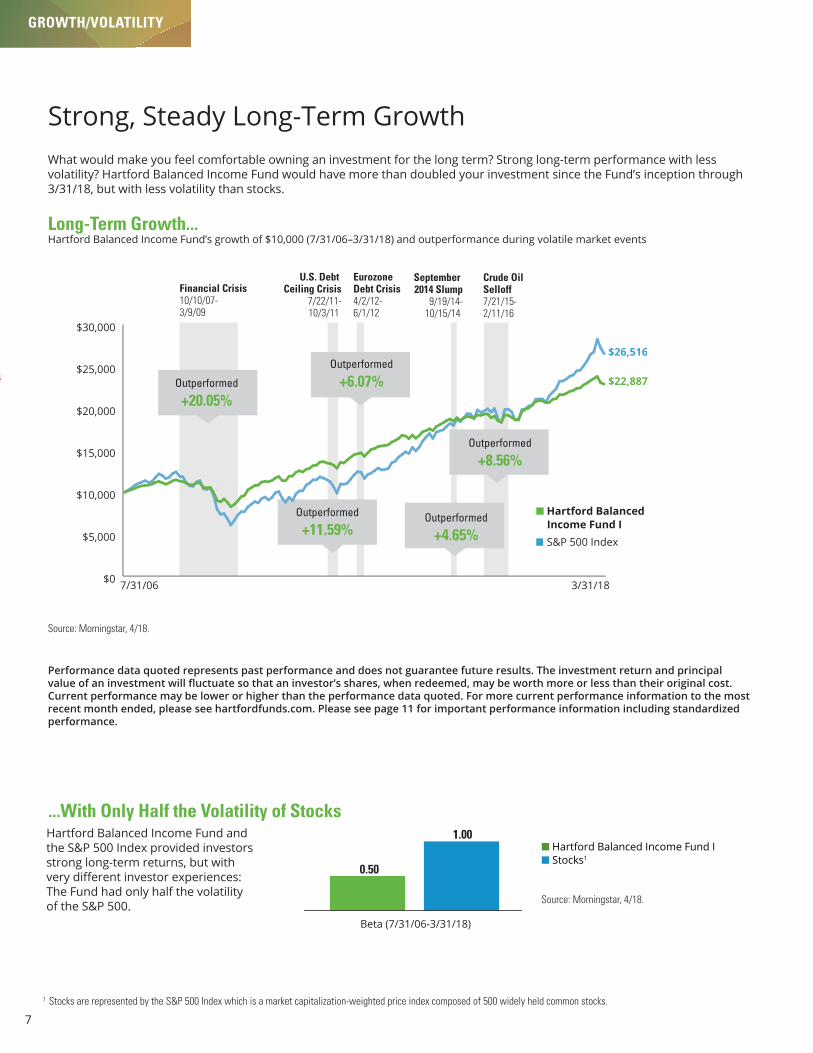
What would make you feel comfortable owning an investment for the long term? Strong long-term performance with less volatility? Hartford Balanced Income Fund would have more than doubled your investment since the Fund’s inception through 3/31/18, but with less volatility than stocks.
Long-Term Growth...
Strong, Steady Long-Term Growth
Performance data quoted represents past performance and does not guarantee future results. The investment return and principal value of an investment will fl uctuate so that an investor’s shares, when redeemed, may be worth more or less than their original cost. Current performance may be lower or higher than the performance data quoted. For more current performance information to the most recent month ended, please see hartfordfunds.com. Please see page 11 for important performance information including standardized performance.
7
Source: Morningstar, 4/18.
GROWTH/VOLATILITY
Hartford Balanced Income Fund’s growth of $10,000 (7/31/06–3/31/18) and outperformance during volatile market events
Hartford Balanced Income Fund and the S&P 500 Index provided investors strong long-term returns, but with very diff erent investor experiences: The Fund had only half the volatility of the S&P 500.
...With Only Half the Volatility of Stocks
n Hartford Balanced Income Fund I n Stocks1
Source: Morningstar, 4/18.
0.50
1.00
0.50
1.00
0.50
1.00
7.48% 8.01%
-18.5%
-37.0%
22.4% 26.5%
8.7%2.1%
Beta (7/31/06-3/31/18)
1 Stocks are represented by the S&P 500 Index which is a market capitalization-weighted price index composed of 500 widely held common stocks.
same exact chart as what’s used in WI002
$11000
$16500
$22000
HARTFORD BALANCED INCOME FUND
$20K $10K
TO
GROWTH OF
HALFWITH ONLY
THE VOLATILITY
OF THE S&P 500
Financial Crisis10/10/07-3/9/09
September 2014 Slump
9/19/14-10/15/14
Crude Oil Selloff7/21/15-2/11/16
U.S. Debt Ceiling Crisis
7/22/11-10/3/11
Eurozone Debt Crisis4/2/12-6/1/12
$26,516
$22,887
7/31/06 3/31/18
� Hartford Balanced Income Fund I� S&P 500 Index
Outperformed
+20.05%
Outperformed
+11.59%
Outperformed
+6.07%
$0
$5,000
$10,000
$15,000
$20,000
$25,000
$30,000
Outperformed
+4.65%
Outperformed
+8.56%
The Golden Ratio in natureThe shapes of fl owers often follow the Golden Ratio. Simple spiral patterns allow older petals to get sunlight, even as new ones appear. Their off setting surfaces allow for the maximum fl ow of water to the roots.
-18.53%
-37.00%
22.42%26.46%
8.70%2.11%
-18.53%
-37.00%
22.42%26.46%
8.83%2.11%
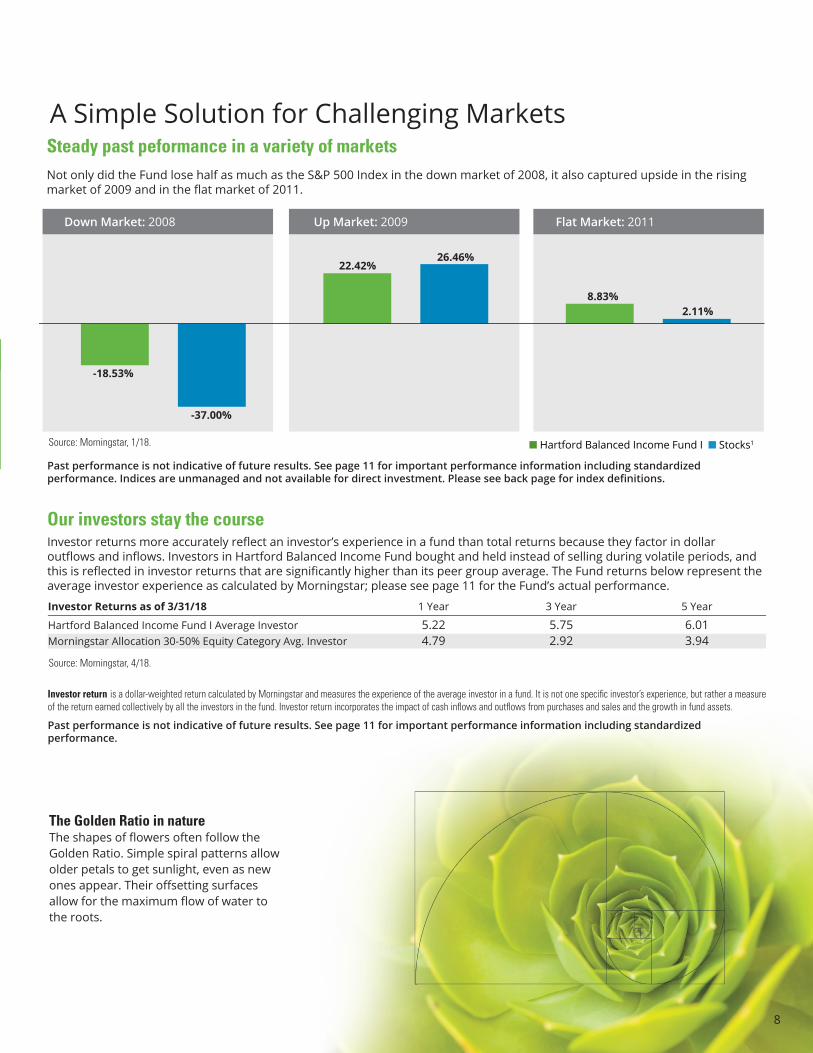
Steady past peformance in a variety of markets
A Simple Solution for Challenging Markets
8
n Hartford Balanced Income Fund I n Stocks1
Investor return is a dollar-weighted return calculated by Morningstar and measures the experience of the average investor in a fund. It is not one specifi c investor’s experience, but rather a measure of the return earned collectively by all the investors in the fund. Investor return incorporates the impact of cash infl ows and outfl ows from purchases and sales and the growth in fund assets.
Past performance is not indicative of future results. See page 11 for important performance information including standardized performance.
Our investors stay the courseInvestor returns more accurately refl ect an investor’s experience in a fund than total returns because they factor in dollar outfl ows and infl ows. Investors in Hartford Balanced Income Fund bought and held instead of selling during volatile periods, and this is refl ected in investor returns that are signifi cantly higher than its peer group average. The Fund returns below represent the average investor experience as calculated by Morningstar; please see page 11 for the Fund’s actual performance.
Source: Morningstar, 1/18.
Investor Returns as of 3/31/18 1 Year 3 Year 5 Year
Hartford Balanced Income Fund I Average Investor 5.22 5.75 6.01Morningstar Allocation 30-50% Equity Category Avg. Investor 4.79 2.92 3.94
Not only did the Fund lose half as much as the S&P 500 Index in the down market of 2008, it also captured upside in the rising market of 2009 and in the fl at market of 2011.
Source: Morningstar, 4/18.
Past performance is not indicative of future results. See page 11 for important performance information including standardized performance. Indices are unmanaged and not available for direct investment. Please see back page for index defi nitions.
Down Market: 2008 Up Market: 2009 Flat Market: 2011
$11000
$16500
$22000
HARTFORD BALANCED INCOME FUND
$20K $10K
TO
GROWTH OF
HALFWITH ONLY
THE VOLATILITY
OF THE S&P 500
Financial Crisis10/10/07-3/9/09
September 2014 Slump
9/19/14-10/15/14
Crude Oil Selloff7/21/15-2/11/16
U.S. Debt Ceiling Crisis
7/22/11-10/3/11
Eurozone Debt Crisis4/2/12-6/1/12
$22,887
7/31/06 3/31/18
� Hartford Balanced Income Fund I
S&P 500 Index
Outperformed
+20.05%
Outperformed
+11.59%
Outperformed
+6.07%
$0
$5,000
$10,000
$15,000
$20,000
$25,000
$30,000
Outperformed
+4.65%
Outperformed
+8.56%
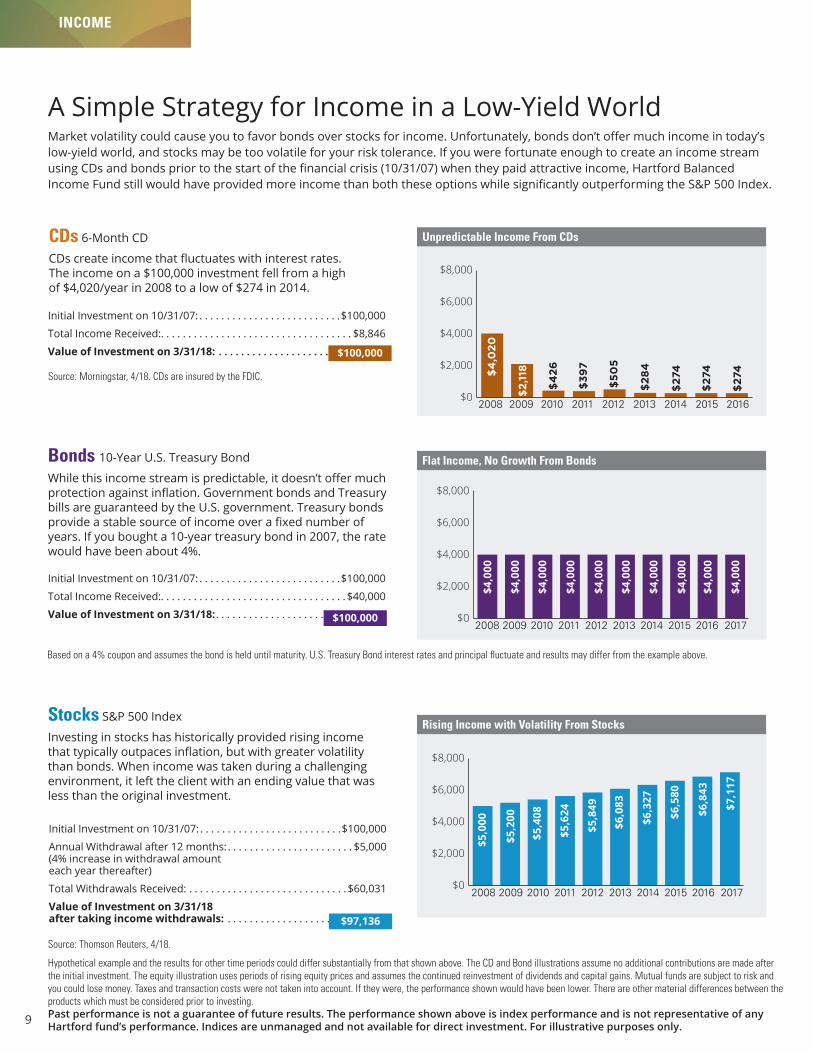
Market volatility could cause you to favor bonds over stocks for income. Unfortunately, bonds don’t off er much income in today’s low-yield world, and stocks may be too volatile for your risk tolerance. If you were fortunate enough to create an income stream using CDs and bonds prior to the start of the fi nancial crisis (10/31/07) when they paid attractive income, Hartford Balanced Income Fund still would have provided more income than both these options while signifi cantly outperforming the S&P 500 Index.
A Simple Strategy for Income in a Low-Yield World
Bonds 10-Year U.S. Treasury Bond
While this income stream is predictable, it doesn’t off er much protection against infl ation. Government bonds and Treasury bills are guaranteed by the U.S. government. Treasury bonds provide a stable source of income over a fi xed number of years. If you bought a 10-year treasury bond in 2007, the rate would have been about 4%.
Stocks S&P 500 Index
Investing in stocks has historically provided rising income that typically outpaces infl ation, but with greater volatility than bonds. When income was taken during a challenging environment, it left the client with an ending value that was less than the original investment.
Initial Investment on 10/31/07: . . . . . . . . . . . . . . . . . . . . . . . . . .$100,000
Total Income Received:. . . . . . . . . . . . . . . . . . . . . . . . . . . . . . . . . .$40,000
Value of Investment on 3/31/18:. . . . . . . . . . . . . . . . . . . . . . . . . . . . . . .
Initial Investment on 10/31/07: . . . . . . . . . . . . . . . . . . . . . . . . . .$100,000
Annual Withdrawal after 12 months: . . . . . . . . . . . . . . . . . . . . . . . $5,000 (4% increase in withdrawal amounteach year thereafter)
Total Withdrawals Received: . . . . . . . . . . . . . . . . . . . . . . . . . . . . .$60,031
Value of Investment on 3/31/18 after taking income withdrawals: . . . . . . . . . . . . . . . . . . . . . . . . . . . . .
$181,934
$0
$20,000
$40,000
$60,000
$80,000
$100,000
$120,000
$0
$20000
$40000
$60000
$80000
$100000
$120000
$106,519
$88,923
10/2007 2008 2009 2010 2011 2012 2013 12/2014$0
$20,000
$40,000
$60,000
$80,000
$100,000
$120,000
$106,519
$88,923
10/2007 2008 2009 2010 2011 2012 2013 12/2014
$0
$20,000
$40,000
$60,000
$80,000
$100,000
$120,000
$107,954
$97,136
10/07 2008 2009 2010 2011 2012 2013 2014 2015 2016 2017 3/18$0
$20,000
$40,000
$60,000
$80,000
$100,000
$120,000
$108,332
$97,879
10/07 2008 2009 2010 2011 2012 2013 2014 2015 2016 12/17
$0
$2,000
$4,000
$6,000
$8,000
$0
$2,000
$4,000
$6,000
$8,000
$0
$2,000
$4,000
$6,000
$8,000
$0
$2,000
$4,000
$6,000
$8,000$4,000
$4,000
$4,000
$4,000
$4,000
$4,000
$4,000
$4,000
$4,000
$4,000$5,000
$5,098
$4,634
$5,295
$5,210
$1,835
$904
$501
$76
2
$2,118
$42
$426
$29
$397
$26
$505
$21
$284
$10
$274
$274
$274
$1,76
4$3,774
$4,709
$3,247
$4,020
$5,000
$5,200
$5,408
$5,624
$5,849
$6,083
$6,327
$6,580
$6,843
$7,117
$7,401
$7,697
$8,005
$8,325
$8,658
$0
$2,000
$4,000
$6,000
$8,000
$5,637
$5,672
$5,138 $6,331
$5,252
$2,130
$1,348
$1,318
$1,977
$401
$240
$2,959
$4,844
$5,315
$3,825
97 98 99 00 01 02 03 04 05 06 07 08 09 10 11
97 98 99 00 01 02 03 04 05 06 07 08 09 10 11
97 99 01 03 05 07 09 11 13 14
2008 2009 2010 2011 2012 2013 2014 2015 2016
2008 2009 2010 2011 2012 2013 2014 2015 2016 2017 2008 2009 2010 2011 2012 2013 2014 2015 2016 2017$0
$2,000
$4,000
$6,000
$8,000
$5,000
$5,200
$5,408
$5,624
$5,849
$6,083
$6,327
$6,580
$6,843
$7,117
2008 2009 2010 2011 2012 2013 2014 2015 2016 2017$0
$2,000
$4,000
$6,000
$8,000
$5,000
$5,200
$5,408
$5,624
$5,849
$6,083
$6,327
$6,580
$6,843
$7,117
5877
5582
5596
6786
3702
1821
1174
1750
3787
5361
5354
3181
878
442
422
438
135
$0
$2,000
$4,000
$6,000
$8,000
$0
$2,000
$4,000
$6,000
$8,000
$0
$2,000
$4,000
$6,000
$8,000
$0
$2,000
$4,000
$6,000
$8,000
$4,000
$4,000
$4,000
$4,000
$4,000
$4,000
$4,000
$4,000
$4,000
$4,000$5,000
$5,098
$4,634
$5,295
$5,210
$1,835
$904
$501
$76
2
$2,118
$42
$426
$29
$397
$26
$505
$21
$284
$10
$274
$274
$274
$1,76
4$3,774
$4,709
$3,247
$4,020
$5,000
$5,200
$5,408
$5,624
$5,849
$6,083
$6,327
$6,580
$6,843
$7,117
$7,401
$7,697
$8,005
$8,325
$8,658
$0
$2,000
$4,000
$6,000
$8,000
$5,637
$5,672
$5,138 $6,331
$5,252
$2,130
$1,348
$1,318
$1,977
$401
$240
$2,959
$4,844
$5,315
$3,825
97 98 99 00 01 02 03 04 05 06 07 08 09 10 11
97 98 99 00 01 02 03 04 05 06 07 08 09 10 11
97 99 01 03 05 07 09 11 13 14
2008 2009 2010 2011 2012 2013 2014 2015 2016
2008 2009 2010 2011 2012 2013 2014 2015 2016 2017 2008 2009 2010 2011 2012 2013 2014 2015 2016 2017$0
$2,000
$4,000
$6,000
$8,000
$5,000
$5,200
$5,408
$5,624
$5,849
$6,083
$6,327
$6,580
$6,843
$7,117
2008 2009 2010 2011 2012 2013 2014 2015 2016 2017$0
$2,000
$4,000
$6,000
$8,000
$5,000
$5,200
$5,408
$5,624
$5,849
$6,083
$6,327
$6,580
$6,843
$7,117
5877
5582
5596
6786
3702
1821
1174
1750
3787
5361
5354
3181
878
442
422
438
135
Based on a 4% coupon and assumes the bond is held until maturity. U.S. Treasury Bond interest rates and principal fl uctuate and results may differ from the example above.
Source: Thomson Reuters, 4/18.
Hypothetical example and the results for other time periods could differ substantially from that shown above. The CD and Bond illustrations assume no additional contributions are made after the initial investment. The equity illustration uses periods of rising equity prices and assumes the continued reinvestment of dividends and capital gains. Mutual funds are subject to risk and you could lose money. Taxes and transaction costs were not taken into account. If they were, the performance shown would have been lower. There are other material differences between the products which must be considered prior to investing.Past performance is not a guarantee of future results. The performance shown above is index performance and is not representative of any Hartford fund’s performance. Indices are unmanaged and not available for direct investment. For illustrative purposes only.
$100,000
$97,136
9
$0
$2,000
$4,000
$6,000
$8,000
$0
$2,000
$4,000
$6,000
$8,000
$0
$2,000
$4,000
$6,000
$8,000
$0
$2,000
$4,000
$6,000
$8,000
$4,000
$4,000
$4,000
$4,000
$4,000
$4,000
$4,000
$4,000
$4,000
$4,000$5,000
$5,098
$4,634
$5,295
$5,210
$1,835
$904
$501
$76
2
$2,118
$42
$426
$29
$397
$26
$505
$21
$284
$10
$274
$274
$274
$1,76
4$3,774
$4,709
$3,247
$4,020
$5,000
$5,200
$5,408
$5,624
$5,849
$6,083
$6,327
$6,580
$6,843
$7,117
$7,401
$7,697
$8,005
$8,325
$8,658
$0
$2,000
$4,000
$6,000
$8,000
$5,637
$5,672
$5,138 $6,331
$5,252
$2,130
$1,348
$1,318
$1,977
$401
$240
$2,959
$4,844
$5,315
$3,825
97 98 99 00 01 02 03 04 05 06 07 08 09 10 11
97 98 99 00 01 02 03 04 05 06 07 08 09 10 11
97 99 01 03 05 07 09 11 13 14
2008 2009 2010 2011 2012 2013 2014 2015 2016
2008 2009 2010 2011 2012 2013 2014 2015 2016 2017 2008 2009 2010 2011 2012 2013 2014 2015 2016 2017$0
$2,000
$4,000
$6,000
$8,000
$5,000
$5,200
$5,408
$5,624
$5,849
$6,083
$6,327
$6,580
$6,843
$7,117
2008 2009 2010 2011 2012 2013 2014 2015 2016 2017$0
$2,000
$4,000
$6,000
$8,000
$5,000
$5,200
$5,408
$5,624
$5,849
$6,083
$6,327
$6,580
$6,843
$7,117
5877
5582
5596
6786
3702
1821
1174
1750
3787
5361
5354
3181
878
442
422
438
135
CDs 6-Month CD
CDs create income that fl uctuates with interest rates. The income on a $100,000 investment fell from a high of $4,020/year in 2008 to a low of $274 in 2014.
Initial Investment on 10/31/07: . . . . . . . . . . . . . . . . . . . . . . . . . .$100,000
Total Income Received:. . . . . . . . . . . . . . . . . . . . . . . . . . . . . . . . . . . $8,846
Value of Investment on 3/31/18: . . . . . . . . . . . . . . . . . . . . . . . . . . . . . .
Source: Morningstar, 4/18. CDs are insured by the FDIC.
$100,000
Unpredictable Income From CDs
Flat Income, No Growth From Bonds
Rising Income with Volatility From Stocks
INCOME
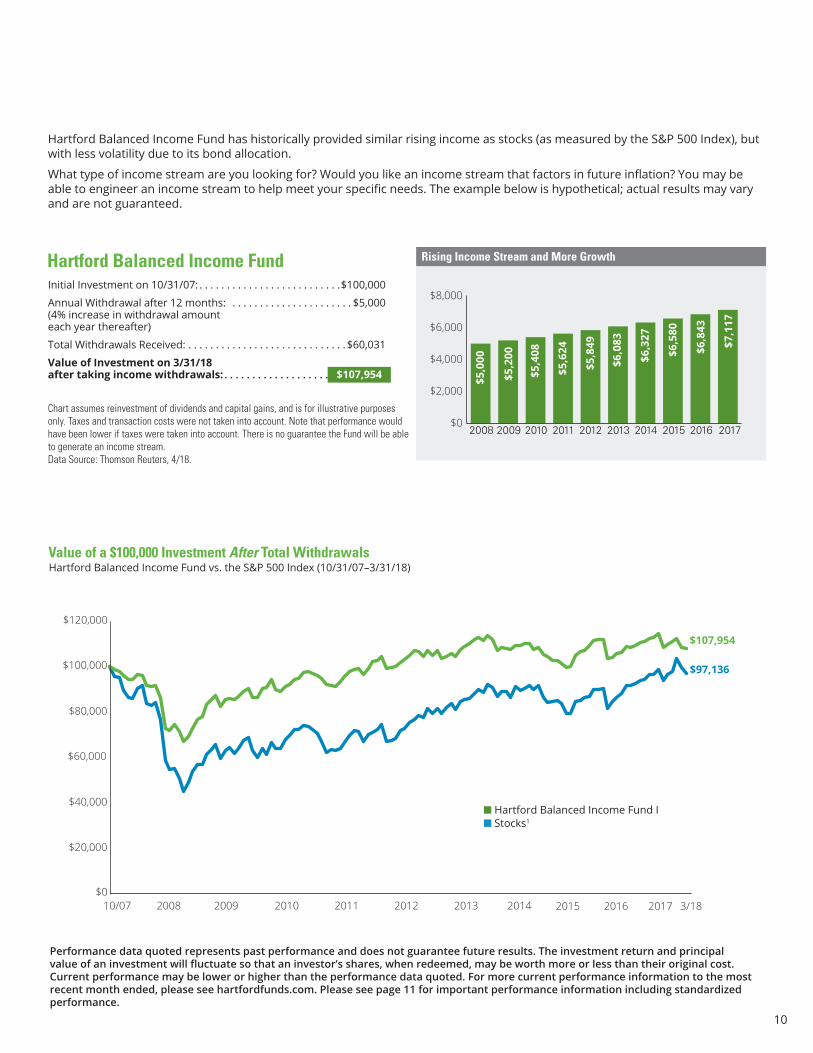
Hartford Balanced Income Fund
Hartford Balanced Income Fund has historically provided similar rising income as stocks (as measured by the S&P 500 Index), but with less volatility due to its bond allocation.
What type of income stream are you looking for? Would you like an income stream that factors in future inflation? You may be able to engineer an income stream to help meet your specific needs. The example below is hypothetical; actual results may vary and are not guaranteed.
Initial Investment on 10/31/07: . . . . . . . . . . . . . . . . . . . . . . . . . .$100,000
Annual Withdrawal after 12 months: . . . . . . . . . . . . . . . . . . . . . . $5,000 (4% increase in withdrawal amount each year thereafter)
Total Withdrawals Received: . . . . . . . . . . . . . . . . . . . . . . . . . . . . .$60,031
Value of Investment on 3/31/18 after taking income withdrawals: . . . . . . . . . . . . . . . . . . . . . . . . . . . . .
$0
$2,000
$4,000
$6,000
$8,000
$0
$2,000
$4,000
$6,000
$8,000
$0
$2,000
$4,000
$6,000
$8,000
$0
$2,000
$4,000
$6,000
$8,000
$4,000
$4,000
$4,000
$4,000
$4,000
$4,000
$4,000
$4,000
$4,000
$4,000$5,000
$5,098
$4,634
$5,295
$5,210
$1,835
$904
$501
$76
2
$2,118
$42
$426
$29
$397
$26
$505
$21
$284
$10
$274
$274
$274
$1,76
4$3,774
$4,709
$3,247
$4,020
$5,000
$5,200
$5,408
$5,624
$5,849
$6,083
$6,327
$6,580
$6,843
$7,117
$7,401
$7,697
$8,005
$8,325
$8,658
$0
$2,000
$4,000
$6,000
$8,000
$5,637
$5,672
$5,138 $6,331
$5,252
$2,130
$1,348
$1,318
$1,977
$401
$240
$2,959
$4,844
$5,315
$3,825
97 98 99 00 01 02 03 04 05 06 07 08 09 10 11
97 98 99 00 01 02 03 04 05 06 07 08 09 10 11
97 99 01 03 05 07 09 11 13 14
2008 2009 2010 2011 2012 2013 2014 2015 2016
2008 2009 2010 2011 2012 2013 2014 2015 2016 2017 2008 2009 2010 2011 2012 2013 2014 2015 2016 2017$0
$2,000
$4,000
$6,000
$8,000
$5,000
$5,200
$5,408
$5,624
$5,849
$6,083
$6,327
$6,580
$6,843
$7,117
2008 2009 2010 2011 2012 2013 2014 2015 2016 2017$0
$2,000
$4,000
$6,000
$8,000
$5,000
$5,200
$5,408
$5,624
$5,849
$6,083
$6,327
$6,580
$6,843
$7,117
5877
5582
5596
6786
3702
1821
1174
1750
3787
5361
5354
3181
878
442
422
438
135
$181,934
$0
$20,000
$40,000
$60,000
$80,000
$100,000
$120,000
$0
$20000
$40000
$60000
$80000
$100000
$120000
$106,519
$88,923
10/2007 2008 2009 2010 2011 2012 2013 12/2014$0
$20,000
$40,000
$60,000
$80,000
$100,000
$120,000
$106,519
$88,923
10/2007 2008 2009 2010 2011 2012 2013 12/2014
$0
$20,000
$40,000
$60,000
$80,000
$100,000
$120,000
$107,954
$97,136
10/07 2008 2009 2010 2011 2012 2013 2014 2015 2016 2017 3/18$0
$20,000
$40,000
$60,000
$80,000
$100,000
$120,000
$108,332
$97,879
10/07 2008 2009 2010 2011 2012 2013 2014 2015 2016 12/17
Value of a $100,000 Investment After Total Withdrawals
Chart assumes reinvestment of dividends and capital gains, and is for illustrative purposes only. Taxes and transaction costs were not taken into account. Note that performance would have been lower if taxes were taken into account. There is no guarantee the Fund will be able to generate an income stream. Data Source: Thomson Reuters, 4/18.
Performance data quoted represents past performance and does not guarantee future results. The investment return and principal value of an investment will fluctuate so that an investor’s shares, when redeemed, may be worth more or less than their original cost. Current performance may be lower or higher than the performance data quoted. For more current performance information to the most recent month ended, please see hartfordfunds.com. Please see page 11 for important performance information including standardized performance.
$107,954
n Hartford Balanced Income Fund In Stocks1
10
Hartford Balanced Income Fund vs. the S&P 500 Index (10/31/07–3/31/18)
Rising Income Stream and More Growth
11
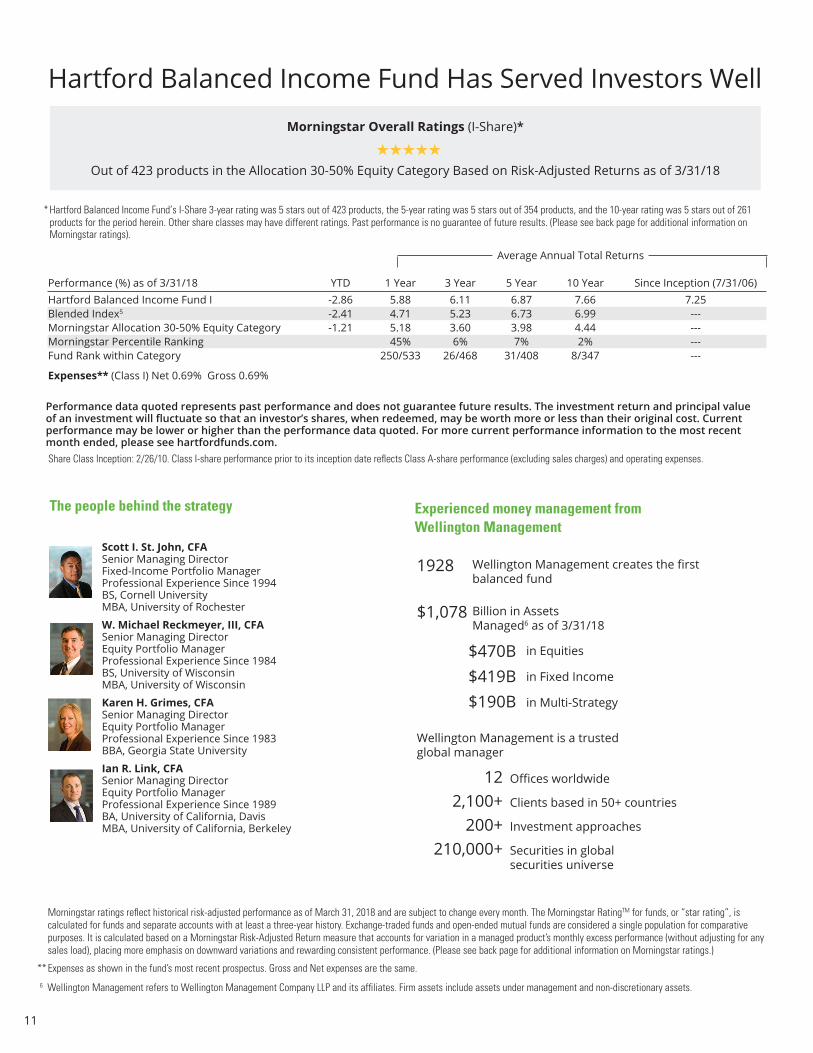
Hartford Balanced Income Fund Has Served Investors Well
Morningstar ratings reflect historical risk-adjusted performance as of March 31, 2018 and are subject to change every month. The Morningstar RatingTM for funds, or “star rating”, is calculated for funds and separate accounts with at least a three-year history. Exchange-traded funds and open-ended mutual funds are considered a single population for comparative purposes. It is calculated based on a Morningstar Risk-Adjusted Return measure that accounts for variation in a managed product’s monthly excess performance (without adjusting for any sales load), placing more emphasis on downward variations and rewarding consistent performance. (Please see back page for additional information on Morningstar ratings.)
** Expenses as shown in the fund’s most recent prospectus. Gross and Net expenses are the same.
6 Wellington Management refers to Wellington Management Company LLP and its affiliates. Firm assets include assets under management and non-discretionary assets.
Performance (%) as of 3/31/18 YTD 1 Year 3 Year 5 Year 10 Year Since Inception (7/31/06)Hartford Balanced Income Fund I -2.86 5.88 6.11 6.87 7.66 7.25Blended Index5 -2.41 4.71 5.23 6.73 6.99 ---Morningstar Allocation 30-50% Equity Category -1.21 5.18 3.60 3.98 4.44 ---Morningstar Percentile Ranking 45% 6% 7% 2% ---Fund Rank within Category 250/533 26/468 31/408 8/347 ---
Expenses** (Class I) Net 0.69% Gross 0.69%
Morningstar Overall Ratings (I-Share)*
HHHHH Out of 423 products in the Allocation 30-50% Equity Category Based on Risk-Adjusted Returns as of 3/31/18
* Hartford Balanced Income Fund’s I-Share 3-year rating was 5 stars out of 423 products, the 5-year rating was 5 stars out of 354 products, and the 10-year rating was 5 stars out of 261 products for the period herein. Other share classes may have different ratings. Past performance is no guarantee of future results. (Please see back page for additional information on Morningstar ratings).
Scott I. St. John, CFASenior Managing Director Fixed-Income Portfolio ManagerProfessional Experience Since 1994BS, Cornell UniversityMBA, University of Rochester
W. Michael Reckmeyer, III, CFASenior Managing Director Equity Portfolio ManagerProfessional Experience Since 1984BS, University of WisconsinMBA, University of Wisconsin
Karen H. Grimes, CFASenior Managing Director Equity Portfolio ManagerProfessional Experience Since 1983BBA, Georgia State University
Ian R. Link, CFASenior Managing Director Equity Portfolio ManagerProfessional Experience Since 1989BA, University of California, DavisMBA, University of California, Berkeley
1928
$1,078
Wellington Management is a trusted global manager
12 Offices worldwide
2,100+ Clients based in 50+ countries
200+ Investment approaches
210,000+ Securities in global securities universe
Wellington Management creates the first balanced fund
Billion in Assets Managed6 as of 3/31/18
in Equities
in Fixed Income
in Multi-Strategy
The people behind the strategy Experienced money management from Wellington Management
$470B $419B $190B
Performance data quoted represents past performance and does not guarantee future results. The investment return and principal value of an investment will fluctuate so that an investor’s shares, when redeemed, may be worth more or less than their original cost. Current performance may be lower or higher than the performance data quoted. For more current performance information to the most recent month ended, please see hartfordfunds.com.
Average Annual Total Returns
Share Class Inception: 2/26/10. Class I-share performance prior to its inception date reflects Class A-share performance (excluding sales charges) and operating expenses.
12
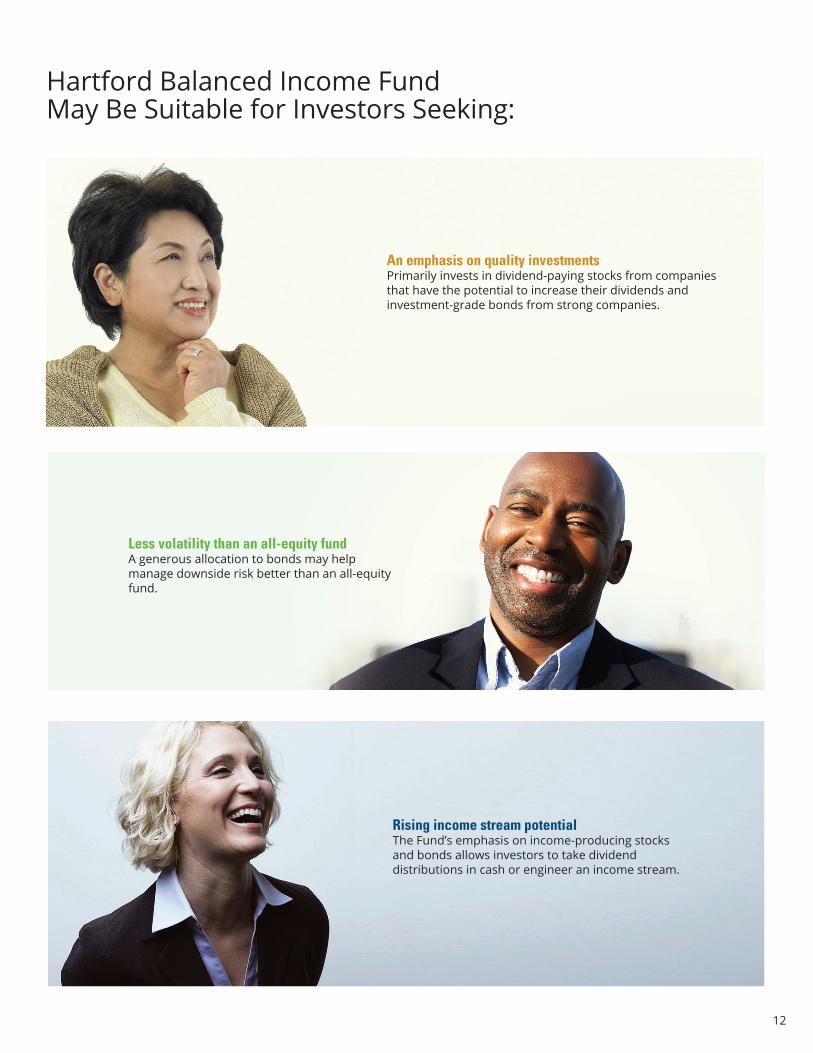
Hartford Balanced Income Fund May Be Suitable for Investors Seeking:
Less volatility than an all-equity fundA generous allocation to bonds may help manage downside risk better than an all-equity fund.
An emphasis on quality investmentsPrimarily invests in dividend-paying stocks from companies that have the potential to increase their dividends and investment-grade bonds from strong companies.
Rising income stream potentialThe Fund’s emphasis on income-producing stocks and bonds allows investors to take dividend distributions in cash or engineer an income stream.

The Hartford Balanced Income Fund invests in quality companies—names you
know and trust. It’s a simple strategy that offers the growth potential you need
without taking excessive risk. Just as the Golden Ratio provides the perfect balance in art,
architecture, and nature, the Fund takes a balanced approach to solve for your greatest
challenges: growth, income, and volatility.
A Simple Solution for Complex Challenges
13
14
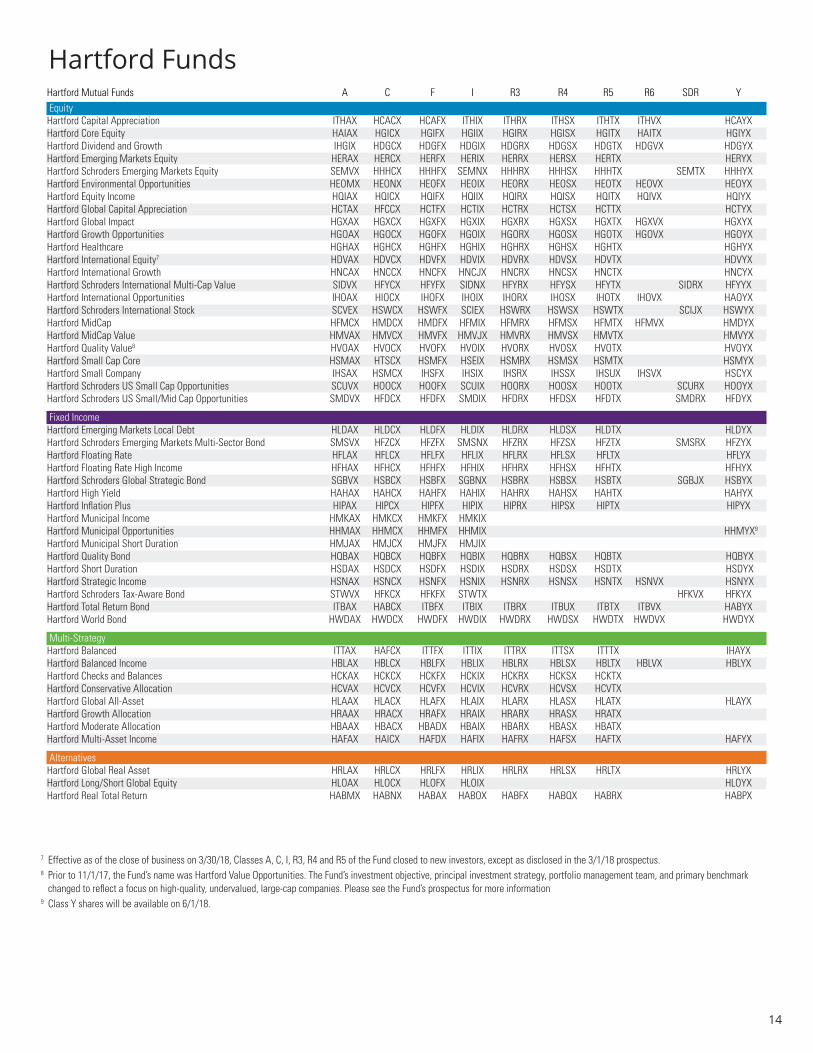
Hartford FundsHartford Mutual Funds A C F I R3 R4 R5 R6 SDR Y EquityHartford Capital Appreciation ITHAX HCACX HCAFX ITHIX ITHRX ITHSX ITHTX ITHVX HCAYX Hartford Core Equity HAIAX HGICX HGIFX HGIIX HGIRX HGISX HGITX HAITX HGIYX Hartford Dividend and Growth IHGIX HDGCX HDGFX HDGIX HDGRX HDGSX HDGTX HDGVX HDGYX Hartford Emerging Markets Equity HERAX HERCX HERFX HERIX HERRX HERSX HERTX HERYXHartford Schroders Emerging Markets Equity SEMVX HHHCX HHHFX SEMNX HHHRX HHHSX HHHTX SEMTX HHHYXHartford Environmental Opportunities HEOMX HEONX HEOFX HEOIX HEORX HEOSX HEOTX HEOVX HEOYXHartford Equity Income HQIAX HQICX HQIFX HQIIX HQIRX HQISX HQITX HQIVX HQIYX Hartford Global Capital Appreciation HCTAX HFCCX HCTFX HCTIX HCTRX HCTSX HCTTX HCTYX Hartford Global Impact HGXAX HGXCX HGXFX HGXIX HGXRX HGXSX HGXTX HGXVX HGXYXHartford Growth Opportunities HGOAX HGOCX HGOFX HGOIX HGORX HGOSX HGOTX HGOVX HGOYXHartford Healthcare HGHAX HGHCX HGHFX HGHIX HGHRX HGHSX HGHTX HGHYX Hartford International Equity7 HDVAX HDVCX HDVFX HDVIX HDVRX HDVSX HDVTX HDVYXHartford International Growth HNCAX HNCCX HNCFX HNCJX HNCRX HNCSX HNCTX HNCYX Hartford Schroders International Multi-Cap Value SIDVX HFYCX HFYFX SIDNX HFYRX HFYSX HFYTX SIDRX HFYYXHartford International Opportunities IHOAX HIOCX IHOFX IHOIX IHORX IHOSX IHOTX IHOVX HAOYX Hartford Schroders International Stock SCVEX HSWCX HSWFX SCIEX HSWRX HSWSX HSWTX SCIJX HSWYXHartford MidCap HFMCX HMDCX HMDFX HFMIX HFMRX HFMSX HFMTX HFMVX HMDYX Hartford MidCap Value HMVAX HMVCX HMVFX HMVJX HMVRX HMVSX HMVTX HMVYX Hartford Quality Value8 HVOAX HVOCX HVOFX HVOIX HVORX HVOSX HVOTX HVOYX Hartford Small Cap Core HSMAX HTSCX HSMFX HSEIX HSMRX HSMSX HSMTX HSMYXHartford Small Company IHSAX HSMCX IHSFX IHSIX IHSRX IHSSX IHSUX IHSVX HSCYX Hartford Schroders US Small Cap Opportunities SCUVX HOOCX HOOFX SCUIX HOORX HOOSX HOOTX SCURX HOOYXHartford Schroders US Small/Mid Cap Opportunities SMDVX HFDCX HFDFX SMDIX HFDRX HFDSX HFDTX SMDRX HFDYX
Fixed IncomeHartford Emerging Markets Local Debt HLDAX HLDCX HLDFX HLDIX HLDRX HLDSX HLDTX HLDYX Hartford Schroders Emerging Markets Multi-Sector Bond SMSVX HFZCX HFZFX SMSNX HFZRX HFZSX HFZTX SMSRX HFZYXHartford Floating Rate HFLAX HFLCX HFLFX HFLIX HFLRX HFLSX HFLTX HFLYX Hartford Floating Rate High Income HFHAX HFHCX HFHFX HFHIX HFHRX HFHSX HFHTX HFHYXHartford Schroders Global Strategic Bond SGBVX HSBCX HSBFX SGBNX HSBRX HSBSX HSBTX SGBJX HSBYXHartford High Yield HAHAX HAHCX HAHFX HAHIX HAHRX HAHSX HAHTX HAHYX Hartford Inflation Plus HIPAX HIPCX HIPFX HIPIX HIPRX HIPSX HIPTX HIPYX Hartford Municipal Income HMKAX HMKCX HMKFX HMKIX Hartford Municipal Opportunities HHMAX HHMCX HHMFX HHMIX HHMYX9
Hartford Municipal Short Duration HMJAX HMJCX HMJFX HMJIX Hartford Quality Bond HQBAX HQBCX HQBFX HQBIX HQBRX HQBSX HQBTX HQBYXHartford Short Duration HSDAX HSDCX HSDFX HSDIX HSDRX HSDSX HSDTX HSDYX Hartford Strategic Income HSNAX HSNCX HSNFX HSNIX HSNRX HSNSX HSNTX HSNVX HSNYX Hartford Schroders Tax-Aware Bond STWVX HFKCX HFKFX STWTX HFKVX HFKYXHartford Total Return Bond ITBAX HABCX ITBFX ITBIX ITBRX ITBUX ITBTX ITBVX HABYX Hartford World Bond HWDAX HWDCX HWDFX HWDIX HWDRX HWDSX HWDTX HWDVX HWDYX
Multi-StrategyHartford Balanced ITTAX HAFCX ITTFX ITTIX ITTRX ITTSX ITTTX IHAYX Hartford Balanced Income HBLAX HBLCX HBLFX HBLIX HBLRX HBLSX HBLTX HBLVX HBLYXHartford Checks and Balances HCKAX HCKCX HCKFX HCKIX HCKRX HCKSX HCKTX Hartford Conservative Allocation HCVAX HCVCX HCVFX HCVIX HCVRX HCVSX HCVTX Hartford Global All-Asset HLAAX HLACX HLAFX HLAIX HLARX HLASX HLATX HLAYX Hartford Growth Allocation HRAAX HRACX HRAFX HRAIX HRARX HRASX HRATX Hartford Moderate Allocation HBAAX HBACX HBADX HBAIX HBARX HBASX HBATX Hartford Multi-Asset Income HAFAX HAICX HAFDX HAFIX HAFRX HAFSX HAFTX HAFYX
AlternativesHartford Global Real Asset HRLAX HRLCX HRLFX HRLIX HRLRX HRLSX HRLTX HRLYX Hartford Long/Short Global Equity HLOAX HLOCX HLOFX HLOIX HLOYXHartford Real Total Return HABMX HABNX HABAX HABOX HABFX HABQX HABRX HABPX
7 Effective as of the close of business on 3/30/18, Classes A, C, I, R3, R4 and R5 of the Fund closed to new investors, except as disclosed in the 3/1/18 prospectus.8 Prior to 11/1/17, the Fund’s name was Hartford Value Opportunities. The Fund’s investment objective, principal investment strategy, portfolio management team, and primary benchmark
changed to reflect a focus on high-quality, undervalued, large-cap companies. Please see the Fund’s prospectus for more information9 Class Y shares will be available on 6/1/18.
Important Risks: Investing involves risk, including the possible loss of principal. • The Fund seeks to achieve its investment objective by allocating assets among diff erent asset classes and/or specialist portfolio managers. There is no guarantee a fund will achieve its stated objective. Security prices fl uctuate in value depending on general market and economic conditions and the prospects of individual companies. • Fixed income security risks include credit, liquidity, call, duration, and interest-rate risk. As interest rates rise, bond prices generally fall. • For dividend-paying stocks, dividends are not guaranteed and may decrease without notice. • Foreign investments may be more volatile and less liquid than U.S. investments and are subject to the risk of currency fl uctuations and adverse political and economic developments. • Diff erent investment styles may go in and out favor, which may cause a fund to underperform the broader stock market.
1 Stocks are represented by the S&P 500 Index which is a market capitalization-weighted price index composed of 500 widely held common stocks. 2 Bonds are represented by the Bloomberg Barclays U.S. Aggregate Bond Index which is composed of securities from the Bloomberg Barclays Government/Credit Bond Index,
Mortgage-Backed Securities Index, Asset-Backed Securities Index, and Commercial Mortgage-Backed Securities Index. 3 High Yield Bonds are represented by the Bloomberg Barclays Corporate High Yield Index, which covers the USD-denominated, non-investment grade, fi xed-rate, taxable corporate bond
market.4 Investment Grade Corporates are represented by the Bloomberg Barclays U.S. Corporate Investment Grade Index, which measures the performance of investment grade corporate bonds. 5 The blended index consists of 45% Russell 1000 Value Index, 44% Bloomberg Barclays Corporate Index, 5.5% JP Morgan Emerging Markets Bond Index Plus, and 5.5% Bloomberg Barclays
U.S. Corporate High-Yield Bond 2% Issuer Cap Index.
Morningstar ratings refl ect historical risk-adjusted performance as of March 31, 2018 and are subject to change every month. The Morningstar RatingTM for funds, or “star rating”, is calculated for funds and separate accounts with at least a 3-year history. Exchange-traded funds and open-ended mutual funds are considered a single population for comparative purposes. Star rating based on a Morningstar Risk-Adjusted Return measure that accounts for variation in a managed product’s monthly excess performance (without adjusting for any sales load, if applicable), placing more emphasis on downward variations and rewarding consistent performance. 5 stars are assigned to the top 10%, 4 stars to the next 22.5%, 3 stars to the next 35%, 2 stars to the next 22.5%, and 1 star to the bottom 10%. Overall Morningstar Rating is derived from a weighted average of the performance fi gures associated with its 3-, 5-, and 10-year (if applicable) Morningstar Rating metrics. For more information about the Morningstar Fund Ratings, including their methodology, please go to global.morningstar.com/managerdisclosures. © 2018 Morningstar, Inc. All rights reserved. The information contained herein: (1) is proprietary to Morningstar and/ or its content providers; (2) may not be copied or distributed; and (3) is not warranted to be accurate, complete or timely. Neither Morningstar nor its content providers are responsible for any damages or losses arising from any use of this information.
Investors should carefully consider a fund’s investment objectives, risks, charges and expenses. This and other important information is contained in a fund’s full prospectus and summary prospectus, which can be obtained by visiting hartfordfunds.com. Please read it carefully before investing.
Mutual funds are distributed by Hartford Funds Distributors, LLC (HFD), Member FINRA. Advisory services are provided by Hartford Funds Management Company, LLC (HFMC). Certain funds are sub-advised by Wellington Management Company LLP. HFD and HFMC are not affi liated with any sub-adviser.
205053 MF3101_0418
A mix of stocks and bonds: Takes a balanced approach to help solve for your greatest challenges: growth, income, and volatility.
Companies you know and trust: Invests primarily in dividend-paying stocks and investment-grade corporate bonds that you can feel confi dent investing in for the long term.
Strong performance with lower volatility: The Fund has provided the upside potential of stocks but with less risk.
Hartford Balanced Income Fund
Fund Symbols: I: HBLIX A: HBLAX C: HBLCX F: HBLFX R3: HBLRX R4: HBLSX R5: HBLTX R6: HBLVX Y: HBLYX
At Hartford Funds, your investment satisfaction is our measure of success. That’s why we use an approach we call human-centric investing that considers not only how the economy and stock market impact your investments, but also how societal infl uences, generational diff erences, and your stage of life shape you as an investor.
Instead of cookie-cutter recommendations and generic goals, we think you deserve personalized advice from a fi nancial advisor who understands your fi nancial situation and can build a fi nancial plan tailored to your needs.
Delivering strong performance is always our top priority. But the numbers on the page are only half the story. The true test is whether or not an investment is performing to your expectations.
hartfordfunds.com 888-843-7824 @hartfordfunds hartfordfunds.com/linkedin