march 21, 2017 lincoln, ne - innovation...
TRANSCRIPT

March 21, 2017
Lincoln, NE - Innovation Campus

• Kyle Schneweis – Director - Nebraska Department of Roads
• Colonel Brad Rice – Superintendent - Nebraska State Patrol
• Rhonda Lahm – Director, Department of Motor Vehicles
• Dr. Tom Williams - Chief Medical Officer - Div. of Public Health Department of Health and Human Services
• Larry Dix - Executive Director - Nebraska Association of County Officials
• Lynn Rex - Executive Director - League of Nebraska Municipalities

•Dan Waddle, Fred Zwonechek, Bob Grant, Alan Swanson Linda Kearns, Sean Owings and Bobbi Olson - NDOR
•Major Mike Gaudreault, Lieutenant Dan Doggett - NSP
•Sara O’Rourke - DMV
•Tim Wilson - DHHS
•Nicole Frankl – NE-LTAP
• John Perry - FHWA
•Diane Podany - FMCSA
•Sherri Cannon - NHTSA


•Reduce the State’s Fatality rate to 0.5 fatality per 100 MVMT by end of 2016
•Reducing the State’s Fatality rate by over 40%
•Reduce Fatalities From 181 in 2011 to 104 in 2016

• Increasing Safety Belt Usage
•Keeping Vehicles on the Roadway
•Reducing Alcohol-Impaired Driving
• Improving the Design and Operation of Highway Intersections
•Addressing the Over Crash Involvement of Young Drivers

0
50
100
150
200
250
300
2006 2007 2008 2009 2010 2011 2012 2013 2014 2015 2016
269256
208223
190181
212 211225
246
218

1.401.33
1.10
1.16
0.97 0.95
1.10 1.09
1.151.22
0.70
0.80
0.90
1.00
1.10
1.20
1.30
1.40
1.50
2006 2007 2008 2009 2010 2011 2012 2013 2014 2015 2016
per 100 Million Vehicle Miles Traveled
1.401.33
1.10
1.16
0.97 0.95
1.10 1.091.15
1.22
1.05
0.70
0.80
0.90
1.00
1.10
1.20
1.30
1.40
1.50
2006 2007 2008 2009 2010 2011 2012 2013 2014 2015 2016
per 100 Million Vehicle Miles Traveled


71%70%70%
76%
79% 79%
76%
79%
83%
85%84% 84%
79% 79%79%80%
83%1.56
1.37
1.67
1.58
1.35
1.46
1.40 1.33
1.10
1.16
0.970.95
1.10 1.09
1.15
1.22
1.05
0.60
0.80
1.00
1.20
1.40
1.60
1.80
50%
55%
60%
65%
70%
75%
80%
85%
90%
2000
2001
2002
2003
2004
2005
2006
2007
2008
2009
2010
2011
2012
2013
2014
2015
2016
Seat Belt Usage Rate Fatality Rate

60%
65%
70%
75%
80%
85%
90%
95%
100%
2005 2006 2007 2008 2009 2010 2011 2012 2013 2014 2015 2016
84.3%
88.6%
93.2%
96.8%95.1%
91.5%
95.1% 95.9% 95.9%96.9% 96.9%
98.4%

0%
10%
20%
30%
40%
50%
60%
70%
80%
90%
100%
2005 2006 2007 2008 2009 2010 2011 2012 2013 2014 2015
73.7%68.4% 70.0%
62.6%
71.1% 70.4% 71.0%75.0% 73.1%
69.3%74.3%
Percentage 2005 - 2015


0
500
1,000
1,500
2,000
2,500
3,000
3,500
2005 2006 2007 2008 2009 2010 2011 2012 2013 2014 2015
3,2903,171 3,193
3,029 2,968
2,709 2,731 2,671 2,605 2,614
2,888
Fatal, A and B Injury

0
500
1,000
1,500
2,000
2,500
2005 2006 2007 2008 2009 2010 2011 2012 2013 2014 2015
2,2042,096 2,167
2,025 1,9981,837 1,816 1,767
1,621 1,576 1,509
Fatal, A and B injuries

13.6
12.7 12.512.2
11.7 11.6
10.1
12.3
11.0
10.3
9.6 9.6
10.3 10.1
9.18.6
9.4 9.28.8 8.7 8.7
6.0
8.0
10.0
12.0
14.0
1995
1996
1997
1998
1999
2000
2001
2002
2003
2004
2005
2006
2007
2008
2009
2010
2011
2012
2013
2014
2015
Crashes Per 100 Million Vehicle Miles Traveled

0.46
0.450.48
0.59 0.60
0.480.46
0.560.54
0.43
0.40
0.40 0.41
0.32
0.43
0.23
0.27
0.42
0.34
0.380.35
0.10
0.20
0.30
0.40
0.50
0.60
0.70
1995
1996
1997
1998
1999
2000
2001
2002
2003
2004
2005
2006
2007
2008
2009
2010
2011
2012
2013
2014
2015
Per 100 Million Vehicle Miles Traveled

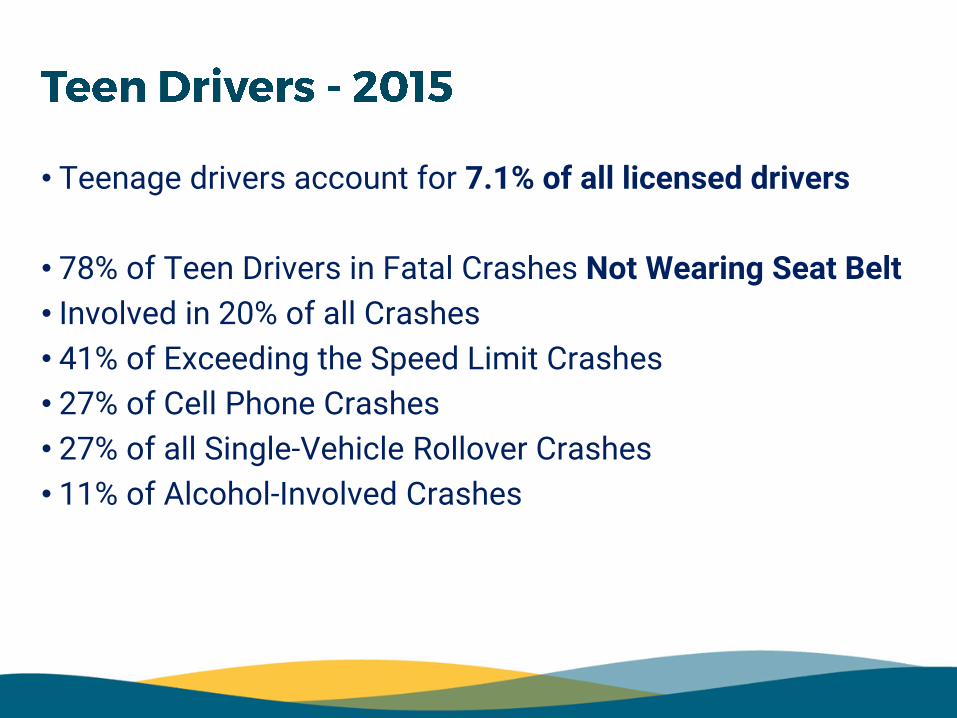
• Teenage drivers account for 7.1% of all licensed drivers
• 78% of Teen Drivers in Fatal Crashes Not Wearing Seat Belt
• Involved in 20% of all Crashes
• 41% of Exceeding the Speed Limit Crashes
• 27% of Cell Phone Crashes
• 27% of all Single-Vehicle Rollover Crashes
• 11% of Alcohol-Involved Crashes

9,1218,342 8,642
8,138 7,8577,312
6,738 6,589 6,409 6,5626,874
2,000
3,000
4,000
5,000
6,000
7,000
8,000
9,000
10,000
11,000
20
05
20
06
20
07
20
08
20
09
20
10
20
11
20
12
20
13
20
14
20
15
Includes Fatal & Injury Crashes


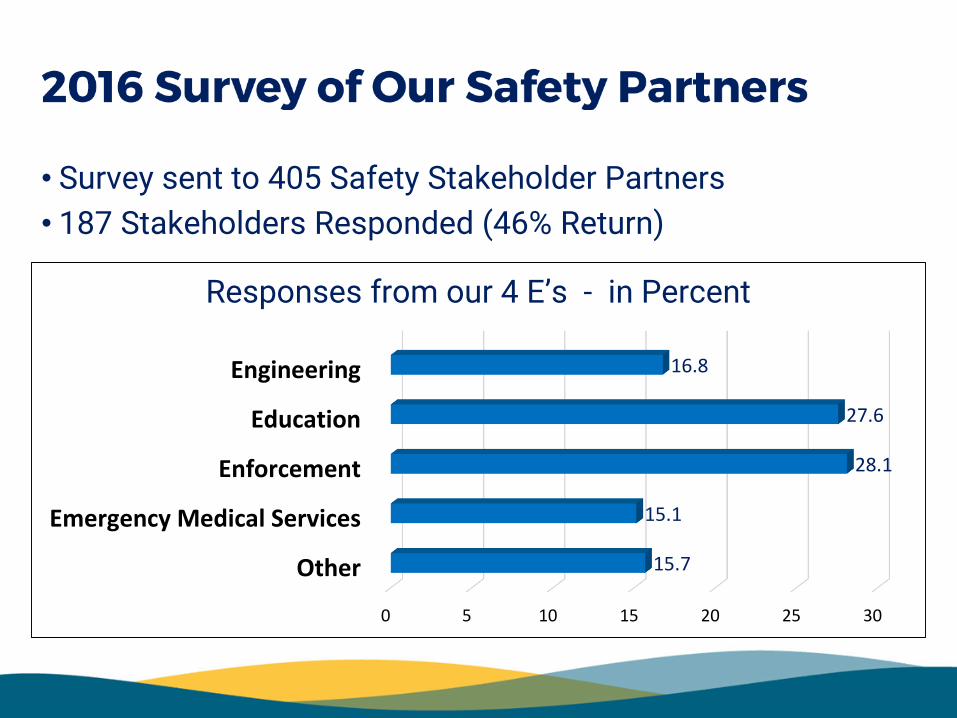
• Survey sent to 405 Safety Stakeholder Partners
• 187 Stakeholders Responded (46% Return)
0 5 10 15 20 25 30
Other
Emergency Medical Services
Enforcement
Education
Engineering
15.7
15.1
28.1
27.6
16.8
Responses from our 4 E’s - in Percent

0
10
20
30
40
50
60
70
80
90
Survey Response Percentage by Emphasis Areas
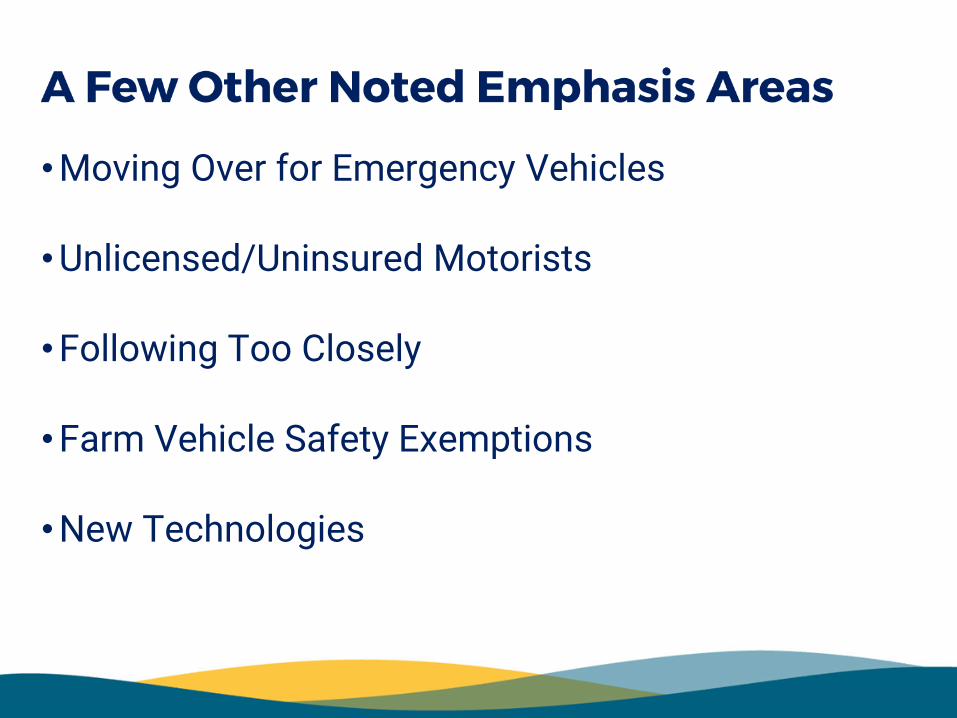
•Moving Over for Emergency Vehicles
•Unlicensed/Uninsured Motorists
•Following Too Closely
•Farm Vehicle Safety Exemptions
•New Technologies

•Eliminate Secondary Enforcement Provisions for Traffic Laws
•Funding for Driver Ed, Bike & Ped Infrastructure
•Upgrade Graduated Licensing Laws
•More Testing of Older Drivers

0
10
20
30
40
50
60
70
80
5 Year Crash History Percentage

1. Seat Belt/Child
2. Roadway
3. Young Drivers
4. Alcohol/Drugs
5. Intersection
6. Distracted
7. Commercial MV
8. Speed
9. Older Driver
10. Motorcycle

•Reduce Nebraska’s Fatality Rate to:
0.90 Fatality per 100 MVMT by end of 2021
•Reducing Nebraska’s Fatality Rate by over 22%
•Reducing Fatalities from 246 in 2015 to 189 in 2021
•Ultimate Goal Remains:
Toward Zero Deaths

• Increasing Seat Belt Usage
•Reducing Roadway Departure Crashes
•Reducing Young Driver Crashes
•Reducing Impaired Driving Crashes
•Reducing Intersection Crashes

