march 2016 examining us natural gas underground storage
TRANSCRIPT

Examining US Natural Gas Underground Storage
March 2016
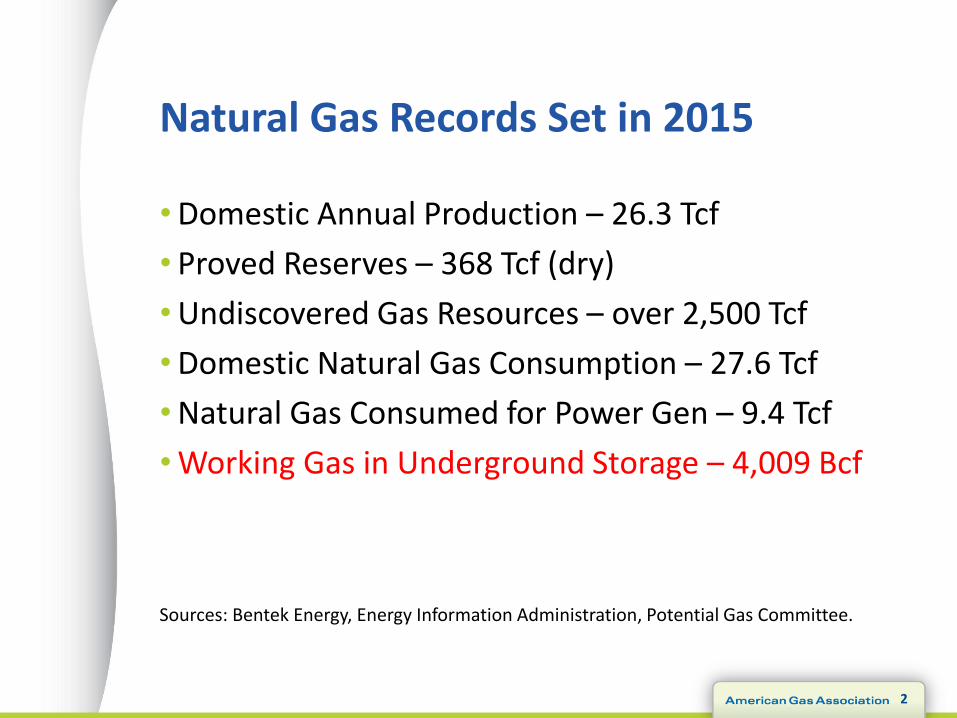
Natural Gas Records Set in 2015
•Domestic Annual Production – 26.3 Tcf
• Proved Reserves – 368 Tcf (dry)
•Undiscovered Gas Resources – over 2,500 Tcf
•Domestic Natural Gas Consumption – 27.6 Tcf
•Natural Gas Consumed for Power Gen – 9.4 Tcf
•Working Gas in Underground Storage – 4,009 Bcf
Sources: Bentek Energy, Energy Information Administration, Potential Gas Committee.
2
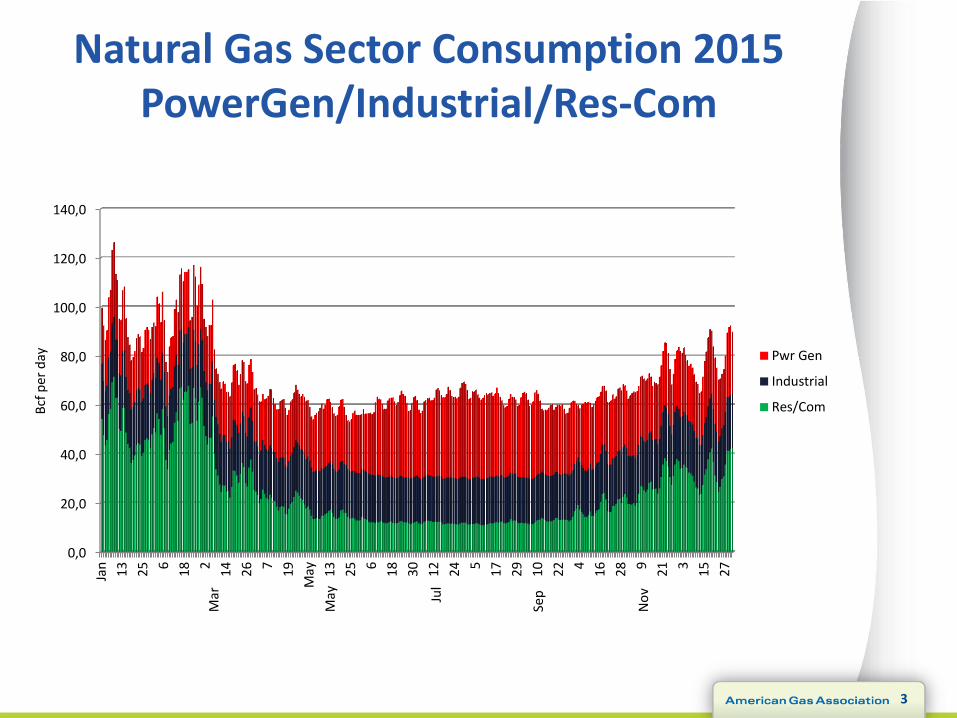
Natural Gas Sector Consumption 2015 PowerGen/Industrial/Res-Com
3
0,0
20,0
40,0
60,0
80,0
100,0
120,0
140,0
Jan 13 25
6
18
2
14 26
7
19
May 13 25
6
18 30 12 24
5
17 29 10 22
4
16 28
9
21
3
15 27
Bcf
per
day
Pwr Gen
Industrial
Res/Com
Mar
May
Jul
Sep
No
v

Record annual production in 2015 New daily records already in 2016
4
Source: Bentek Energy LLC
2014
30
35
40
45
50
55
60
65
70
75
80
янв фев мар апр май июн июл авг сен окт ноя дек
Billion Cubic Feet per Day
Daily Dry Natural Gas Production US Lower-48
Four-Year Range 2007-2010
2016
2015

US Underground Storage Facilities By Type
5

6
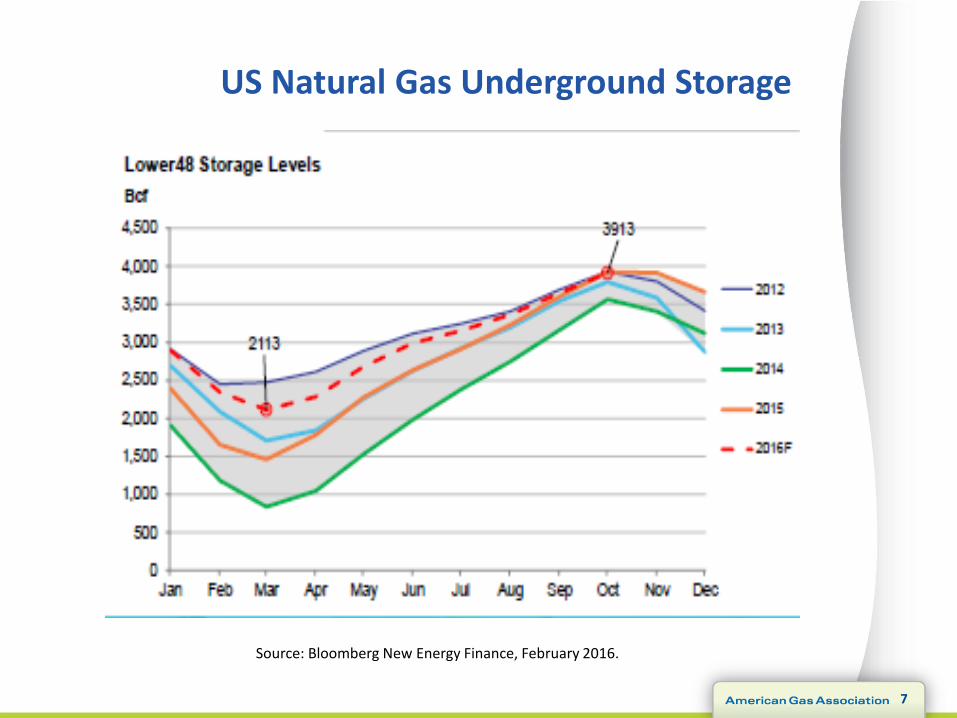
US Natural Gas Underground Storage
0
500
1 000
1 500
2 000
2 500
3 000
3 500
4 000
4 500
Working Gas in Underground Storage Lower 48 States (Bcf)
Max - Min Working Gas Storage Five year average
7
US Natural Gas Underground Storage
Source: Bloomberg New Energy Finance, February 2016.

8
Source: Bloomberg New Energy Finance, February 2016.

US Natural Gas Injection Season Market Balance for 2016?
• Normally about 210 days – Mid-April through October
• Historically, strong average daily Injections translate to about 13 Bcf per day or 2.7 Tcf in total for the season
• Weaker Average Daily Injections have been 9 Bcf per day or 1.9 Tcf in aggregate
• 2016 Storage Market and Physical Challenge - If 2015-16 winter season ending inventory is in 2.2-2.4 Tcf range, then even modest injections push inventories to record levels - Comes at a time when current US production (73 Bcf per day) is near record levels - Summer daily demand can be below 60 Bcf per day, even with strong natural gas demand for power generation
9

What can (or will) balance the US natural gas market on the margin for 2016?
• US imports of pipeline gas from Canada
• Gulf coast exports of LNG
• Pipeline exports to Mexico
• Can low cost gas induce additional switching from coal to natural gas in power generation sector?
• Does incrementally more use of gas-fired generation reintroduce less efficient gas options to the generation mix in some regions?
• Will producers overtly shut-in more production?
10
11
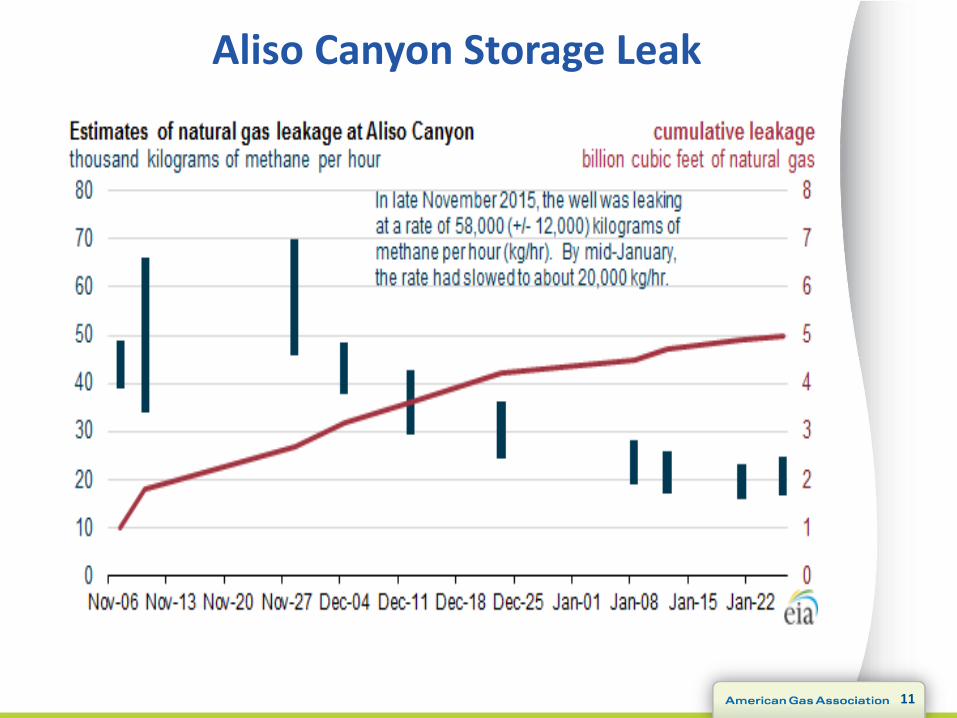
Aliso Canyon Storage Leak
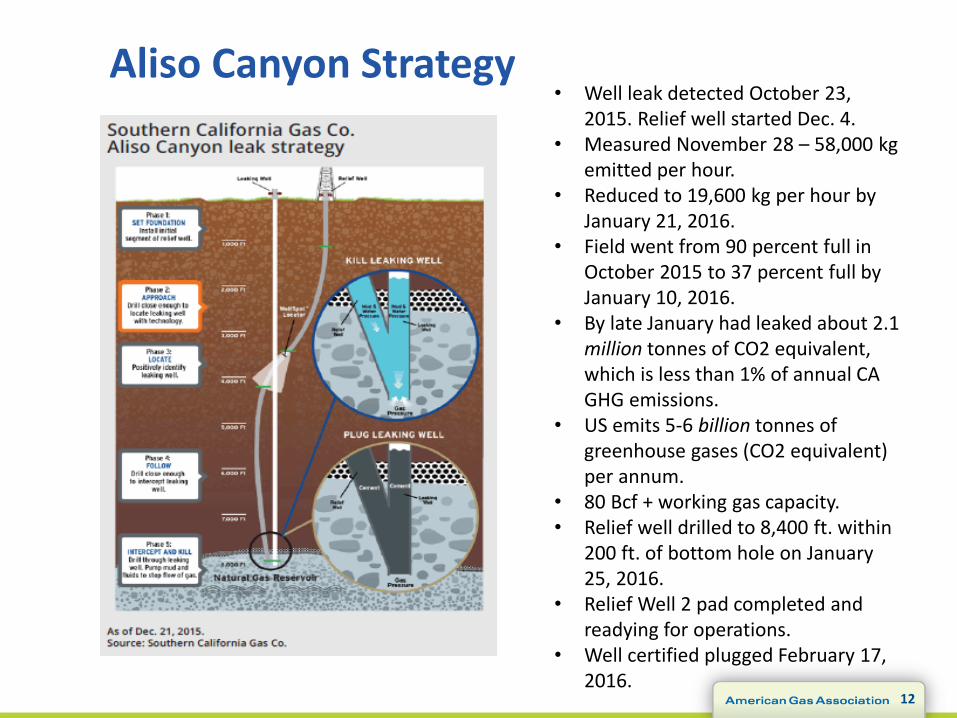
Aliso Canyon Strategy
12
• Well leak detected October 23, 2015. Relief well started Dec. 4.
• Measured November 28 – 58,000 kg emitted per hour.
• Reduced to 19,600 kg per hour by January 21, 2016.
• Field went from 90 percent full in October 2015 to 37 percent full by January 10, 2016.
• By late January had leaked about 2.1 million tonnes of CO2 equivalent, which is less than 1% of annual CA GHG emissions.
• US emits 5-6 billion tonnes of greenhouse gases (CO2 equivalent) per annum.
• 80 Bcf + working gas capacity. • Relief well drilled to 8,400 ft. within
200 ft. of bottom hole on January 25, 2016.
• Relief Well 2 pad completed and readying for operations.
• Well certified plugged February 17, 2016.

Typical Well Construction
13
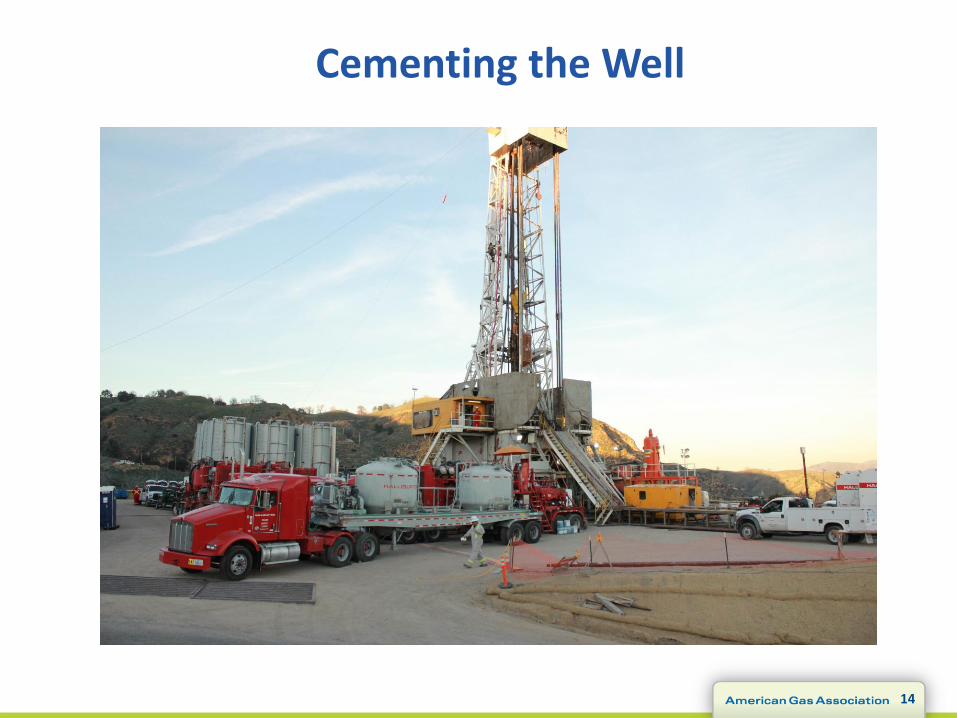
Cementing the Well
14

Christopher McGill Vice President, Energy Analysis and Standards
202.824.7132
15
Find Us Online
www.aga.org
www.truebluenaturalgas.org
http://twitter.com/AGA_naturalgas
www.facebook.com/naturalgas
www.linkedin.com/company/50905?trk=tyah