march 2013 ma and investment summary - petsky prunier
TRANSCRIPT

March 2013 M&A and Investment Summary
Expertise Commitment Results
1M&A & INVESTMENT SUMMARY MARCH 2013
Expertise. Commitment. Results.

TABLE OF CONTENTS
Overview of Monthly M&A and Investment Activity 3
Monthly M&A and Investment Activity by Industry Segment 8
Additional Monthly M&A and Investment Activity Data 42
About Petsky Prunier 54
Securities offered through Petsky Prunier Securities, LLC, member of FINRA.
This M&A and Investment Summary has been prepared by and is being distributed in the United States by Petsky Prunier, a broker dealer register with the U S SEC and a member of FINRA Petsky Prunier is not affiliated with Altium Capital Ltd but has partnered with Altium to
2M&A & INVESTMENT SUMMARY MARCH 2013
register with the U.S. SEC and a member of FINRA. Petsky Prunier is not affiliated with Altium Capital Ltd, but has partnered with Altium to expand its international presence. Altium has not prepared or verified the information in this Summary. Persons in the United States should contact Petsky Prunier for further information or services. This M&A and Investment Summary is not being distributed by Altium Capital Ltd in the United States and Altium Capital Ltd is not offering any services to persons in the United States.

M&A AND INVESTMENT SUMMARY FOR ALL SEGMENTS
A t t l f 336 d l d i M h 2013 f hi h 201 t d $8 7 billi i l
Transaction Distribution• A total of 336 deals were announced in March 2013, of which 201 reported $8.7 billion in value
• Digital Media/Commerce was the most active segment with 73 transactions, of which 48 reported $1.1 billion in value
• Traditional Media was the highest reported value segment, with 18 transactions announced, of which 11 announced $4.1 billion in value
• Strategic buyers announced 155 deals (46 percent of total volume), of which 43 reported $4.1 billion in value
• VC/Growth Capital investors announced 171 deals, of which 156 reported $4.6 billion in value
• Buyout investors announced 10 deals during the month
# % $MM % # $MM # $MM # $MM
Digital Media/Commerce 73 22% 1,131.5 13% 30 830.1 0 - 43 301.4
Marketing Technology 68 20% 548 0 6% 21 270 6 0 47 277 5
MARCH 2013
BUYER/INVESTOR BREAKDOWN
Transactions Reported Value Strategic Buyout Venture/Growth Capital
Marketing Technology 68 20% 548.0 6% 21 270.6 0 - 47 277.5
Software 51 15% 907.2 10% 28 686.0 2 5.4 21 215.8
Digital Advertising 38 11% 151.0 2% 18 35.5 1 - 19 115.5
Technology 30 9% 704.0 8% 11 491.4 0 - 19 212.6
Information & Business Services 22 7% 790.2 9% 9 742.0 3 - 10 48.2
Traditional Media 18 5% 4,145.4 48% 12 787.5 2 - 4 3,357.9
Agency 14 4% 27 8 0% 13 27 7 1 0 1 0 Agency 14 4% 27.8 0% 13 27.7 1 0.1 0 -
Marketing Services 12 4% 7.5 0% 7 - 1 - 4 7.5
Communications 10 3% 244.0 3% 6 215.0 0 - 4 29.0
Total 336 100% 8,656.6 100% 155 4,085.8 10 5.5 171 4,565.4
3M&A & INVESTMENT SUMMARY MARCH 2013

M&A AND INVESTMENT SUMMARY FOR ALL SEGMENTSTransaction Distribution
O th th b i l d t d l i d 12 t d 43 t ti l• On a month-over-month basis, volume and reported value increased 12 percent and 43 percent, respectively
• Activity in the Digital Advertising and Marketing Technology segments increased by the highest margins from the previous month, with 12 and 11 additional transactions announced during the month
• The largest control transaction announced in March was Temp Holdings’ $742 million acquisition of Intelligence Holdings, a Japan-based temporary staffing agency
• The largest investment during the month was Liberty Media’s $2.6 billion purchase of a 27 percent stake in cable services provider Charter Communications, from Oaktree Capital Management, Crestview Partners, and Apollo Global Management, at a valuation of $22.6 billion
M&A and Investment Volume For All Segments - Last 13 Months ($BN)All transactions; Value based on reported values only
$22.4
$19.1
25.0
2
73 2
35
52 2 3 2 1
$11.7
$15.3 $12.8
$19.1
$15.9
$7.1 $9.5 $9.8 $9.9
$8.5 $6.1
$8.7 10.0
15.0
20.0
5 1
-
5.0
Mar-12 Apr-12 May-12 Jun-12 Jul-12 Aug-12 Sep-12 Oct-12 Nov-12 Dec-12 Jan-13 Feb-13 Mar-13
409377 376 402381377 298 335401 342 305 253390
4M&A & INVESTMENT SUMMARY MARCH 2013
Deals valued over $1BN

($ in Millions)
SELECTED TRANSACTIONS WITH VALUATION INFORMATION DISCLOSED
Target Subsegment Buyer/Investor Ent. Value Rev EBITDA EV/REV EV/EBITDA
Marketing Technology
altosoft Corporation BI Tools Kofax, Inc. $13.5 $3.4 - 4.0x NM
Agency/ConsultingAmaze plc Digital Agency St Ives Marketing Services 22 8 - 2 5 * NA 9 1x
Selected Transactions With Multiples Information
Amaze plc Digital Agency St. Ives Marketing Services 22.8 - 2.5 NA 9.1x
Traditional MediaCharter Communications(1) Cable & Satellite Television Liberty Media Corporation 22,580.9 7,500.0 2,600.0 3.0x 8.7xSky Network Television Ltd.(2) Cable & Satellite Television (Unnamed Fund Contibuters) 1,968.6 711.1 283.4 2.8x 6.9xOutdoor Channel Holdings Broadcast Television Kroenke Sports Enterprise 227.0 77.3 9.1 2.9x 24.9x
TechnologyTensilica Infrastructure Technology Cadence Design Systems, Inc. 380.0 44.0 - 8.6x NM
Communications
Kentrox, Inc. Networking Equipment Westell Technologies, Inc. 30.0 30.0 - 1.0x NM
Arieso Software Defined Networking JDS Uniphase Corporation 85.0 20.7 1.8 * 4.1x 47.8x
Software
Computer Software Holdings Financial Software Advanced Computer Software Group plc 164.2 100.0 21.5 1.6x 7.7x
Melbourne IT Digital Brand Services Inc. Legal Software Corporation Service Company 157.3 56.9 9.8 * 2.8x 16.0x
nCircle Network Security, Inc. Security Software Tripwire, Inc. 100.0 40.0 - 2.5x NM
Target Subsegment Buyer/Investor Ent. Value Rev EBITDA EV/REV EV/EBITDA
Marketing TechnologyMarin Software Online Targeting/Optimization IPO $324.9 $84.3 $5.0 3.9x 65.0x
SoftwareModel N, Inc. Financial IPO 425.0 59.6 (22.0) 7.1x NM
Information & Business ServicesProfessional Diversity Network LLC HR Information IPO 49 8 6 1 2 8 8 2x 17 8x
IPOs After Final Pricing
Professional Diversity Network LLC HR Information IPO 49.8 6.1 2.8 8.2x 17.8x
* EBITDA represented by EBIT proxy
(1) Charter Communications sold a 27 percent stake to Liberty Media for $2.6 billion(2) Sky Network Television sold a 44 percent stake to unnamed fund contributors for $671 million
Note: IPO multiples based on TTM financials and pro forma balance sheets per latest Registration Filing
5M&A & INVESTMENT SUMMARY MARCH 2013

SECURITIES IN REGISTRATION ($ in Millions)
Aggregate LTMgg gDate Company Name Segment Offering Value Rev EBITDA
Mar-13 Blackhawk Network Holdings, Inc. Technology $200.0 $959.1 $92.3
Mar-13 Rally Software Development Corp. Software 70.0 52.6 (7.8)
Feb-13 Oisix Co., Ltd Digital Media/Commerce 9.0 NA NA
Feb-13 Quintiles Transnational Holdings Inc. Information & Business Services 600.0 3,692.3 486.2Q g ,
Feb-13 Softmax Co., Ltd Software 7.0 NA NA
Jan-13 Channel Nine Entertainment Limited Traditional Media 2.2 NA NA
Oct-12 Violin Memory, Inc. Technology NA 100.0 NA
Aug-12 Just Dial Limited Digital Advertising NA 48.8 13.0
J 12 ld T h SA S ft 5 2 NA NA Jun-12 goldenTech SA Software 5.2 NA NA
Jun-12 Shanghai Amarsoft Information Technology Software NA NA NA
Apr-12 BlackStratus, Inc. Software 20.0 9.2 (0.6)
Apr-12 NSFOCUS Information Technology Co., Ltd. Communications NA NA NA
Apr-12 Shenzhen Tinno Mobile Technology Corp. Communications 451.0 NA NA
Mar-12 Exponential Interactive, Inc. Digital Advertising 75.0 169.1 22.0
Mar-12 Reval Holdings, Inc. Software 75.0 47.0 (12.1)
6M&A & INVESTMENT SUMMARY MARCH 2013

LTM IPO PERFORMANCE
Initial Offering Final Price Stock Price at Close Stock Price on % Change from Date Ticker Company Name Country Price Range Per Share on 1st Trading Day Mar 28, 2013 1st Trading Day
Mar-13 MRIN Marin Software United States $11.00-$13.00 $14.00 16.26, up 16% $16.43 1.0%
Mar-13 MODN Model N, Inc. United States 12.50-14.50 15.50 18.45, up 19% 19.85 7.6%
Mar-13 IPDN Professional Diversity Network LLC United States 10.00-12.00 8.00 7.67, down 4% 6.65 (13.3%)
Feb-13 DGS Digital Globe Services, Ltd. United States No Range 2.47 2.59, up 5% 2.51 (3.1%)
Feb-13 XOOM Xoom Corporation United States 13.00-15.00 16.00 25.49, up 59% 22.64 (11.2%)Feb 13 XOOM Xoom Corporation United States 13.00 15.00 16.00 25.49, up 59% 22.64 (11.2%)
Nov-12 3666 Tecnos Japan Incorporated Japan 16.77-18.72 18.72 27.66, up 48% 30.51 10.3%
Nov-12 YY YY, Inc. China 10.50-12.50 10.50 11.31, up 8% 17.40 53.8%
Oct-12 RKUS Ruckus Wireless, Inc. United States 13.00-15.00 15.00 12.25, down 18% 21.48 75.3%
Oct-12 FLTX Fleetmatics Group Limited United States 15.00-17.00 27.00 22.30, up 31% 24.01 7.7%
Oct-12 RLGY Realogy Holdings Corp. United States 23.00-27.00 27.00 34.20, up 27% 48.97 43.2%
O t 12 SSTK Sh tt t k I U it d St t 13 00 15 00 17 00 21 66 27% 44 65 106 1%Oct-12 SSTK Shutterstock, Inc. United States 13.00-15.00 17.00 21.66, up 27% 44.65 106.1%
Oct-12 WDAY Workday, Inc. United States 24.00-26.00 28.00 48.69, 74% 61.25 25.1%
Sep-12 TRLA Trulia, Inc. United States 14.00-16.00 17.00 24.00, up 41.8% 31.43 31.0%
Aug-12 PFMT Performant Financial Corporation United States 12.00-14.00 9.00 10.60, down 18% 12.25 15.6%
Jul-12 EOPN E2open, Inc. United States 15.00-17.00 15.00 13.50, down 10% 20.25 50.0%
Jul-12 KYAK Kayak Software United States 22.00-25.00 26.00 33.18, up 28% 40.00 20.6%
Jul-12 PANW Palo Alto Networks United States 38.00-40.00 42.00 53.13, up 27% 57.02 7.3%
Jun-12 DB:VWA Vange Software Group AG Switzerland 33.05-39.41 33.05 32.69, down 1% 12.20 (62.7%)
May-12 ADNC Audience, Inc. United States 14.00-16.00 17.00 19.10, up 12.4% 15.02 (21.4%)
May-12 FB Facebook United States 36.00-38.00 38.00 38.23, flat 25.55 (33.2%)
May-12 WAGE WageWorks, Inc. United States 10.00-12.00 9.00 12.60, up 40% 24.55 94.8%
Apr-12 A149940 Modacom Co., Ltd. South Korea 6.24-7.58 6.24 6.76, up 8% 6.91 2.2%
Apr-12 300353 Kyland Technology Co., Ltd. China No Range 3.29 3.49, up 6% 4.33 24.0%
Apr-12 AQ Acquity Group Hong Kong 6.00-8.00 6.00 5.77, down 4% 6.38 10.6%
Apr-12 GWAY Greenway Medical Technologies United States 11.00-13.00 10.00 13.29, up 33% 15.85 19.3%
Apr-12 BLOX Infloblox United States 12.00-14.00 16.00 21.30, up 33% 21.19 (0.5%)
Apr-12 PFPT Proofpoint, Inc. United States 10.00-12.00 13.00 14.10, up 8% 16.78 19.0%
Apr 12 SPLK Splunk Inc United States 11 00 13 00 17 00 35 48 up 109% 40 00 12 7%
7M&A & INVESTMENT SUMMARY MARCH 2013
Apr-12 SPLK Splunk, Inc. United States 11.00-13.00 17.00 35.48, up 109% 40.00 12.7%

DIGITAL MEDIA/COMMERCETransactions by Subsegment and Buyer Type
• eCommerce was the most active and highest reported value subsegment with 24 transactions announced, of which 16 announced $176 million in value
• Select acquisitions› Avito.ru’s $570 million acquisition of Russia-based online classifieds websites Slando.ru and OLX.ru, from
Naspers› Dropbox’ $100 million acquisition of Mailbox, which offers an email inbox app for mobile devices› Yahoo’s $30 million acquisition of UK-based Summly, which offers a mobile news gathering and delivery app,
and its acquisition of Jybe, a company offering a mobile app that recommends movies, books, and restaurants based on data contained in social networks
• Select investments› The $30 million investment in Bonobos, an online retailer of men’s clothing, led by Glynn Capital Management
and Mousse Partners› The $20 million investment in Farfetch.com, an online marketplace for independent boutiques, led by Condé
Nast
# % $MM % # $MM # $MM # $MM
eCommerce 24 33% 176.4 16% 8 20.0 0 - 16 156.4
Social Media/Apps 16 22% 123.8 11% 5 100.0 0 - 11 23.8
BUYER/INVESTOR BREAKDOWN
Transactions Reported Value Strategic Buyout Venture/Growth Capital
DIGITAL MEDIA/COMMERCE TRANSACTIONS BY SEGMENT
Social Media/Apps 16 22% 123.8 11% 5 100.0 0 11 23.8
Mobile Content/Apps 15 21% 145.5 13% 9 134.0 0 - 6 11.5
Classifieds/Auctions/P-to-P 7 10% 645.1 57% 2 570.0 0 - 5 75.1
Niche Content 6 8% 27.6 2% 4 2.6 0 - 2 25.0
Gaming 5 7% 13.2 1% 2 3.5 0 - 3 9.7
Total 73 100% 1,131.5 100% 30 830.1 0 0.0 43 301.4
8M&A & INVESTMENT SUMMARY MARCH 2013

DIGITAL MEDIA/COMMERCE PUBLIC COMPANY VALUATION($ in millions, except stock price data)
Stock Price Chg % From Equity Ent. Cash & ST. Total LTM LTM Margin LTM LTM Multiples Company Name Headquarters 03/28/13 52WK High Value Value Investments Debt Revenue EBITDA EBITDA Rev Growth EV/Rev EV/EBITDAAOL Inc. United States 38.49 -12% 2,971.9 2,624.3 466.6 105.9 2,191.7 471.5 21.5% -0.5% 1.2x 5.6xBaidu, Inc. China 87.70 -43% 30,664.9 27,555.2 5,211.5 1,915.7 3,578.5 1,992.0 55.7% 53.8% 7.7x 13.8xGoogle Inc. United States 794.19 -6% 261,814.6 220,936.6 48,088.0 7,210.0 50,175.0 16,278.0 32.4% 32.4% 4.4x 13.6xYahoo! Inc. United States 23.53 -1% 25,912.4 21,810.8 4,184.0 37.0 4,986.6 1,315.1 26.4% 0.0% 4.4x 16.6xYandex N.V. * Netherlands 23.14 -45% 8,686.7 8,289.5 397.2 - 941.9 406.2 43.1% 43.6% 8.8x 20.4x
Adjusted Weighted Average 4.8x 13.8x
Web Search/Portals
eCommerceStock Price Chg % From Equity Ent. Cash & ST. Total LTM LTM Margin LTM LTM Multiples
Company Name Headquarters 03/28/13 52WK High Value Value Investments Debt Revenue EBITDA EBITDA Rev Growth EV/Rev EV/EBITDA1-800-Flowers.com Inc. United States 4.97 -3% 321.7 316.5 27.0 21.8 733.1 40.8 5.6% 5.0% 0.4x 7.7xAmazon.com Inc. United States 266.49 -6% 121,133.3 114,070.3 11,448.0 4,385.0 61,093.0 2,508.0 4.1% 27.1% 1.9x 45.5xBlue Nile Inc. United States 34.45 -21% 429.4 343.1 87.0 0.7 400.0 13.7 3.4% 14.9% 0.9x 25.1xBluefly Inc. United States 0.80 -58% 22.9 23.8 1.3 2.3 97.6 (23.2) NM 2.2% 0.2x NM
*Calculation is market cap weighted and excludes revenue multiples that are 2.0 standard deviations above the mean (11.3x)and EBITDA multiples that are 1.0 standard deviations above the mean (19.4x)
CafePress Inc. United States 6.01 -74% 102.9 66.0 40.6 3.7 217.8 13.4 6.2% 24.1% 0.3x 4.9xeBay Inc. United States 54.22 -5% 70,224.6 65,335.6 9,408.0 4,519.0 14,072.0 4,119.0 29.3% 20.8% 4.6x 15.9xE-Commerce China Dangdang Inc. China 4.15 -63% 332.7 280.5 148.4 96.3 833.2 (74.5) NM 43.5% 0.3x NM Expedia Inc. United States 60.02 -12% 8,205.9 7,626.2 1,938.1 1,249.3 4,030.3 642.7 15.9% 16.9% 1.9x 11.9xHollywood Media Corp. United States 1.25 -17% 29.0 23.0 6.0 0.0 3.4 (4.4) NM 80.9% 6.9x NM HSN, Inc. United States 54.86 -10% 2,973.2 3,001.9 222.1 250.8 3,266.7 284.0 8.7% 6.4% 0.9x 10.6xJiayuan.com International Ltd. China 5.05 -69% 159.9 78.7 81.1 - 65.9 9.9 15.0% 24.0% 1.2x 8.0xLiquidity Services, Inc. United States 29.81 -55% 940.6 894.7 45.9 - 491.5 97.7 19.9% 37.3% 1.8x 9.2xMercadolibre, Inc. * Argentina 96.56 -5% 4,263.2 4,072.2 195.2 0.1 373.6 138.6 37.1% 25.0% 10.9x 29.4xNetflix, Inc. * United States 189.28 -4% 10,598.4 10,282.2 748.1 431.8 3,609.3 95.5 2.6% 12.6% 2.8x 107.7xOpenTable, Inc. United States 62.98 -1% 1,445.8 1,342.3 103.5 - 161.6 46.1 28.5% 15.9% 8.3x 29.1xOrbitz Worldwide, Inc. United States 5.71 -5% 600.2 910.2 130.3 440.3 778.8 106.0 13.6% 1.6% 1.2x 8.6xOverstock.com Inc. United States 12.32 -30% 291.4 197.8 93.5 - 1,099.3 28.2 2.6% 4.3% 0.2x 7.0xPC Home Online Inc. Taiwan 4.11 -35% 336.4 255.6 95.1 - 503.4 18.0 3.6% 12.3% 0.5x 14.2xpriceline.com Incorporated United States 688.16 -11% 34,319.3 30,753.4 5,183.2 1,457.0 5,261.0 1,914.9 36.4% 20.8% 5.8x 16.1xRakuten, Inc. Japan 10.22 -4% 13,436.0 9,158.9 8,258.8 3,538.2 5,127.2 1,172.0 22.9% 16.7% 1.8x 7.8xShutterfly, Inc. United States 44.17 -3% 1,604.8 1,359.7 245.1 - 640.6 82.5 12.9% 35.4% 2.1x 16.5xShutterstock, Inc. United States 44.98 -1% 1,507.6 1,411.5 102.1 6.0 169.6 32.1 18.9% 41.0% 8.3x 44.0xStamps.com Inc. United States 24.97 -23% 382.5 346.6 35.9 - 115.7 25.8 22.3% 13.9% 3.0x 13.4xValueVision Media Inc. * United States 3.46 -9% 170.0 181.5 26.5 38.0 586.8 1.4 0.2% 5.1% 0.3x 131.4xVipshop Holdings Limited China 30 37 4% 1 674 9 1 465 1 210 6 0 8 692 1 (7 4) NM 204 7% 2 1x NM Vipshop Holdings Limited China 30.37 -4% 1,674.9 1,465.1 210.6 0.8 692.1 (7.4) NM 204.7% 2.1x NM
Adjusted Weighted Average 3.2x 29.3x
*Calculation is market cap weighted and excludes revenue multiples that are 2.0 standard deviations above the mean (8.7x)and EBITDA multiples that are 1.0 standard deviations above the mean (59.9x)
9M&A & INVESTMENT SUMMARY MARCH 2013

DIGITAL MEDIA/COMMERCE PUBLIC COMPANY VALUATION($ in millions, except stock price data)
Lifestyle and EntertainmentStock Price Chg % From Equity Ent. Cash & ST. Total LTM LTM Margin LTM LTM Multiples
Company Name Headquarters 03/28/13 52WK High Value Value Investments Debt Revenue EBITDA EBITDA Rev Growth EV/Rev EV/EBITDABetfair Group PLC United Kingdom 10.70 -20% 1,079.0 900.5 189.9 - 642.9 102.7 16.0% 7.5% 1.4x 8.8xCyberAgent Inc. Japan 1,830.94 -32% 1,185.8 356.8 934.6 1.8 1,731.8 210.0 12.1% 21.8% 0.2x 1.7xDemand Media, Inc. United States 8.63 -31% 743.4 641.9 102.9 1.5 380.6 68.6 18.0% 17.1% 1.7x 9.4xDeNA Co., Ltd. Japan 27.22 -25% 3,651.7 3,168.4 573.3 - 2,225.0 959.5 43.1% 42.1% 1.4x 3.3xFacebook, Inc. * United States 25.58 -43% 60,935.0 53,665.0 9,626.0 2,356.0 5,089.0 1,187.0 23.3% 37.1% 10.5x 45.2xG5 Entertainment AB (publ) Sweden 8.69 -3% 76.4 74.4 2.1 - 12.4 5.5 44.4% 73.6% 6.0x 13.5xGameLoft SA France 6.54 -11% 520.1 464.1 55.8 0.5 241.8 29.4 12.2% 21.1% 1.9x 15.8xGlu Mobile, Inc. United States 3.00 -49% 199.9 177.6 22.3 - 87.5 (9.8) NM 32.2% 2.0x NM Gree, Inc. Japan 12.57 -49% 2,933.2 2,738.2 496.4 282.5 1,891.6 891.4 47.1% 49.5% 1.4x 3.1xIAC/InterActiveCorp United States 44.68 -20% 3,764.8 3,700.1 770.6 595.8 2,800.9 418.8 15.0% 36.0% 1.3x 8.8xInternational Game Technology United States 16.50 -6% 4,362.6 5,937.4 200.7 1,775.5 2,235.5 818.3 36.6% 14.6% 2.7x 7.3xKongzhong Corp. China 6.20 -24% 265.6 127.4 138.2 - 180.6 30.8 17.0% 15.6% 0.7x 4.1xLinkedIn Corporation * United States 176.06 -4% 19,200.0 18,450.4 749.5 - 972.3 125.5 12.9% 86.2% 19.0x 147.0xMeetMe, Inc. United States 2.28 -51% 84.5 91.2 5.0 11.7 46.7 (0.9) NM 335.8% 2.0x NM Mixi, Inc. * Japan 17.57 -30% 2.7 (130.8) 145.2 - 158.7 48.9 30.8% -1.7% NM NM NCsoft Corporation South Korea 139.13 -53% 2,765.4 2,290.6 527.5 11.4 708.5 177.4 25.0% 23.8% 3.2x 12.9xNexon Co. Ltd. Japan 9.71 -46% 4,231.4 3,470.0 1,476.5 607.3 1,253.8 698.9 55.7% 23.8% 2.8x 5.0xPacific Online Ltd China 0 38 20% 408 0 337 5 38 3 114 8 48 1 41 9% 11 8% 2 9x 7 0xPacific Online Ltd. China 0.38 -20% 408.0 337.5 38.3 - 114.8 48.1 41.9% 11.8% 2.9x 7.0xPandora Media, Inc. United States 14.16 -46% 2,448.2 2,359.2 89.0 - 427.1 (30.8) NM 55.7% 5.5x NM Perform Group plc. United Kingdom 7.08 -10% 1,692.4 1,654.5 54.6 11.5 246.4 53.6 21.7% 46.9% 6.7x 30.9xPhoenix New Media Limited China 4.16 -47% 324.2 139.5 184.7 - 178.2 15.6 8.7% 16.9% 0.8x 9.0xRediff.com India Limited India 2.78 -61% 76.7 52.2 - - 16.1 (7.6) NM -23.0% 3.2x NM Renren Inc. China 2.89 -63% 1,091.0 185.8 905.5 - 176.1 (83.1) NM 49.3% 1.1x NM Sky-mobi Limited * China 1.81 -50% 58.4 (38.2) 97.0 - 99.3 1.5 1.5% -9.5% NM NM Spark Networks, Inc. United States 7.04 -15% 147.5 137.1 10.5 - 61.7 (7.5) NM 27.3% 2.2x NM Taomee Holdings Ltd. China 4.03 -30% 147.6 29.1 118.6 - 40.2 5.1 12.7% -11.4% 0.7x 5.7xThe Active Network, Inc. United States 4.19 -76% 255.4 202.1 58.5 5.2 418.9 4.3 1.0% 24.2% 0.5x 47.1xTheStreet, Inc. United States 1.91 -17% 63.6 21.6 41.9 - 50.7 (2.3) NM -12.2% 0.4x NM eS ee , U ed S a es 9 % 63 6 6 9 50 ( 3) NM 12.2% 0.4x NM United Online, Inc. United States 6.03 -10% 555.1 662.7 136.4 244.0 870.9 101.2 11.6% -3.0% 0.8x 6.6xWebMD Health Corp. United States 24.32 -6% 1,192.0 1,000.2 991.8 800.0 469.9 23.2 4.9% -15.9% 2.1x 43.1xWebMediaBrands Inc United States 1.64 -80% 9.9 15.3 2.2 7.6 14.0 (1.7) NM 12.3% 1.1x NM YY Inc. China 16.90 -19% 918.7 693.7 225.0 - 131.6 21.2 16.1% 156.5% 5.3x 32.8xZynga, Inc. United States 3.36 -74% 2,639.3 1,454.5 1,284.8 100.0 1,281.3 57.0 4.5% 12.4% 1.1x 25.5x
Adjusted Weighted Average 2.4x 33.3x
*Calculation is market cap weighted and excludes revenue multiples that are 2.0 standard deviations above the mean (10.4x)and EBITDA multiples that are 1.0 standard deviations above the mean (52.3x)
10M&A & INVESTMENT SUMMARY MARCH 2013

Transactions by Subsegment and Buyer TypeDIGITAL ADVERTISING
• There were 38 transactions announced in the Digital Advertising segment, up 46 percent from the previous month. Of these, 20 reported $151 million in value
• Select acquisitions› J.P. Morgan’s $35 million acquisition of daily deals startup Bloomspot, which partners with restaurants, spas,
resorts and other businesses to deliver offers to consumers in New York, Chicago, and other cities› Monster Offers’ acquisition of Black Flyday, Deal Buzzer, and My Shopping Circle, which operate as
deal/shopping brands, along with a 10 percent stake in mobile app developer Iconosys• Select investments
› ABS Capital Partners’ $30 million investment in Alloy Digital, which owns and operates a network of youth-focused websites and television channels
› The $11 million investment in FindTheBest, a comparison commerce platform for consumer goods, education and healthcare providers, business and finance service providers, and more, led by New World Ventures
DIGITAL ADVERTISING TRANSACTIONS BY SEGMENT BUYER/INVESTOR BREAKDOWN
Transactions Reported Value Strategic Buyout Venture/Growth Capital
# % $MM % # $MM # $MM # $MM
Digital Promotion/Coupon 8 21% 40.8 27% 6 35.5 1 - 1 5.3
Ad Networks/Exchanges 7 18% 53.8 36% 2 - 0 - 5 53.8
Digital Video 7 18% 17.8 12% 3 - 0 - 4 17.8
Local Search 6 16% 7.0 5% 2 - 0 - 4 7.0
Mobile Marketing 4 11% 6 3 4% 3 - 0 - 1 6 3
Transactions Reported Value Strategic Buyout Venture/Growth Capital
Mobile Marketing 4 11% 6.3 4% 3 - 0 - 1 6.3
Comparison Shopping 3 8% 19.0 13% 1 - 0 - 2 19.0
Vertical Search 2 5% 6.3 4% 0 - 0 - 2 6.3
Search Marketing 1 3% - 0% 1 - 0 - 0 -
Total 38 100% 151.0 100% 18 35.5 1 0.0 19 115.5
11M&A & INVESTMENT SUMMARY MARCH 2013

DIGITAL ADVERTISING PUBLIC COMPANY VALUATION($ in millions, except stock price data)
Stock Price Chg % From Equity Ent. Cash & ST. Total LTM LTM Margin LTM LTM Multiples Company Name Headquarters 03/28/13 52WK High Value Value Investments Debt Revenue EBITDA EBITDA Rev Growth EV/Rev EV/EBITDABlinkx plc United States 1.27 -12% 460.0 421.0 41.6 - 151.8 16.5 10.9% 82.2% 2.8x 25.5xBlucora, Inc. United States 15.49 -17% 634.6 546.6 162.3 74.3 406.9 68.3 16.8% 77.8% 1.3x 8.0xConstant Contact, Inc. United States 13.01 -58% 399.2 305.7 93.5 - 252.2 19.8 7.8% 17.6% 1.2x 15.5xDemand Media, Inc. United States 8.63 -31% 743.4 641.9 102.9 1.5 380.6 68.6 18.0% 17.1% 1.7x 9.4xDigital Globe Services Inc. United States 2.50 -1% 74.2 76.1 0.9 2.9 22.8 3.6 15.8% 0.0% 3.3x 21.0xExactTarget, Inc. United States 23.35 -16% 1,603.5 1,495.3 109.4 1.2 292.3 4.1 1.4% 40.9% 5.1x NM Google Inc. United States 802.66 -5% 264,607.5 223,729.5 48,088.0 7,210.0 50,175.0 16,278.0 32.4% 32.4% 4.5x 13.7x
Channel Networks & Platforms
Hi-Media S.A. France 2.25 -37% 99.7 133.8 19.1 52.7 256.8 17.2 6.7% -15.3% 0.5x 7.8xMillennial Media Inc. United States 6.63 -76% 525.5 388.1 137.4 - 177.7 (1.8) NM 71.4% 2.2x NM Motricity, Inc. United States 0.35 -76% 16.6 14.1 51.5 22.5 90.0 13.7 15.2% -7.9% 0.2x 1.0xOpera Software ASA Norway 6.35 -19% 773.3 718.9 57.2 - 216.0 60.0 27.8% 34.0% 3.3x 12.0xOPT, Inc. Japan 9.75 -7% 286.9 149.2 171.1 6.0 912.3 26.6 2.9% 26.7% 0.2x 5.6xPacific Online Ltd. China 0.39 -18% 419.2 348.7 38.3 - 114.8 48.1 41.9% 11.8% 3.0x 7.2xReachLocal, Inc. United States 14.89 -1% 420.9 325.4 95.5 - 455.4 7.6 1.7% 21.3% 0.7x 42.8xResponsys, Inc. United States 8.48 -35% 416.6 311.1 106.7 1.1 162.8 19.3 11.8% 20.7% 1.9x 16.1xRovi Corporation United States 21.24 -37% 2,139.6 2,760.2 863.3 1,484.0 650.6 235.8 36.2% -4.5% 4.2x 11.7xSepteni Holdings Co., Ltd. Japan 1,176.16 -7% 148.3 114.6 55.7 10.8 491.8 20.3 4.1% 19.8% 0.2x 5.6xThe Active Network Inc United States 4 08 76% 248 7 195 4 58 5 5 2 418 9 4 3 1 0% 24 2% 0 5x 45 6xThe Active Network, Inc. United States 4.08 -76% 248.7 195.4 58.5 5.2 418.9 4.3 1.0% 24.2% 0.5x 45.6xTiVo Inc. United States 12.09 -10% 1,523.7 1,068.9 627.2 172.5 303.9 (31.4) NM 27.6% 3.5x NM TradeDoubler AB Sweden 2.28 -54% 97.2 72.0 25.3 - 354.4 3.1 0.9% -11.7% 0.2x 23.1xValueClick, Inc. United States 29.20 -6% 2,211.1 2,216.9 136.6 142.5 660.9 200.5 30.3% 25.0% 3.4x 11.1xVelti Plc Ireland 1.88 -87% 123.4 115.1 36.6 28.2 270.3 5.0 1.9% 42.9% 0.4x 22.9xVocus Inc. United States 13.69 -34% 289.6 335.9 32.8 1.6 170.8 (0.4) NM 48.7% 2.0x NM Web.com Group, Inc. United States 17.19 -13% 819.2 1,496.8 15.2 692.8 407.6 53.9 13.2% 104.6% 3.7x 27.8xYahoo! Inc. United States 23.59 -1% 25,979.5 21,878.0 4,184.0 37.0 4,986.6 1,315.1 26.4% 0.0% 4.4x 16.6xYouku Tudou Inc. * China 16.86 -34% 2,763.8 2,160.9 604.2 1.2 288.1 7.7 2.7% 100.0% 7.5x 280.1x
Adjusted Weighted Average 4.4x 14.0x
*Calculation is market cap weighted and excludes revenue multiples that are 2.0 standard deviations above the mean (6.1x)and EBITDA multiples that are 1.0 standard deviations above the mean (85.9x)
12M&A & INVESTMENT SUMMARY MARCH 2013

DIGITAL ADVERTISING PUBLIC COMPANY VALUATION($ in millions, except stock price data)
preCommerceStock Price Chg % From Equity Ent. Cash & ST. Total LTM LTM Margin LTM LTM Multiples
Company Name Headquarters 03/28/13 52WK High Value Value Investments Debt Revenue EBITDA EBITDA Rev Growth EV/Rev EV/EBITDAAngie's List, Inc. United States 19.76 -2% 1,145.0 1,106.7 53.1 14.9 155.8 (48.8) NM 73.0% 7.1x NM Autobytel Inc. United States 4.34 -11% 38.4 28.1 15.3 5.0 66.8 3.5 5.2% 4.7% 0.4x 8.1xBankrate, Inc. United States 11.94 -53% 1,194.6 1,304.9 83.6 193.9 457.2 114.0 24.9% 7.8% 2.9x 11.4xCtrip.com International Ltd. China 21.38 -14% 2,968.1 2,461.2 774.9 252.7 667.2 119.0 17.8% 18.9% 3.7x 20.7xDice Holdings, Inc. United States 10.13 -8% 593.5 597.3 42.2 46.0 195.4 71.3 36.5% 9.1% 3.1x 8.4xeHealth, Inc. United States 17.88 -37% 374.1 233.3 140.8 - 155.5 20.2 13.0% 2.5% 1.5x 11.6xGroupon, Inc. United States 6.12 -68% 4,029.8 2,819.7 1,209.3 1.1 2,334.5 152.0 6.5% 45.0% 1.2x 18.6xHomeAway, Inc. United States 32.50 -5% 2,719.2 2,449.4 269.8 - 280.4 50.7 18.1% 21.8% 8.7x 48.3xKayak Software Corporation United States 39.96 -7% 1,540.9 1,363.1 178.4 - 282.8 54.0 19.1% 32.8% 4.8x 25.3xLeGuide.com S.A. France 34.63 -4% 121.8 89.8 32.8 - 57.7 15.5 26.8% 53.6% 1.6x 5.8xMakeMyTrip Limited India 13.90 -41% 516.5 443.6 74.4 0.8 220.6 (6.5) NM 21.9% 2.0x NM Monster Worldwide, Inc. United States 5.07 -49% 563.4 579.5 148.2 164.2 890.4 142.5 16.0% -10.4% 0.7x 4.1xMove, Inc. United States 11.95 -1% 473.2 446.1 27.1 - 199.2 16.2 8.1% 3.9% 2.2x 27.6xQuinStreet, Inc. United States 5.97 -50% 255.5 247.4 107.8 99.7 329.1 42.7 13.0% -16.4% 0.8x 5.8xRightmove plc United Kingdom 27.02 -2% 2,690.6 2,679.9 11.5 - 194.0 136.3 70.3% 23.0% 13.8x 19.7xTree.Com, Inc. United States 18.49 -1% 211.5 131.3 80.2 - 77.4 (1.7) NM 41.8% 1.7x NM TripAdvisor Inc. United States 52.52 -2% 7,505.4 7,431.1 486.5 412.1 763.0 309.6 40.6% 19.8% 9.7x 24.0xT li I U it d St t 31 38 18% 977 6 887 6 100 0 10 0 68 1 (7 0) NM 76 8% 13 0 NM Trulia, Inc. United States 31.38 -18% 977.6 887.6 100.0 10.0 68.1 (7.0) NM 76.8% 13.0x NM Yelp, Inc. United States 23.71 -20% 1,510.7 1,415.5 95.1 - 137.6 (11.4) NM 65.2% 10.3x NM Zillow, Inc. * United States 54.67 -5% 1,855.5 1,661.4 194.1 - 116.9 12.4 10.6% 76.9% 14.2x 134.3x
Adjusted Weighted Average 7.3x 23.1x
*Calculation is market cap weighted and excludes revenue multiples that are 2.0 standard deviations above the mean (14.7x)and EBITDA multiples that are 1.0 standard deviations above the mean (57.3x)
13M&A & INVESTMENT SUMMARY MARCH 2013

MARKETING TECHNOLOGYTransactions by Subsegment and Buyer Type
• There were 68 deals announced in the Marketing Technology segment, up nearly 20 percent from the previous month. Of those, 53 reported $548 million in value
• Select acquisitions› IMS Health’s acquisition of Appature, which offers relationship marketing management software and Web
applications to the healthcare industry› SDL’s acquisition of Bemoko, a supplier of mobile Web solutions that optimize user experiences
• Select investments› Meritech Capital Partners’ $30 million investment in Anaplan, a provider of cloud-based planning, forecasting,
and analytics solutions for analysts, managers, and executives, along with the $30 million investment in Hybris Software, which offers a commerce platform provider for manufacturers and retailers, co-led by Meritech Capital Partners and Greylock
# % $MM % # $MM # $MM # $MM
S i l T h l 14 21% 41 1 7% 3 4 1 0 11 37 0
MARKETING TECHNOLOGY TRANSACTIONS BY SEGMENT BUYER/INVESTOR BREAKDOWN
Transactions Reported Value Strategic Buyout Venture/Growth Capital
Social Technology 14 21% 41.1 7% 3 4.1 0 - 11 37.0
Analytics & Reporting 8 12% 30.0 5% 2 9.5 0 - 6 20.5
Content Management 8 12% 29.7 5% 3 - 0 - 5 29.7
BI Tools 5 7% 107.5 20% 2 15.5 0 - 3 92.0
Ad Serving 4 6% 9.1 2% 0 - 0 - 4 9.1
Media Management System 4 6% 19.1 3% 1 6.1 0 - 3 13.0
Mobile Technology 4 6% 3.8 1% 2 - 0 - 2 3.8
SFA/Lead Management 4 6% 122.0 22% 1 110.0 0 - 3 12.0
CRM 4 6% 102.0 19% 2 100.0 0 - 2 2.0
Commerce Management 3 4% 35.3 6% 0 - 0 - 3 35.3
Other* 8 12% 47.7 9% 4 25.4 0 - 4 22.3
Total 68 100% 548.0 100% 21 270.6 0 0.0 47 277.5
14M&A & INVESTMENT SUMMARY MARCH 2013
*Other includes Email/Mesaging Software, Marketing Asset Management, MRM/Workflow Management, Online Targeting/Optimization, Teleservices/eServices, Web to Print, and Website Creation/Hosting

MARKETING TECHNOLOGY PUBLIC COMPANY VALUATION($ in millions, except stock price data)
Stock Price Chg % From Equity Ent. Cash & ST. Total LTM LTM Margin LTM LTM Multiples Company Name Headquarters 03/28/13 52WK High Value Value Investments Debt Revenue EBITDA EBITDA Rev Growth EV/Rev EV/EBITDAAdobe Systems Inc. United States 43.52 0% 21,824.9 19,695.6 3,660.7 1,531.4 4,366.3 1,296.0 29.7% 3.1% 4.5x 15.2xBazaarvoice, Inc. United States 7.32 -65% 532.8 427.3 105.5 - 148.4 (27.0) NM 57.9% 2.9x NM Blackbaud Inc. United States 29.63 -13% 1,317.0 1,520.3 13.5 216.8 447.4 64.8 14.5% 20.6% 3.4x 23.5xConstant Contact, Inc. United States 12.98 -58% 398.3 304.8 93.5 - 252.2 19.8 7.8% 17.6% 1.2x 15.4xDealertrack Technologies, Inc. United States 29.38 -13% 1,265.0 1,249.6 177.8 162.5 388.9 53.5 13.8% 10.1% 3.2x 23.4xDemandware, Inc. United States 25.35 -26% 761.8 660.0 107.1 5.4 79.5 (3.8) NM 40.5% 8.3x NM Digital Generation, Inc. United States 6.42 -51% 177.6 546.7 84.8 453.9 386.6 100.6 26.0% 19.2% 1.4x 5.4xDigital River Inc United States 14 14 26% 499 8 104 1 705 6 309 9 386 2 37 5 9 7% 3 0% 0 3x 2 8x
Marketing Applications
Digital River Inc. United States 14.14 -26% 499.8 104.1 705.6 309.9 386.2 37.5 9.7% -3.0% 0.3x 2.8xeBay Inc. United States 54.22 -5% 70,224.6 65,335.6 9,408.0 4,519.0 14,072.0 4,119.0 29.3% 20.8% 4.6x 15.9xExactTarget, Inc. United States 23.27 -17% 1,598.0 1,489.8 109.4 1.2 292.3 4.1 1.4% 40.9% 5.1x NM Jive Software, Inc. United States 15.20 -46% 1,000.2 865.6 145.4 10.8 113.7 (36.6) NM 47.1% 7.6x NM LivePerson Inc. United States 13.58 -31% 758.4 655.0 103.3 - 157.4 19.0 12.1% 18.3% 4.2x 34.5xMarin Software Incorporated United States 16.43 -18% 507.9 487.1 31.5 10.8 59.6 (22.6) NM 64.9% 8.2x NM Market Leader, Inc. United States 8.96 -1% 240.3 218.1 22.2 - 45.0 (3.7) NM 32.2% 4.8x NM Responsys, Inc. United States 8.85 -32% 434.8 329.3 106.7 1.1 162.8 19.3 11.8% 20.7% 2.0x 17.1xOracle Corporation United States 32.33 -11% 152,295.6 139,082.6 33,407.0 19,752.0 37,149.0 17,286.0 46.5% 0.5% 3.7x 8.0xsalesforce.com, inc United States 178.83 -5% 26,189.1 25,969.4 867.6 647.9 3,050.2 84.0 2.8% 34.6% 8.5x NM Teradata Corporation United States 58.51 -28% 9,657.6 9,202.6 729.0 274.0 2,665.0 662.0 24.8% 12.8% 3.5x 13.9xe adata Co po at o U ted States 58 5 8% 9,65 6 9, 0 6 9 0 0 ,665 0 66 0 24.8% 12.8% 3.5x 13.9xThe Active Network, Inc. * United States 4.19 -76% 255.4 202.1 58.5 5.2 418.9 4.3 1.0% 24.2% 0.5x 47.1xVocus Inc. United States 14.15 -31% 299.3 345.7 32.8 1.6 170.8 (0.4) NM 48.7% 2.0x NM
Adjusted Weighted Average 4.5x 11.2x
*Calculation is market cap weighted and excludes revenue multiples that are 2.0 standard deviations above the mean (9.1x)and EBITDA multiples that are 1.0 standard deviations above the mean (35.2x)
15M&A & INVESTMENT SUMMARY MARCH 2013

MARKETING TECHNOLOGY PUBLIC COMPANY VALUATION($ in millions, except stock price data)
Stock Price Chg % From Equity Ent. Cash & ST. Total LTM LTM Margin LTM LTM Multiples Company Name Headquarters 03/28/13 52WK High Value Value Investments Debt Revenue EBITDA EBITDA Rev Growth EV/Rev EV/EBITDAActuate Corporation United States 6.01 -18% 286.7 221.0 66.5 0.8 138.8 23.9 17.2% 2.9% 1.6x 9.2xBitauto Holdings Limited China 9.90 -5% 407.7 311.4 96.3 - 169.6 26.8 15.8% 57.8% 1.8x 11.6xBrightcove, Inc. United States 6.21 -76% 174.0 145.9 30.0 - 88.0 (9.9) NM 38.4% 1.7x NM E2open, Inc. * United States 19.94 -9% 499.8 467.4 33.5 1.1 74.4 4.4 5.9% 22.2% 6.3x 106.3xInformatica Corporation United States 34.47 -37% 3,717.2 3,184.1 535.6 - 811.6 180.3 22.2% 3.5% 3.9x 17.7xInfosystems S.A. Poland 1.17 -32% 4.8 4.5 0.6 0.3 2.1 0.8 38.8% 40.7% 2.2x 5.6xInteractive Intelligence Group Inc. * United States 44.35 -2% 879.8 810.9 68.9 - 237.4 11.1 4.7% 13.3% 3.4x 73.1x
Marketing-related Infrastructure
IBM Corporation United States 213.30 -1% 237,725.0 259,942.0 11,176.0 33,269.0 104,507.0 26,858.0 25.7% -2.3% 2.5x 9.7xKeynote Systems, Inc. United States 13.96 -31% 255.0 203.8 51.2 - 125.2 16.4 13.1% 12.5% 1.6x 12.4xMercadolibre, Inc. Argentina 96.56 -5% 4,263.2 4,072.2 195.2 0.1 373.6 138.6 37.1% 25.0% 10.9x 29.4xMicroStrategy Inc. United States 101.08 -37% 1,141.0 918.7 224.4 - 594.6 49.9 8.4% 5.8% 1.5x 18.4xNetSuite Inc. * United States 80.06 0% 5,864.6 5,681.8 185.9 3.0 308.8 (16.1) NM 30.7% 18.4x NM Nuance Communications, Inc. United States 20.18 -25% 6,382.4 7,761.0 961.1 2,335.0 1,753.1 379.4 21.6% 27.4% 4.4x 20.5xOpenText Corporation Canada 59.02 -6% 3,456.9 3,671.0 367.3 581.4 1,276.3 372.0 29.1% 10.2% 2.9x 9.9xOpera Software ASA Norway 6.37 -19% 773.3 718.9 57.2 - 216.0 60.0 27.8% 34.0% 3.3x 12.0xPTC Inc. United States 25.49 -12% 3,045.6 3,165.3 248.4 368.1 1,257.2 225.0 17.9% 3.2% 2.5x 14.1xQlik Technologies, Inc. * United States 25.83 -23% 2,231.8 2,036.0 195.8 - 388.5 19.9 5.1% 21.2% 5.2x 102.4xRealNetworks Inc United States 7 71 23% 272 5 1 1 271 4 258 8 (25 3) NM 22 9% 0 0x NM RealNetworks Inc. United States 7.71 -23% 272.5 1.1 271.4 - 258.8 (25.3) NM -22.9% 0.0x NM Sage Group plc United Kingdom 5.20 -4% 6,128.9 6,349.6 99.3 337.3 2,160.7 639.4 29.6% 0.5% 2.9x 9.9xSAP AG Germany 80.34 -4% 95,726.8 98,921.4 3,466.3 6,918.1 21,389.7 7,223.9 33.8% 14.0% 4.6x 13.7xSky-mobi Limited * China 1.81 -50% 58.4 (38.2) 97.0 - 99.3 1.5 1.5% -9.5% NM NM Synchronoss Technologies, Inc. United States 31.03 -7% 1,173.2 1,126.5 56.2 9.5 273.7 60.6 22.2% 19.5% 4.1x 18.6xTIBCO Software Inc. United States 20.22 -42% 3,245.9 3,002.7 761.7 560.2 1,036.7 210.1 20.3% 7.9% 2.9x 14.3xVerint Systems Inc. United States 36.55 2% 1,920.0 2,563.6 192.0 592.6 839.5 156.7 18.7% 7.3% 3.1x 16.4x
Adjusted Weighted Average 3.2x 11.4x
*Calculation is market cap weighted and excludes revenue multiples that are 2.0 standard deviations above the mean (11.6x)and EBITDA multiples that are 1.0 standard deviations above the mean (56.5x)
16M&A & INVESTMENT SUMMARY MARCH 2013

AGENCYTransactions by Subsegment and Buyer Type
• Activity in the Agency segment increased nearly 50 percent from the previous month, with 14 acquisitions announced, of which four reported $28 million in value
• Select acquisitions› St Ives Marketing Services‘ $23 million acquisition of UK-based Amaze, which operates as a digital marketing
and technology company, from UK-based digital and communication services firm Hasgrove› WPP’s acquisition of Canada-based john st., a $14 million creative digital ad agency› IPG Mediabrands’s acquisition of India-based digital marketing company Interactive Avenues Marketing
Solutions, from Sequoia Capital India
# % $MM % # $MM # $MM # $MM
Digital Agency 7 50% 22.8 82% 7 22.8 0 - 0 -
Marketing Consulting 5 36% 3.0 11% 4 2.9 1 0.1 0 -
Branded Communications 1 7% 2.0 7% 1 2.0 0 - 0 -
AGENCY TRANSACTIONS BY SEGMENT BUYER/INVESTOR BREAKDOWN
Transactions Reported Value Strategic Buyout Venture/Growth Capital
Branded Communications 1 7% 2.0 7% 1 2.0 0 0
Design Agency 1 7% - 0% 1 - 0 - 0 -
Total 14 100% 27.8 100% 13 27.7 1 0.1 0 0.0
17M&A & INVESTMENT SUMMARY MARCH 2013

AGENCY PUBLIC COMPANY VALUATION($ in millions, except stock price data)
Stock Price Chg % From Equity Ent. LTM LTM Margin LTM LTM Multiples Company Name Headquarters 03/28/13 52WK High Value Value Revenue EBITDA EBITDA Rev Growth EV/Rev EV/EBITDAAcquity Group Limited Hong Kong $6.43 -42% $151.2 $114.8 $141.0 $27.7 19.7% 32.2% 0.8x 4.1xCello Group Plc United Kingdom 0.76 -6% 62.9 76.1 219.7 13.1 6.0% 1.2% 0.3x 5.8xCharm Communications Inc. China 5.01 -57% 195.1 88.1 165.5 (2.6) NM -40.9% 0.5x NM Chime Communications plc * United Kingdom 3.90 -5% 313.3 309.0 559.5 19.4 3.5% 5.6% 0.6x 15.9xCreston plc United Kingdom 1.30 -11% 78.6 81.7 121.9 22.0 18.1% 4.6% 0.7x 3.7xDentsu Inc. Japan 30.82 -4% 7,679.8 7,613.4 22,520.5 774.4 3.4% 5.7% 0.3x 9.8xEnero Group Limited Australia 0.39 -60% 33.1 16.4 307.1 3.8 1.2% -17.8% 0.1x 4.3xp 1.2% 17.8% 0.1x 4.3xHavas France 6.26 -3% 2,392.1 3,020.7 2,344.3 356.3 15.2% 8.1% 1.3x 8.5xHuntsworth plc United Kingdom 0.78 -13% 197.7 303.0 276.6 44.4 16.1% 1.0% 1.1x 6.8xM&C Saatchi plc United Kingdom 3.05 -14% 193.5 170.5 275.5 31.7 11.5% 10.7% 0.6x 5.4xMDC Partners Inc. * United States 15.84 0% 495.2 1,031.9 1,070.7 59.3 5.5% 13.9% 1.0x 17.4xNext Fifteen Communications Group plc United Kingdom 1.69 -3% 100.7 107.8 143.6 17.9 12.5% 6.4% 0.8x 6.0xOmnicom Group Inc. United States 58.64 -2% 15,328.8 17,779.1 14,219.4 2,086.9 14.7% 2.5% 1.3x 8.5xOPT, Inc. Japan 9.75 -7% 286.9 149.2 912.3 26.6 2.9% 26.7% 0.2x 5.6xPublicis Groupe SA France 66.24 -5% 13,910.2 13,704.5 8,715.1 1,677.1 19.2% 13.7% 1.6x 8.2xSapient Corp United States 12 11 -5% 1 672 5 1 432 1 1 121 0 140 1 12 5% 9 8% 1 3x 10 2xSapient Corp. United States 12.11 5% 1,672.5 1,432.1 1,121.0 140.1 12.5% 9.8% 1.3x 10.2xThe Interpublic Group of Companies, Inc. United States 13.04 -3% 5,397.4 5,740.8 6,956.2 826.0 11.9% -0.8% 0.8x 7.0xWPP plc Ireland 15.74 -5% 19,905.1 24,547.0 16,860.0 2,844.5 16.9% 3.5% 1.5x 8.6x
1.2x 8.5x
*Calculation is market cap weighted and excludes revenue multiples that are 2.0 standard deviations above the mean (1.7x)and EBITDA multiples that are 1.0 standard deviations
above the mean (11.8x)
Adjusted Weighted Average
18M&A & INVESTMENT SUMMARY MARCH 2013

MARKETING SERVICESTransactions by Subsegment and Buyer Type
• There were 12 transactions announced in the Marketing Services segment in March, up from three in the previous month. The most active subsegment was Printing Services with five deals announced
• Select acquisitions› AlloyASL’s acquisition of Student Marketing Group, which offers lists and telemarketing for high school
through college students and young adults› Exact Data’s acquisition of direct mail list management companies ConsumerBase and Statlistics
• Select investments› The $1 million investment in AnyPerk, a startup focused on discounts for companies on Internet services and
employee perks› The $1 million investment in Billaway (aka Neighbor Marketing) a startup providing a rewards program for › The $1 million investment in Billaway (aka Neighbor Marketing), a startup providing a rewards program for
customers of utility companies
# % $MM % # $MM # $MM # $MM
MARKETING SERVICES TRANSACTIONS BY SEGMENT BUYER/INVESTOR BREAKDOWN
Transactions Reported Value Strategic Buyout Venture/Growth Capital
$ $ $ $
Printing Services 5 42% - 0% 3 - 1 - 1 -
List Broker/Manager 2 17% - 0% 2 - 0 - 0 -
Logistics 2 17% 5.0 67% 1 - 0 - 1 5.0
Loyalty/Retention 2 17% 2.5 33% 0 - 0 - 2 2.5
Ad Specialty/Premiums 1 8% - 0% 1 - 0 - 0 -
Total 12 100% 7.5 100% 7 0.0 1 0.0 4 7.5Total 12 100% 7.5 100% 7 0.0 1 0.0 4 7.5
19M&A & INVESTMENT SUMMARY MARCH 2013
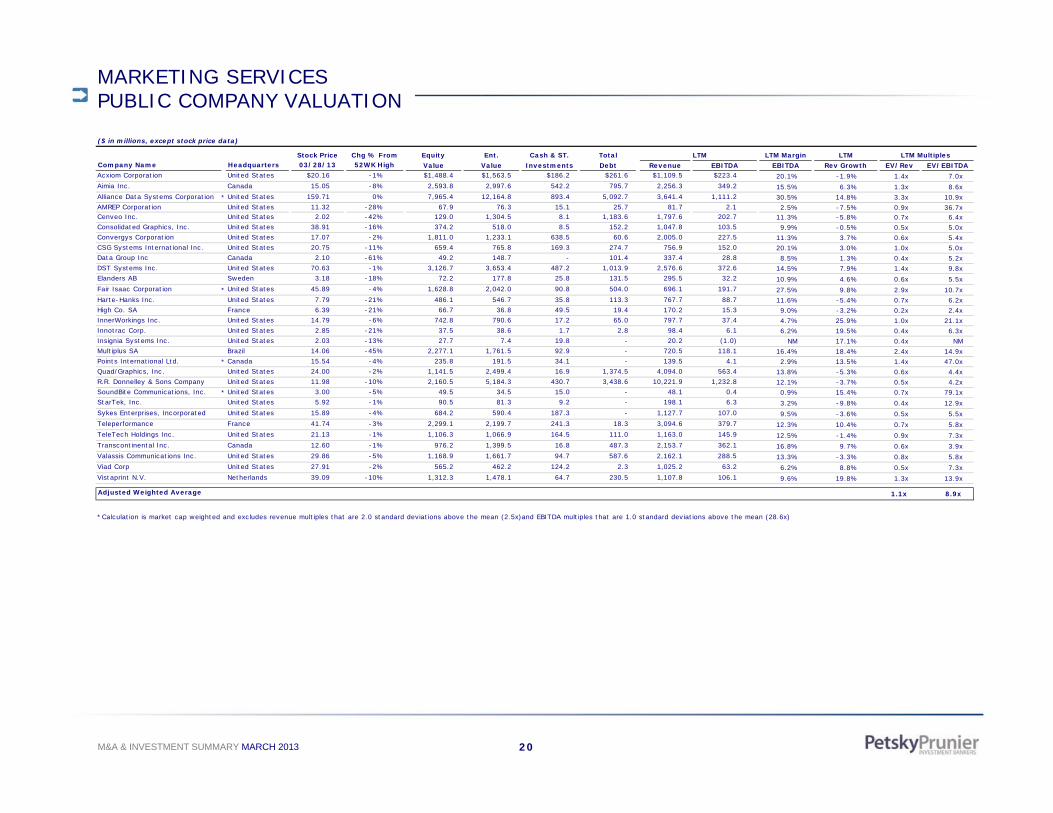
MARKETING SERVICES PUBLIC COMPANY VALUATION
($ in millions, except stock price data)
Stock Price Chg % From Equity Ent. Cash & ST. Total LTM LTM Margin LTM LTM Multiples Company Name Headquarters 03/28/13 52WK High Value Value Investments Debt Revenue EBITDA EBITDA Rev Growth EV/Rev EV/EBITDAAcxiom Corporation United States $20.16 -1% $1,488.4 $1,563.5 $186.2 $261.6 $1,109.5 $223.4 20.1% -1.9% 1.4x 7.0xAimia Inc. Canada 15.05 -8% 2,593.8 2,997.6 542.2 795.7 2,256.3 349.2 15.5% 6.3% 1.3x 8.6xAlliance Data Systems Corporation * United States 159.71 0% 7,965.4 12,164.8 893.4 5,092.7 3,641.4 1,111.2 30.5% 14.8% 3.3x 10.9xAMREP Corporation United States 11.32 -28% 67.9 76.3 15.1 25.7 81.7 2.1 2.5% -7.5% 0.9x 36.7xCenveo Inc. United States 2.02 -42% 129.0 1,304.5 8.1 1,183.6 1,797.6 202.7 11.3% -5.8% 0.7x 6.4xConsolidated Graphics, Inc. United States 38.91 -16% 374.2 518.0 8.5 152.2 1,047.8 103.5 9.9% -0.5% 0.5x 5.0xConvergys Corporation United States 17.07 -2% 1,811.0 1,233.1 638.5 60.6 2,005.0 227.5 11.3% 3.7% 0.6x 5.4xCSG Systems International Inc. United States 20.75 -11% 659.4 765.8 169.3 274.7 756.9 152.0 20.1% 3.0% 1.0x 5.0xData Group Inc Canada 2.10 -61% 49.2 148.7 - 101.4 337.4 28.8 8.5% 1.3% 0.4x 5.2xDST Systems Inc. United States 70.63 -1% 3,126.7 3,653.4 487.2 1,013.9 2,576.6 372.6 14.5% 7.9% 1.4x 9.8xElanders AB Sweden 3.18 -18% 72.2 177.8 25.8 131.5 295.5 32.2 10.9% 4.6% 0.6x 5.5xFair Isaac Corporation * United States 45.89 -4% 1,628.8 2,042.0 90.8 504.0 696.1 191.7 27.5% 9.8% 2.9x 10.7xHarte-Hanks Inc. United States 7.79 -21% 486.1 546.7 35.8 113.3 767.7 88.7 11.6% -5.4% 0.7x 6.2xHigh Co. SA France 6.39 -21% 66.7 36.8 49.5 19.4 170.2 15.3 9.0% -3.2% 0.2x 2.4xInnerWorkings Inc. United States 14.79 -6% 742.8 790.6 17.2 65.0 797.7 37.4 4.7% 25.9% 1.0x 21.1xInnotrac Corp. United States 2.85 -21% 37.5 38.6 1.7 2.8 98.4 6.1 6.2% 19.5% 0.4x 6.3xInsignia Systems Inc. United States 2.03 -13% 27.7 7.4 19.8 - 20.2 (1.0) NM 17.1% 0.4x NM Multiplus SA Brazil 14.06 -45% 2,277.1 1,761.5 92.9 - 720.5 118.1 16.4% 18.4% 2.4x 14.9xPoints International Ltd. * Canada 15.54 -4% 235.8 191.5 34.1 - 139.5 4.1 2.9% 13.5% 1.4x 47.0xQuad/Graphics, Inc. United States 24.00 -2% 1,141.5 2,499.4 16.9 1,374.5 4,094.0 563.4 13.8% -5.3% 0.6x 4.4xR.R. Donnelley & Sons Company United States 11.98 -10% 2,160.5 5,184.3 430.7 3,438.6 10,221.9 1,232.8 12.1% -3.7% 0.5x 4.2xSoundBite Communications, Inc. * United States 3.00 -5% 49.5 34.5 15.0 - 48.1 0.4 0.9% 15.4% 0.7x 79.1xStarTek, Inc. United States 5.92 -1% 90.5 81.3 9.2 - 198.1 6.3 3.2% -9.8% 0.4x 12.9xSykes Enterprises, Incorporated United States 15.89 -4% 684.2 590.4 187.3 - 1,127.7 107.0 9.5% -3.6% 0.5x 5.5xTeleperformance France 41.74 -3% 2,299.1 2,199.7 241.3 18.3 3,094.6 379.7 12.3% 10.4% 0.7x 5.8xTeleTech Holdings Inc. United States 21.13 -1% 1,106.3 1,066.9 164.5 111.0 1,163.0 145.9 12.5% -1.4% 0.9x 7.3xTranscontinental Inc. Canada 12.60 -1% 976.2 1,399.5 16.8 487.3 2,153.7 362.1 16.8% 9.7% 0.6x 3.9xValassis Communications Inc. United States 29.86 -5% 1,168.9 1,661.7 94.7 587.6 2,162.1 288.5 13 3% -3 3% 0 8x 5 8xValassis Communications Inc. United States 29.86 5% 1,168.9 1,661.7 94.7 587.6 2,162.1 288.5 13.3% 3.3% 0.8x 5.8xViad Corp United States 27.91 -2% 565.2 462.2 124.2 2.3 1,025.2 63.2 6.2% 8.8% 0.5x 7.3xVistaprint N.V. Netherlands 39.09 -10% 1,312.3 1,478.1 64.7 230.5 1,107.8 106.1 9.6% 19.8% 1.3x 13.9x
1.1x 8.9xAdjusted Weighted Average
*Calculation is market cap weighted and excludes revenue multiples that are 2.0 standard deviations above the mean (2.5x)and EBITDA multiples that are 1.0 standard deviations above the mean (28.6x)
20M&A & INVESTMENT SUMMARY MARCH 2013

TRADITIONAL MEDIATransactions by Subsegment and Buyer Type
• There were 18 transactions announced in the Tradition Media segment, of which 11 reported $4.1 billion in value• Select acquisitions
› Sinclair Broadcast Group’s $370 million acquisition of 18 broadcast television stations owned by Barrington Broadcasting Group
› SFX Entertainment’s $102 million acquisition of Netherlands based ID&T an entertainment media company › SFX Entertainment s $102 million acquisition of Netherlands-based ID&T, an entertainment media company specializing in creating music and dance events. SFX Entertainment also raised approximately $10 million from WPP, and in February, acquired Beatport for $50 million
› NC2 Media’s $63 million acquisition of Lonely Planet Publications, which publishes guidebooks, digital books, city guides, and maps that provide travel details
• Select investments› Liberty Media’s $2.6 billion purchase of a 27 percent stake in cable services provider Charter
Communications, from Oaktree Capital Management, Crestview Partners, and Apollo Global Management , at a valuation of $22.6 billion
› The $60 million investment in Daisy, which offers a streaming streaming music service built internally by headphone and speaker maker Beats Electronics, led by an individual investor
# % $MM % # $MM # $MM # $MM
Broadcast Television 4 22% 600.5 14% 4 600.5 0 - 0 -
Entertainment Media 4 22% 106.6 3% 4 106.6 0 - 0 -
TRADITIONAL MEDIA TRANSACTIONS BY SEGMENT BUYER/INVESTOR BREAKDOWN
Transactions Reported Value Strategic Buyout Venture/Growth Capital
Entertainment Media 4 22% 106.6 3% 4 106.6 0 0
Radio 4 22% 78.2 2% 2 18.2 1 - 1 60.0
Newspaper Publishing 2 11% - 0% 1 - 1 - 0 -
Cable & Satellite Television 2 11% 3,288.4 79% 0 - 0 - 2 3,288.4
Consumer Book Publishing 1 6% 62.2 2% 1 62.2 0 - 0 -
Digital Place-Based Media 1 6% 9.5 0% 0 - 0 - 1 9.5
Total 18 100% 4 145 4 100% 12 787 5 2 0 0 4 3 357 9
21M&A & INVESTMENT SUMMARY MARCH 2013
Total 18 100% 4,145.4 100% 12 787.5 2 0.0 4 3,357.9

TRADITIONAL MEDIA PUBLIC COMPANY VALUATIONS
($ in millions, except stock price data)
Large Cap Diversified MediaStock Price Chg % From Equity Ent. Cash & ST. Total LTM LTM Margin LTM LTM Multiples
Company Name Headquarters 03/28/13 52WK High Value Value Investments Debt Revenue EBITDA EBITDA Rev Growth EV/Rev EV/EBITDACBS Corporation United States $46.16 -3% $29,329.5 $34,543.5 $708.0 5,922.0 $14,089.0 $3,488.0 24.8% 3.3% 2.5x 9.9xDiscovery Communications, Inc. * United States 78.59 -2% 27,857.5 31,805.5 1,297.0 5,243.0 4,487.0 1,997.0 44.5% 7.7% 7.1x 15.9xNews Corp. United States 30.23 -2% 70,364.6 80,517.6 7,806.0 16,457.0 34,333.0 6,862.0 20.0% 0.5% 2.3x 11.7xTime Warner Inc. United States 56.63 -2% 52,937.2 69,968.2 2,841.0 19,871.0 28,729.0 7,280.0 25.3% -0.8% 2.4x 9.6xViacom, Inc. United States 61.36 -5% 30,424.2 38,308.2 671.0 8,389.0 13,249.0 3,913.0 29.5% -11.9% 2.9x 9.8xThe Walt Disney Company United States 56.47 -2% 101,953.0 118,557.0 3,207.0 17,457.0 42,840.0 10,900.0 25.4% 4.6% 2.8x 10.9x
2.6x 10.6xAdjusted Weighted Average
*Calculation is market cap weighted and excludes revenue multiples that are 2.0 standard deviations above the mean (7.0x)and EBITDA multiples that are 1.0 standard deviations above the mean (13.7x)
Radio BroadcastingStock Price Chg % From Equity Ent. Cash & ST. Total LTM LTM Margin LTM LTM Multiples
Company Name Headquarters 03/28/13 52WK High Value Value Investments Debt Revenue EBITDA EBITDA Rev Growth EV/Rev EV/EBITDABeasley Broadcast Group Inc. United States $6.64 -4% $151.4 $256.5 $11.7 116.8 $100.2 $29.6 29.5% 2.6% 2.6x 8.7xCC Media Holdings, Inc. United States 3.00 -54% 257.2 20,150.0 1,235.3 20,824.0 6,246.9 1,905.2 30.5% 1.4% 3.2x 10.6xCumulus Media Inc. United States 3.37 -8% 591.6 3,276.5 47.0 2,692.0 1,076.6 354.1 32.9% 107.0% 3.0x 9.3xDial Global, Inc. * United States 0.33 -91% 18.8 295.2 16.3 282.2 246.1 18.3 7.4% 165.6% 1.2x 16.1xEmmis Communications Corp. United States 1.65 -36% 65.1 262.4 11.2 160.6 227.6 34.3 15.1% 0.2% 1.2x 7.6xEntercom Communications Corp. United States 7.49 -11% 276.8 850.4 6.6 599.5 388.9 109.1 28.1% 1.6% 2.2x 7.8xJournal Communications Inc. United States 6.65 -3% 336.7 580.5 2.6 54.6 400.0 88.2 22.0% 12.1% 1.5x 6.6xRadio One Inc. United States 1.73 -11% 86.6 1,087.0 48.8 819.3 424.6 120.6 28.4% 16.4% 2.6x 9.0xSalem Communications Corp. United States 8.19 -3% 201.1 469.7 0.4 248.9 229.2 50.0 21.8% 5.0% 2.0x 9.4xSIRIUS XM Radio Inc. * United States 3.08 -5% 20,201.7 22,116.0 520.9 2,435.2 3,402.0 1,138.3 33.5% 12.9% 6.5x 19.4xSpanish Broadcasting System Inc. United States 2.42 -68% 17.6 359.3 30.3 279.7 140.8 41.3 29.4% 2.2% 2.6x 8.7xPandora Media, Inc. United States 14.02 -46% 2,424.0 2,335.0 80.5 - 427.1 (30.8) NM 55.7% 5.5x NM
4.1x 8.7xAdjusted Weighted Average
*Calculation is market cap weighted and excludes revenue multiples that are 2.0 standard deviations above the mean (6.1x)and EBITDA multiples that are 1.0 standard deviations above the mean (14.2x)
B-to-B MediaStock Price Chg % From Equity Ent. Cash & ST. Total LTM LTM Margin LTM LTM Multiples
Company Name Headquarters 03/28/13 52WK High Value Value Investments Debt Revenue EBITDA EBITDA Rev Growth EV/Rev EV/EBITDAEuromoney Institutional Investor PLC United Kingdom $14.19 -3% $1,788.4 $1,846.0 $21.8 72.6 $635.5 $186.4 29.3% 8.5% 2.9x 9.9xGlobal Sources Ltd. Bermuda 7.57 -11% 257.2 152.3 110.8 - 231.7 41.8 18.0% 3.0% 0.7x 3.6xInforma plc Switzerland 7.91 -2% 4,767.9 5,980.8 38.8 1,343.0 2,003.3 581.4 29.0% -3.4% 3.0x 10.3xTechTarget, Inc. United States 4.95 -35% 193.5 138.5 57.3 - 100.0 14.7 14.7% -5.2% 1.4x 9.4xThe Dolan Company United States 2.49 -74% 75.5 238.5 15.6 192.0 254.3 31.7 12.4% -5.3% 0.9x 7.5xUBM plc Ireland 10.54 -13% 2,585.4 3,507.4 169.9 1,011.8 1,296.7 315.3 24.3% -17.9% 2.7x 11.1x
2.8x 10.3xAdjusted Weighted Average
*Calculation is market cap weighted and excludes revenue multiples that are 2.0 standard deviations above the mean (3.8x)and EBITDA multiples that are 1.0 standard deviations above the mean (11.4x)
22M&A & INVESTMENT SUMMARY MARCH 2013

TRADITIONAL MEDIA PUBLIC COMPANY VALUATIONS
($ in millions, except stock price data)
PublishingStock Price Chg % From Equity Ent. Cash & ST. Total LTM LTM Margin LTM LTM Multiples
Company Name Headquarters 03/28/13 52WK High Value Value Investments Debt Revenue EBITDA EBITDA Rev Growth EV/Rev EV/EBITDAA. H. Belo Corporation United States $5.57 -1% $123.2 $89.2 $34.1 - $440.0 $32.7 7.4% -4.6% 0.2x 2.7xDaily Mail and General Trust plc * United Kingdom 10.65 -4% 3,971.5 5,057.7 168.8 1,173.7 2,816.3 513.3 18.2% -0.1% 1.8x 9.9xEmmis Communications Corp. United States 1.65 -36% 65.1 262.4 11.2 160.6 227.6 34.3 15.1% 0.2% 1.2x 7.6xGannett Co., Inc. United States 21.87 -1% 5,018.6 6,475.6 237.4 1,634.8 5,353.2 1,105.9 20.7% 2.2% 1.2x 5.9xGlacier Media, Inc. Canada 1.86 -23% 166.2 338.3 6.8 139.8 331.1 46.8 14.1% 23.4% 1.0x 7.2xJohn Wiley & Sons Inc. United States 38.41 -26% 2,283.1 2,733.4 92.6 703.8 1,769.5 334.3 18.9% -0.2% 1.5x 8.2xJournal Communications Inc. United States 6.65 -3% 336.7 580.5 2.6 54.6 400.0 88.2 22.0% 12.1% 1.5x 6.6xMartha Stewart Living Omnimedia Inc United States 2 56 -35% 172 0 122 9 49 1 - 197 6 (3 3) NM 10 8% 0 6x NM Martha Stewart Living Omnimedia Inc. United States 2.56 -35% 172.0 122.9 49.1 - 197.6 (3.3) NM -10.8% 0.6x NM Meredith Corporation United States 38.61 -16% 1,699.6 2,039.8 24.7 365.0 1,434.8 264.3 18.4% 6.4% 1.4x 7.7xReed Elsevier Group * United Kingdom 11.71 -2% 25,289.8 30,370.5 2,673.1 2,407.7 9,554.5 2,209.0 2.3% 2.3% 3.2x 13.7xScholastic Corporation United States 26.48 -28% 847.3 801.2 257.3 211.2 1,968.8 174.5 8.9% -2.3% 0.4x 4.6xThe E. W. Scripps Company United States 12.03 -1% 688.2 643.9 242.6 196.1 903.5 138.9 15.4% 24.0% 0.7x 4.6xThe McClatchy Company United States 2.98 -14% 256.2 2,092.8 15.7 1,751.6 1,230.7 316.1 25.7% -3.1% 1.7x 6.6xThe McGraw-Hill Companies, Inc. * United States 50.46 -14% 14,217.8 15,595.8 761.0 1,256.0 4,450.0 1,526.0 34.3% 12.5% 3.5x 10.2xThe New York Times Company United States 9.93 -10% 1,469.2 1,214.3 614.1 776.9 1,990.1 281.5 14.1% 1.9% 0.6x 4.3xThe Washington Post Company United States 449.16 -2% 3,334.4 3,126.2 729.9 457.7 4,017.7 545.0 13.6% -2.7% 0.8x 5.7xValassis Communications Inc. United States 29.86 -5% 1,168.9 1,661.7 94.7 587.6 2,162.1 288.5 13.3% -3.3% 0.8x 5.8x
1 2x 6 1xAdjusted Weighted Average 1.2x 6.1xAdjusted Weighted Average
*Calculation is market cap weighted and excludes revenue multiples that are 2.0 standard deviations above the mean (3.1x)and EBITDA multiples that are 1.0 standard deviations above the mean (9.8x)
Entertainment MediaStock Price Chg % From Equity Ent. Cash & ST. Total LTM LTM Margin LTM LTM Multiples
Company Name Headquarters 03/28/13 52WK High Value Value Investments Debt Revenue EBITDA EBITDA Rev Growth EV/Rev EV/EBITDADreamWorks Animation SKG Inc. United States $19.05 -17% $1,616.7 $1,723.0 $59.2 $165.0 $749.8 $105.5 14.1% 6.2% 2.3x 16.3xEros International Plc United Kingdom 3.51 -26% 436.9 621.6 102.1 260.5 200.9 57.8 28.8% 6.5% 3.1x 10.8xLions Gate Entertainment Corp. * United States 23.92 0% 3,233.6 4,553.4 48.2 1,367.9 2,567.6 198.7 7.7% 94.6% 1.8x 22.9xLive Nation Entertainment, Inc. United States 12.61 0% 2,371.3 3,305.5 1,001.1 1,740.0 5,819.0 410.8 7.1% 8.1% 0.6x 8.0xVillage Roadshow Limited Australia 5.12 -4% 859.5 1,142.6 174.0 446.3 964.2 170.7 17.7% 2.3% 1.2x 6.7xWorld Wrestling Entertainment Inc. United States 8.73 -3% 652.6 500.2 152.3 - 484.0 64.4 13.3% 0.0% 1.0x 7.8x
1.5x 10.3xAdjusted Weighted Average
*Calculation is market cap weighted and excludes revenue multiples that are 2.0 standard deviations above the mean (3.5x)and EBITDA multiples that are 1.0 standard deviations above the mean (18.4x)
Film ExhibitionStock Price Chg % From Equity Ent. Cash & ST. Total LTM LTM Margin LTM LTM Multiples
Company Name Headquarters 03/28/13 52WK High Value Value Investments Debt Revenue EBITDA EBITDA Rev Growth EV/Rev EV/EBITDACarmike Cinemas Inc. United States $18.22 -4% $324.1 $690.2 $82.0 $325.0 $539.3 $97.9 18.1% 12.9% 1.3x 7.1xCinemark Holdings Inc. United States 29.47 -1% 3,387.6 4,584.2 540.8 1,717.0 2,473.5 546.6 22.1% 8.5% 1.9x 8.4xCineplex Inc. Canada 33.71 -1% 2,118.1 2,239.9 47.9 172.2 1,095.4 200.5 18.3% 9.4% 2.0x 11.2xIMAX Corporation * Canada 26.72 -1% 1,779.3 1,769.0 21.3 11.0 283.6 74.9 26.4% 21.9% 6.2x 23.6xNational CineMedia, Inc. United States 15.41 -9% 877.3 1,732.4 106.6 879.0 448.8 212.2 47.3% 3.1% 3.9x 8.2xRealD Inc. United States 12.86 -17% 640.7 647.4 27.7 35.0 220.2 43.3 19.7% -13.7% 2.9x 15.0xRegal Entertainment Group United States 16.66 -1% 2,570.2 4,464.4 109.5 2,005.5 2,824.2 533.5 18.9% 5.3% 1.6x 8.4x
2 7x 9 3xAdjusted Weighted Average
23M&A & INVESTMENT SUMMARY MARCH 2013
2.7x 9.3xAdjusted Weighted Average
*Calculation is market cap weighted and excludes revenue multiples that are 2.0 standard deviations above the mean (6.3x)and EBITDA multiples that are 1.0 standard deviations above the mean (17.6x)

TRADITIONAL MEDIA PUBLIC COMPANY VALUATIONS
($ in millions, except stock price data)
P bli hiOut-of-Home MediaStock Price Chg % From Equity Ent. Cash & ST. Total LTM LTM Margin LTM LTM Multiples
Company Name Headquarters 03/28/13 52WK High Value Value Investments Debt Revenue EBITDA EBITDA Rev Growth EV/Rev EV/EBITDAAirMedia Group Inc. * China $1.80 -46% $112.7 ($8.0) $116.1 $0.0 $286.7 $21.4 7.5% 6.0% NM NM APG|SGA SA Switzerland 238.14 -3% 699.5 646.1 56.5 0.0 343.1 73.0 21.3% 5.7% 1.9x 8.9xClear Channel Outdoor Holdings Inc. United States 7.52 -11% 2,686.7 7,307.3 572.1 4,944.8 2,946.9 697.0 23.7% -1.9% 2.5x 10.5xClear Media Ltd. Hong Kong 0.69 -8% 363.9 211.0 166.4 - 196.4 80.2 40.9% 2.4% 1.1x 2.6xFocus Media Holding Ltd. Hong Kong 26.68 -1% 3,524.6 2,933.3 703.0 200.0 927.5 357.2 38.5% 17.0% 3.2x 8.2xJCDecaux SA France 26.95 -9% 5,985.8 5,895.0 398.6 555.0 3,458.1 717.4 20.7% 6.5% 1.7x 8.2xLamar Advertising Co. * United States 48.10 -1% 4,515.4 6,617.4 38.4 2,075.6 1,182.9 517.7 43.8% 4.4% 5.6x 12.8xMood Media Corporation Canada 1.37 -68% 234.7 692.4 11.4 480.7 443.8 72.3 16.3% 34.3% 1.6x 9.6xNational CineMedia, Inc. United States 15.41 -9% 877.3 1,732.4 106.6 879.0 448.8 212.2 47.3% 3.1% 3.9x 8.2xNTN Buzztime Inc. * United States 0.25 -11% 17.8 15.6 2.4 0.2 24.2 0.1 0.2% 0.5% 0.6x 268.4xTom Group Ltd. Hong Kong 0.11 -21% 420.9 645.2 110.1 285.8 284.6 1.8 0.6% -5.2% 2.3x NM Valassis Communications Inc. United States 29.86 -5% 1,168.9 1,661.7 94.7 587.6 2,162.1 288.5 13.3% -3.3% 0.8x 5.8x
2.2x 9.3x
*Calculation is market cap weighted and excludes revenue multiples that are 2.0 standard deviations above the mean (5.2x)and EBITDA multiples that are 1.0 standard deviations above the mean (116.6x)
Adjusted Weighted Average
Cable & Satellite TelevisionStock Price Chg % From Equity Ent. Cash & ST. Total LTM LTM Margin LTM LTM Multiples
Company Name Headquarters 03/28/13 52WK High Value Value Investments Debt Revenue EBITDA EBITDA Rev Growth EV/Rev EV/EBITDACablevision Systems Corporation United States $14.92 -21% $3,950.8 $14,621.1 $438.7 11,326.6 $6,705.5 $1,913.5 28.5% 0.1% 2.2x 7.6xCharter Communications, Inc. United States 104.29 -2% 10,551.9 23,419.9 7.0 12,875.0 7,504.0 2,644.0 35.2% 4.2% 3.1x 8.9xComcast Corporation United States 41.75 -1% 108,995.4 154,476.4 12,415.0 40,458.0 62,570.0 19,977.0 31.9% 12.0% 2.5x 7.7xDIRECTV United States 57.24 0% 32,680.7 48,706.7 1,902.0 17,528.0 29,740.0 7,226.0 24.3% 9.2% 1.6x 6.7xDish Network Corp. United States 38.02 0% 17,234.6 21,919.7 7,237.8 11,888.1 14,266.5 2,961.3 20.8% 1.6% 1.5x 7.4xGeneral Communication Inc. United States 8.72 -16% 360.3 1,325.7 27.6 948.7 710.2 219.4 30.9% 4.5% 1.9x 6.0xLib t Gl b l I * U it d St t 72 35 0% 18 039 8 45 908 7 2 230 2 30 224 0 10 310 8 4 757 2 46 1% 8 4% 4 5 9 7Liberty Global Inc. * United States 72.35 0% 18,039.8 45,908.7 2,230.2 30,224.0 10,310.8 4,757.2 46.1% 8.4% 4.5x 9.7xTime Warner Cable Inc. United States 96.01 -6% 28,372.3 51,896.3 3,470.0 26,990.0 21,386.0 7,587.0 35.5% 8.7% 2.4x 6.8xVirgin Media, Inc. United States 48.48 0% 13,056.3 22,526.8 345.2 9,815.7 6,664.8 2,687.5 40.3% 2.7% 3.4x 8.4xZiggo N.V. * Netherlands 31.05 -12% 6,209.6 9,933.7 121.9 3,964.7 2,026.3 1,108.5 54.7% 4.0% 4.9x 9.0x
2.6x 7.5xAdjusted Weighted Average
*Calculation is market cap weighted and excludes revenue multiples that are 2.0 standard deviations above the mean (5.1x)and EBITDA multiples that are 1.0 standard deviations above the mean (9.0x)
Cable NetworksStock Price Chg % From Equity Ent. Cash & ST. Total LTM LTM Margin LTM LTM Multiples
Company Name Headquarters 03/28/13 52WK High Value Value Investments Debt Revenue EBITDA EBITDA Rev Growth EV/Rev EV/EBITDAAMC Networks Inc. United States $62.76 0% $4,543.4 $6,123.6 $313.3 2,230.1 $1,352.6 $458.2 33.9% 13.9% 4.5x 13.4xBritish Sky Broadcasting Group plc United Kingdom 13.25 -4% 21,206.2 23,370.8 2,272.2 4,599.8 11,312.5 2,576.2 22.8% 2.7% 2.1x 9.1xCBS Corporation United States 46.16 -3% 29,329.5 34,543.5 708.0 5,922.0 14,089.0 3,488.0 24.8% 3.3% 2.5x 9.9xCrown Media Holdings Inc. United States 2.01 -7% 722.9 1,178.0 43.7 498.8 349.9 261.3 74.7% 8.2% 3.4x 4.5xDiscovery Communications, Inc. * United States 78.59 -2% 27,857.5 31,805.5 1,297.0 5,243.0 4,487.0 1,997.0 44.5% 7.7% 7.1x 15.9xGrupo Televisa, S.A.B. Mexico 26.53 -9% 15,142.3 18,364.1 1,878.1 4,465.0 5,337.6 2,050.1 38.4% 10.7% 3.4x 9.0xScripps Networks Interactive, Inc. United States 63.97 -4% 9,492.0 10,882.3 437.5 1,384.2 2,307.2 1,040.9 45.1% 11.3% 4.7x 10.5x
4.0x 9.7xAdjusted Weighted Average
24M&A & INVESTMENT SUMMARY MARCH 2013
*Calculation is market cap weighted and excludes revenue multiples that are 2.0 standard deviations above the mean (7.3x)and EBITDA multiples that are 1.0 standard deviations above the mean (13.9x)

TRADITIONAL MEDIA PUBLIC COMPANY VALUATIONS
($ in millions, except stock price data)
P bli hiBroadcast TelevisionStock Price Chg % From Equity Ent. Cash & ST. Total LTM LTM Margin LTM LTM Multiples
Company Name Headquarters 03/28/13 52WK High Value Value Investments Debt Revenue EBITDA EBITDA Rev Growth EV/Rev EV/EBITDABelo Corp. United States $9.69 -1% $987.3 $1,710.5 $9.4 733.0 $714.7 $259.2 36.3% 9.9% 2.4x 6.6xEntravision Communications Corporation United States 3.11 -12% 268.7 573.4 45.2 360.3 223.3 75.9 34.0% 14.8% 2.6x 7.6xFisher Communications, Inc. * United States 38.76 -2% 340.4 320.1 20.4 - 168.2 31.4 18.7% 2.6% 1.9x 10.2xGray Television Inc. United States 4.38 -12% 251.9 1,073.7 45.7 820.6 404.8 176.6 43.6% 31.8% 2.7x 6.1xJournal Communications Inc. United States 6.65 -3% 336.7 580.5 2.6 54.6 400.0 88.2 22.0% 12.1% 1.5x 6.6xLIN TV Corp. United States 10.76 -20% 582.4 1,429.6 46.3 890.2 553.5 210.7 38.1% 38.4% 2.6x 6.8xNexstar Broadcasting Group, Inc. United States 17.93 -3% 527.4 1,316.1 12.2 615.2 378.6 146.9 38.8% 23.5% 3.5x 9.0xSi l i B d G I U i d S 19 72 1% 1 609 7 3 877 1 22 9 2 273 4 1 061 7 419 3 Sinclair Broadcast Group Inc. * United States 19.72 -1% 1,609.7 3,877.1 22.9 2,273.4 1,061.7 419.3 39.5% 38.7% 3.7x 9.2xThe E. W. Scripps Company United States 12.03 -1% 688.2 643.9 242.6 196.1 903.5 138.9 15.4% 24.0% 0.7x 4.6x
2.6x 6.6xAdjusted Weighted Average
*Calculation is market cap weighted and excludes revenue multiples that are 2.0 standard deviations above the mean (4.2x)and EBITDA multiples that are 1.0 standard deviations above the mean (9.2x)
Yellow PagesStock Price Chg % From Equity Ent. Cash & ST. Total LTM LTM Margin LTM LTM Multiples
Company Name Headquarters 03/28/13 52WK High Value Value Investments Debt Revenue EBITDA EBITDA Rev Growth EV/Rev EV/EBITDA/ /Dex One Corporation United States $1.63 -38% $83.0 $1,921.0 $95.6 $2,005.9 $1,300.0 $508.4 39.1% -12.2% 1.5x 3.8xEniro AB Sweden 1.76 -29% 176.3 604.7 30.4 455.5 614.2 148.7 24.2% -7.5% 1.0x 4.1xPagesJaunes Groupe * France 2.16 -42% 599.6 2,795.8 155.0 2,421.3 1,405.8 593.0 42.2% -3.2% 2.0x 4.7xSuperMedia Inc. United States 3.68 -35% 57.6 1,394.6 94.0 1,475.0 1,354.0 588.0 43.4% -17.5% 1.0x 2.4xPubliGroupe AG Switzerland 149.43 -9% 337.0 210.3 114.2 52.8 311.4 (22.1) NM -16.9% 0.7x NM Yellow Media Limited Canada 9.48 -9% 265.1 1,034.4 107.2 891.4 1,111.3 525.3 47.3% -16.6% 0.9x 2.0x
1.3x 2.9xAdjusted Weighted Average
*Calculation is market cap weighted and excludes revenue multiples that are 2.0 standard deviations above the mean (2.1x)and EBITDA multiples that are 1.0 standard deviations above the mean (4.5x)
25M&A & INVESTMENT SUMMARY MARCH 2013

TECHNOLOGYTransactions by Subsegment and Buyer Type
• Activity in the Technology segment was led by the Financial subsegment, in which eight deals were announced with $33 million in reported value. Infrastructure was the highest reported value subsegment with three deals announced worth $423 million in reported value
• Select acquisitions› Cadence Design’s $380 million acquisition of Tensilica, which offers audio digital signal processor (DSP)
i t ll t l t (IP) d 4G b b d DSP IP f bil h d t d h t t i t intellectual property (IP) cores and 4G baseband DSP IP cores for mobile, handset, and home entertainment markets
› Oracle’s $100 million acquisition of Nimbula, a cloud operating system company providing infrastructure software for building private, hybrid, or public storage solutions
• Select investments› China Broadband Capita ‘s $44 million investment in Pluribus Networks, a provider of hardware-accelerated
network virtualization solutions for private and public cloud data centers› The $30 million investment in MapR Technologies, a company that has developed software to manage and
analyze big data, led by Mayfield Fund
# % $MM % # $MM # $MM # $MM
Financial 8 27% 32.7 5% 5 11.4 0 - 3 21.3
Big Data 5 17% 44.9 6% 0 - 0 - 5 44.9
Cloud Computing 5 17% 125 5 18% 3 100 0 0 2 25 5
TECHNOLOGY TRANSACTIONS BY SEGMENT BUYER/INVESTOR BREAKDOWN
Transactions Reported Value Strategic Buyout Venture/Growth Capital
Cloud Computing 5 17% 125.5 18% 3 100.0 0 - 2 25.5
Cloud Storage 4 13% 17.5 2% 0 - 0 - 4 17.5
Data Center 3 10% 16.0 2% 1 - 0 - 2 16.0
Infrastructure 3 10% 423.5 60% 1 380.0 0 - 2 43.5
Enabling 1 3% - 0% 1 - 0 - 0 -
Virtualization 1 3% 44.0 6% 0 - 0 - 1 44.0
26M&A & INVESTMENT SUMMARY MARCH 2013
Total 30 100% 704.0 100% 11 491.4 0 0.0 19 212.6

TECHNOLOGY PUBLIC COMPANY VALUATION
($ in millions, except stock price data)
Stock Price Chg % From Equity Ent. Cash & ST. Total LTM LTM Margin LTM LTM Multiples Company Name Headquarters 03/28/13 52WK High Value Value Investments Debt Revenue EBITDA EBITDA Rev Growth EV/Rev EV/EBITDA3M Company United States $105.29 -1% $72,649.0 $74,655.0 $4,531.0 $6,072.0 $29,904.0 $7,771.0 26.0% 1.0% 2.5x 9.6xACI Worldwide, Inc. United States 48.55 -1% 1,915.5 2,225.6 76.3 374.3 666.6 157.2 23.6% 43.3% 3.3x 14.2xADATA Technology Co., Ltd. Taiwan 1.64 -2% 345.1 429.2 76.6 192.2 971.0 26.8 2.8% -6.8% 0.4x 16.0xAdvanced Micro Devices, Inc. United States 2.55 -69% 1,821.2 2,861.2 1,002.0 2,042.0 5,422.0 9.0 0.2% -17.4% 0.5x NM Akamai Technologies, Inc. United States 35.16 -17% 6,257.5 5,820.2 437.6 - 1,373.9 501.1 36.5% 18.6% 4.2x 11.6xAVG Technologies N.V. Netherlands 13.70 -16% 740.0 785.3 51.9 97.2 356.0 99.3 27.9% 30.7% 2.2x 7.9xBrightcove, Inc. United States 6.22 -76% 174.3 146.2 30.0 - 88.0 (9.9) NM 38.4% 1.7x NM CA Technologies United States 25.01 -10% 11,402.7 10,283.7 2,560.0 1,441.0 4,680.0 1,690.0 36.1% -1.6% 2.2x 6.1xCarbonite, Inc. United States 10.89 -7% 282.2 226.9 55.3 - 84.0 (6.8) NM 38.9% 2.7x NM Check Point Software Technologies Ltd. Israel 47.24 -27% 9,402.1 7,898.8 1,503.3 - 1,342.7 761.4 56.7% 7.7% 5.9x 10.4xChinaCache International Holdings Ltd. China $3.73 -38% $85.5 $41.9 $43.6 $0.0 $122.2 $14.2 11.6% 38.6% 0.3x 2.9xCitrix Systems, Inc. United States 71.40 -19% 13,309.2 12,380.6 928.6 - 2,586.1 609.8 23.6% 17.2% 4.8x 20.3xCommVault Systems, Inc. * United States 83.29 -4% 3,844.5 3,447.3 397.2 - 471.6 77.6 16.5% 23.4% 7.3x 44.4xCray Inc. United States 22.47 0% 836.6 531.0 305.6 - 421.1 38.3 9.1% 78.4% 1.3x 13.8xCrossroads Systems, Inc. United States 2.15 -66% 25.4 25.6 6.9 4.3 15.0 (10.0) NM 7.2% 1.7x NM Datalink Corporation United States 12.27 -3% 228.6 224.3 10.3 6.0 491.2 23.9 4.9% 29.3% 0.5x 9.4xDell Inc. United States 14.34 -15% 25,055.1 21,384.1 12,777.0 9,085.0 56,940.0 4,223.0 7.4% -8.3% 0.4x 5.1xDot Hill Systems Corp. United States 1.09 -32% 64.0 26.5 40.5 1.8 194.5 (6.3) NM -0.7% 0.1x NM l dElecom Co., Ltd. Japan 14.27 -41% 314.0 233.5 115.5 27.3 738.4 81.9 11.1% 5.6% 0.3x 2.8x
EMC Corporation United States 23.83 -21% 50,056.1 46,765.8 6,167.1 1,710.1 21,713.9 5,180.4 23.9% 8.5% 2.2x 9.0xePlus inc. United States 46.38 -6% 378.0 452.6 43.4 117.9 965.8 72.7 7.5% 43.5% 0.5x 6.2xEuronet Worldwide Inc. United States 25.96 -1% 1,287.7 1,402.0 191.2 301.2 1,267.6 150.9 11.9% 9.2% 1.1x 9.3xF-Secure Oyj Finland 2.15 -18% 333.5 291.0 43.9 - 207.2 43.0 20.7% 7.6% 1.4x 6.8xFusion-io, Inc. * United States 16.39 -50% 1,583.2 1,214.6 368.5 - 439.5 24.0 5.5% 47.8% 2.8x 50.6xGemalto NV Netherlands 86.44 -11% 7,268.1 6,836.5 395.3 20.6 2,960.6 420.3 14.2% 11.4% 2.3x 16.3xGoogle Inc. United States 802.66 -5% 264,607.5 223,729.5 48,088.0 7,210.0 50,175.0 16,278.0 32.4% 32.4% 4.5x 13.7xGraphOn Corp. United States 0.51 -18% 44.1 39.2 4.9 - 6.7 (3.4) NM 1.9% 5.9x NM Green Dot Corporation United States 16.52 -39% 594.6 236.5 408.8 50.7 554.5 81.7 14.7% 14.4% 0.4x 2.9xI I U it d St t 38 06 10% 932 8 829 3 102 3 104 2 (5 3) 33 % 8 0Imperva Inc. United States 38.06 -10% 932.8 829.3 102.3 - 104.2 (5.3) NM 33.1% 8.0x NM Integrated Electrical Services, Inc. United States 6.40 -2% 96.7 88.3 20.9 12.5 474.4 5.0 1.1% 17.0% 0.2x 17.6xIntel Corporation United States 21.83 -25% 107,971.2 103,344.2 18,195.0 13,568.0 53,341.0 22,160.0 41.5% -1.2% 1.9x 4.7xIBM Corporation United States 210.89 -2% 235,039.0 257,256.0 11,176.0 33,269.0 104,507.0 26,858.0 25.7% -2.3% 2.5x 9.6xInterxion Holding NV Netherlands 24.07 -10% 1,641.0 1,930.3 90.6 379.9 365.4 143.9 39.4% 13.4% 5.3x 13.4xJ-Stream Inc. Japan 562.65 -10% 65.5 52.5 16.0 - 61.7 5.1 8.2% 2.4% 0.9x 10.4xKeynote Systems, Inc. United States 14.15 -30% 258.5 207.3 51.2 - 125.2 16.4 13.1% 12.5% 1.7x 12.7xLimelight Networks, Inc. United States 2.19 -36% 212.5 86.7 128.0 2.1 180.2 (5.0) NM 5.2% 0.5x NM LogMeIn, Inc. United States 19.12 -50% 474.4 262.4 212.1 - 138.8 13.7 9.9% 16.2% 1.9x 19.1xLSI Corporation United States 6.73 -24% 3,699.8 3,023.8 676.0 - 2,506.1 366.6 14.6% 22.6% 1.2x 8.2xM lb IT Ltd A t li 2 16 15% 178 2 195 3 18 5 35 6 177 1 24 3 13 7% 5 1% 1 1 8 0Melbourne IT Ltd. Australia 2.16 -15% 178.2 195.3 18.5 35.6 177.1 24.3 13.7% -5.1% 1.1x 8.0xMicron Technology Inc. United States 9.96 -3% 10,176.9 12,328.9 2,271.0 3,435.0 8,047.0 1,510.0 18.8% -4.0% 1.5x 8.2xMicrosoft Corporation United States 28.37 -14% 237,634.1 183,754.1 68,098.0 14,218.0 72,930.0 28,867.0 39.6% 1.2% 2.5x 6.4xNEC Corporation Japan 2.66 -10% 6,910.7 13,805.9 2,356.7 8,489.0 35,776.2 2,656.8 7.4% 1.9% 0.4x 5.2xNetApp, Inc. United States 33.70 -28% 12,145.7 7,659.4 6,723.9 2,237.6 6,318.4 857.5 13.6% 6.0% 1.2x 8.9xOracle Corporation United States 31.95 -12% 150,505.5 137,292.5 33,695.0 19,757.0 37,149.0 17,286.0 46.5% 0.5% 3.7x 7.9xProAct IT Group AB Sweden 13.96 -38% 130.0 144.6 15.8 28.9 373.7 22.2 5.9% 9.0% 0.4x 6.5xQUALCOMM Incorporated United States 66.68 -3% 114,564.9 101,340.9 13,275.0 31.0 20,458.0 7,226.0 35.3% 25.6% 5.0x 14.0xQualys, Inc. * United States 12.13 -26% 382.7 266.2 118.4 2.0 91.4 10.3 11.3% 20.0% 2.9x 25.7xQuantum Corporation United States 1.30 -52% 313.3 466.9 51.3 205.0 607.9 0.1 0.0% -7.5% 0.8x NM Rackspace Hosting Inc United States 49 74 39% 6 863 2 6 696 5 292 1 125 4 1 309 2 422 6 32 3% 27 7% 5 1 15 8
27M&A & INVESTMENT SUMMARY MARCH 2013
Rackspace Hosting, Inc. United States 49.74 -39% 6,863.2 6,696.5 292.1 125.4 1,309.2 422.6 32.3% 27.7% 5.1x 15.8xRed Hat, Inc. * United States 49.97 -20% 9,653.9 8,774.4 886.3 - 1,328.8 266.5 20.1% 17.3% 6.6x 32.9xSanDisk Corp. United States 54.98 -3% 13,296.7 12,113.6 2,875.5 1,696.6 5,052.5 1,108.3 21.9% -10.8% 2.4x 10.9xSAP AG Germany 79.15 -5% 94,312.5 97,495.3 3,466.3 6,918.1 21,389.7 7,223.9 33.8% 14.0% 4.6x 13.5xSeagate Technology Public Limited Company Ireland 36.68 -3% 13,163.0 14,123.0 1,872.0 2,818.0 16,332.0 4,342.0 26.6% 41.3% 0.9x 3.3x

TECHNOLOGY PUBLIC COMPANY VALUATION
($ in millions, except stock price data)
Stock Price Chg % From Equity Ent. Cash & ST. Total LTM LTM Margin LTM LTM Multiples Company Name Headquarters 03/28/13 52WK High Value Value Investments Debt Revenue EBITDA EBITDA Rev Growth EV/Rev EV/EBITDASilicon Graphics International Corp. United States 13.88 -13% 452.2 328.0 124.1 - 743.0 (6.3) NM 4.2% 0.4x NM SK Hynix, Inc. South Korea 26.49 -5% 18,385.2 22,600.0 1,677.9 6,085.1 9,554.8 2,798.3 29.3% -2.2% 2.4x 8.1xSony Corporation Japan 17.75 -5% 17,942.1 23,271.7 15,680.4 16,036.6 76,815.4 3,393.8 4.4% 2.6% 0.3x 6.9xSplunk, Inc. * United States 40.02 -2% 3,946.6 3,640.6 305.9 - 198.9 (17.4) NM 64.5% 18.3x NM Symantec Corporation United States 24.53 -2% 16,905.8 15,729.8 4,252.0 3,076.0 6,839.0 1,839.0 26.9% 1.7% 2.3x 8.6xSynchronoss Technologies, Inc. United States 30.00 -10% 1,134.2 1,087.6 56.2 9.5 273.7 60.6 22.2% 19.5% 4.0x 17.9xTeradata Corporation United States 57.25 -29% 9,449.6 8,994.6 729.0 274.0 2,665.0 662.0 24.8% 12.8% 3.4x 13.6xTrend Micro Inc. Japan 28.43 -6% 3,740.2 2,481.0 1,374.0 - 1,084.9 345.7 31.9% -2.6% 2.3x 7.2xThe KEYW Holding Corporation * United States 16.33 0% 596.4 680.5 5.6 89.7 243.5 29.0 11.9% 27.8% 2.8x 23.5xUnisys Corporation United States 22.96 -7% 1,013.0 828.9 655.6 210.3 3,706.4 373.9 10.1% -3.8% 0.2x 2.2xVeriSign, Inc. United States 47.12 -6% 7,188.7 6,329.9 1,556.4 697.6 873.6 511.4 58.5% 13.2% 7.2x 12.4xVMware, Inc. * United States 78.56 -34% 33,650.9 29,470.1 4,630.8 450.0 4,605.0 1,160.0 25.2% 22.2% 6.4x 25.4xWestern Digital Corporation United States 50.14 -2% 12,066.9 10,378.9 3,816.0 2,128.0 15,648.0 3,792.0 24.2% 67.5% 0.7x 2.7xXoom Corporation * United States 22.93 -7% 730.1 699.9 70.2 40.0 80.0 (2.8) NM 60.0% 8.7x NM
3.3x 9.8x
*Calculation is market cap weighted and excludes revenue multiples that are 2.0 standard deviations above the mean (8.7x)and EBITDA multiples that are 1.0 standard deviations above the mean (21.8x)
Adjusted Weighted Average
28M&A & INVESTMENT SUMMARY MARCH 2013

SOFTWARETransactions by Subsegment and Buyer Type
• There were 51 transactions announced in the Software segment, of which 27 reported $907 million in value• Select acquisitions
› Allscripts Healthcare Solutions’ $235 million acquisition of a 75 percent stake in dbMotion, a developer of system interfaces and data analytics tools for healthcare providers, and its acquisition of Jardogs, a developer of personal health record tools for outcomes management and home monitoring, as well as an in-office kiosk f t ti ti t i t ti d billifor automating patient registration and billing
› Apple’s $20 million acquisition if WifiSlam, an indoor-GPS company that has developed ways for mobile apps to detect a phone user’s location in a building using Wi-Fi signals
› SlideRocket’s acquisition of ClearSlide, which provides online presentation software solutions that connects users with their audience, co-workers, and Web-based content, from VMware
• Select investments› The $50 million investment in Actifio, a maker of virtualization data storage software systems for reducing
repetitive copies of data, led by Technology Crossover Ventures, at a valuation of approximately $500 million› The $45 million investment in AccessData Group, a company offering a suite of stand-alone and enterprise-
class tools that enable digital investigations, from Sorenson Capital Partners and Silicon Valley Bank
# % $MM % # $MM # $MM # $MM
Security 8 16% 134.0 15% 2 100.0 0 - 6 34.0
ERP 7 14% 17.2 2% 4 - 1 5.4 2 11.8
Healthcare 7 14% 239 0 26% 6 235 0 0 1 4 0
SOFTWARE TRANSACTIONS BY SEGMENT BUYER/INVESTOR BREAKDOWN
Transactions Reported Value Strategic Buyout Venture/Growth Capital
Healthcare 7 14% 239.0 26% 6 235.0 0 - 1 4.0
Legal 5 10% 203.3 22% 3 157.3 0 - 2 46.0
Application Management 4 8% 6.0 1% 3 - 0 - 1 6.0
Data Management 3 6% 50.0 6% 2 - 0 - 1 50.0
Software Development Tools 3 6% 17.8 2% 0 - 0 - 3 17.8
Financial 2 4% 164.2 18% 1 164.2 1 - 0 -
Oth * 10 20% 67 7 7% 6 29 5 0 4 38 2
29M&A & INVESTMENT SUMMARY MARCH 2013
Other* 10 20% 67.7 7% 6 29.5 0 - 4 38.2
Total 51 100% 907.2 100% 28 686.0 2 5.4 21 215.8
*Other includes Collaboration, Credit/Risk, Engineering, Geo-Demo, HR, and Infrastructure

SOFTWARE PUBLIC COMPANY VALUATIONS
($ in millions, except stock price data)
Stock Price Chg % From Equity Ent. Cash & ST. Total LTM LTM Margin LTM LTM Multiples Company Name Headquarters 03/28/13 52WK High Value Value Investments Debt Revenue EBITDA EBITDA Rev Growth EV/Rev EV/EBITDAAdvent Software, Inc. United States 27.97 -6% 1,412.3 1,337.9 169.4 95.0 358.8 76.0 21.2% 10.0% 3.7x 17.6xEbix Inc. United States 16.22 -35% 602.5 646.8 37.4 81.7 199.4 84.5 42.4% 18.0% 3.2x 7.7xEPIQ Systems, Inc. United States 14.03 -1% 504.0 712.6 3.8 212.4 344.8 74.5 21.6% 32.0% 2.1x 9.6xFidessa group plc United Kingdom 29.51 -3% 1,093.3 983.9 117.2 - 452.9 92.2 20.4% 0.1% 2.2x 10.7xGuidewire Software, Inc. * United States 38.44 -1% 2,169.9 2,004.1 165.8 - 260.1 18.7 7.2% 28.2% 7.7x 107.0xInnovation Group plc United Kingdom 0.39 0% 376.7 340.8 72.0 30.0 312.3 30.6 9.8% 10.2% 1.1x 11.1xManagement Consulting Group PLC United Kingdom 0.47 -21% 229.0 274.9 24.2 73.4 464.5 43.6 9.4% -5.6% 0.6x 6.3xModel N Inc United States 19 82 11% 424 9 417 5 12 7 5 3 88 5 1 5 1 7% 0 0% 4 7 NM
Financial & Credit/Risk Management Software
Model N, Inc. United States 19.82 -11% 424.9 417.5 12.7 5.3 88.5 1.5 1.7% 0.0% 4.7x NM NetSuite Inc. * United States 80.06 0% 5,864.6 5,681.8 185.9 3.0 308.8 (16.1) NM 30.7% 18.4x NM Performant Financial Corporation United States 12.28 -13% 573.7 683.7 37.8 147.8 210.1 67.5 32.1% 28.9% 3.3x 10.1xRealPage, Inc. United States 20.71 -23% 1,568.8 1,545.0 33.8 10.0 322.2 52.9 16.4% 24.9% 4.8x 29.2xSolera Holdings Inc. United States 58.33 -1% 4,018.2 4,820.8 448.2 1,152.6 801.3 338.8 42.3% 6.6% 6.0x 14.2xSS&C Technologies Holdings, Inc. United States 29.98 -1% 2,423.7 3,349.7 86.2 1,012.1 551.8 212.8 38.6% 48.8% 6.1x 15.7xTemenos Group AG Switzerland 23.78 0% 1,643.5 1,736.3 117.7 214.4 450.2 70.3 15.6% -4.9% 3.9x 24.7xTyler Technologies, Inc. United States 61.26 1% 1,928.6 1,940.2 6.4 18.0 363.3 69.3 19.1% 17.4% 5.3x 28.0x
Adjusted Weighted Average 5.0x 17.9x
Healthcare SoftwareStock Price Chg % From Equity Ent. Cash & ST. Total LTM LTM Margin LTM LTM Multiples
Company Name Headquarters 03/28/13 52WK High Value Value Investments Debt Revenue EBITDA EBITDA Rev Growth EV/Rev EV/EBITDAAccelrys Inc. United States 9.76 -2% 542.8 443.2 99.6 - 162.5 12.0 7.4% 12.6% 2.7x 37.0xAllscripts Healthcare Solutions, Inc. United States 13.59 -20% 2,399.2 2,739.5 104.0 444.3 1,446.3 124.3 8.6% 0.2% 1.9x 22.0xAthenahealth, Inc. * United States 97.04 -3% 3,525.7 3,332.6 193.1 - 422.3 51.1 12.1% 30.3% 7.9x 65.3xCegedim SA France 32.06 -9% 447.9 1,072.1 57.3 698.4 1,215.3 201.9 16.6% 1.1% 0.9x 5.3x
*Calculation is market cap weighted and excludes revenue multiples that are 2.0 standard deviations above the mean (13.3x)and EBITDA multiples that are 1.0 standard deviations above the mean (49.0x)
Cerner Corporation United States 94.74 1% 16,315.0 15,474.3 1,036.8 196.1 2,610.1 712.5 27.3% 20.9% 5.9x 21.7xComputer Programs & Systems Inc. United States 54.11 -13% 599.5 580.0 19.6 - 183.3 44.4 24.2% 5.7% 3.2x 13.0xCraneware plc United Kingdom 6.71 -9% 181.2 154.5 28.6 - 42.4 12.1 28.4% 5.3% 3.6x 12.8xGreenway Medical Technologies, Inc. * United States 15.90 -19% 471.0 443.7 27.4 - 134.7 7.9 5.9% 27.4% 3.3x 56.0xMcKesson Corporation United States 107.96 -3% 25,142.7 26,895.7 2,726.0 4,479.0 123,534.0 2,846.0 2.3% 3.0% 0.2x 9.5xMedAssets, Inc. United States 19.25 -4% 1,144.6 2,025.2 13.7 894.3 640.1 194.9 30.5% 10.7% 3.2x 10.4xMedidata Solutions, Inc. United States 57.98 2% 1,539.0 1,416.6 122.6 0.2 218.3 36.1 16.6% 18.4% 6.5x 39.2xMerge Healthcare Incorporated United States 2.89 -51% 270.1 483.6 37.1 250.1 248.9 30.9 12.4% 7.1% 1.9x 15.6xQuality Systems Inc. United States 18.27 -59% 1,087.7 981.0 106.7 - 457.9 108.0 23.6% 9.6% 2.1x 9.1xStreamline Health Solutions, Inc. United States 6.45 -4% 81.5 91.9 10.5 17.9 21.5 2.7 12.6% 23.0% 4.3x 33.8x
Adjusted Weighted Average 2.6x 15.4x
*Calculation is market cap weighted and excludes revenue multiples that are 2.0 standard deviations above the mean (7.7x)and EBITDA multiples that are 1.0 standard deviations above the mean (43.7x)
30M&A & INVESTMENT SUMMARY MARCH 2013

SOFTWARE PUBLIC COMPANY VALUATIONS
($ in millions, except stock price data)
HR SoftwareStock Price Chg % From Equity Ent. Cash & ST. Total LTM LTM Margin LTM LTM Multiples
Company Name Headquarters 03/28/13 52WK High Value Value Investments Debt Revenue EBITDA EBITDA Rev Growth EV/Rev EV/EBITDA51job Inc. China 59.41 -7% 1,716.6 1,310.4 406.1 - 232.2 82.4 35.5% 11.4% 5.6x 15.9xAllocate Software plc. United Kingdom 1.03 -25% 66.2 63.0 9.8 6.4 58.7 6.9 11.7% 21.3% 1.1x 9.2xConcur Technologies, Inc. United States 68.66 -10% 3,818.6 3,589.0 484.6 254.8 462.2 44.8 9.7% 25.1% 7.8x 80.1xCornerstone OnDemand, Inc. United States 34.10 -4% 1,733.5 1,662.7 76.4 5.6 117.9 (27.5) NM 61.5% 14.1x NM Dice Holdings, Inc. United States 10.13 -8% 593.5 597.3 42.2 46.0 195.4 71.3 36.5% 9.1% 3.1x 8.4xLinkedIn Corporation * United States 176.06 -4% 19,200.0 18,450.4 749.5 - 972.3 125.5 12.9% 86.2% 19.0x 147.0xMonster Worldwide, Inc. United States 5.07 -49% 563.4 579.5 148.2 164.2 890.4 142.5 16.0% -10.4% 0.7x 4.1xSaba Software Inc United States 7 95 30% 236 8 222 6 15 0 0 9 121 3 (9 8) NM 7 7% 1 8 NM Saba Software, Inc. United States 7.95 -30% 236.8 222.6 15.0 0.9 121.3 (9.8) NM 7.7% 1.8x NM The Ultimate Software Group, Inc. United States 104.16 -2% 2,867.5 2,809.8 68.0 10.3 332.3 41.4 12.5% 23.4% 8.5x 67.8xWorkday, Inc. * United States 61.63 -5% 10,230.6 9,465.2 790.3 25.0 273.7 (88.8) NM 103.6% 34.6x NM
Adjusted Weighted Average 14.8x 55.6x
Security SoftwareStock Price Chg % From Equity Ent. Cash & ST. Total LTM LTM Margin LTM LTM Multiples
*Calculation is market cap weighted and excludes revenue multiples that are 2.0 standard deviations above the mean (30.8x)and EBITDA multiples that are 1.0 standard deviations above the mean (101.1x)
Company Name Headquarters 03/28/13 52WK High Value Value Investments Debt Revenue EBITDA EBITDA Rev Growth EV/Rev EV/EBITDAAVG Technologies N.V. Netherlands 13.92 -15% 751.9 797.2 51.9 97.2 356.0 99.3 27.9% 30.7% 2.2x 8.0xCheckpoint Systems Inc. United States 13.06 -6% 532.6 527.7 118.8 113.3 690.8 38.5 5.6% -9.6% 0.8x 13.7xCisco Systems, Inc. United States 20.90 -5% 111,411.6 81,336.6 46,376.0 16,291.0 47,252.0 13,356.0 28.3% 5.4% 1.7x 6.1xFortinet Inc. United States 23.68 -18% 3,826.9 3,413.2 413.7 - 533.6 111.4 20.9% 23.1% 6.4x 30.6xInfoblox Inc. United States 21.70 -10% 1,060.5 880.6 179.8 - 192.4 (3.4) NM 26.7% 4.6x NM Symantec Corporation United States 24.68 -1% 17,009.2 15,833.2 4,252.0 3,076.0 6,839.0 1,839.0 26.9% 1.7% 2.3x 8.6xWebsense, Inc. United States 15.00 -32% 548.4 553.7 64.6 69.9 361.5 61.9 17.1% -0.7% 1.5x 8.9xGemalto NV Netherlands 87.27 -10% 7,338.3 6,905.1 472.8 13.5 2,960.6 420.3 14.2% 11.4% 2.3x 16.4xImperva Inc. United States 38.50 -9% 943.6 840.1 102.3 - 104.2 (5.3) NM 33.1% 8.1x NM Juniper Networks Inc United States 18 54 20% 9 444 8 7 595 2 2 849 3 999 2 4 365 4 596 8 13 7% 1 9% 1 7x 12 7xJuniper Networks, Inc. United States 18.54 -20% 9,444.8 7,595.2 2,849.3 999.2 4,365.4 596.8 13.7% -1.9% 1.7x 12.7xNQ Mobile Inc. * China 9.01 -29% 395.9 273.3 127.9 - 91.8 3.9 4.2% 125.6% 3.0x 70.1xPalo Alto Networks, Inc. United States 56.60 -22% 3,912.9 3,575.4 337.4 - 323.8 (1.4) NM 74.8% 11.0x NM Proofpoint, Inc. United States 16.86 -5% 557.1 474.6 86.5 4.0 106.3 (12.1) NM 29.9% 4.5x NM Qihoo 360 Technology Co. Ltd * China 29.63 -15% 3,536.4 3,155.7 380.8 - 329.0 66.7 20.3% 96.0% 9.6x 47.3xSourcefire, Inc. * United States 59.23 -1% 1,796.3 1,612.2 184.1 - 223.1 18.0 8.1% 34.7% 7.2x 89.4xTrend Micro Inc. Japan 27.97 -7% 3,680.3 2,416.8 1,374.0 - 1,084.9 345.7 31.9% -2.6% 2.2x 7.0xVeriSign, Inc. United States 47.27 -6% 7,211.6 6,352.7 1,556.4 697.6 873.6 511.4 58.5% 13.2% 7.3x 12.4x
Adjusted Weighted Average 2.4x 9.0x
*Calculation is market cap weighted and excludes revenue multiples that are 2.0 standard deviations above the mean (10.8x)and EBITDA multiples that are 1.0 standard deviations above the mean (52.4x)
31M&A & INVESTMENT SUMMARY MARCH 2013

SOFTWARE PUBLIC COMPANY VALUATIONS
($ in millions, except stock price data)
Engineering SoftwareStock Price Chg % From Equity Ent. Cash & ST. Total LTM LTM Margin LTM LTM Multiples
Company Name Headquarters 03/28/13 52WK High Value Value Investments Debt Revenue EBITDA EBITDA Rev Growth EV/Rev EV/EBITDAAnsys, Inc. United States 81.42 0% 7,567.2 7,043.2 577.2 53.1 798.0 379.9 47.6% 15.4% 8.8x 18.5xAutodesk, Inc. United States 41.25 -3% 9,231.8 8,023.1 1,954.3 745.6 2,312.2 477.6 20.7% 4.4% 3.5x 16.8xAveva Group plc United Kingdom 34.35 -3% 2,335.1 2,082.7 268.3 - 335.9 99.7 29.7% 15.3% 6.2x 20.9x
Adjusted Weighted Average 5.9x 17.6x
*Calculation is market cap weighted and excludes revenue multiples that are 2.0 standard deviations above the mean (11.5x)and EBITDA multiples that are 1.0 standard deviations above the mean (20.8x)
Infrastructure SoftwareStock Price Chg % From Equity Ent. Cash & ST. Total LTM LTM Margin LTM LTM Multiples
Company Name Headquarters 03/28/13 52WK High Value Value Investments Debt Revenue EBITDA EBITDA Rev Growth EV/Rev EV/EBITDABMC Software Inc. United States 46.33 -3% 6,620.0 6,781.5 1,181.5 1,343.0 2,197.5 608.2 27.7% 1.3% 3.1x 11.2xCA Technologies United States 25.18 -10% 11,480.2 10,361.2 2,560.0 1,441.0 4,680.0 1,690.0 36.1% -1.6% 2.2x 6.1xCommVault Systems, Inc. * United States 82.00 -6% 3,785.0 3,387.7 397.2 - 471.6 77.6 16.5% 23.4% 7.2x 43.6xDaegis Inc. United States 1.14 -34% 16.8 30.6 4.4 18.2 40.2 3.3 8.1% -11.5% 0.8x 9.4xGuidance Software, Inc. United States 10.85 -17% 277.8 245.7 32.6 0.6 129.5 7.1 5.5% 23.8% 1.9x 34.7xInformatica Corporation United States 34.47 -37% 3,717.2 3,184.1 535.6 - 811.6 180.3 22.2% 3.5% 3.9x 17.7xp , , % 3 5% 3 9IntraLinks Holdings, Inc. * United States 6.36 -8% 348.9 349.8 75.3 76.3 216.7 6.8 3.2% 1.8% 1.6x 51.2xPervasive Software Inc. United States 9.17 -1% 155.0 109.3 45.7 - 50.7 4.6 9.0% 2.8% 2.2x 23.9xServiceNow, Inc. * United States 36.20 -13% 4,774.8 4,460.1 314.7 - 243.7 (21.6) NM 66.1% 18.3x NM TIBCO Software Inc. United States 20.22 -42% 3,245.9 3,002.7 806.7 563.4 1,036.7 210.1 20.3% 7.9% 2.9x 14.3x
Adjusted Weighted Average 3.3x 10.6x
*Calculation is market cap weighted and excludes revenue multiples that are 2.0 standard deviations above the mean (14.8x)and EBITDA multiples that are 1.0 standard deviations above the mean (39.7x)
32M&A & INVESTMENT SUMMARY MARCH 2013

COMMUNICATIONSTransactions by Subsegment and Buyer Type
• There were 10 transactions in the Communications segment in March, of which six reported $244 million in value• Select acquisitions
› JDS Uniphase’s $85 million acquistion of UK-based Arieso, a provider of location-aware networking software for mobile carriers
› Westell Technologies’ $30 million acquisition of Kentrox which provides site monitoring management and › Westell Technologies $30 million acquisition of Kentrox, which provides site monitoring, management, and control solutions for wireless and fixed line telecommunications carriers, cable, and broadband network providers
› Oracle’s acquisition of Tekelec, a provider of network signaling, policy control, and subscriber data • Select investments
› The $16 million investment in AppNeta a maker of network and application performance management › The $16 million investment in AppNeta, a maker of network and application performance management software, from returning investors that included Bain Capital Ventures, Egan-Managed Capital, JMI Equity, and Business Development Bank of Canada
› The Bessemer Venture Partners-led $12 million investment Vasona Networks, a developer of software that enables mobile network operators to fine-tune all the traffic happening on their network
# % $MM % # $MM # $MM # $MM
Software Defined Networking 3 30% 101.0 41% 2 85.0 0 - 1 16.0
Communications Software 2 20% 13.0 5% 0 - 0 - 2 13.0
& d S f 2 20% 0% 2 0 0
COMMUNICATIONS TRANSACTIONS BY SEGMENT BUYER/INVESTOR BREAKDOWN
Transactions Reported Value Strategic Buyout Venture/Growth Capital
Messaging & Mediation Software 2 20% - 0% 2 - 0 - 0 -
Networking Equipment 2 20% 130.0 53% 2 130.0 0 - 0 -
Enterprise Mobility 1 10% - 0% 0 - 0 - 1 -
Total 10 100% 244.0 100% 6 215.0 0 0.0 4 29.0
33M&A & INVESTMENT SUMMARY MARCH 2013

COMMUNICATIONS PUBLIC COMPANY VALUATION
($ in millions, except stock
Stock Price Chg % From Equity Ent. Cash & ST. Total LTM LTM Margin LTM LTM Multiples Company Name Headquarters 03/28/13 52WK High Value Value Investments Debt Revenue EBITDA EBITDA Rev Growth EV/Rev EV/EBITDAAastra Technologies Ltd. Canada $19.92 -8% $229.9 $124.5 $107.7 0.2 $608.6 $37.5 6.2% -12.5% 0.2x 3.3xAcme Packet, Inc. * United States 29.22 -3% 2,019.4 1,661.1 358.2 - 274.4 9.1 3.3% -10.7% 6.1x 183.1xADTRAN Inc. United States 19.93 -37% 1,237.0 1,054.1 228.9 46.0 620.6 70.2 11.3% -13.5% 1.7x 15.0xAdvanced Media, Inc. Japan 610.33 -19% 93.1 70.5 24.7 - 15.4 (2.0) NM -10.0% 4.6x NM Alcatel-Lucent, S.A. France 1.31 -43% 2,971.6 3,772.8 6,498.8 6,343.2 19,046.7 982.3 5.2% -5.7% 0.2x 3.8xAllot Communications Ltd. Israel 12.41 -57% 404.2 261.2 142.9 - 104.8 12.9 12.3% 34.7% 2.5x 20.2xAmbient Corporation United States 2.53 -74% 42.2 28.8 13.3 - 42.8 (5.1) NM -31.1% 0.7x NM Anaren, Inc. United States 19.41 -7% 256.4 229.2 35.1 8.0 150.0 23.9 16.0% -9.5% 1.5x 9.6xAruba Networks, Inc. * United States 25.43 -5% 2,897.6 2,495.3 402.3 - 571.0 40.6 7.1% 22.8% 4.4x 61.5xAudioCodes Ltd. Israel 3.80 -20% 144.1 133.8 33.5 23.3 127.5 (0.9) NM -18.2% 1.0x NM Aviat Networks, Inc. United States 3.36 -14% 205.9 121.9 94.8 10.8 471.6 13.2 2.8% 4.2% 0.3x 9.2xAxesstel Inc. United States 1.27 -35% 30.7 39.2 1.9 10.4 59.7 4.9 8.2% 10.2% 0.7x 8.0xBlackline GPS Corp. Canada 1.28 -13% 22.5 16.1 6.5 0.1 2.6 (3.0) NM 37.1% 6.1x NM Blonder Tongue Laboratories United States 1.30 -23% 8.1 15.9 0.2 8.0 29.4 (0.4) NM 6.0% 0.5x NM BroadSoft, Inc. United States 26.96 -41% 755.0 678.8 163.6 87.4 164.8 31.0 18.8% 19.4% 4.1x 21.9xBrocade Communications United States 5.79 -10% 2,611.6 2,827.6 683.6 899.6 2,265.9 493.0 21.8% 4.8% 1.2x 5.7xCalAmp Corp. United States 10.68 -7% 304.0 295.8 13.6 5.3 169.8 16.7 9.8% 30.6% 1.7x 17.8xCalix Inc United States 8 30 12% 406 0 359 0 47 0 330 2 (1 3) NM 4 2% 1 1 NM Calix Inc. United States 8.30 -12% 406.0 359.0 47.0 - 330.2 (1.3) NM -4.2% 1.1x NM Ciena Corporation United States 16.02 -13% 1,626.5 2,414.2 637.2 1,425.0 1,870.3 88.9 4.8% 8.4% 1.3x 27.1xCisco Systems, Inc. United States 20.83 -5% 111,065.0 80,990.0 46,376.0 16,291.0 47,252.0 13,356.0 28.3% 5.4% 1.7x 6.1xClearfield, Inc. United States 5.94 -6% 76.3 60.1 16.1 - 38.6 4.6 11.9% 3.9% 1.6x 13.1xClearOne, Inc. United States 8.16 -1% 74.4 18.9 55.5 - 46.4 5.6 12.0% 0.8% 0.4x 3.4xCOM DEV International Ltd. Canada 3.88 -3% 296.1 296.9 26.4 20.3 213.7 30.9 14.4% 6.3% 1.4x 9.6xCommunications Systems Inc. United States 9.83 -30% 83.3 54.4 30.6 1.6 104.2 5.5 5.3% -27.5% 0.5x 9.8xCorning Inc. United States 13.15 -10% 19,368.0 16,770.0 6,144.0 3,499.0 8,012.0 2,487.0 31.0% 1.5% 2.1x 6.7xCTX Virtual Technologies, Inc. United States 1.43 -24% 11.4 11.3 0.1 - 40.0 (0.5) NM 16.6% 0.3x NM DDS Wireless International Inc. Canada 2.21 -6% 30.6 23.5 7.2 - 40.8 3.9 9.5% -11.0% 0.6x 6.1xDialogic, Inc. United States 1.99 -73% 31.6 103.3 6.5 78.3 160.0 (11.6) NM -19.2% 0.6x NM Digi International Inc. United States 9.22 -20% 241.2 139.6 101.5 - 190.9 20.5 10.7% -5.7% 0.7x 6.8xDragonWave Inc. Canada 1.60 -61% 61.0 44.1 36.4 19.1 104.7 (47.8) NM 102.9% 0.4x NM EchoStar Corp. United States 38.72 -3% 3,418.9 4,369.1 1,547.6 2,488.5 3,121.7 590.0 18.9% 13.0% 1.4x 7.4xEmulex Corporation United States 6.60 -38% 597.9 386.8 211.2 - 496.1 82.7 16.7% 2.8% 0.8x 4.7xEricsson Sweden 12.49 -6% 40,131.9 33,042.5 12,007.6 4,664.5 34,982.1 4,013.8 11.5% 0.4% 0.9x 8.2xExtreme Networks Inc. United States 3.40 -23% 318.7 193.7 125.0 - 312.7 17.8 5.7% -4.4% 0.6x 10.9xF5 Networks, Inc. United States 88.72 -36% 6,972.6 6,454.9 517.7 - 1,420.3 474.8 33.4% 17.8% 4.5x 13.6xFinisar Corp. United States 13.30 -35% 1,242.6 1,025.4 265.5 40.0 930.8 68.4 7.3% -2.0% 1.1x 15.0xFleetmatics Group Limited Ireland 24.21 -12% 837.3 761.3 100.1 24.1 127.5 24.9 19.6% 38.1% 6.0x 30.5xFranklin Wireless Corp. United States 1.50 -40% 15.6 4.3 11.9 0.1 36.6 1.0 2.7% 78.6% 0.1x 4.2xHarmonic Inc. United States 5.77 -3% 664.7 463.5 201.2 - 530.5 35.2 6.6% -3.4% 0.9x 13.2xHarris Corporation United States 45.29 -13% 5,111.0 6,716.0 328.2 1,929.9 5,353.4 1,120.6 20.9% 2.5% 1.3x 6.0xHuawei Technology Co., Ltd. China 1.47 -29% 206.5 128.2 78.4 - 72.0 8.9 12.3% -6.7% 1.8x 14.5xInfoblox Inc. United States 21.35 -12% 1,043.4 863.5 179.8 - 192.4 (3.4) NM 26.7% 4.5x NM Interactive Intelligence Group * United States 43.75 -4% 867.9 799.0 68.9 - 237.4 11.1 4.7% 13.3% 3.4x 72.0xJDS Uniphase Corporation United States 13.55 -13% 3,186.2 2,717.5 709.3 240.6 1,707.3 170.2 10.0% -2.5% 1.6x 16.0xJuniper Networks, Inc. United States 18.67 -19% 9,511.0 7,661.4 2,849.3 999.2 4,365.4 596.8 13.7% -1.9% 1.8x 12.8xKVH Industries Inc. United States 13.48 -10% 200.4 172.6 38.3 10.6 137.1 11.1 8.1% 21.8% 1.3x 15.6xMeru Networks Inc United States 6 32 6% 139 4 126 3 22 9 9 7 97 5 (25 4) NM 7 8% 1 3x NM
34M&A & INVESTMENT SUMMARY MARCH 2013
Meru Networks, Inc. United States 6.32 -6% 139.4 126.3 22.9 9.7 97.5 (25.4) NM 7.8% 1.3x NM Mitel Networks Corporation Canada 3.73 -27% 200.2 414.3 100.6 314.7 583.6 81.2 13.9% -3.8% 0.7x 5.1xMotorola Solutions, Inc. United States 63.56 0% 17,308.1 15,593.1 3,603.0 1,863.0 8,698.0 1,498.0 17.2% 6.0% 1.8x 10.4xNetgear Inc. United States 33.58 -18% 1,290.8 914.0 376.9 - 1,271.9 144.5 11.4% 7.7% 0.7x 6.3xNokia Corporation Finland 3.24 -39% 12,037.7 8,002.7 13,370.7 7,379.5 39,786.4 891.3 2.2% -21.9% 0.2x 9.0x

COMMUNICATIONS PUBLIC COMPANY VALUATION
($ in millions, except stock
Stock Price Chg % From Equity Ent. Cash & ST. Total LTM LTM Margin LTM LTM Multiples Company Name Headquarters 03/28/13 52WK High Value Value Investments Debt Revenue EBITDA EBITDA Rev Growth EV/Rev EV/EBITDANuance Communications, Inc. United States 20.11 -25% 6,360.3 7,738.8 961.1 2,335.0 1,753.1 379.4 21.6% 27.4% 4.4x 20.4xNumerex Corp. United States 12.66 -9% 226.9 230.3 4.9 8.3 66.7 6.5 9.8% 14.4% 3.4x 35.2xOptical Cable Corp. United States 4.20 -19% 26.1 34.9 0.5 9.9 83.5 6.5 7.7% 14.4% 0.4x 5.4xPalo Alto Networks, Inc. * United States 56.52 -22% 3,907.3 3,569.9 337.4 - 323.8 (1.4) NM 74.8% 11.0x NM PCTEL, Inc. United States 6.96 -11% 122.3 74.5 47.8 0.0 83.0 4.9 5.9% 10.1% 0.9x 15.3xPHAZAR CORP United States 1.13 -60% 2.6 2.0 0.6 - 5.8 (1.5) NM -20.3% 0.3x NM Plantronics, Inc. United States 43.54 -5% 1,854.7 1,545.8 328.9 20.0 735.6 147.6 20.1% 3.8% 2.1x 10.5xPolycom, Inc. United States 11.11 -42% 1,966.6 1,292.3 674.3 - 1,392.6 124.4 8.9% -0.7% 0.9x 10.4xProcera Networks, Inc. United States 11.88 -54% 231.0 99.3 131.7 - 59.6 7.4 12.4% 34.3% 1.7x 13.4xQUALCOMM Incorporated United States 66.68 -3% 114,564.9 101,340.9 13,275.0 31.0 20,458.0 7,226.0 35.3% 25.6% 5.0x 14.0xResearch In Motion Limited Canada 14.56 -20% 7,495.2 4,826.5 2,731.0 - 11,073.0 1,018.0 9.2% -39.9% 0.4x 4.7xRadiSys Corporation United States 4.66 -38% 132.8 134.5 33.2 34.9 286.1 12.0 4.2% -13.5% 0.5x 11.2xRadware Ltd. Israel 37.12 -9% 824.4 736.2 88.2 - 189.2 41.2 21.8% 13.3% 3.9x 17.9xRELM Wireless Corp. United States 2.27 -1% 30.7 24.2 6.6 0.0 27.6 3.3 12.0% 14.4% 0.9x 7.3xRiverbed Technology, Inc. United States 14.91 -49% 2,435.8 2,556.8 451.1 572.1 836.9 134.5 16.1% 15.2% 3.1x 19.0xSandvine Corporation Canada 2.00 -7% 276.6 214.3 70.0 6.2 87.9 (0.6) NM -2.7% 2.4x NM ShoreTel, Inc. United States 3.57 -39% 209.7 179.6 52.1 22.0 284.4 (12.4) NM 29.3% 0.6x NM Si Wi l I C d 10 69 11% 329 2 267 5 63 6 0 7 397 3 11 8 Sierra Wireless Inc. Canada 10.69 -11% 329.2 267.5 63.6 0.7 397.3 11.8 3.0% 19.3% 0.7x 22.6xSolarWinds, Inc. * United States 57.69 -6% 4,324.8 4,095.9 229.0 - 269.0 132.5 49.2% 35.6% 15.2x 30.9xSolera Holdings Inc. United States 57.87 -1% 3,986.5 4,789.1 448.2 1,152.6 801.3 338.8 42.3% 6.6% 6.0x 14.1xSonus Networks, Inc. United States 2.56 -15% 720.0 472.7 249.9 2.6 254.1 (20.5) NM -2.1% 1.9x NM Symmetricom Inc. United States 4.46 -37% 179.9 109.1 70.8 - 228.6 13.4 5.9% 0.9% 0.5x 8.2xTelcoware Co Ltd South Korea 8.11 -21% 57.2 12.3 46.9 - 51.6 6.9 13.4% 13.5% 0.2x 1.8xTeleCommunication Systems United States 2.19 -24% 128.8 244.9 51.5 167.6 487.4 38.6 7.9% 14.6% 0.5x 6.3xTellabs Inc. United States 2.08 -49% 743.5 139.1 799.5 195.1 1,052.6 12.3 1.2% -18.1% 0.1x 11.3xTESSCO Technologies Inc. United States 21.83 -18% 176.0 176.1 2.6 2.8 788.9 33.5 4.2% 17.9% 0.2x 5.3xTransmode Holding AB Sweden 12.54 -6% 348.5 290.7 57.9 - 155.3 30.7 19 7% 10 3% 1 9x 9 5xTransmode Holding AB Sweden 12.54 6% 348.5 290.7 57.9 155.3 30.7 19.7% 10.3% 1.9x 9.5xUbiquitous Corporation * Japan 1,598.94 -20% 136.5 123.2 14.5 - 10.4 1.2 11.7% -11.6% 11.8x 100.8xVecima Networks Inc. Canada 4.67 -21% 104.3 67.5 41.5 4.0 103.4 12.2 11.8% 29.8% 0.7x 5.5xVerint Systems Inc. United States 34.83 -3% 1,829.7 2,473.2 192.0 592.6 839.5 156.7 18.7% 7.3% 2.9x 15.8xViaSat Inc. United States 48.44 -5% 2,175.2 2,653.4 112.7 586.4 1,051.6 126.3 12.0% 25.3% 2.5x 21.0xVonage Holdings Corporation United States 2.86 -1% 612.3 573.3 97.1 58.1 849.1 123.2 14.5% -2.4% 0.7x 4.7xWestell Technologies, Inc. United States 2.04 -17% 120.2 5.1 115.0 - 40.7 (8.2) NM -57.9% 0.1x NM ZTE Corp. * China 1.86 -35% 6,344.3 9,864.1 2,413.8 5,634.8 14,179.0 119.0 0.8% 9.1% 0.7x 82.9x
2.7x 10.4xAdjusted Weighted Average
*Calculation is market cap weighted and excludes revenue multiples that are 2.0 standard deviations above the mean (7.3x)and EBITDA multiples that are 1.0 standard deviations above the mean (45.3x)
35M&A & INVESTMENT SUMMARY MARCH 2013

INFORMATION & BUSINESS SERVICESTransactions by Subsegment and Buyer Type
• A total of 12 acquisitions and 10 investments were announced in the Information & Business Services segment. Of these, seven reported $790 million in value
• Select acquisitions› Temp Holdings’ $742 million acquisition of Japan-based temporary staffing agency Intelligence Holdings› FTI Consulting’s acquisition of C2 Group a company providing government affairs consulting services › FTI Consulting s acquisition of C2 Group, a company providing government affairs consulting services
focusing on tax and corporate governance, financial services, and multiple transportation modes› MSW Research’s acquisition of comScore ARS (nka MSW.ARS Research), which operates as a marketing and
advertising research company, from comScore› Wired Real Estate Group ‘s acquisition of Applied Computer Research, a database publishing company that
provides IT market intelligence and directories of IT executives• Select investments
› SSM Partners’ $15 million investment in OpinionLab, which helps companies collect and understand customer feedback data
› Halyard Capital’s $15 million investment in OneSource Virtual HR, a company offering business process cloud-sourcing servicesg
# % $MM % # $MM # $MM # $MM
BPO 5 23% 15.0 2% 0 - 2 - 3 15.0
INFORMATION & BUSINESS SERVICES TRANSACTIONS BY SEGMENT BUYER/INVESTOR BREAKDOWN
Transactions Reported Value Strategic Buyout Venture/Growth Capital
Legal Information 3 14% - 0% 3 - 0 - 0 -
HR Information 2 9% 9.7 1% 0 - 0 - 2 9.7
Management Consulting 2 9% 8.0 1% 1 - 0 - 1 8.0
Market Research 2 9% 15.0 2% 1 - 0 - 1 15.0
Staffing 2 9% 742.0 94% 2 742.0 0 - 0 -
Total 22 100% 790.2 100% 9 742.0 3 0.0 10 48.2
36M&A & INVESTMENT SUMMARY MARCH 2013
*Other includes Corporate Training, Financial Information, HR Consulting, IT Consulting/Systems Integration, IT Information, and Marketing Data

INFORMATION PUBLIC COMPANY VALUATIONS
($ in millions, except stock price data)
Stock Price Chg % From Equity Ent. Cash & ST. Total LTM LTM Margin LTM LTM Multiples Company Name Headquarters 03/28/13 52WK High Value Value Investments Debt Revenue EBITDA EBITDA Rev Growth EV/Rev EV/EBITDABroadridge Financial Solutions, Inc. United States 24.65 -1% 3,003.7 3,269.0 259.1 524.4 2,336.3 351.9 15.1% 3.4% 1.4x 9.3xComputershare Limited Australia 10.54 -8% 5,864.2 7,218.8 446.2 1,781.7 2,016.2 355.4 17.6% 24.6% 3.6x 20.3xCoreLogic, Inc. United States 25.56 -13% 2,501.2 3,130.7 171.0 798.9 1,567.6 325.3 20.7% 17.1% 2.0x 9.6xCoStar Group Inc. * United States 108.67 -1% 3,079.6 3,094.2 156.1 170.6 349.9 65.3 18.7% 39.0% 8.8x 47.4xDST Systems Inc. United States 70.63 -1% 3,126.7 3,653.4 431.1 1,101.5 2,576.6 372.6 14.5% 7.9% 1.4x 9.8xDun & Bradstreet Corp. United States 82.02 -5% 3,295.1 4,440.0 149.1 1,290.9 1,663.0 539.8 32.5% -5.4% 2.7x 8.2xEnvestnet, Inc. * United States 17.54 -2% 567.2 537.2 30.0 - 157.3 15.3 9.7% 27.7% 3.4x 35.2xEquifax Inc United States 56 63 -5% 6 821 2 8 431 1 146 8 1 730 7 2 160 5 652 4 30 2% 10 2% 3 9x 12 9x
Financial & Credit/Risk Management Information
Equifax Inc. United States 56.63 -5% 6,821.2 8,431.1 146.8 1,730.7 2,160.5 652.4 30.2% 10.2% 3.9x 12.9xExperian plc Ireland 17.08 -6% 16,860.7 18,972.1 627.0 2,740.0 4,621.0 1,533.0 33.2% 14.4% 4.1x 12.4xFactSet Research Systems Inc. United States 92.93 -15% 4,051.7 3,885.6 225.2 - 834.1 301.5 36.1% 8.1% 4.7x 12.9xFair Isaac Corporation United States 45.89 -4% 1,628.8 2,042.0 90.8 504.0 696.1 191.7 27.5% 9.8% 2.9x 10.7xFidelity National Information Services, Inc. United States 39.02 0% 11,491.0 15,521.0 517.6 4,394.9 5,807.6 1,629.5 28.1% 3.2% 2.7x 9.5xFinancial Engines, Inc. * United States 36.16 -1% 1,738.2 1,557.2 181.2 - 185.8 32.5 17.5% 29.0% 8.4x 47.9xLender Processing Services, Inc. United States 24.82 -20% 2,107.5 2,946.6 236.2 1,075.3 1,997.7 330.9 16.6% 0.7% 1.5x 8.9xMoody's Corp. United States 52.50 -6% 11,693.5 11,675.1 1,773.3 1,671.2 2,730.3 1,183.1 43.3% 19.7% 4.3x 9.9xMorningstar Inc. United States 69.01 -3% 3,203.7 2,885.2 321.4 - 658.3 195.4 29.7% 4.3% 4.4x 14.8xMSCI Inc. United States 34.04 -10% 4,107.1 4,707.6 434.3 865.5 950.1 428.9 45.1% 5.5% 5.0x 11.0xReis, Inc. United States 15.29 -7% 166.5 161.5 15.0 - 31.2 6.2 20.0% 14.9% 5.2x 25.9x,SEI Investments Co. United States 28.62 -2% 4,941.0 4,507.9 452.2 - 992.5 234.8 23.7% 6.8% 4.5x 19.2xThe Dolan Company United States 2.49 -74% 75.5 238.5 15.6 192.0 254.3 31.7 12.4% -5.3% 0.9x 7.5xThe McGraw-Hill Companies, Inc. United States 50.46 -14% 14,217.8 15,595.8 761.0 1,256.0 4,450.0 1,526.0 34.3% 12.5% 3.5x 10.2xThomson Reuters Corporation United States 32.34 -2% 26,759.3 32,971.6 1,373.0 7,268.0 13,278.0 2,920.0 22.0% -3.8% 2.5x 11.3xVerisk Analytics, Inc. United States 61.55 0% 10,349.1 11,715.8 94.7 1,461.4 1,534.3 686.7 44.8% 15.2% 7.6x 17.1x
Adjusted Weighted Average 3.7x 12.1x
*Calculation is market cap weighted and excludes revenue multiples that are 2.0 standard deviations above the mean (8.1x)and EBITDA multiples that are 1.0 standard deviations above the mean (28.3x)
Healthcare InformationStock Price Chg % From Equity Ent. Cash & ST. Total LTM LTM Margin LTM LTM Multiples
Company Name Headquarters 03/28/13 52WK High Value Value Investments Debt Revenue EBITDA EBITDA Rev Growth EV/Rev EV/EBITDANational Research Corp. United States 57.79 -6% 399.4 403.9 8.3 12.8 86.4 27.4 31.7% 14.1% 4.7x 14.7xThe Advisory Board Company United States 52.35 -5% 1,838.0 1,739.4 98.5 - 431.6 65.8 15.2% 26.8% 4.0x 26.4x
Adjusted Weighted Average 4.1x 24.3x
*Calculation is market cap weighted and excludes revenue multiples that are 2.0 standard deviations above the mean (8.6x)and EBITDA multiples that are 1.0 standard deviations above the mean (32.3x)
37M&A & INVESTMENT SUMMARY MARCH 2013

INFORMATION PUBLIC COMPANY VALUATIONS
($ in millions, except stock price data)
Marketing InformationStock Price Chg % From Equity Ent. Cash & ST. Total LTM LTM Margin LTM LTM Multiples
Company Name Headquarters 03/28/13 52WK High Value Value Investments Debt Revenue EBITDA EBITDA Rev Growth EV/Rev EV/EBITDAAcxiom Corporation United States 20.40 0% 1,506.1 1,581.2 186.2 261.6 1,109.5 223.4 20.1% -1.9% 1.4x 7.1xAlliance Data Systems Corporation United States 161.89 1% 8,074.1 16,403.5 893.4 9,222.7 3,641.4 1,111.2 30.5% 14.8% 4.5x 14.8xArbitron Inc. United States 46.87 -1% 1,301.6 1,235.1 66.5 - 449.9 124.8 27.7% 6.5% 2.7x 9.9xBrainjuicer Group Plc United Kingdom 3.87 -31% 48.6 44.9 3.8 - 34.5 4.8 14.0% 20.6% 1.3x 9.3xCello Group Plc United Kingdom 0.77 -6% 63.1 76.4 1.9 23.4 219.7 13.1 6.0% 1.2% 0.3x 5.8xCision AB Sweden 8.69 -4% 128.9 182.6 8.6 62.4 149.8 22.6 15.1% 1.8% 1.2x 8.1xcomScore, Inc. * United States 16.78 -25% 599.5 552.2 61.8 14.5 255.2 19.0 7.4% 9.8% 2.2x 29.1xCross Marketing Inc Japan 11 95 -30% 70 8 62 2 11 1 1 5 63 0 8 6 13 6% 23 1% 1 0x 7 3xCross Marketing Inc. Japan 11.95 -30% 70.8 62.2 11.1 1.5 63.0 8.6 13.6% 23.1% 1.0x 7.3xEbiquity plc United Kingdom 1.45 -5% 81.0 104.1 7.0 30.7 95.7 15.1 15.8% 24.6% 1.1x 6.9xGfK SE Germany 50.46 -13% 1,841.9 2,398.6 87.9 608.6 1,997.1 261.4 13.1% 10.2% 1.2x 9.2xHarris Interactive Inc. United States 1.68 -2% 97.1 89.7 11.1 3.7 140.7 11.0 7.8% -11.0% 0.6x 8.2xHarte-Hanks Inc. United States 7.79 -21% 486.1 546.7 35.8 113.3 767.7 88.7 11.6% -5.4% 0.7x 6.2xInnerWorkings Inc. United States 15.14 -4% 760.4 808.1 17.2 65.0 797.7 37.4 4.7% 25.9% 1.0x 21.6xINTAGE Inc. Japan 25.25 -11% 254.0 246.1 59.9 50.3 449.5 56.6 12.6% 6.1% 0.5x 4.3xIpsos SA France 35.01 -18% 1,585.8 2,400.2 174.4 1,006.9 2,359.4 266.7 11.3% 31.3% 1.0x 9.0xKeynote Systems, Inc. United States 13.96 -31% 255.0 203.8 51.2 - 125.2 16.4 13.1% 12.5% 1.6x 12.4xMacromill, Inc. Japan 12.55 -3% 349.8 314.0 103.2 60.6 182.5 45.2 24.8% 24.0% 1.7x 6.9xNeuStar, Inc. United States 46.53 -2% 3,077.4 3,320.8 343.9 587.3 831.4 370.1 44.5% 34.0% 4.0x 9.0xNielsen Holdings N.V. Netherlands 35.82 2% 13,385.5 19,751.5 288.0 6,606.0 5,612.0 1,556.0 27.7% 1.4% 3.5x 12.7xPearson plc United Kingdom 17.96 -9% 14,502.3 16,365.3 1,735.9 3,692.8 8,222.7 1,497.0 18.2% 5.0% 2.0x 10.9xOnvia Inc. * United States 3.83 -9% 32.8 20.6 12.3 - 22.0 0.7 3.1% -5.2% 0.9x 30.3xSolera Holdings Inc. United States 58.33 -1% 4,018.2 4,820.8 448.2 1,152.6 801.3 338.8 42.3% 6.6% 6.0x 14.2xYouGov PLC United Kingdom 1.08 -13% 103.3 93.7 11.7 0.5 92.5 8.1 8.7% -1.1% 1.0x 11.6x
Adjusted Weighted Average 2.8x 11.7x
*Calculation is market cap weighted and excludes revenue multiples that are 2.0 standard deviations above the mean (6.1x)and EBITDA multiples that are 1.0 standard deviations above the mean (23.3x)
Other InformationStock Price Chg % From Equity Ent. Cash & ST. Total LTM LTM Margin LTM LTM Multiples
Company Name Headquarters 03/28/13 52WK High Value Value Investments Debt Revenue EBITDA EBITDA Rev Growth EV/Rev EV/EBITDACorporate Executive Board Co. United States 58.16 -2% 1,941.1 2,409.2 72.7 540.8 622.7 147.1 23.6% 28.5% 3.9x 16.4xForrester Research Inc. United States 31.65 -12% 706.9 473.2 228.7 - 292.9 43.4 14.8% 3.3% 1.6x 10.9xGartner Inc. United States 54.41 1% 5,080.1 4,995.2 299.9 215.0 1,615.8 270.5 16.7% 10.0% 3.1x 18.5xIHS Inc. United States 104.72 -12% 6,883.6 7,620.4 345.0 1,064.6 1,569.7 352.4 22.4% 14.1% 4.9x 21.6xInforma plc Switzerland 7.99 -1% 4,817.3 6,034.6 38.8 1,343.0 2,003.3 581.4 29.0% -3.4% 3.0x 10.4xNIC Inc. United States 19.16 2% 1,256.7 1,194.3 62.4 - 211.1 49.6 23.5% 16.7% 5.7x 24.1xProofpoint, Inc. United States 16.86 -5% 557.1 474.6 86.8 4.0 106.3 (12.1) NM 29.9% 4.5x NM Reed Elsevier plc United Kingdom 10.84 -1% 24,037.1 29,117.8 2,673.1 2,407.7 9,635.3 2,209.0 22.9% 2.3% 3.0x 13.2xSPS Commerce, Inc. * United States 42.67 2% 636.6 570.5 66.1 - 77.1 6.7 8.7% 33.0% 7.4x 85.1xWolters Kluwer NV Netherlands 21.85 -2% 6,452.2 9,147.9 432.5 3,177.5 4,750.5 1,193.2 25.1% 7.4% 1.9x 7.7x
Adjusted Weighted Average 3.3x 14.2x
*Calculation is market cap weighted and excludes revenue multiples that are 2.0 standard deviations above the mean (8.2x)and EBITDA multiples that are 1.0 standard deviations above the mean (34.8x)
38M&A & INVESTMENT SUMMARY MARCH 2013

BUSINESS SERVICESPUBLIC COMPANY VALUATIONS
($ in millions, except stock price data)
ConsultingStock Price Chg % From Equity Ent. Cash & ST. Total LTM LTM Margin LTM LTM Multiples
Company Name Headquarters 03/28/13 52WK High Value Value Investments Debt Revenue EBITDA EBITDA Rev Growth EV/Rev EV/EBITDACRA International Inc. United States 22.37 -12% 228.1 175.3 55.5 - 270.4 24.7 9.1% -11.4% 0.6x 7.1xFTI Consulting, Inc. United States 37.66 -1% 1,485.4 2,051.7 156.8 723.0 1,576.9 248.7 15.8% 0.6% 1.3x 8.2xInformation Services Group, Inc. United States 2.02 -1% 73.9 113.5 15.0 64.8 192.7 15.4 8.0% 4.5% 0.6x 7.4xNavigant Consulting Inc. United States 13.14 -10% 667.8 801.4 1.1 134.7 743.4 111.2 15.0% 6.9% 1.1x 7.2xICF International Inc. United States 27.20 -2% 532.3 622.6 14.7 105.0 937.1 89.8 9.6% 11.5% 0.7x 6.9xHuron Consulting Group Inc. United States 40.32 -1% 846.9 1,015.2 25.2 193.4 626.0 118.7 19.0% 3.2% 1.6x 8.6xThe Hackett Group, Inc. United States 4.57 -31% 145.3 153.4 16.9 25.0 209.3 19.2 9.2% 4.4% 0.7x 8.0xTowers Watson & Co United States 69 32 1% 5 132 4 5 224 8 455 7 525 0 3 508 2 663 1 18 9% 3 0% 1 5x 7 9xTowers Watson & Co. United States 69.32 1% 5,132.4 5,224.8 455.7 525.0 3,508.2 663.1 18.9% 3.0% 1.5x 7.9x
Adjusted Weighted Average 1.4x 7.8x
HR ServicesStock Price Chg % From Equity Ent. Cash & ST. Total LTM LTM Margin LTM LTM Multiples
Company Name Headquarters 03/28/13 52WK High Value Value Investments Debt Revenue EBITDA EBITDA Rev Growth EV/Rev EV/EBITDAAutomatic Data Processing, Inc. United States 65.03 0% 31,540.7 30,148.6 1,421.4 29.3 10,507.0 1,908.2 18.2% 7.2% 2.9x 15.8xBarrett Business Services Inc United States 52 66 2% 369 8 317 8 62 5 10 0 402 7 20 3 5 0% 27 9% 0 8 15 7
*Calculation is market cap weighted and excludes revenue multiples that are 2.0 standard deviations above the mean (5.3x)and EBITDA multiples that are 1.0 standard deviations above the mean (19.5x)
Barrett Business Services Inc. United States 52.66 2% 369.8 317.8 62.5 10.0 402.7 20.3 5.0% 27.9% 0.8x 15.7xCapita PLC United Kingdom 13.64 -2% 8,895.2 10,918.0 533.0 2,700.0 5,447.9 885.2 16.2% 14.4% 2.0x 12.3xDice Holdings, Inc. United States 10.13 -8% 593.5 597.3 42.2 46.0 195.4 71.3 36.5% 9.1% 3.1x 8.4xEdenred SA France 32.74 -5% 7,387.8 7,358.3 1,931.6 1,830.0 1,406.8 528.7 37.6% 3.4% 5.2x 13.9xInsperity, Inc. United States 28.37 -17% 728.5 447.1 281.4 - 2,158.8 87.1 4.0% 9.2% 0.2x 5.1xLinkedIn Corporation * United States 176.06 -4% 19,200.0 18,450.4 749.5 - 972.3 125.5 12.9% 86.2% 19.0x 147.0xMarsh & McLennan Companies, Inc. United States 37.97 0% 20,821.7 21,496.7 2,307.0 2,918.0 11,924.0 2,178.0 18.3% 3.5% 1.8x 9.9xMonster Worldwide, Inc. United States 5.07 -49% 563.4 579.5 148.2 164.2 890.4 142.5 16.0% -10.4% 0.7x 4.1xPaychex, Inc. United States 35.06 0% 12,758.3 12,187.7 301.2 - 2,292.4 987.1 43.1% 4.2% 5.3x 12.3xTowers Watson & Co. United States 69.32 1% 5,132.4 5,224.8 455.7 525.0 3,508.2 663.1 18.9% 3.0% 1.5x 7.9xWageWorks, Inc. United States 25.03 -5% 802.7 542.1 305.1 44.4 177.3 28.7 16.2% 30.7% 3.1x 18.9xg ,
Adjusted Weighted Average 3.0x 12.8x
*Calculation is market cap weighted and excludes revenue multiples that are 2.0 standard deviations above the mean (8.1x)and EBITDA multiples that are 1.0 standard deviations above the mean (34.4x)
39M&A & INVESTMENT SUMMARY MARCH 2013

BUSINESS SERVICES PUBLIC COMPANY VALUATIONS
($ in millions, except stock price data)
Staffing & Recruiting ServicesStock Price Chg % From Equity Ent. Cash & ST. Total LTM LTM Margin LTM LTM Multiples
Company Name Headquarters 03/28/13 52WK High Value Value Investments Debt Revenue EBITDA EBITDA Rev Growth EV/Rev EV/EBITDAAdecco S.A. Switzerland 54.84 -8% 10,355.2 11,596.3 1,166.1 2,580.1 27,076.3 1,207.7 4.5% 0.0% 0.4x 9.6xAMN Healthcare Services Inc. United States 15.83 -1% 725.8 879.0 5.7 158.9 954.0 67.5 7.1% 7.5% 0.9x 13.0xBrunel International NV Netherlands 42.21 -19% 1,020.1 894.1 83.7 - 1,622.5 96.5 5.9% 25.6% 0.6x 9.3xCDI Corp. United States 17.20 -8% 333.0 292.6 - - 1,105.0 42.4 3.8% 4.3% 0.3x 6.9xCross Country Healthcare, Inc. * United States 5.31 -15% 167.4 190.8 7.5 34.5 442.6 3.2 0.7% 0.7% 0.4x 60.3xCTPartners Executive Search Inc. United States 3.77 -46% 26.4 17.1 14.9 5.6 128.4 3.5 2.7% 6.0% 0.1x 4.9xGroupe CRIT SA France 18.92 -17% 210.1 251.7 95.8 120.3 1,938.3 67.6 3.5% 7.3% 0.1x 3.7xHarvey Nash Group plc United Kingdom 1 02 -9% 74 6 96 1 15 4 37 5 897 1 18 6 2 1% 19 9% 0 1x 5 2xHarvey Nash Group plc United Kingdom 1.02 -9% 74.6 96.1 15.4 37.5 897.1 18.6 2.1% 19.9% 0.1x 5.2xHays plc United Kingdom 1.46 -5% 2,033.9 2,254.5 97.2 333.5 5,726.3 222.0 3.9% -0.6% 0.4x 10.2xHealthcare Locums Plc * United Kingdom 0.01 -88% 6.6 56.0 15.1 66.2 331.6 1.9 0.6% 7.4% 0.2x 29.8xHeidrick & Struggles International Inc. United States 14.95 -33% 270.0 152.4 117.6 - 443.8 33.0 7.4% -15.9% 0.3x 4.6xHudson Global, Inc United States 3.94 -34% 126.0 87.7 38.7 0.3 777.6 7.6 1.0% -16.7% 0.1x 11.6xImpellam Group PLC United Kingdom 6.24 -13% 276.6 251.1 61.1 33.9 1,955.9 37.8 1.9% 7.0% 0.1x 6.6xKelly Services, Inc. United States 18.68 -1% 694.5 682.3 76.3 64.1 5,450.5 96.8 1.8% -1.8% 0.1x 7.0xKforce Inc. United States 16.37 -2% 565.0 585.7 1.4 22.1 1,082.5 25.6 2.4% 7.7% 0.5x 22.9xKorn/Ferry International United States 17.86 -8% 869.4 677.9 223.2 - 783.0 80.6 10.3% -0.8% 0.9x 8.4xManpowerGroup Inc. United States 56.72 -1% 4,359.7 4,481.7 648.1 770.1 20,678.0 571.0 2.8% -6.0% 0.2x 7.8xMichael Page International plc United Kingdom 6.40 -14% 1,951.3 1,858.2 115.0 15.3 1,608.9 130.3 8.1% -2.9% 1.2x 14.3xOn Assignment Inc. United States 25.31 -3% 1,343.6 1,743.1 13.9 439.6 1,239.7 128.1 10.3% 107.6% 1.4x 13.6xProffice AB (Publ) Sweden 3.81 -11% 260.2 286.3 14.4 40.2 748.9 13.2 1.8% 2.2% 0.4x 21.7xRandstad Holding NV Netherlands 40.96 -7% 7,066.8 8,469.7 255.0 1,697.1 22,528.6 677.4 3.0% 5.3% 0.4x 12.5xResources Connection Inc. United States 12.70 -12% 520.8 406.8 113.9 - 566.9 50.9 9.0% 0.1% 0.7x 8.0xRobert Half International Inc. United States 37.53 1% 5,237.3 4,951.3 287.6 1.5 4,111.2 410.8 10.0% 8.8% 1.2x 12.1xRobert Walters plc United Kingdom 3.38 -16% 259.3 241.9 42.3 23.6 922.8 18.7 2.0% 7.5% 0.3x 12.9xSThree Plc. United Kingdom 5.26 -6% 629.3 586.4 45.3 - 925.6 46.8 5.1% 6.5% 0.6x 12.5xSynergie SA France 10.20 -15% 244.4 281.6 29.7 64.9 1,858.8 60.7 3.3% 6.8% 0.2x 4.6xTrueBlue, Inc. United States 21.14 -1% 819.9 690.5 129.5 0.1 1,389.5 71.9 5.2% 5.6% 0.5x 9.6xUSG People NV Netherlands 8.57 -14% 683.2 1,004.7 52.4 412.1 3,792.2 121.1 3.2% -11.4% 0.3x 8.3x
Adjusted Weighted Average 0.7x 11.2x
*Calculation is market cap weighted and excludes revenue multiples that are 2.0 standard deviations above the mean (4.9x)and EBITDA multiples that are 1.0 standard deviations above the mean (23.8x)
40M&A & INVESTMENT SUMMARY MARCH 2013

BUSINESS SERVICES PUBLIC COMPANY VALUATIONS($ in millions, except stock price data)
IT Consulting/Systems IntegrationStock Price Chg % From Equity Ent. Cash & ST. Total LTM LTM Margin LTM LTM Multiples
Company Name Headquarters 03/28/13 52WK High Value Value Investments Debt Revenue EBITDA EBITDA Rev Growth EV/Rev EV/EBITDAA.L.D. Advanced Logistics Developments Ltd. * Israel 0.17 -32% 4.0 4.5 - - 14.3 0.1 0.9% -5.2% 0.3x 35.2xAccenture plc Ireland 75.97 -3% 48,950.1 43,801.1 5,681.2 0.0 28,174.8 4,327.4 15.4% 3.3% 1.6x 10.1xAmdocs Limited Channel Islands 36.25 -1% 5,864.4 4,903.1 961.3 - 3,266.3 604.4 18.5% 1.8% 1.5x 8.1xBechtle AG Germany 46.47 -8% 975.9 923.1 69.2 82.0 2,764.6 134.6 4.9% 5.1% 0.3x 6.9xBooz Allen Hamilton Holding Corporation United States 13.44 -30% 1,859.2 3,268.0 317.6 1,726.4 5,753.4 524.0 9.1% -1.0% 0.6x 6.2xBroadridge Financial Solutions, Inc. United States 24.84 0% 3,026.9 3,292.2 259.1 524.4 2,336.3 351.9 15.1% 3.4% 1.4x 9.4xBusiness & Decision SA France 4.32 -44% 34.1 73.0 7.3 44.9 304.0 16.5 5.4% -2.0% 0.2x 4.4xCap Gemini S A France 45 53 -9% 7 180 7 6 221 4 1 660 6 1 713 9 13 532 9 1 294 7 9 6% 5 9% 0 5x 4 8xCap Gemini S.A. France 45.53 -9% 7,180.7 6,221.4 1,660.6 1,713.9 13,532.9 1,294.7 9.6% 5.9% 0.5x 4.8xCGI Group, Inc. Canada 27.16 -3% 8,361.8 11,292.9 162.1 3,151.5 6,293.7 878.0 14.0% 50.7% 1.8x 12.9xCognizant Technology Solutions Corporation United States 76.62 -5% 23,122.8 20,259.1 2,863.8 - 7,346.5 1,518.1 20.7% 20.0% 2.8x 13.3xComputer Sciences Corporation United States 49.23 -3% 7,556.0 8,002.0 2,203.0 2,629.0 15,784.0 1,830.0 11.6% 0.3% 0.5x 4.4xCSG Systems International Inc. United States 21.19 -9% 673.4 779.8 169.3 274.7 756.9 152.0 20.1% 3.0% 1.0x 5.1xDynamics Research Corporation United States 5.96 -39% 61.7 150.8 0.0 89.1 317.0 31.0 9.8% -1.7% 0.5x 4.9xInformation Services Group, Inc. United States 2.02 -1% 73.9 113.5 15.0 64.8 192.7 15.4 8.0% 4.5% 0.6x 7.4xInfosys Ltd. India 53.24 -4% 30,419.0 26,295.7 4,079.0 - 7,231.0 2,187.0 30.2% 5.9% 3.6x 12.0xiSoftStone Holdings Limited China 4.89 -46% 278.3 218.7 72.5 38.0 381.1 42.1 11.0% 34.5% 0.6x 5.2xITS Group France 5.58 -23% 32.4 47.4 5.8 19.5 119.0 10.4 8.8% 6.1% 0.4x 4.6xNCI, Inc. United States 4.84 -40% 62.6 79.3 0.8 17.5 368.4 17.6 4.8% -34.0% 0.2x 4.5xOsiatis SA France 8.43 -2% 128.9 133.8 36.2 40.7 366.1 31.0 8.5% 10.8% 0.4x 4.3xWipro Ltd. India 8.05 -4% 19,714.2 17,827.6 3,036.2 1,148.7 7,608.2 1,484.2 19.5% 17.5% 2.3x 12.0x
Adjusted Weighted Average 1.7x 10.6x
Business Process OutsourcingStock Price Chg % From Equity Ent. Cash & ST. Total LTM LTM Margin LTM LTM Multiples
Company Name Headquarters 03/28/13 52WK High Value Value Investments Debt Revenue EBITDA EBITDA Rev Growth EV/Rev EV/EBITDA
*Calculation is market cap weighted and excludes revenue multiples that are 2.0 standard deviations above the mean (5.3x)and EBITDA multiples that are 1.0 standard deviations above the mean (20.5x)
p y q / / g / /Communisis plc United Kingdom 0.77 -9% 147.1 177.6 15.8 59.0 373.5 31.1 8.3% 10.3% 0.5x 5.7xContax Participacoes S.A. Brazil 13.12 -9% 846.2 1,222.2 186.5 544.8 1,766.7 203.7 11.5% 22.4% 0.7x 6.0xEniro AB Sweden 1.79 -28% 179.4 608.8 30.4 455.5 614.2 148.7 24.2% -7.5% 1.0x 4.1xExlservice Holdings, Inc. United States 32.88 0% 1,066.8 962.0 109.2 4.4 442.9 83.3 18.8% 22.9% 2.2x 11.5xFirstsource Solutions Limited India 0.19 -32% 123.8 143.4 141.2 160.4 502.3 47.2 9.4% 27.1% 0.3x 3.0xGenpact Ltd. Bermuda 18.19 -7% 4,122.1 4,390.9 477.5 745.7 1,902.0 337.6 17.7% 18.8% 2.3x 13.0xMAXIMUS, Inc. United States 79.97 -1% 2,725.9 2,560.4 167.1 1.7 1,096.8 163.2 14.9% 14.8% 2.3x 15.7xSalmat Ltd. Australia 2.15 -26% 339.1 224.3 38.3 289.5 832.3 99.8 12.0% 17.9% 0.3x 2.2xSerco Group plc United Kingdom 9.51 -4% 4,664.9 5,549.7 343.2 1,349.7 7,985.4 630.3 7.9% 5.7% 0.7x 8.8xTrans Cosmos, Inc. Japan 14.86 0% 611.6 437.9 361.3 134.0 1,915.6 99.1 5.2% 5.1% 0.2x 4.4xTranscom WorldWide SA Luxembourg 0.14 -4% 160.8 211.1 56.2 106.5 798.4 20.3 2.5% 9.3% 0.3x 10.4xXchanging PLC United Kingdom 2.02 -12% 484.9 402.2 189.2 64.4 1,086.2 118.8 10.9% 2.6% 0.4x 3.4x
Adjusted Weighted Average 1.5x 7.8x
*Calculation is market cap weighted and excludes revenue multiples that are 2.0 standard deviations above the mean (5.2x)and EBITDA multiples that are 1.0 standard deviations above the mean (19.1x)
41M&A & INVESTMENT SUMMARY MARCH 2013

MARCH SUMMARY TRADING VALUATION INFORMATION
Segment Name MEAN MEDIAN W AVG ADJ W AVG*Revenue Multiples
Segment Name MEAN MEDIAN W. AVG ADJ. W. AVG*Digital Media/Commerce 3.0x 1.9x 5.0x 4.0xDigital Advertising 3.6x 2.5x 4.6x 4.5xMarketing Technology 3.9x 3.3x 3.9x 3.7xAgency/Consulting 0.8x 0.8x 1.2x 1.2xMarketing Services 1.0x 0.7x 1.7x 1.1xTraditional Media 2.4x 2.3x 2.9x 2.6xTechnology 2.8x 2.2x 3.3x 3.3xSoftware 5.2x 3.5x 7.8x 4.3xCommunications 2.1x 1.2x 2.9x 2.7xInformation 3.1x 2.9x 3.7x 2.3xBusiness Services 1.2x 0.6x 3.0x 2.0x1.2x 0.6x 3.0x 2.0x
Segment Name MEAN MEDIAN W. AVG ADJ. W. AVG*Digital Media/Commerce 22.8x 13.2x 26.9x 22.5xDigital Advertising 27.2x 15.4x 17.1x 14.6xMarketing Technology 23 4 15 3 11 2 11 3
EBITDA Multiples
Marketing Technology 23.4x 15.3x 11.2x 11.3xAgency/Consulting 8.0x 7.0x 8.6x 8.5xMarketing Services 12.6x 6.4x 9.3x 8.9xTraditional Media 12.0x 8.7x 9.9x 10.1xTechnology 12.4x 9.7x 10.3x 9.8xSoftware 28.4x 15.7x 32.5x 15.4xCommunications 18.3x 10.6x 12.7x 10.4xInformation 15.9x 11.1x 13.9x 13.9xBusiness Services 11.9x 8.3x 19.3x 11.2x
As of close of business on 03/28/13
42M&A & INVESTMENT SUMMARY MARCH 2013
deviations above the mean and EBITDA multiples that are 2 standard deviations above the mean*Calculation is market cap weighted and excludes revenue multiples that are 3 standard

PPLLC INDICES – LTM as of 3/28/13Index Performance
• S&P 500 – 10.1%
Index Performance
• S&P 500 – 10.1 %
Digital Media/Commerce Agency120 130
S&P 500 10.1%
• Digital Media/ Commerce – 9.0%
S&P 500 10.1 %
• Agency/Consulting – 12.6%
90
100
110
Ind
ex P
erfo
rman
ce (
%)
90
100
110
120
Ind
ex P
erfo
rman
ce (
%)
Index Performance
• S&P 500 – 10.1 %
Index Performance
• S&P 500 – 10.1 %
Digital Advertising Marketing Services
80
Apr-12 Jun-12 Aug-12 Oct-12 Dec-12 Feb-13
S&P 500 Digital Media/Commerce
130
%)
80
Apr-12 Jun-12 Aug-12 Oct-12 Dec-12 Feb-13
S&P 500 Agency
130
%)
• Digital Advertising – 15.6% • Marketing Services – 15.4%
90
100
110
120
Ind
ex P
erfo
rman
ce (
%
90
100
110
120
Ind
ex P
erfo
rman
ce (
%
Index Performance
• S&P 500 – 10.1 %
Index Performance
• S&P 500 – 10.1 %
Marketing Technology Traditional Media
80
Apr-12 Jun-12 Aug-12 Oct-12 Dec-12 Feb-13
S&P 500 Digital Advertising
110
120
%)
80
Apr-12 Jun-12 Aug-12 Oct-12 Dec-12 Feb-13
S&P 500 Marketing Services
130
140
%)
• Marketing Technology – 2.1%
• Traditional Media – 32.3%
80
90
100
110
Ind
ex P
erfo
rman
ce (
%
80
90
100
110
120In
dex
Per
form
ance
(%
43M&A & INVESTMENT SUMMARY MARCH 2013
70
Apr-12 Jun-12 Aug-12 Oct-12 Dec-12 Feb-13
S&P 500 Marketing Technology
80
Apr-12 Jun-12 Aug-12 Oct-12 Dec-12 Feb-13
S&P 500 Traditional Media

PPLLC INDICES – LTM as of 3/28/13Index Performance
• S&P 500 – 10.1 %
Index Performance
• S&P 500 – 10.1 %
Software Communications130 120
S&P 500 10.1 %
• Software – 14.4%
S&P 500 10.1 %
• Communications – 4.5%
90
100
110
120
Ind
ex P
erfo
rman
ce (
%)
70
80
90
100
110
Ind
ex P
erfo
rman
ce (
%)
Index Performance
• S&P 500 – 10.1 %Index Performance
S&P 500 10 1 %
TechnologyInformation & Business Services
80
Apr-12 Jun-12 Aug-12 Oct-12 Dec-12 Feb-13
S&P 500 Software
120
%)
60
Apr-12 Jun-12 Aug-12 Oct-12 Dec-12 Feb-13
S&P 500 Communications
130
• Technology – 0.8%• S&P 500 – 10.1 %
• Information – 16.6%
• Business Services – 10.4%
80
90
100
110
Ind
ex P
erfo
rman
ce (
%
90
100
110
120
Ind
ex P
erfo
rman
ce (
%)
70
Apr-12 Jun-12 Aug-12 Oct-12 Dec-12 Feb-13
S&P 500 Technology
80
Apr-12 Jun-12 Aug-12 Oct-12 Dec-12 Feb-13
S&P 500 Information Business Services
44M&A & INVESTMENT SUMMARY MARCH 2013

ALL SEGMENTSStrategic Transactions ($ in Millions)
Reported
Target Buyer/Investor
Reported Transaction
Value StrategicValues Disclosed
Intelligence Holdings Temp Holdings Co., Ltd. $742.0Naspers Ltd., Slando.ru and OLX.ru Avito.ru 570.0Tensilica Cadence Design Systems, Inc. 380.0Barrington Broadcasting Group, 18 TV Stations Sinclair Broadcast Group, Inc. 370.0g g p, p,dbMotion, Inc. Allscripts 235.0Outdoor Channel Holdings Kroenke Sports Enterprise 227.0Computer Software Holdings Advanced Computer Software Group plc 164.2Melbourne IT Digital Brand Services Inc. Corporation Service Company 157.3Angel.com Incorporated Genesys Telecommunications Laboratories, Inc. 110.0ID&T BV SFX Entertainment, Inc. 102.0Tekelec Oracle Corporation 100.0Mailbox Dropbox 100.0P l Li k dI C ti 100 0Pulse LinkedIn Corporation 100.0Appature, Inc. IMS Health, Inc. 100.0nCircle Network Security, Inc. Tripwire, Inc. 100.0Nimbula, Inc. Oracle Corporation 100.0Arieso JDS Uniphase Corporation 85.0Lonely Planet Publications NC2 Media 62.2bloomspot, Inc. JP Morgan Chase & Co. 35.0Kentrox, Inc. Westell Technologies, Inc. 30.0Summly Inc Yahoo! Inc 30 0Summly, Inc. Yahoo!, Inc. 30.0Amaze plc St. Ives Marketing Services 22.8Torpedo7 The Warehouse Group Limited 20.0WifiSLAM Apple Inc. 19.5Sunshine Coast Broadcasters Eon Broadcasting 18.2altosoft Corporation Kofax, Inc. 13.5Firehole Technologies, Inc. Autodesk, Inc. 10.0Pipeline Data Calpian, Inc. 9.8Visual Revenue, Inc. Outbrain, Inc. 9.5Hub Media Group Asiasons Investments Ltd. 4.6MeNetworks Spindle, Inc. 4.0Kids Games Club TabTale Ltd. 3.5Bulbstorm ePrize LLC 3.5SP Television, Four Television Stations Media Vista Group, LLC 3.5Cauldron Consulting Porta Communications plc 2.9Voetbalzone.nl PERFORM Group PLC 2.6Salt Studios JMDE Packaging & Realties Ltd 2.0A i t Y C bi t 2 0
45M&A & INVESTMENT SUMMARY MARCH 2013
Amiato Y Combinator 2.0Priority Processing Systems Motopia Limited 1.7Fanzy SAS Kima Ventures 0.6

ALL SEGMENTSStrategic Transactions ($ in Millions)
Reported
Target Buyer/Investor
epo tedTransaction
Value StrategicUndisclosed
Abou AddNode AB - AccessVia Perceptive Software, Inc. - Actiepagina.nl RetailMeNot.com - AdE i Q1M di AdExcite Q1Media - Applied Computer Research Wired Real Estate Group, Inc. - Appogee Ancoris Limited - AQS Insurity, Inc. - Bemoko Ltd. SDL Plc - Bidou.ca Nio, Inc. - Black Flyday, Deal Buzzer, My Shopping Circle, and 10% in Iconosys Monster Offers - Blazerfish Quadrant 4 Systems Corporation - Blazerfish Quadrant 4 Systems Corporation blogTV.com YouNow - Bluem Yahoo Japan - BMG Rights Management GmbH Bertelsmann AG - C2 Group FTI Consulting, Inc. - Camilion SAP AG - Catalogik Rumblefish, Inc. - Cato Software Solutions Becton, Dickinson and Company - Cellad, Inc. World Assurance Group, Inc. - CERTPOINT Systems Infor - CHEFS and Cooking.com Target Corporation - Cobone.com Fz – LLC Tiger Global Management, LLC - ComicGenesis.com Red Giant Entertainment, Inc. - comScore ARS MSW Research - conTgo limited Concur Technologies, Inc. - Convonix Starcom MediaVest Group Convonix Starcom MediaVest Group - CortaContas Brasil Compara Online S.A. - Creativebug, Inc. Demand Media, Inc. - CS Reklam Hizmetleri Sanayi Ve Ticaret Young & Rubicam, Inc. - Datria Systems, Inc. Intelligrated, Inc. - DNNresearch Google, Inc. - Duff Research PayPal, Inc. - Duttons Design Saintnicks -
46M&A & INVESTMENT SUMMARY MARCH 2013
geDirect Impact Elijah Technologies - eDirect Impact IE Discovery - Element Fusion, Inc. Netsuite, Inc. -

ALL SEGMENTSStrategic Transactions ($ in Millions)
Reported
Target Buyer/Investor
epo tedTransaction
Value StrategicUndisclosed
ENQIO NGDATA - EQATEC Telerik, Inc. - GasBuddy Organization Inc. Oil Price Information Service, LLC - G i i T h l i (U d) Greenvision Technologies (Unnamed) - Hill Associates AdvantEdge Healthcare Solutions, Inc. - ID7 Limited Fusion-io, Inc. - Independent Publications, Three Pennsylvania Newspapers Community Media Group, Inc. - Interactive Avenues Marketing Solutions IPG Mediabrands S.A. - iTRACS Corporation CommScope, Inc. - IVANS Property and Casualty Business Applied Systems, Inc. - Jardogs Allscripts - Jardogs Allscripts john st. WPP Group - Jybe Yahoo!, Inc. - Kayfabe News Rebellion Media Group Corp. - KitchMe Coupons.com - Konga.com Naspers Ltd. - La7 Cairo Communication SpA - Les Systemes Informatiques ACCEO Solutions, Inc. - Lighthouse Analyst Relations Kea Company - Lighthouse Practice Mangement Group Yodle, Inc. - Livestar Cold Brew Labs - Magma Issuu - Maporama Solutions TIBCO Software, Inc. - Media Interactive @titude Digital - Media People Media Horizons, Inc. - MetricsHub Microsoft Corporation MetricsHub Microsoft Corporation - MetroFax j2 Global Communications, Inc. - Moboo Digital Marketing Industronics Berhad - MyDUIAttorney.Org LeadRival - Mytrus inVentiv Health, Inc. - NetComp Insurance Dovetail Insurace - Next-Tech Markets ePublishing, Inc. - Ninety Five 5 Franklin Covey Company -
47M&A & INVESTMENT SUMMARY MARCH 2013
y y p yNovo Technologies Komutel, Inc. - Nowbox YesVideo, Inc. - OCULUSai Meltwater Group -

ALL SEGMENTSStrategic Transactions ($ in Millions)
Reported
Target Buyer/Investor
epo tedTransaction
Value StrategicUndisclosed
Open Mile, Inc. Echo Global Logistics - Outsports.com Vox Media, Inc. - Pipeline Scheduling System and Dock Scheduling System AspenTech - Pi B I i l M il S i (U S di i i ) Li E i P LLC Pitney Bowes, International Mail Services (U.S. division) Lion Equity Partners, LLC - PlaySay Babbel - printerjack Hofmass - PS Suite EMR TELUS Health Solutions - Q Limited Tuchulcha Corporation - Resonate Knowledge Technologies OpenText Corporation - SF Bio Finnkino - SlideRocket ClearSlide Inc - SlideRocket ClearSlide, Inc. Snuko Plc. Mobile Cloud Labs Plc. - Sole Collector Complex Media Network - SolveDirect Service Management Cisco Systems, Inc. - Spraydate Meetic - Statlistics and ConsumerBase, LLC Exact Data LLC - STL Technologies Ltd. Capita Group plc - Storylane Facebook - Strike Media Proprietary Ogilvy & Mather - Student Marketing Group, Inc. AlloyASL - Stuff4.com Rebellion Media Group Corp. - Swipe & Tap Limited Apposing Limited - TELETOON, CKQB-FM, and CJOT-FM Corus Entertainment, Inc. - Temploy Corporate Resource Services, Inc. - Thyron Payments Systems Spire Payments Holding S.a.r.l. - Tickle Tap Toca Boca Tickle Tap Toca Boca - Tiny Post TripAdvisor, Inc. - Today's New Deal LifeApps Digital Media, Inc. - TriNovus Temenos Group AG - Twistage, Inc. Perceptive Software, Inc. - Unified Payments Net Element, Inc. - VoterTide Socialmentum, LLC - Wilico Wireless Networking Solutions Ace Marketing & Promotions, Inc. -
48M&A & INVESTMENT SUMMARY MARCH 2013
g g ,Xcellent Creations Double Encore -

ALL SEGMENTSVenture/Growth Capital Transactions ($ in Millions)
Reported
Target Buyer/Investor
Reported Transaction
Value Buyout DealsValues Disclosed
Checkpoint Systems, Inc. Platinum Equity Advisors, LLC $5.4Zhong Sen International Tea Company (Private Investors) 0.1
Buyout DealsUndisclosedUndisclosed
Concord Music Group, Inc. Wood Creek Capital Management, LLC - Davis + Henderson, Business Processing Businesses The Gores Group, LLC - GE Healthcare Strategic Sourcing The Gores Group, LLC - MSCI, CFRA Business (Private Investors) - Rose City Printing and Packaging River Associates Investments, LLC - Software (Europe) Ltd. Management Buyout - The Advocate (Private Investors) - Treat Me Management Buyout -
VC/Growth CapitalValues Disclosed
Charter Communications Liberty Media Corporation $2,617.1Sky Network Television Ltd. (Unnamed Fund Contibuters) 671.3 Domo, Inc. Institutional Venture Partners 60.0 Daisy Access Industries 60.0 Avito.ru Naspers Ltd. 50.0 Actifio, Inc. Technology Crossover Ventures 50.0 AccessData Group Sorenson Capital 45 0 AccessData Group Sorenson Capital 45.0 Pluribus Networks, Inc. China Broadband Capital 44.0 Diablo Technologies, Inc. Battery Ventures 35.5 Alloy Digital ABS Capital Partners 30.0 Bonobos, Inc. Glynn Capital Management 30.0 Anaplan, Inc. Meritech Capital Partners 30.0 Hybris Software Meritech Capital Partners 30.0 MapR Technologies, Inc. Mayfield Fund 30.0 Zalora (Thailand) Co., Ltd. Tengelmann Warenhandelsgesellschaft KG 26.0 Jumia Summit Partners LP 26.0 ShareThis, Inc. T-Venture Holding GmbH 23.0 Endgame, Inc. Paladin Capital 23.0 Farfetch.com Limited Conde Nast 20.0 Q2ebanking Battery Ventures 20.0 ProfitBricks GmbH United Internet AG 19.5 PeopleMatter Scale Venture Partners 19.0 AppNeta Bain Capital, LLC 16.0 Moovweb Jafco America Ventures Inc 16 0
49M&A & INVESTMENT SUMMARY MARCH 2013
Moovweb Jafco America Ventures, Inc. 16.0 NewsCred Greycroft LLC 15.0 OneSource Virtual Halyard Capital 15.0 OpinionLab, Inc. SSM Partners 15.0

ALL SEGMENTSVenture/Growth Capital Transactions ($ in Millions)
Reported
Target Buyer/Investor
Reported Transaction
Value VC/Growth CapitalValues Disclosed
Demandbase, Inc. Scale Venture Partners $15.0Evolv On Demand VantagePoint Capital Partners 15.0 iCarAsia carsales.com 13.9 Indochino Apparel, Inc. Highland Capital Partners 13.0 Indochino Apparel, Inc. Highland Capital Partners 13.0 Vasona Networks, Inc. Bessemer Venture Partners 12.0 Pyramid Analytics BV Sequoia Capital 11.5 Metaps, Inc. Fidelity Growth Partners Europe 11.0 FindTheBest New World Ventures, LLC 11.0 Innovid, Inc. Vintage Investment Partners 11.0 QuorumLabs, Inc. Toba Capital 11.0 Bebestore Atomico Ventures 10.2 Clues Network Pvt. Ltd. Helion Venture Partners 10.0 SFX Entertainment, Inc. WPP Group 10.0 Photobucket Corporation Oak Investment Partners 10.0 Lincor Solutions Ltd. Edison Ventures 9.5 Vendasta Technologies, Inc. Vanedge Capital 8.3 Decide Vulcan Capital 8.0 High Street Partners, Inc. Baird Capital 8.0 Bloomfire, Inc. Austin Ventures 8.0 Nipendo Ltd. Horizons Ventures Ltd. 8.0 Kilopass Technology Inc (Unnamed Fund Contibuters) 8 0 Kilopass Technology, Inc. (Unnamed Fund Contibuters) 8.0 Dachis Group Austin Ventures 7.5 ClearFit, Inc. GrandBanks Capital, Inc. 7.0 Tapad, Inc. FirstMark Capital 6.5 Style Haul, Inc. Bertelsmann Digital Media Investments 6.5 Retailigence Corporation Opt, Inc. 6.3 Bina Technologies, Inc. Sierra Ventures 6.3 Vidyard OMERS Ventures 6.0 Videdressing SAS Earlybird Venture Capital GmgH & Co. KG 6.0 LockerDome, LLC Cultivation Capital 6.0 Crushpath LLC The Social+Capital Partnership 6.0 Pneuron Corporation Safeguard Scientifics, Inc. 6.0 Appcore, LLC Telephone Acquisition Group, LLC 6.0 Spanning Cloud Apps, Inc. Foundry Group 6.0 Sift Science, Inc. Union Square Ventures 5.5 Dobleas FreakOut 5.4 Luxa Jafco America Ventures, Inc. 5.3 Tastemade Inc Redpoint Ventures 5 3
50M&A & INVESTMENT SUMMARY MARCH 2013
Tastemade, Inc. Redpoint Ventures 5.3 EverTrue, Inc. Bain Capital, LLC 5.3 BayRu, LLC (Unnamed Fund Contibuters) 5.0 Arkadium, Inc. Edison Ventures 5.0

ALL SEGMENTSVenture/Growth Capital Transactions ($ in Millions)
Reported
Target Buyer/Investor
Reported Transaction
Value VC/Growth CapitalValues Disclosed
Postmates, Inc. Founders Fund $5.0Aktana, Inc. (Angel Investors) 5.0 500friends, Inc. Intel Capital 5.0 Avalanche Technology Rogers Ventures 5.0 Avalanche Technology Rogers Ventures 5.0 Omada Health, Inc. U.S. Venture Partners 4.7 Rev.com, Inc. Globespan Capital Partners 4.5 Albumatic, Inc. RRE Investors 4.5 Rent the Runway American Express Company 4.4 Servio (Unnamed Fund Contibuters) 4.3 GoEuro Battery Ventures 4.0 Pathbrite, Inc. ACT 4.0 QPID, Inc. Cardinal Partners 4.0 Concurrent, Inc. True Ventures 4.0 Park City Group, Inc. (Unnamed Fund Contibuters) 3.8 Sophia Search Ltd. Atlantic Bridge 3.7 Handshakez Austin Ventures 3.6 tracx Social Media Management System Flybridge Capital Partners 3.5 Life360 BMW iVentures 3.5 coresystems ag (Private Investors) 3.2 clypd, Inc. Atlas Venture 3.2 AdzCentral Digital Media Partners 3 2 AdzCentral Digital Media Partners 3.2 PeopleLinx LLC Osage Investments, Inc. 3.2 Catchpoint Systems, Inc. Battery Ventures 3.2 Canva, Inc. Matrix Partners 3.0 Nonstop Games Creandum 2.9 Masabi Fontinalis Partners, LLC 2.8 YaSabe Inc. 500 Startups 2.7 Developer Auction, Inc. NEA 2.7 Chope Singapore Press Holdings Ltd. 2.5 Cheerful Mind Fund 2.5 OpenX Software Ltd. Samsung Venture Investment Corporation 2.5 Knew Deal, Inc. Detroit Venture Partners, LLC 2.3 Scoot & Doodle, Inc. Pearson plc 2.3 TripleLift, Inc. True Ventures 2.1 Troop ID (Angel Investors) 2.1 Snoox (Unnamed Fund Contibuters) 2.0 Looker First Round Capital 2.0 GameSkinny CLR Partners LLC 2 0
51M&A & INVESTMENT SUMMARY MARCH 2013
GameSkinny CLR Partners, LLC 2.0 Epoxy, Inc. GRP Partners 2.0 Artist Growth LLC (Private Investors) 2.0 MessageMe, Inc. Andreessen Horowitz 1.9

ALL SEGMENTSVenture/Growth Capital Transactions ($ in Millions)
Reported
Target Buyer/Investor
Reported Transaction
Value VC/Growth CapitalValues Disclosed
Namo Media Andreessen Horowitz $1.9Games2Win India Pvt. Ltd. Clearstone Venture Partners 1.8 Wide Open Spaces, Inc. Mercury Fund 1.8 Homejoy, Inc. Andreessen Horowitz 1.7 Homejoy, Inc. Andreessen Horowitz 1.7 Centzy, Inc. Founder Collective 1.6 GiveGab Cayuga Venture Fund 1.5 Vistar Media, Inc. Mercury Fund 1.5 Ondore ALTA Ventures Mexico 1.5 Rexter Siemer Ventures 1.5 Casabu Limited Ingenious Ventures 1.4 AnyPerk Digital Garage, Inc. 1.4 AdStage, Inc. Freestyle Capital 1.4 GlobeSherpa, Inc. Oregon Angel Fund 1.3 TastemakerX, Inc. Baseline Ventures 1.3 GiveGab Great Oaks Venture Capital 1.2 Sherpa, Inc. Andreessen Horowitz 1.1 Slate Science, Inc. (Angel Investors) 1.1 Billaway Funding Farm 1.1 Divshot Rincon Venture Partners 1.1 We (Unnamed Fund Contibuters) 1.0 Visualnet Inc Kibo Ventures 1 0 Visualnet, Inc. Kibo Ventures 1.0 Soldsie, Inc. 500 Startups 1.0 Contactually, Inc. Boston Seed Capital LLC 1.0 Contactually, Inc. Point Nine Capital 1.0 Joyride Freestyle Capital 1.0 SalesFUSION Hallett Capital 1.0 Lucena Research (Unnamed Fund Contibuters) 1.0 VALMARC Corporation (Unnamed Fund Contibuters) 1.0 MyPermissions 500 Startups 1.0 Qustodio W8 Ventures 1.0 Human Demand, Inc. (Private Investors) 0.9 Fligoo (Unnamed Fund Contibuters) 0.9 Import.io Ltd Wellington Partners 0.9 Mosaic Storage Systems, Inc. Borealis Ventures 0.9 Marxent Labs Stage 1 Ventures 0.8 Mention Alven Capital Partners 0.8 Landau Brothers LLC Detroit Venture Partners, LLC 0.8 Red e Productions LLC Yearling Management LLC 0 8
52M&A & INVESTMENT SUMMARY MARCH 2013
Red e Productions LLC Yearling Management LLC 0.8 Discoverly Atlas Venture 0.8 Scringo (Angel Investors) 0.7 Festicket Ltd. Kima Ventures 0.7

ALL SEGMENTSVenture/Growth Capital Transactions ($ in Millions)
Reported
Target Buyer/Investor
Reported Transaction
Value VC/Growth CapitalValues Disclosed
iCoolhunt S.r.l. (Private Investors) $0.7Knok (Private Investors) 0.7 Uppidy, Inc. Band of Angels 0.6 FoodEssentials (Unnamed Fund Contibuters) 0.5 FoodEssentials (Unnamed Fund Contibuters) 0.5 MEETiiN Innobridge International 0.5
VC/Growth CapitalUndisclosed
AgreeYa Mobility, Inc. Saama Capital - Aviacode, Inc. Heritage Group, LLC - BriefCam Ltd. Motorola Solutions Venture Capital - Health & Safety Institute DW Healthcare Partners - iStreamPlanet Co. Intel Capital - Kontexto, Inc. Spectral Capital CorporationSpectral Capital Corporation - Onlineprinters GmbH TA Associates - Qnary LLC Vandaele Capital - Sonar Media, Inc. Bing Fund - SourceHOV LLC Citi Venture Capital International - Thomsons Online Benefits Veronis Suhler Stevenson Partners, LLC - Wine in Black Bright Capital Digital - Wizehive, Inc. Gabriel Venture Partners - XOS Digital Inc (Unnamed Fund Contibuters) - XOS Digital, Inc. (Unnamed Fund Contibuters) Zappix Kormeli, LLC -
53M&A & INVESTMENT SUMMARY MARCH 2013

Petsky Prunier: Maximizing Shareholder Value• Founded in 1999
• Focused on the technology, marketing, media, eCommerce, and healthcare industries
• Over 35 focused professionals
› Unique combination of investment banking and consulting expertise
• New York, Palo Alto, Las Vegas, Chicago, Tampa
• Sell-side and private placement close rate is unmatched at our level of deal volume
• Deep relationships across a broad spectrum of venture capital and private equity groups, lenders and strategic buyers
• Together with strategic consulting firm Winterberry Group, one of the largest industry-specific advisors providing strategic and transactional services
STRATEGIC CONSULTINGINVESTMENT BANKING
p g g
• International reach through our partnership with Altium. Founded more than 20 years ago and privately owned, Altium operates from ten offices across Europe
• Securities transactions processed through Petsky Prunier Securities LLC, a licensed broker-dealer
STRATEGIC CONSULTINGINVESTMENT BANKING
• Sell-Side Representation• Capital Raising and Private
Placements• Corporate Divestitures
• Strategic Development and Competitive Analysis
• M&A Transaction Due Diligence Support and Valuation Analysis
• Technology• Media• Marketing
CCorporate Divestitures• M&A Advisory• Fairness Opinions
• Acquisition Strategy/Target Identification• Publishing and Thought Leadership
• eCommerce• Healthcare
54M&A & INVESTMENT SUMMARY MARCH 2013

Petsky Prunier was Ranked #1 by Bloomberg in 2011-2012 for Mid-Market Internet & Advertising Transactions*
Rank Advisor Deal Count
1 Petsky Prunier LLC 30
2 Nomura Holdings Inc 24
3 GCA Savvian Group Corp 23
4 Goldman Sachs & Co 20
5 Morgan Stanley 19
6 Jordan Edmiston Group 186 Jordan Edmiston Group 18
7 Jefferies Group Inc. 16
8 China Renaissance Partners 15
8 Sumitomo Mitsui Financial 15
10 JP M 1410 JP Morgan 14
10 RBC Capital Markets 14
* Based on number of deals announced in 2011-2012 valued at $500 million or less
More than 50 transactions closed since 2010:
• Ranging from strategic sales and divestitures to private equity recaps to growth, mezzanine, and alternative financings
A b d i f i d i i l di di i l d i i d k i C d di i l
55M&A & INVESTMENT SUMMARY MARCH 2013
• Across a broad universe of industries, including digital advertising and marketing, eCommerce and digital media, technology and software, information services, and healthcare

International Partnership with Altium
• Altium provides M&A and corporate finance advisory services to companies, private equity firms and entrepreneurs
About Altium International Network
private equity firms, and entrepreneurs
• European-based, mid-market financial advisory group, employee-owned and truly independent
New York Palo AltoLas Vegas Chicago
Tampa
• A leading adviser for more than 25 years and from start as the corporate finance arm of private equity investor Apax Partners, has developed into a group that
t t i t ti l ffi operates across ten international offices with cooperation partners in USA and China
• In the last five years, has completed +50 technology transactions in 12 different countries
Madrid
Zurich
Paris
DubaiMunichMilan
Manchester LondonLeeds
Frankfurt
56M&A & INVESTMENT SUMMARY MARCH 2013

REPRESENTATIVE RECENT TRANSACTIONS
d i di l di d has sold a leading digital advertising
has been acquired by
a dynamic display media and retargeting company
(JASDAQ:4755)
has been sold to
a leading provider of digital production services to brands and agencies
(NSYE: ACN)
has been acquired by
a real-time behavioral advertising company
(NSYE: AOL)
has been sold to
a leading provider of in-store and shopper marketing signage to major North American retailers
has sold
provider of online travel guides for top destinations around the world
to
(NYSE: GCI )
specializing in retail, digital, shopper marketing and consumer
services to
along with digital subsidiary
has been sold to
monetization and shopper marketing partner for e-commerce retailers
with financing from
a portfolio company ofhas been sold to
a leading multiplatform travel and lifestyle media company
a subsidiary of
has been sold to
the largest provider of cloud‐based SaaS tools for printing signs, labels and tags,
and publishing digital displays for retailers
a unit of
(NYSE: LXK )
has been sold to
the top independentdirect-to-consumer marketer of
dental savings plans
has sold
and
a leading provider of services for domain name registration,
acquisition, brokerage and salesto
a leading digital direct marketing company utilizing a proprietary database to provide customer
acquisition solutions for major brandshas received an equity investment from
with debt financing from
a leader in technology and global in-app advertising for Facebook,
Apple (iOS), and Android developers
has received $66M investmentfrom
has been sold to
a leader in global healthcare primary market research and influence network mapping
a portfolio company of
a provider of a cloud-based integration platform for the digital
marketing industry
has received $15M financing led by
a leader in multichannel retail, ecommerce and loyalty marketing
serviceshas been sold to
has sold its
Sports Marketing Print Division
to
has received a mezzanine debt investment from
a leading provider of transportation-based digital
media networks
has sold
a premier provider of affinity programs for universities and colleges
to
a leading advertising technology company
has been sold to
(Xetra: DPW.DE)
a leading provider of taxi-based outdoor media
has been sold to
(NYSE: PAY)
a leading market services and BPO company
has sold
to
has sold
a leading online lead generation business
to
(Nasdaq: TREE)
(NasdaqGS: LEDR)
has acquired
a pioneer in measuring the impact of promotion on
physician prescribing behavior
has sold
A leading urban and multicultural agency
to
a subsidiary of
(NYSE: IPG)
has sold
to
a leading provider of integrated data, technology and analytics
solutions
has been sold to
a global digital marketing agency
a unit of
a leading data management and audience optimization platform
(DMP) company
has been sold to
(TSX: PTO)
to
a portfolio company of
Vestar Capital Partners has sold
and
a portfolio company of
has merged with
has been sold to
a portfolio company of
one of North America’s largest mobile marketing and gateway
solution providers
has been sold to
(Nasdaq:GSIC)
has received a majority investment from
a leading online video advertising network
has received a growth capital investment from
a provider of multichannel marketing software services
has been sold to
( d )
a digital communications agency with a proprietary software
platform serving biopharmaceutical companies
has been sold to
Parthenon Capital Partners KRG Capital Partners (Nasdaq:GSIC) (Nasdaq: RRD)
has acquired
a division of
a premier provider of benchmark-based advisory services to the
pharmaceutical and biotech industry
a leading online community forautomotive enthusiastsand social networkingtechnology platform
to
has sold
New Digital Group
has sold the assets of
a global marketing services company
has been acquired by
(NASDAQ: TREE)has acquired certain assets of
an interactive direct marketing company specializing in
l d i f h f fi
a portfolio company ofhas been sold to
a leading performance-basedadvertising network
has been sold to
57M&A & INVESTMENT SUMMARY MARCH 2013
has been acquired by toto in a combination that creates
the world’s leading loyaltymanagement provider
lead generation for the for-profit,post-secondary education market has divested one of its
marketing services divisions