march 2009 trends
TRANSCRIPT


2 ALASKA ECONOMIC TRENDS MARCH 2009
Sarah Palin, Governor of AlaskaCommissioner Click BishopMarch 2009
Volume 29Number 3
ISSN 0160-3345
To contact us for more information, a free subscription,
mailing list changes or back copies, email Trends@alaska.
gov or call (907) 465-4500.
Alaska Economic Trends is a monthly publication dealing
with a wide variety of economic-related issues in the state. Its
purpose is to inform the public about those issues.
Alaska Economic Trends is funded by the Employment
Security Division and is published by the Alaska Department
of Labor and Workforce Development.
Alaska Economic Trends is
printed and distributed by Assets, Inc., a vocational training and
employment program, at a cost of $1.16 per copy.
Material in this publication is public information, and, with
appropriate credit, may be reproduced without permission.
Cover: The photo is courtesy of
the U.S. Department of Housing and Urban Development.
Alaska’s Residential Foreclosures 4Alaska’s foreclosure rates – at a 15-year high – are still much lower than the nation’s
Alaska’s Workplace Fatalities 10 Work-related deaths decline
Employment Scene 17Job growth continues in Alaska
Brynn Keith, ChiefResearch and Analysis
Susan Erben, EditorSam Dapcevich, Graphic Artist
To contact Trends authorsor request a free subscription, email [email protected] or call (907)465-4500. Trends is on the Web atlaborstats.alaska.gov.
Caroline Schultz, an Alaska Department of Labor and Work-force Development economist in Juneau, specializes in housing market research. To reach her, call (907) 465-6027 or email her at [email protected].
Sara Verrelli is a Department of Labor research analyst in Juneau. She special-izes in tracking oc-cupational illnesses, injuries and fatalities. To reach her, call (907) 465-4539 or email [email protected].
Dan Robinson, a Department of Labor economist in Juneau, specializes in state-wide employment and wages. To reach him, call (907) 465-6036 or email him at [email protected].
Trends Authors

3ALASKA ECONOMIC TRENDS MARCH 2009
Alaska’s ForeclosuresThird-Lowest in the Nation
By Governor Sarah Palin
This month’s Trends focuses on foreclosures in Alaska’s residential housing market and workplace safety.
Alaskans faced 1,131 foreclosures in 2008. Although that was a 36 percent in-crease over 2007, Alaska’s foreclosure rate of 0.88 percent was the third-lowest
rate in the nation in 2008. Compared to Alaska’s record 1988 high of 6,821 foreclosures and compared to the num-bers now occurring in the rest of the nation, Alaska’s housing market remains strong.
Because of high standards in lending practices and the absence of speculative buying and selling, Alaska is in an enviable position compared to the Lower 48, with a solid housing market and low foreclosure rate. For more than 60 years, our state housing agency, the Alaska Housing Finance Corporation, and its predecessor, the Alaska State Housing Authority, have provided affordable housing programs for Alaskans. AHFC is recognized nationally for its low-interest loans to fi rst-time homebuyers and veterans so they can buy new or existing energy-effi cient homes.
Those loans, coupled with last year’s investment of $360 million for weatherization and home energy rebate pro-grams, provide Alaskans with multiple options to improve the energy effi ciency of their homes. For more information about AHFC or its programs, call (907) 330-8447, or go online at www.ahfc.us. To participate in the energy rebate program, go to www.akrebate.com or call (877) 325-2508 (877-AKREBATE).
Keeping Alaska’s workplaces safer
Workplace fatalities are near a record low in Alaska – 30 in 2007 compared to 91 in 1992. Fatal injuries occurred most often in high-risk occupations such as forestry, fi shing and transportation.
But even one death is one too many, and we will continue to strive for zero workplace fatalities. One program that’s helping is the Alaska Department of Labor and Workforce Development’s Occupational Safety and Health Voluntary Protection Program. It recognizes and promotes effective workplace safety and health management through coop-eration between a company’s management, its employees and AKOSH.
Companies that qualify for VPP show they’re committed to safety at all levels in their organization, with a strong commitment from senior management, down to individual employees who take safety as a personal responsibility.
Additional benefi ts of excellent safety performance include improved productivity, lower workers’ compensation costs and improved employee morale.
There are now 15 sites in Alaska with the VPP designation. For a listing of the sites and more information about the program, go to labor.alaska.gov/lss/vpp-participants.html.

4 ALASKA ECONOMIC TRENDS MARCH 2009
shown resilience compared to the nation as a whole by many indicators, particularly fore-closure rates. Alaska foreclosure rates have re-mained low compared to the nation’s, owing to the health of the state’s housing market and its economy as a whole.
The Alaska Department of Labor and Work-force and Development collects foreclosure data based on public records. An analysis of the numbers dating back to 1980 revealed that there were 1,131 foreclosures in Alaska in 2008, a 36 percent increase from 2007.
The increase in the number of foreclosures in 2008 was largely driven by the Anchorage and Palmer Recording Districts. (See Exhibit 1.) The Anchorage Recording District1 had 458 foreclo-sures in 2008, 152 more foreclosures than in 2007. The Palmer Recording District2 had 275 foreclosures in 2008, 88 more than 2007.
Outside Southcentral Alaska, the foreclosure picture is prettier. The Fairbanks Recording District3 had only nine more foreclosures in 2008 than the prior year. The Juneau Record-ing District had only one more foreclosure in
1 The Anchorage Recording District encompasses the Municipality of Anchorage as well as Whittier and the west side of Cook Inlet. The Alaska Department of Natural Resources Recorder’s Offi ce uses recording districts for geographic designations. Recording districts don’t correspond perfectly to boroughs and census areas. For more information about recording districts, go to the Recorder’s Offi ce Web site at dnr.alaska.gov/ssd/recoff/fi ndYourDistrict.cfm. 2 The Palmer Recording District includes the most populous areas of the Matanuska-Susitna Borough, but excludes the area north of Willow.3 The Fairbanks Recording District includes the Fairbanks North Star Borough as well as much of the Yukon fl ats area and commu-nities on the Alaska Highway.
By Caroline Schultz, EconomistAlaska’s Residential Foreclosures
ousing experts across the nation are comparing current housing woes and foreclosure rates to those of the Great Depression. But you don’t have to be
an octogenarian to remember such hard times for the Alaska housing market. The recent spate of foreclosures in the national headlines may re-mind a few sourdoughs of the late 1980s bust in Alaska when jobs were slashed, entire residential blocks were turned over to the banks and more than 8 percent of the state’s population fl ed to the Lower 48.
The national credit collapse will ripple through the Alaska economy in unpredictable ways, but despite weaknesses in other markets around the country, Alaska’s housing market has so far
Alaska’s foreclosure rates – at a 15-year high – are still much lower than the nation’s
H
Anchorage Leads in ForeclosuresPalmer Recording District second-highest1
Sources: Alaska Department of Natural Resources, Recorder's Offi ce; Alaska Department of Labor and Workforce Development, Research and Analysis Section
1998 1999 2000 2001 2002 2003 2004 2005 2006 2007 20080
100
200
300
400
500
Anchorage Recording DistrictPalmer Recording DistrictFairbanks Recording District
Number of Foreclosures

5ALASKA ECONOMIC TRENDS MARCH 2009
2008 than it did the year before. The number of foreclosures fell in 2008 in the Kenai,4 Ketchikan and Kodiak Recording Districts.
A historical perspective
A review of historical data suggests that foreclo-sures in Alaska have been increasing in recent years. From 2006, the lowest year on record, to 2007, the number of foreclosures statewide grew 38 percent. From 2007 to 2008 foreclo-sures climbed another 36 percent to a 15-year high of 1,131.
While that’s a considerable increase in just two years, it’s relatively small compared to the spike in activity in the mid-1980s. (See Exhibit 2.) The number of foreclosures doubled between 1984 and 1985 and continued to swell over the next few years, ultimately reaching a record high in 1988 at 6,821 foreclosures.
From 1980 to 1985, even amidst a national recession, Alaska’s economy and population surged. (See Exhibit 3.) Driven by the same high oil prices that weighed heavily on the Lower 48 economy, jobs multiplied and wages soared in Alaska even as they fell in the rest of the coun-try. (See Exhibit 4.)
State programs, in response to crippling interest rates and a national recession, subsidized inter-est rates and eliminated income requirements for mortgages. Alaskans were buying homes at a record pace despite rising prices and double-digit interest rates. (See Exhibit 5.) More than 36,000 homes were built in urban Alaska be-
4 The Kenai Recording District includes Soldotna.
2Alaska Residential ForeclosuresA historical perspective, 1980 to 2008
1980 1982 1984 1986 1988 1990 1992 1994 1996 1998 2000 2002 2004 2006 2008
1,000
2,000
3,000
4,000
5,000
6,000
7,000
Number ofForeclosures
Boom and BustAlaska's population, 1981 to 19903
1981 1982 1983 1984 1985 1986 1987 1988 1989 1990
0
10,000
20,000
30,000
-10,000
-20,000
0
NetPopulationMigration
Sources for Exhibit 2:Alaska Department of Natural Resources, Recorder’s Offi ce; Alaska Department of Labor and Workforce Development, Research and Analysis Section
Source for Exhibit 3:Alaska Department of Labor and Workforce Development, Research and Analysis Section, Demographics Unit
Sources for Exhibit 4:U.S. Department of Labor, Bureau of Labor Statistics; Alaska Department of Labor and Workforce Development, Research and Analysis Section
Payroll Employment GrowthAlaska and U.S., 1980 to 20074
1980 1982 1984 1986 1988 1990 1992 1994 1996 1998 2000 2002 2004 2006
2%
4%
6%
8%
10%
12%
-2%
-4%
-6%
PercentChange
0%
U.S.Alaska

6 ALASKA ECONOMIC TRENDS MARCH 2009
tween 1980 and 1985 and prices still increased more than 50 percent during that period.
The tide began to change in 1985 when state government spending slowed. The price of oil took a nosedive in 1986 and the boom of the fi rst half of the decade quickly turned into a bust. State spending had been a major com-ponent of the job growth of the fi rst part of the decade, and when revenues declined, the state had no options but to cut jobs and reduce spending. (See Exhibit 6.) More than 20,000 public- and private-sector jobs were lost be-tween 1986 and 1987.
The construction boom was suddenly a hous-ing glut. By the end of 1987, there were 14,000 empty housing units in Anchorage alone. Many of the thousands of new homeowners hadn’t had time to build equity on their homes and, when home prices plummeted, they found themselves with loan amounts that exceeded their property values.
There were more than 26,000 residential fore-closures fi led during the last half of the decade. Rampant defaults resulted in lending institutions owning an unprecedented number of Alaska homes. Alaska Housing Finance Corporation alone held 2 percent of the state’s total housing stock in its inventories by 1989. It took well into the 1990s for the housing market to stabilize.
It’s possible that the lessons learned from the upheaval in the last part of the 1980s may have played a role in keeping Alaska’s housing market out of the current national mire.
Better than the Lower 48
Speculative construction, no-limit home loans, purchasing frenzies and soaring prices are all
U.S. Foreclosures at Record HighNational foreclosure rate, 1979 to 20087
1980 1982 1984 1986 1988 1990 1992 1994 1996 1998 2000 2002 2004 2006 2008
0%
0.5%
1.0%
1.5%
2.0%
2.5%
3.0%
3.5%
Percentage inForeclosure
Percentage of SurveyedMortgages in Foreclosure
January 1979 to September 2008
Cost of Borrowing is Falling1972 to 20085
1972 1974 1976 1978 1980 1982 1984 1986 1988 1990 1992 1994 1996 1998 2000 2002 2004 2006 2008
5%
10%
15%
20%
InterestRate National Average Annual 30-year Fixed-Rate Mortgage Rate
Oil Drives 1980’s EconomyTotal state oil revenue, 1979 to 19896
1979 1980 1981 1982 1983 1984 1985 1986 1987 1988 1989
$1 billion
$2 billion
$3 billion
$4 billionOil Revenue
Source for Exhibit 5:Freddie Mac Primary Mortgage Market Survey
Source for Exhibit 6:Alaska Department of Revenue, Tax Division
Source for Exhibit 7:Mortgage Bankers Association, National Delinquency Survey

7ALASKA ECONOMIC TRENDS MARCH 2009
Alaska Has Third-Lowest Foreclosure RateThe 50 states and District of Columbia, third quarter 20088
Rank
Number of LoansSurveyed
Percentageof Surveyed
Mortgages in Foreclosure Rank
Numberof Loans
Surveyed
Percentageof Surveyed
Mortgages in Foreclosure
1 Wyoming 69,556 0.63% 27 South Carolina 666,729 2.04%2 North Dakota 61,249 0.86% 28 Colorado 1,018,557 2.06%3 Alaska 93,537 0.88% 29 Pennsylvania 1,555,267 2.06%4 Montana 138,143 0.91% 30 Mississippi 252,374 2.07%5 Washington 1,202,022 1.19% 31 Delaware 171,250 2.10%6 South Dakota 83,519 1.22% 32 Louisiana 477,784 2.10%7 Oregon 640,723 1.31% 33 Oklahoma 429,356 2.12%8 Arkansas 311,876 1.34% 34 Massachusetts 834,208 2.14%9 North Carolina 1,414,518 1.35% 35 Maryland 1,075,841 2.15%10 Utah 440,430 1.43% 36 Georgia 1,675,604 2.27%11 Texas 3,113,776 1.43% 37 Kentucky 439,436 2.45%12 Alabama 606,923 1.48% 38 New York 2,052,340 2.57%13 Virginia 1,415,599 1.49% 39 Wisconsin 632,522 2.57%14 Missouri 884,136 1.51% 40 Minnesota 909,129 2.74%15 New Mexico 257,434 1.52% U.S. Average 45,474,524 2.97%16 Nebraska 208,275 1.55% 41 New Jersey 1,279,523 3.06%17 Tennessee 862,243 1.58% 42 Rhode Island 140,324 3.18%18 Idaho 263,310 1.62% 43 Maine 143,164 3.19%19 West Virginia 134,103 1.63% 44 Illinois 1,771,111 3.45%20 Vermont 62,649 1.64% 45 Michigan 1,481,827 3.53%21 Kansas 332,581 1.64% 46 Indiana 857,971 3.59%22 Hawaii 169,563 1.67% 47 Arizona 1,223,568 3.86%23 New Hampshire 199,394 1.70% 48 California 5,871,693 3.90%24 District of Columbia 95,447 1.77% 49 Ohio 1,519,449 3.93%25 Connecticut 537,748 1.98% 50 Nevada 567,910 5.58%26 Iowa 361,715 2.03% 51 Florida 3,565,944 7.32%
Source: Mortgage Bankers Association, National Delinquency Survey
characteristics of both the Alaska housing mar-ket in 1983 and the Lower 48 in 2005. Though each boom and bust was triggered by different events, the symptoms are similar.
For instance, the national Mortgage Bankers Association foreclosure rate – reported as the percentage of total sampled mortgages that are in foreclosure status – shows that between the third quarter of 2005 and the third quarter of 2008, the foreclosure rate in the U.S. increased by more than 200 percent. (See Exhibit 7.)
Alaska, on the other hand, has the third-lowest foreclosure rate in the nation. (See Exhibit 8.) The relative unpopularity of higher-risk sub-prime mortgages, and adjustable-rate mortgages in particular, is the likely reason for Alaska’s strong standing.
Because of that, Alaska subprime loans are dramatically outperforming subprime loans nationwide in terms of delinquency rates. In the third quarter of 2008, 10 percent of Alaska mortgages were subprime, while 12 percent of mortgages nationally were subprime. Only 5 percent of Alaska subprime loans were seriously delinquent – 90 days or more late on payment or in foreclosure – while 20 percent of total U.S. subprime loans fell into that category.
Alaska subprime loans were 2.4 times less likely to have an adjustable interest rate than the nation’s. Adjustable rate mortgages are of-fered with low introductory interest rates but are adjusted after the initial period (usually from one to fi ve years). When the interest rate resets at a higher rate and monthly mortgage payments increase accordingly, borrowers are

8 ALASKA ECONOMIC TRENDS MARCH 2009
U.S. Home Prices Up and DownCase-Shiller Historical Home Price Index9
Source: Standard & Poor’s/Case-Shiller Historical Home Price Index
Home Prices Begin to Taper OffSingle-family home prices, Alaska10
Sources: Alaska Housing Finance Corporation, Alaska Quarterly Survey of Mortgage Activity; Alaska Department of Labor and Workforce Development, Research and Analysis Section
January2000
January2001
January2002
January2003
January2004
January2005
January2006
January2007
January2008
80
100
120
140
160
180
200
220
Index Number January 2000 to November 2008
1992 1993 1994 1995 1996 1997 1998 1999 2000 2001 2002 2003 2004 2005 2006 2007$0
$50,000
$100,000
$150,000
$200,000
$250,000
$300,000
AverageHome Price
sometimes unable to meet the additional bur-den of an often substantially higher monthly payment.
No boom, no bust?
The U.S. housing bubble was driven by many factors, one of which was speculation in the market. Real estate investors watched home values soar and invested accordingly. Eager buy-ers drove prices even higher as builders rushed to meet demand. (See Exhibit 9.) Despite that escalation, the real estate gold rush bypassed Alaska.
Alaska’s average single-family home prices have increased modestly from the early 1990s through 2007, heating slightly between 2001 and 2006. (See Exhibit 10.) Data from the fi rst three quarters of 2008 follow the historical trend, rising at a rate similar to 2007.
Alaska home prices are leveling – a somewhat positive development compared to a plague of plummeting prices in much of the Lower 48. Level to slightly rising prices will keep Alaska homeowners’ heads above water on their mort-gages, reducing the risk of foreclosure.
But not all Alaskans win when home prices remain high. Potential buyers, optimistic from hearing the news of falling prices elsewhere, will continue to fi nd the dream of homeownership at arm’s length if home prices maintain their up-ward trend.
What the future holds
Perhaps Alaska mortgage lenders and borrow-ers remembered the hard lessons learned in the 1980s, or Outside builders and investors didn’t see a lucrative future in Alaska real estate. Whatever the reason, Alaska’s housing market has so far escaped the fallout from the defl ating national housing bubble.
Although 2008 was a 15-year record high for foreclosures, there were 115 fewer foreclosures in the fourth quarter than the third. (See Exhibit 11.) Foreclosures will likely continue to be high-er than average through 2009, but it’s possible that the worst is over.
Much depends on the health of Alaska’s econ-omy. A fl at economy could sustain a healthy housing market, but signifi cant job losses or fall-ing wages could force foreclosure numbers even higher. Although short-term employment fore-casts predict a modest decline in 2009, long-term projections suggest the state will regain a course of stable growth.
Despite the rosy comparisons to the national foreclosure crisis, more Alaskans lost their homes last year than any year since the recovery from the 1980’s bust. A key difference between

9ALASKA ECONOMIC TRENDS MARCH 2009
current housing market conditions and the spike of defaults in the mid- to late-1980s is that Alaska’s economy remains stable and the national economy is anemic.
In 1986, the national economy had re-covered from a recession and seemed a hopeful place for fi nancially troubled Alaskans. In contrast, Alaska homeown-ers who struggle to manage their mort-gage today have even fewer choices Outside. Alaska may even be seen as a refuge for some of the victims of the serious economic contraction in many parts of the country.
Alaska’s low foreclosure rates are a major factor in the relative health of the state’s housing market and they play an indirect role in Alaska’s overall economic well-being.
11Foreclosures Up From 2006 LowForeclosures by quarter, Alaska
Sources: Alaska Department of Natural Resources, Recorder’s Offi ce; Alaska Department of Labor and Workforce Development, Research and Analysis Section
1998 1999 2000 2001 2002 2003 2004 2005 2006 2007 2008
100
200
300
400
Foreclosures
Four-Quarter Moving Average

10 ALASKA ECONOMIC TRENDS MARCH 2009
Bureau of Labor Statistics works with all 50 states and the District of Columbia – in Alaska’s case, the Alaska Department of Labor and Workforce Development’s Research and Analysis Section – to identify, verify and profi le fatal work injuries using diverse state and federal data sources.2
The best way to spot trends
Because workforce fatality numbers can vary considerably from one year to the next – espe-cially in states like Alaska where yearly fatality numbers are small in comparison to most other states – a year-to-year comparison isn’t the best way to measure trends.
A single accident, for example, might claim nu-merous lives at once, spiking the fatality number for that year. The next year, there might not be
a major catastrophic event, so the number of workplace deaths for that year might be a lot lower.
A better approach to explore safety trends in the workplace is to look at the average num-ber of fatalities, how the fatalities occurred and their characteristics over different time frames spanning multiple years.
Looking at the same 16-year period, work-place fatalities decreased 32 percent from the fi rst half of the period (an average of 62 deaths a year) to the second half (an average of 42 a year).
2 The national CFOI program provides a methodological framework for all states to collect reliable and consistent infor-mation on private- and public-sector wage and salary workers and the self-employed. (See the program methodology at the end of this report.)
By Sara Verrelli, Research AnalystAlaska’s Workplace Fatalities
laska had 30 workplace fatalities – injuries that resulted in deaths – in 2007, the third-lowest number since 1992, continuing a downward trend.
In the 16 years between 1992 and 2007,1 825 workers died in Alaska’s workplaces, an average of about one every seven days. Nationally, near-ly 5,500 workers died in workplaces in 2007 alone. (See Exhibits 1 and 2.)
The data presented in this report are derived from the annual Census of Fatal Occupational Injuries program, a federal/state cooperative that started in 1992. The U.S. Department of Labor’s
1 Workplace fatalities that occurred in 2008 aren’t included in this report because the Census of Fatal Occupational Injuries for 2008 won’t be released until August 2009.
Work-related deaths decline
A
Alaska Workplace Fatalities1992 to 20071
Sources: Alaska Department of Labor and Workforce Development, Research and Analysis Section; U.S. Department of Labor, Bureau of Labor Statistics
91
6660
78
63
51
43 42
53
64
42
28
42
29
45
30
1992 1993 1994 1995 1996 1997 1998 1999 2000 2001 2002 2003 2004 2005 2006 2007
20
40
60
80
100Fatalities Census of Fatal Occupational Injuries

11ALASKA ECONOMIC TRENDS MARCH 2009
Fatal Work InjuriesAlaska and the U.S., 1992 to 20072
Sources: Alaska Department of Labor and Workforce Development, Research and Analysis Section; U.S. Department of Labor, Bureau of Labor Statistics
Work-Related Fatalities in AlaskaBy event, 2003 to 20073
Workplace FatalitiesAlaska U.S.
2007 30 5,4882006 45 5,8402005 29 5,7342004 42 5,7642003 28 5,5752002 42 5,5242001 64 5,9152000 53 5,9201999 42 6,0541998 43 6,0551997 51 6,2381996 63 6,2021995 78 6,2751994 60 6,6321993 66 6,3311992 91 6,217
2003 to 2007Alaska Alaska U.S.
2003 2004 2005 2006 2007 Total Percentage Total Percentage
Total workplace fatalities 28 42 29 45 30 174 28,401
Transportation incidents 13 31 21 25 17 107 62% 12,040 42% Highway vehicles 1 8 1 2 2 14 8% 6,855 24% Water vehicles 6 8 19 13 6 52 30% 413 1% Falls from ships, boats, other 2 3 5 2 5 17 10% 158 1% Sinkings, capsized water vehicles 4 2 14 10 1 31 18% 149 1% Other - 3 - 1 - 4 2% 106 0% Airplanes and helicopters 6 13 1 6 9 35 20% 975 3% During take off/landing 1 4 - - 2 7 4% 331 1% Other aircraft incidents 5 9 - 6 7 27 16% 644 2%Exposure to harmful substances or environments 3 3 0 5 5 16 9% 2,486 9%Contact with objects and equipment 3 0 0 8 4 15 9% 4,836 17%Assaults and violent acts, including suicides and animal attacks
7 0 0 4 0 11 6% 4,130 15%
Falls 0 0 3 0 0 3 2% 3,950 14%Other or unknown 2 8 5 3 4 22 13% 959 3%
Notes:A dash indicates that no data were reported or the data fail to meet Bureau of Labor Statistics' publication criteria.This is a select list of events for analysis; the parts don't add to the total.The percentages for the subsets of each category are percentages of the total fatalities in Alaska or the U.S.Sources: Alaska Department of Labor and Workforce Development, Research and Analysis Section; U.S. Department of Labor, Bureau of Labor Statistics
In the fi rst fi ve years of the 16-year period, from 1992 to 1997, Alaska had an average of 72 deaths a year. In the last fi ve years of the period, 2003 to 2007, the state averaged 35 deaths a year, a 51 percent decrease.
Yet, while Alaska’s working environments are becoming safer, people are still dying. Safety experts maintain that every workplace death is preventable.
Making a safer workplace
Alaska’s downward trend in workplace fatali-ties since 1992 can be partly credited to the decline in commercial fi shing fatalities since the implementation of individual fi shing quota sys-tems. Before the halibut, black cod and pollock fi sheries converted to quota systems during the late 1990s – and the Bering Sea crab fi sheries in 2005 – fi shermen literally raced to get as many fi sh and crab as possible during short openings

12 ALASKA ECONOMIC TRENDS MARCH 2009
Worker CharacteristicsWorkplace fatalities, 2003 to 20074
lasting a few days. The tight openings and heavy competition, coupled with Alaska’s unpredict-able weather that can turn vicious without a mo-ment’s notice, meant people died.
The IFQ system, in contrast, allows fi shermen fl exibility to wait for better weather, with months instead of days to catch their quotas.
Aviation technology improvements have also contributed to a higher level of safety. The Cap-stone Program, funded by the Federal Aviation Administration, was developed to address the high number of aviation accidents in Alaska, par-ticularly in the state’s rural areas. The program’s goal is to increase aviation safety by integrating
technology more effi ciently using auto-mated weather information systems, the Global Positioning System and terrain avoidance hardware and software.
The Capstone Program was developed by the FAA, Alaska’s aviation com-munity, the National Transportation Safety Board, National Weather Service and National Institute of Occupational Safety and Health.
Causes of work-related deaths – a look at five years of data, 2003 to 20073
The manner in which a workplace death occurs is called an event. The categories of events include assaults and violent acts, contact with objects and equipment, exposure to harmful substances or environments, falls and transportation incidents. If more than one type of event occurs when a work-er dies, it’s categorized using the fi rst event that occurred.
For example, when a driver of a vehicle is stabbed and then crashes into a road divider, the event would be coded as an assault, not a transportation inci-dent.
Proper event categorization can be problematic. A death due to drown-
ing, for instance, is recorded as a transportation event if a vehicle, such as a boat or ship, was involved. But if a vehicle wasn’t involved – such as if a worker fell off a dock and drowned – the event is recorded as exposure to harmful sub-stances or environments (water).
Fatalities due to transportation incidents have been the leading cause of workplace fatalities nationally and in Alaska since the start of the census in 1992.
At the same time, Alaska’s workplace trans-portation needs are far different and riskier
3 The rest of this report refers to the fi ve-year period from 2003 to 2007.
2003 to 2007
Alaska U.S.Number Percentage Number Percentage
Total 174 100% 28,401 100%
Employee status Wage and salary workers1 118 68% 22,869 81% Self-employed2 56 32% 5,532 19%
Gender Male 159 91% 26,273 93% Female 15 9% 2,128 7%
Age Under 19 4 2% 624 2% 20 to 24 20 11% 2,086 7% 25 to 34 33 19% 5,039 18% 35 to 44 46 26% 6,334 22% 45 to 54 44 25% 6,873 24% 55 to 64 19 11% 4,506 16% 65 and over 8 5% 2,827 10%
Race/Ethnicity White 123 71% 19,808 70% Hispanic or Latino3 13 7% 4,517 16% Alaska Native or American Indian
19 11% 194 1%
Asian 12 7% 771 3% Other or not reported 7 4% 203 1%
Note: The defi nitions of the categories are from the Census of Fatal Occupational Injuries.1 May include volunteers and workers receiving other types of compensation2 Includes self-employed workers (fi shermen are categorized here), owners of unincorporat-ed businesses and farms, paid and unpaid family workers, and may include some owners of incorporated businesses or members of partnerships3 People identifi ed as Hispanic or Latino may be of any race. The race categories shown exclude Hispanic and Latino workers.Sources: Alaska Department of Labor and Workforce Development, Research and Analysis Section; U.S. Department of Labor, Bureau of Labor Statistics

13ALASKA ECONOMIC TRENDS MARCH 2009
than what’s common in the Lower 48. Aside from the usual cars and trucks, Alaska work-ers rely more on different types of transpor-tation – boats, Bush planes, helicopters, all-terrain vehicles, snow machines and even sled dogs.
Sixty-two percent of Alaska’s workplace fatalities during the fi ve-year period from 2003 to 2007 were transportation incidents, which is much higher than the U.S.’s 42 percent. (See Exhibit 3.) Nearly half the state’s transportation deaths were water-vehicle related.
Alaska’s dependence on air transportation – which is critical to transporting people, cargo and mail to more than 250 villages off the road system – accounted for a third of transportation fatalities during the fi ve-year period. In com-parison, the state’s highway vehicle accidents that killed workers accounted for 13 percent of transportation fatalities.
Nationally, 42 percent of all workplace fatalities were transportation incidents or events dur-ing the fi ve-year period, representing 12,040 deaths.
Exposure to harmful substances or environ-ments was the second-leading cause of worker deaths in Alaska, representing 9 percent of the state’s workplace fatalities (16 deaths). That cat-egory includes drug overdoses, diving accidents, drowning, electrocutions and chemical inhala-tions.
Nationally, exposure to harmful substances or environments was the fi fth-leading cause of worker deaths. The category represented 9 percent of the nation’s workplace fatalities, the same percentage for Alaska.
The third-leading cause of deaths in Alaska dur-ing the fi ve-year period was contact with objects and equipment, accounting for just under 9 percent of the state’s workplace fatalities. The category doesn’t include the deaths of pedestri-ans, roadway workers and non-passengers struck by vehicles and powered industrial equipment; those would be classifi ed as transportation fatali-ties. Nationally, contact with objects and equip-
ment was the second-leading cause of death, accounting for 17 percent of the nation’s work-place fatalities.
Deaths due to assaults and violent acts ac-counted for 6 percent of Alaska’s workplace fatalities (versus 15 percent for the nation), while falls only represented 2 percent of the state’s fatalities (versus 14 percent for the na-tion). An even larger percentage of Alaska’s fatalities, 13 percent, were classifi ed under “other or unknown causes,” (versus 8 percent for the nation).
Work-related fatalities byworker characteristics
A persistent Alaska myth is that there are far more males than females, although 2007 popu-lation estimates show that males 16 and older made up 51 percent of the state’s population.
Even so, as far as workplace fatalities, the num-ber of fatalities involving men far outweigh those involving women.
Alaska had 174 work-related deaths during the fi ve-year period from 2003 to 2007. Of those, 91 percent were men (159 workers) and 9 per-cent were women (15 workers). That’s largely because more men work in the state’s most dangerous industries – fi shing, aviation and con-struction. Nationally, the male/female rates were similar. (See Exhibit 4).
Looking at the difference in fatalities between the self-employed, and wage and salary work-ers, the self-employed have higher fatality rates in proportion to the work force than wage and salary workers. Much of that is because many people working in commercial fi shing – again, a particularly hazardous industry – are self-employed.
The 2000 U.S. Census shows that self-employed and unpaid family workers make up 8 percent of Alaska’s work force, yet they represented 32 percent of the state’s fatalities (56 deaths) in the fi ve-year period, as shown by the fatality census. Conversely, wage and salary workers, including government workers, make up 92 percent of

14 ALASKA ECONOMIC TRENDS MARCH 2009
Alaska’s work force, yet they accounted for 68 percent of the fatalities (118 deaths).
Seventy percent of the people who died in the state’s workplaces in the fi ve-year period were in their prime working years, ages 25 to 54. The highest fatalities were in the 35- to 44-year-
old group (46 deaths), followed by the 45- to 54-year-old group (44 deaths) and the 25- to 34-year-old group (33 deaths).
Looking at race or ethnicity during the fi ve-year period, 71 percent of the people who died on the job were white (123 workers), 11
An Industry Breakdown of FatalitiesWorkplace fatalities, 2003 to 20075
1 This category includes fi shermen.Sources: Alaska Department of Labor and Workforce Development, Research and Analysis Section; U.S. Department of Labor, Bureau of Labor Statistics
Where the Most Workplace Fatalities AreOccupational categories, 2003 to 20076
1 Occupations in the installation, maintenance and repair occupational category range from a large equipment mechanic to an electrical line-man and telecommunication equipment installer and repairer.Sources: Alaska Department of Labor and Workforce Development, Research and Analysis Section; U.S. Department of Labor, Bureau of Labor Statistics
Agriculture, Forestry,Fishing and Hunting1
12%Mining
3%
Construction21%
Manufacturing7%
Trade10%
Transportation and Warehousing
15%
Leisure and Hospitality3%
All Government9%
All Other Industries20%
Agriculture, Forestry,Fishing and Hunting1
29%
Mining4%
Construction10%
Manufacturing4% Trade
5%
Transportation and Warehousing
24%
Leisure and Hospitality7%
All Government5%
All Other Industries12%
AlaskaU.S.
Farming, fishingand forestry
5%
Transportation and material moving
26%
Construction and extraction
20%Installation,
maintenanceand repair1
7%
Production5%
All other occupations
37%
Farming, fishingand forestry
29%
Transportation and material moving
28%
Construction and extraction
9%
Installation,maintenanceand repair1
5%
Production5%
All other occupations
24%
AlaskaU.S.

15ALASKA ECONOMIC TRENDS MARCH 2009
Methodology
The Census of Fatal Occupational Injuries program each year collects, analyzes and pub-lishes information on all fatal injuries that oc-curred while an employee was at work receiv-ing pay or other compensation, was conduct-ing a work activity or was present at the site of the incident as a condition of employment.
Cases are substantiated with two or more in-dependent source documents, such as death certifi cates, workers’ compensation forms, coroner’s reports and newspaper articles.
Deaths occurring in the private and public sec-tors, as well as the military, are counted. The program also counts the self-employed1 and volunteer workers who are exposed to the same work hazards and are performing the same duties as paid employees. This method-ology ensures that the counts are as complete and accurate as possible.
Information on the cause of death, and type of industry and occupation are useful in monitor-ing trends of work-related hazards and in iden-tifying high-risk industries and occupations.
The CFOI program’s goal is to provide people with pertinent data so they can identify poten-tial risks to workers and work toward prevent-ing future fatalities.
1 Self-employed workers – of whom commercial fi shermen are a big group – are covered by CFOI. However, they aren’t covered under state unemployment insurance, so their em-ployment isn’t represented in Research and Analysis’ standard employment data series.
percent were Alaska Native or American In-dian (19 workers), and 7 percent were either Hispanic or Latino (13 workers) or Asian (12 workers).
Work-related fatalities by industry
Ninety-fi ve percent of fatal injuries in Alaska in the fi ve-year period involved workers in private industry, which includes the self-employed. Workers in the agriculture, forestry, fi shing and hunting industry had the most workplace deaths with 29 percent of the fatalities (50 deaths), followed by the transportation and warehous-ing industry with 24 percent (41 deaths) and the construction industry with 10 percent (18 deaths). (See Exhibit 5.)
Compared to the U.S. over the same fi ve-year period, the percentage of Alaska’s workplace fatalities in the agriculture, forestry, fi shing and hunting industry was more than twice as high as the national percentage (29 percent versus 12 percent). The percentage in Alaska’s trans-portation and warehousing industry was 38 percent higher than the U.S. (24 percent versus 15 percent).
Work-related fatalities by occupation
Fatalities by occupational group add to the story.
The category with the most deaths was farming, fi shing and forestry occupations, which account-ed for 29 percent of Alaska’s job fatalities in the fi ve-year period. All 51 people in that category who died were in fi shing-related occupations. (See Exhibit 6.)
Nationally, the farming, fi shing and forestry group had only 5 percent of the deaths.
The category with the next highest number of deaths was transportation and material moving occupations, which had 28 percent of Alaska’s fatalities (48 deaths). Fifteen of those were air transportation workers, 13 were motor vehicle operators and nine were water transportation workers. The remaining 10 deaths didn’t meet publication criteria.
In the U.S., transportation and material moving occupations represented a similar amount – 26 percent of fatalities.
Construction and extraction occupations ac-counted for about one out of every 10 work-place fatalities in the fi ve-year period, or 9 percent – 16 fatalities. Nationally, it was more than twice that – 20 percent of the nation’s fatalities. Alaska’s abbreviated construction

16 ALASKA ECONOMIC TRENDS MARCH 2009
season probably accounts for some of that dif-ference.
□ □ □
Research and Analysis publishes both fatal and non-fatal workplace injury and illness informa-tion and data tables for readers to download on its Web site at laborstats.alaska.gov. Click on
“Occupational Information” on the blue menu bar on the left, then “Injury, Illness & Fatalities.” National data as well as information for all 50 states and the District of Columbia are available from the U.S. Bureau of Labor Statistics at www.bls.gov/iif/. (The “iif” represents “Injuries, Ill-nesses and Fatalities.”)
A S
afet
y M
inut
e
Workplace Safety: Teach Them Early
Every year, thousands of Alaska youth ages 14 to 17 work part-time or in summer jobs, where they can learn life skills and get some valuable work experience. But all that isn’t worth it if teenagers get injured on the job, or killed.
That’s why the Alaska Department of Labor and Workforce Development’s Occupational Safety and Health Section obtained funding for a new position and hired Nathan Menah last July to travel throughout the state to get youth workers – and their employers – interested in workplace safety and health.
Eighty-fi ve youth in Alaska in 2007 had to go to emergency rooms because of workplace injuries, Menah said. Alaska’s last youth workplace fatality was in 2002, when a gillnet-setting skiff capsized out of Homer, killing a 14-year-old boy.
“The whole idea is to create an educational program that changes the attitudes of kids toward workplace safety and health,” said Grey Mitchell, director of the Labor Standards and Safety Division, which houses Occupational Safety and Health, or AKOSH.
“Workplace safety and health has a negative image with some Alaskans,” Mitchell said. “A worker may have heard a boss or co-worker talk bad about OSH, that [taking precautions] is a waste of time, that it’ll slow down production. The concept is if we can get to young workers before they’re jaded or predisposed,” that’s the time to get the message across, he said.
Since October, Menah has taught workplace safety and health to some 2,600 students in 25 schools. He’ll eventually develop a curriculum for youth of different ages – from high schoolers down to elementary school students – and he’ll work with teachers, counselors and administrators to get them to use the cur-riculum.
Menah’s presentations and the curriculum include a fi lm that University of Alaska Anchorage broadcast students and their professor produced, working with Menah. It’s been in the works for a year.
The fi lm shows an interview with the brother of the 14-year-old who died, and another with a 20-year-old who was 17 when he lost half his hand in a sawmill accident in Fairbanks in 2006. The fi lm crew also inter-viewed a mother of a Kenai teen who was 15 in 2007 when she suffered a brain injury. Her supervisor had mistakenly turned on a trash compactor when she was loading it; the compactor door fl ew open and hit her in the head.
Menah said he thinks the fi lm and his presentations are getting across to the kids. “They’re really amazed at what they’re learning. A lot of them didn’t know they had rights and responsibilities for safety in the workplace.”
During the summers – the highest employment period for youth – Menah visits employers throughout the state who hire youth, to teach them about workplace safety and health laws, particularly as they apply to youth. He also tells them about the Department of Labor’s free safety consultations for employers.
For more information, call Nathan Menah at (907) 269-4946 or email him at [email protected].
17ALASKA ECONOMIC TRENDS MARCH 2009
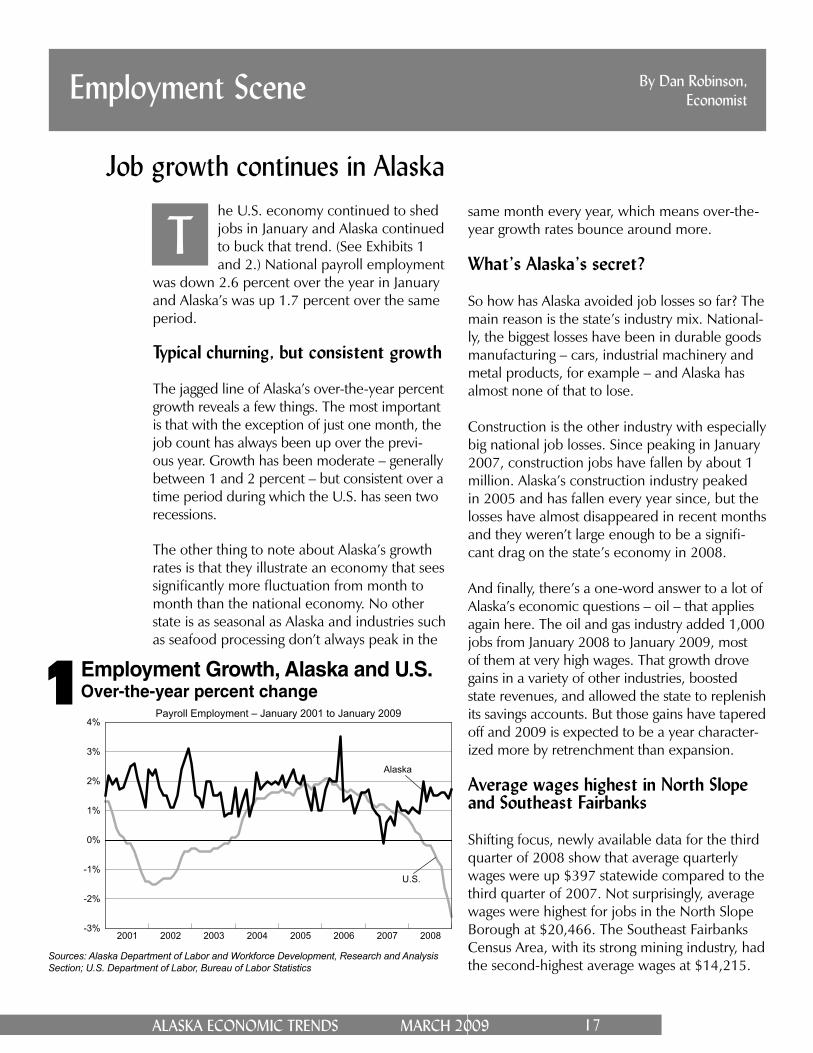
same month every year, which means over-the-year growth rates bounce around more.
What’s Alaska’s secret?
So how has Alaska avoided job losses so far? The main reason is the state’s industry mix. National-ly, the biggest losses have been in durable goods manufacturing – cars, industrial machinery and metal products, for example – and Alaska has almost none of that to lose.
Construction is the other industry with especially big national job losses. Since peaking in January 2007, construction jobs have fallen by about 1 million. Alaska’s construction industry peaked in 2005 and has fallen every year since, but the losses have almost disappeared in recent months and they weren’t large enough to be a signifi -cant drag on the state’s economy in 2008.
And fi nally, there’s a one-word answer to a lot of Alaska’s economic questions – oil – that applies again here. The oil and gas industry added 1,000 jobs from January 2008 to January 2009, most of them at very high wages. That growth drove gains in a variety of other industries, boosted state revenues, and allowed the state to replenish its savings accounts. But those gains have tapered off and 2009 is expected to be a year character-ized more by retrenchment than expansion.
Average wages highest in North Slope and Southeast Fairbanks
Shifting focus, newly available data for the third quarter of 2008 show that average quarterly wages were up $397 statewide compared to the third quarter of 2007. Not surprisingly, average wages were highest for jobs in the North Slope Borough at $20,466. The Southeast Fairbanks Census Area, with its strong mining industry, had the second-highest average wages at $14,215.
By Dan Robinson, EconomistEmployment Scene
Job growth continues in Alaska
Employment Growth, Alaska and U.S.Over-the-year percent change
Sources: Alaska Department of Labor and Workforce Development, Research and Analysis Section; U.S. Department of Labor, Bureau of Labor Statistics
he U.S. economy continued to shed jobs in January and Alaska continued to buck that trend. (See Exhibits 1 and 2.) National payroll employment
was down 2.6 percent over the year in January and Alaska’s was up 1.7 percent over the same period.
Typical churning, but consistent growth
The jagged line of Alaska’s over-the-year percent growth reveals a few things. The most important is that with the exception of just one month, the job count has always been up over the previ-ous year. Growth has been moderate – generally between 1 and 2 percent – but consistent over a time period during which the U.S. has seen two recessions.
The other thing to note about Alaska’s growth rates is that they illustrate an economy that sees signifi cantly more fl uctuation from month to month than the national economy. No other state is as seasonal as Alaska and industries such as seafood processing don’t always peak in the
T
1
2001 2002 2003 2004 2005 2006 2007 2008
0%
1%
2%
3%
4%
-1%
-2%
-3%
Alaska
U.S.
Payroll Employment – January 2001 to January 2009

18 ALASKA ECONOMIC TRENDS MARCH 2009
2 Nonfarm Wage and SalaryEmployment
4 Nonfarm Wage and Salary EmploymentBy region
Preliminary Revised Revised Changes from: Percent Change: 1/09 12/08 1/08 12/08 1/08 12/08 1/08
Anch/Mat-Su 166,800 170,900 162,700 -4,100 4,100 -2.4% 2.5% Anchorage 148,300 152,500 145,300 -4,200 3,000 -2.8% 2.1%Gulf Coast 25,800 26,000 25,400 -200 400 -0.8% 1.6%Interior 40,500 43,100 40,900 -2,600 -400 -6.0% -1.0% Fairbanks 8 35,200 37,000 35,500 -1,800 -300 -4.9% -0.8%Northern 20,350 20,350 18,900 0 1,450 0.0% 7.7%Southeast 32,450 33,250 32,300 -800 150 -2.4% 0.5%Southwest 18,450 15,650 18,750 2,800 -300 17.9% -1.6%
3Average Quarterly WagesBy borough and census area
For more current state and regional employment and unemployment data, visit our Web site. We have a new address:
laborstats.alaska.gov
Third Quarter
2008
Third Quarter
2007 Change
Alaska Statewide $11,243 $10,846 $397
Anchorage/Mat-Su Region Municipality of Anchorage $11,932 $11,576 $356 Mat-Su Borough $8,836 $8,502 $334Gulf Coast Region Kenai Peninsula Borough $9,423 $9,019 $404 Kodiak Island Borough $9,732 $9,799 -$67 Valdez-Cordova Census Area $10,720 $10,900 -$180Interior Region Denali Borough $8,739 $8,622 $117 Fairbanks North Star Borough $11,101 $10,787 $314 Southeast Fairbanks CA $14,215 $14,195 $20 Yukon-Koyukuk Census Area $8,564 $8,930 -$366Northern Region Nome Census Area $9,353 $8,819 $534 North Slope Borough $20,466 $18,762 $1,704 Northwest Arctic Borough $12,259 $11,506 $753Southeast Region Haines Borough $8,040 $8,052 -$12 Juneau Borough $10,452 $10,112 $340 Ketchikan Gateway Borough $9,284 $8,948 $336 Prince of Wales-Hyder CA $8,234 * * Sitka Borough $9,114 $9,103 $11 Hoonah-Angoon Census Area $7,357 $7,212 $145 Municipality of Skagway $9,870 $9,941 -$71 Petersburg Census Area $7,756 * * Wrangell Borough $8,221 * * Yakutat Borough $7,732 $8,831 -$1,099Southwest Region Aleutians East Borough $8,607 $8,693 -$86 Aleutians West Census Area $10,432 $9,630 $802 Bethel Census Area $8,353 $8,279 $74 Bristol Bay Borough $10,159 $9,895 $264 Dillingham Census Area $8,400 $8,511 -$111 Lake and Peninsula Borough $10,285 $9,506 $779 Wade Hampton Census Area $5,131 $5,342 -$211
* Data are not available because these areas were recently cre-ated or redefi ned.
Preliminary Revised Revised Changes from:
Alaska 1/09 12/08 1/08 12/08 1/08
Total Nonfarm Wage and Salary 1 304,200 309,200 299,000 -5,000 5,200Goods-Producing 2 39,900 38,100 38,600 1,800 1,300Service-Providing 3 264,300 271,100 260,400 -6,800 3,900Natural Resources and Mining 15,600 15,700 14,200 -100 1,400 Logging 200 200 100 0 100 Mining 15,500 15,500 14,100 0 1,400 Oil and Gas 13,100 13,100 12,100 0 1,000Construction 13,600 15,200 13,700 -1,600 -100Manufacturing 10,700 7,200 10,700 3,500 0 Wood Product Manufacturing 400 400 400 0 0 Seafood Processing 7,100 3,400 7,000 3,700 100Trade, Transportation, Utilities 61,200 63,200 60,800 -2,000 400 Wholesale Trade 6,100 6,300 6,300 -200 -200 Retail Trade 35,100 36,500 35,000 -1,400 100 Food and Beverage Stores 6,100 6,200 6,300 -100 -200 General Merchandise Stores 9,700 10,000 9,600 -300 100 Transportation, Warehousing, Utilities 20,000 20,400 19,500 -400 500 Air Transportation 6,000 6,100 6,000 -100 0 Truck Transportation 3,000 3,200 2,900 -200 100Information 7,000 7,100 6,800 -100 200 Telecommunications 4,700 4,700 4,300 0 400Financial Activities 14,400 14,600 14,400 -200 0Professional and Business Services 24,300 24,700 24,000 -400 300Educational 4 and Health Services 37,400 37,600 36,800 -200 600 Health Care 27,100 27,300 26,700 -200 400Leisure and Hospitality 27,100 28,200 27,000 -1,100 100 Accommodations 6,100 6,600 6,100 -500 0 Food Services and Drinking Places 17,100 17,800 17,400 -700 -300Other Services 11,000 11,400 10,900 -400 100Government 81,900 84,300 79,700 -2,400 2,200 Federal Government 5 15,900 16,400 16,100 -500 -200 State Government 24,600 25,700 22,800 -1,100 1,800 State Government Education 6 7,000 7,900 5,800 -900 1,200 Local Government 41,400 42,200 40,800 -800 600 Local Government Education 7 23,700 24,100 23,300 -400 400 Tribal Government 3,500 3,500 3,300 0 200
Notes for Exhibits 2 and 4:1 Excludes the self-employed, fi shermen and other agricultural workers, and private household workers; for estimates of fi sh harvesting employment, and other fi sheries data, go to labor.alaska.gov/research/seafood/seafood.htm2 Goods-producing sectors include natural resources and mining, construction and manufacturing.3 Service-providing sectors include all others not listed as goods-producing sectors.4 Private education only5 Excludes uniformed military6 Includes the University of Alaska7 Includes public school systems8 Fairbanks North Star BoroughSources for Exhibits 2 and 3: Alaska Department of Labor and Workforce Development, Research and Analysis Section; U.S. Department of Labor, Bureau of Labor StatisticsSources for Exhibit 4: Alaska Department of Labor and Workforce Development, Research and Analysis Section; also the U.S. Department of Labor, Bureau of Labor Statistics, for Anchorage/Mat-Su

19ALASKA ECONOMIC TRENDS MARCH 2009
Employer ResourcesThe Business Connection:
A Full Spectrum of Employer Services The staff at Alaska Job Centers provide employers with a whole range of useful and free services through the Alaska Department of Labor and Workforce’s Business Connection. One of the services is ALEXsys, the Alaska labor exchange system where employers can place job orders, fi nd suitable candidates by reviewing applicants’ resumes and qualifi cations, fi nd out about appropriate training, determine competitive starting sala-ries and look at labor market trends. (Access ALEXsys on the Web by going to jobs.alaska.gov.)
Business Connection staff also help employers tailor recruitment plans to meet employers’ needs, refer quali-fi ed applicants to employers and arrange for employers to use job center conference and interview rooms for recruiting. Employer workshops at the Anchorage Midtown Job Center cover wage and hour laws, small business payroll, the Employment Security Tax and other topics. Workshops can also be provided on request throughout the state at businesses, other job centers and conferences.
The Business Connection Web site at jobs.alaska.gov/employer.htm has a link to the newly updated Alaska Employer Resource Manual. The manual gives a detailed overview of the employer services available through the Department of Labor (including those through the Business Connection), and provides employers with a working knowledge of state and federal requirements.
The Business Connection Web site also has links to ALEXsys, required employment-related posters, employ-ee bonding, tax credits, on-the-job training, small business development, Alaska Job Centers, Employment Security Tax, the Trade Adjustment Assistance program and more.
Another employer service is a program called Rapid Response, where a team of specialists from various De-partment of Labor programs goes to a business site or community facing layoffs to conduct free workshops and counseling for employees on topics such as training for another job, current job openings, job search skills, resume writing and interviewing, applying for unemployment insurance benefi ts – even how to deal with stress.
The Rapid Response team also helps companies regardless of where they are in the business cycle: it can pay for feasibility studies for employee stock ownership plans or other plans, new product development, mar-ket exploration, upgrading current workers’ skills – anything that might create more jobs or maintain existing ones. During layoffs, the team helps companies ensure their layoffs are orderly and legal.
For more information, go to the two Web sites listed above, call or stop by any Alaska Job Center, or call (877) 724-ALEX (2539). For a list of other employer resources, go to jobs.alaska.gov or the Department of Labor’s Web site at labor.alaska.gov and click on “Employers” in the gold ribbon at the top.