march 2007 the rich and the rest of us
TRANSCRIPT

THE RICH AND THE REST OF USThe changing face of Canada’s growing gapBy Armine Yalnizyan
March 2007

isbn 978-0-88627-531-0
Canadian Centre for Policy Alternatives
2 Carlton Street, Suite 1001Toronto, Ontario(416) 263-9896
www.GrowingGap.ca
acknowledgements
The author would like to thank the following for their painstaking work to provide the data, without whom this analysis would have not been possible: Brian Murphy of Statistics Canada and Richard Shillington of Tristat Resources.
Thanks also to the following for their input on issues and analysis: Garnett Picot, René Morissette, and Andrew Heisz, Statistics Canada.
The author would also like to thank the following for their input on early drafts of the report: John Myles (Statistics Canada and University of Toronto); Marc Lee (Canadian Centre for Policy Alternatives–BC office); Hugh Mackenzie (research associate, Canadian Centre for Policy Alternatives); Seth Klein (Canadian Centre for Policy Alternatives–BC office); Brian Murphy; and Richard Shillington.
This paper was ably prepared with the assistance of Trish Hennessy, Project Director of the Inequality Project, Canadian Centre for Policy Alternatives.
The conception of the Inequality Project and its research is a collaborative reflection of the CCPA (regional offices) and the project team — Trish Hennessy, Hugh Mackenzie, and Armine Yalnizyan.
Any errors or omissions are the responsibility of the author.
�the rich and the rest of us
Introduction
in the fall of 2006 the Canadian Centre for Policy Alternatives released a poll conducted by Environics Research that showed 76% of Canadians believe the gap between the rich and the poor is growing.
The poll also showed 67% of Canadians believe the majority are not benefiting from the nation’s hot streak of economic growth.
This study confirms Canadians’ perception is reality: Canada is performing bet-ter economically than it has in decades, but the income gap between the rich and the rest of Canadian families is growing at a faster rate than ever. The rewards of Canada’s booming economy have been going disproportionately to a select few.
What’s more, this study finds the growing gap is not just a problem for “the poor”, who are taking advantage of Canada’s strong economy and working more hours than the generation that preceded it — only to find themselves stuck in pov-erty. This study finds the majority of Canadian families are falling behind compared to a generation ago.
They are falling behind in the best of economic times, under conditions that would typically yield a reduced income gap: low unemployment rates, more Cana-dians working, and more Canadians putting in longer hours in the workplace.
This study finds Canada’s growing gap was impervious to these factors, due to several new and extreme trends:
Income gap at 30-year high Canada’s gap between rich and poor is growing, and this is during the best of economic conditions. In 2004, the average earnings of the richest 10% of Canada’s families raising children was 82 times that earned by the poorest 10% of Canada’s families. That is approaching triple the ratio of 1976, which was around 31 times. The after-tax income gap has never been this high in at least 30 years, and it has been growing faster than ever since the late 1990s.
Greater polarization This study reveals Canadian families are experiencing greater inequality and greater polarization of incomes compared to families raising children a generation ago. Only the richest 20% are experiencing gains

� growing gap project
from Canada’s economic growth, and most of those gains are concentrated in the top 10%. The share of income going to the bottom 80% of Canadian families is smaller today than it was a generation ago, in both earnings and after-tax terms.
The rich are getting richer The richest 10% of Canadian families are getting richer. They enjoyed a 30% earnings increase compared to a generation ago, the only group to experience such gains. This is creating a new phenomenon in income distribution in Canada: the rich are breaking away from the rest of society, in a way we have not seen since these data began to be collected, in 1976.
Bottom half shut out of economic gains The differences become stark when we compare the top half of families with the bottom half: Between 1976–79, the bottom half of Canada’s families earned 27% of total earnings. Between 2001–04, their share dropped to 20.5% of total earnings, even though they were working more.
Contrasting fortunes The poorest 20% of Canadian families saw their share of the earnings pie drop from 4.5% from the late 1970s, to 2.6% in the early 2000s. In sharp contrast, the top half of Canadian families saw their share of total earnings grow, from 73% to 79.5% during that same time period. Most of the increase went to the very richest 10% of families. Their share of earnings grew from 23% to 29.5% of all earnings by Canadian families.
Work is not enough Everybody but the richest 10% of families are working more weeks and hours in the paid workforce. The average Canadian household with children is clocking in almost 200 hours more compared to just nine years ago. Only one group of families didn’t clock in more hours: the richest 10%, on average, didn’t increase their work hours between 1996 and 2004. Yet only the richest 10% saw major increases in their earnings.
Government makes a difference While the rich still got richer in after-tax terms, Canada’s tax and transfer system made an important difference. If they had to rely solely on market earnings, 40% of Canadian families would have experienced significant losses in incomes compared to a generation ago — even though they are working more. Canada’s tax and transfer system stopped the freefall of incomes for almost half of the population raising children.
�the rich and the rest of us
section one
It’s About Family
this study focuses on the fortunes of Canadian families raising children under the age of 18.
When we talk about how economic growth pays off, we tend to think of per-sonal stories, individual economic fortunes. But everyone’s formative years begin in some type of a family, and the vast majority of Canadians lives with at least one other person.
Almost half of Canadians (46.3%) live in households that are raising children under the age of 18.1 They represent a big chunk of Canadian society. So looking at what’s happening to Canadian families during the best of economic times tells us about how our economy is performing for adults trying to keep families healthy and happy, and growing in every sense of personal development.
What happens to these families is important in another sense too: we are pinning our future and our hopes on them, both personally and socially. They are the next generation of contributors to the nation’s economy. The opportunities available to this generation of children by virtue of market dynamics or social provisions will, in turn, shape the Canada of tomorrow.
This study looks at how dramatically economic fortunes have changed over the course of the past 30 years (1976–2004) for that building block of society — the place where people learn how to be people — families raising children. It looks at income distribution by examining what happened to this population by deciles — 10 equiva-lently sized slices of the population, ranked by income that is adjusted for inflation. That permits us to look at where real change is occurring — at the bottom, top, or middle of the distribution of incomes.
This study reveals Canadian families are experiencing greater inequality and greater polarization of incomes compared to families raising children a generation ago. The share of income going to the bottom 80% of Canadian families is smaller today than it was a generation ago, whether measured by earnings or after-tax in-comes.2
This story is troubling for a number of reasons, including: who it is happening to, when it is happening, how we measure its scale, and what may be driving it.

� growing gap project
This particular group of Canadian households — families raising children — tra-ditionally display the most stable income trends and lower disparities across the income spectrum than, for example, people living on their own, couples without children, or the elderly. For 20 of the past 30 years, after-tax incomes of families raising children tended to go through similar changes, through recessions and re-coveries, over the decades. The breaking point in this pattern seems to be exactly when economic conditions became the best they’ve been in decades — beginning in the late 1990s and continuing today.
Given the strength of Canada’s economy, it would be natural to assume that things are finally better for most Canadians, after decades of turbulence in the labour market. Not so. While there have been gains in earnings for most income classess in the past eight years, many families have barely recaptured the income levels of a generation ago (and this with more time spent in the labour market). Even more problematic is the fact that income inequality is growing rapidly at a time when it should be shrinking, as it did during previous periods of strong economic growth.
How do we know the gap is growing? There are three data sources we can look at to understand patterns of income distribution — Statistics Canada’s SCF/SLID sur-vey (see note 2 for explanation of the acronym and Appendix One for a description of the data source and methodology), the Census, and tax data. Of these, the SCF/SLID is annual; it provides consistent data going back to 1976; it is able to document what is happening to different family types; it captures the work time required to generate earned incomes; and it provides information about both income transfers and taxes. It is also the source of choice for talking about low-income cut-offs (the “poverty line”).
Solid as this data source is, we know it underestimates what is happening at both the “rich” and “poor” ends of the income spectrum.3 As a result, the findings in this study likely understate the degree to which the distribution of incomes in Canada is growing more unequal. They represent a conservative estimate of the scale of the problem, partly because of the time frame we have chosen (particularly when we compare economic peak with economic peak), partly because of the sample size of the data source, and partly because it tells the story of families raising children rather than all Canadians as individuals.

�the rich and the rest of us
section two
Who’s Rich? Who’s Poor? Getting The Definitions Clear
what does it mean to be among the richest or poorest families raising chil-dren in Canada today?
There are important differences in dollar values, depending on whether you are referring to earnings (what families can do for themselves) or after-tax incomes (which includes government provided income supports and income taxes). Both are provided here.4
If a family’s earnings exceeded $131,000, they were among the elite in 2004, the richest 10% of households raising children under 18 in Canada. Families earning more than $166,000 made more than 95% of families raising children.
The poorest 10% of families earned less than $9,400. Five percent of families
chart 1 Where Do You Belong? Distribution of earned incomes for 3.8 million families raising children under 18, 2004
$ 0
$ 20,000
$ 40,000
$ 60,000
$ 80,000
$ 100,000
$ 120,000
$ 140,000
$ 160,000
$ 180,000
Median Average Decile 1Up to $9,380
Decile 2$9,381
to $23,450
Decile 3$23,451
to $36,000
Decile 4$36,001
to $48,600
Decile 5$48,600
to $60,200
Decile 6$60,201
to $71,500
Decile 7$71,501
to $85,200
Decile 8$85,201
to $102,300
Decile 9$102,301
to $131,200
Decile 10Over $131, 201
$ 1,050
$ 71,413
$ 60,180
$ 16,665
$ 29,970
$ 42,206
$ 54,726$ 65,476
$ 78,463
$ 92,775
$ 115,378
$ 166,017

� growing gap project
earned less than $1,050 that year. The definition of the middle can mean the middle 40% or the middle 60%, the
average or the median. The average (at over $71,000) has been rising much faster than the median since
1997. The median is the mark at which half the families earn more, and half earn less. In 2004, median family earnings were $60,000 in Canada.
The middle 40% earned between $36,000 and $85,000. The middle 60% earned between $23,500 and $102,000 — a span that renders “middle class” almost meaning-less, since the spread between upper and lower middle class is so great.
In after-tax terms, the distributions are more concentrated, and the definitions of rich and poor may be surprising.
In 2004, a family with after-tax income of above $110,000 in Canada was rich. If that doesn’t sound rich to you, 90% of families raising children lived on less. Ninety-five percent of Canadian families with children lived on after-tax incomes of less than $136,000 — a figure that many believe is middle class.
The poorest 10% of families raising children — more than 376,000 households in Canada — lived on less than $23,300, after taxes, in 2004. Half of these families lived on less than $17,500 a year.
The middle class as defined by the middle 40% of the distribution fell into an after-tax income bracket of between $41,200 and $75,900. Defined by the middle 60%, the middle class saw after-tax incomes ranging between $33,600 and $89,700 in 2004, a tighter span than in earnings, but clearly not a solid block of households with similar experiences.
Average after-tax incomes were just over $66,200 in 2004, but rising much more rapidly than the median over the past few years.
The dead centre of the after-tax income distribution for families raising children in 2004 was $57,800. Median incomes have been hovering around $50,000 for most of the period between 1976 and 1997. It has only been since 1998 that they started to rise.
chart 2 Where Do You Belong? Distribution of after-tax incomes for 3.8 million families raising children under 18, 2004
$ 0
$ 20,000
$ 40,000
$ 60,000
$ 80,000
$ 100,000
$ 120,000
$ 140,000
$ 160,000
$ 180,000
Median Average
$ 57,806
Decile 1Up to
$23,300
Decile 2$23,301
to $33,600
Decile 3$33,601
to $41,200
Decile 4$41,201
to $49,800
Decile 5$49,801
to $57,800
Decile 6$57,801
to $66,100
Decile 7$66,101
to $75,900
Decile 8$75,901
to $89,700
Decile 9$89,701
to $110,200
Decile 10Over $110,200
$ 17,574
$ 66,249
$ 29,221$ 37,445
$ 45,454$ 53,814
$ 61,955$ 70,997
$ 81,765
$ 98,101
$ 135,810

�the rich and the rest of us
section three
Canada’s Economy in Context
we have been told for decades that a rising tide will lift all boats — that economic growth will pave the way for greater equality.
In Canada, this is the best of economic times. Over the past decade, Canada’s economy has consistently been firing on all cylinders.
Canadians are producing about $1 trillion more in goods and services a year than they did in 1981. To put this feat in context, a trillion dollars is roughly equivalent to the combined economies of all low-income nations in the world, which repre-sent a total population of about 2.5 billion people.5 Comparatively, Canada is doing remarkably well.
According to the World Bank, Canada’s GDP was the 9th largest economy of 183 nations in the world by 2005, generated by a population that is a fraction the size of the other eight nations.6
Canada’s real economy doubled (93% growth) between 1981 and 2005 (adjusting for inflation). Much of that growth (39%) has occurred in the past decade. Accord-ing to the World Bank, Canada is the fourth best place in the world to do business, just behind Singapore, New Zealand and the United States. 7
Canada’s current economic conditions are similar to conditions almost four dec-ades ago (low inflation, low interest rates, relatively low unemployment, sustained
table 1 Trillion Dollar Baby Canada’s economic growth over a generation and the last decade
Nominal Growth(millions)
Real Growth (millions of constant dollars, 1997) Unemployment Rate
1981 $360,471 $600,253 7.6%
1995 $810,426 $833,456 9.6%
2005 $1,371,425 $1,157,705 6.8%

10 growing gap project
and robust economic growth). The coffers of the nation’s federal and provincial governments are all in surplus mode, an achievement that no other G7 nation (the world’s most established, richest market systems) can boast.
Unemployment is at a 30-year low. More Canadians are working and they’re working harder. Productivity rates keep improving.
This is exactly the kind of situation that has, in our economic past, created the conditions for the gap between rich and poor to get smaller.
There is more economic and fiscal capacity to address just about any social, eco-nomic or environmental ill we could name than at any point in our history.
Yet the income gap between Canada’s rich and poor families grew. It grew faster than at any point since we have been measuring it. And it grew for categorically dif-ferent reasons.
The gap used to be driven by more people falling into the bottom ranks of the poor. Since 1997 the gap has grown because of two new trends: The extraordinary income rise of the richest 10% of families, who are earning more than ever and lit-erally breaking away from the pack; and the fact that there are more rich families compared to a generation ago (using the top 10% of 1980 as the reference point). That should be good news, but it comes with a twist.
Canada very much sees itself as a middle class nation, but the share of income going to the middle class has been shrinking — slowly and steadily. As we shall see, it’s not just the middle that is getting less out of Canada’s growing economy. A fortu-nate few are indeed rising up, but in the absence of widespread gains from prosperity, there is greater polarity in Canadian society than there was a generation ago.
Canadians sense that economic prosperity is largely accruing to the rich8, leav-ing the rest behind. That perception is borne out by these statistics. Though the pie is much bigger, it is not even getting divided into the same (unequal) pieces as a generation ago. The pieces are getting more unequal, with those at the top getting an ever-bigger share of the pie — at the expense of those at the bottom, but, more surprisingly, also at the expense of the majority of Canadian families.

11the rich and the rest of us
section four
Most Canadian Families Get Smaller Share of Income Pie
canada’s economy grew twice in size (in inflation-adjusted terms) over the past 25 years. It grew because millions of workers helped contribute to its growth.
In 1981, the Canadian labour force was 12.2 million people strong. By 2005 there were 17.3 million people in the labour force; 42% more than in 1981.9 The vast major-ity of parents raising children are in the labour market, ever more so over time.
Comparing this generation of families raising children to their predecessors in the late 1970s, the majority of families is getting a smaller share of the pie, even though the economy is stronger and, overall, incomes have started to rise.
chart 3 Top Getting Bigger Share of Earnings; Bottom Half Share is Shrinking Families with Children in Canada (1976–79 compared to 2001–04, averages)
0%
10%
20%
30%
40%
50%
60%
70%
80%
90%
100%
Bottom Half
26.7%
1976–79
20.5%
2001–04
73.3%79.5%
23.2%
29.5%
Top Half Top 10%

12 growing gap project
Average earnings of families raising children were about $60,000 in the late 1970s (in inflation adjusted terms). By the early 2000s average earnings had risen to about $70,000. But averages are not what happen to everyone; in fact, they can mask what’s really going on.
Here’s what’s going on: Between 1976–79, the bottom half of Canada’s families earned 27% of total earnings. Between 2001–04, the bottom half ’s share dropped to 20.5% of total earnings, even though they were working more.
The poorest 20% of Canadian families saw their share of the earnings pie drop from 4.5% from the late 1970s, to 2.6% in the early 2000s. In sharp contrast, the top half of Canadian families saw their share of total earnings grow, from 73% to 79.5% during that same time period.
On the surface, it looks like half of Canadian families are doing better and half are doing worse. Not so. Only the richest 20% of Canadian families saw their share of the economic pie increase. In fact, it was the richest 10% of these families who drove all the change. The richest 10% of Canadian families saw their share of total earnings rise from less than a quarter of the earnings pie (23%) in the late 1970s to almost 30% (29.5%), on average, between 2001–04.
Over the course of almost three decades, the bottom 80% of Canadian families raising children lost ground.10 They had a smaller share of the economy they helped generate — the gains went to the richest 20% of families, mostly to the richest 10%. (See Table 5 in Appendix Two). Are the majority shareholders of the economy get-ting short-changed?
It is often argued that the inequalities occurring naturally in the labour market are offset by Canada’s system of transfers and taxes. They may be offset, but the tax and transfer system did not significantly reverse the trend in reduced shares of in-come for the majority of families. Astoundingly, 80% of Canadian families raising children are taking in a smaller share of the total after-tax income generated by all
chart 4 Rising Share of Earnings Concentrated at Top Families with Children in Canada (1976–79 compared to 2001–04, averages)
0%
5%
10%
15%
20%
25%
30%
35%
1 2 3 4 5
1976–79 2001–04
6 7 8 9 10
0.7
3.8
6.07.5
8.810.0
11.413.1
15.5
23.2
0.32.3
4.36.0
7.79.4
11.113.2
16.3
29.5
1�the rich and the rest of us
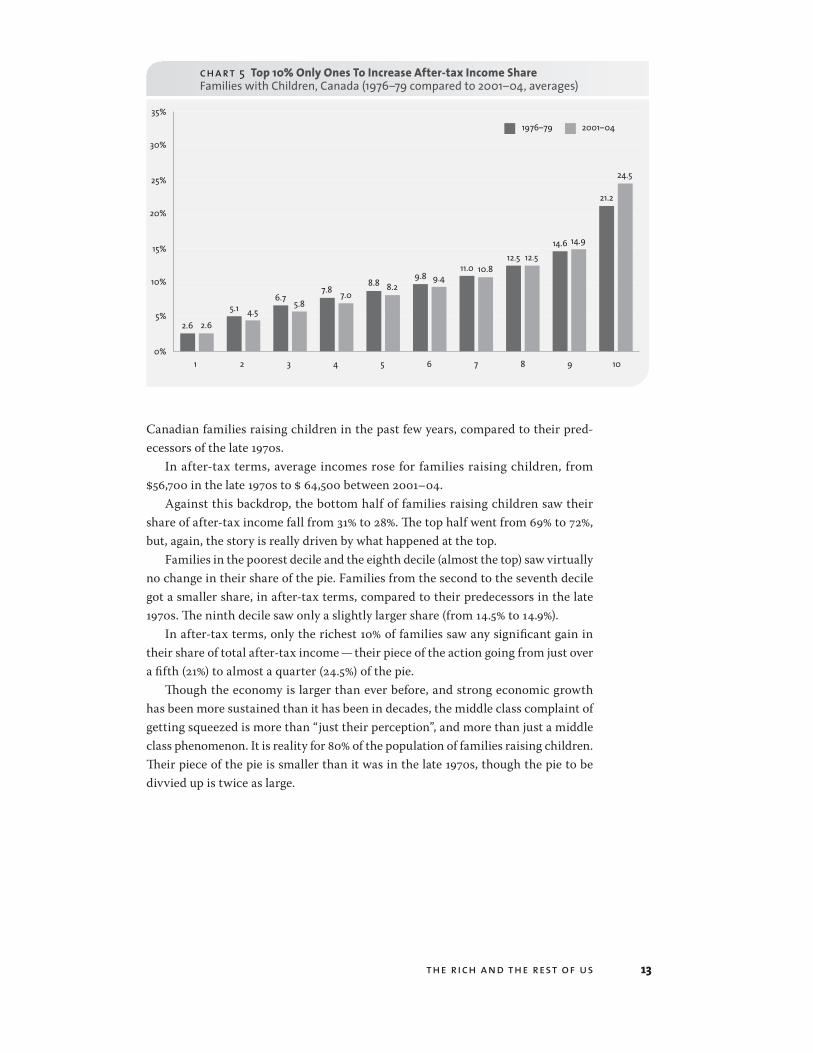
Canadian families raising children in the past few years, compared to their pred-ecessors of the late 1970s.
In after-tax terms, average incomes rose for families raising children, from $56,700 in the late 1970s to $ 64,500 between 2001–04.
Against this backdrop, the bottom half of families raising children saw their share of after-tax income fall from 31% to 28%. The top half went from 69% to 72%, but, again, the story is really driven by what happened at the top.
Families in the poorest decile and the eighth decile (almost the top) saw virtually no change in their share of the pie. Families from the second to the seventh decile got a smaller share, in after-tax terms, compared to their predecessors in the late 1970s. The ninth decile saw only a slightly larger share (from 14.5% to 14.9%).
In after-tax terms, only the richest 10% of families saw any significant gain in their share of total after-tax income — their piece of the action going from just over a fifth (21%) to almost a quarter (24.5%) of the pie.
Though the economy is larger than ever before, and strong economic growth has been more sustained than it has been in decades, the middle class complaint of getting squeezed is more than “just their perception”, and more than just a middle class phenomenon. It is reality for 80% of the population of families raising children. Their piece of the pie is smaller than it was in the late 1970s, though the pie to be divvied up is twice as large.
chart 5 Top 10% Only Ones To Increase After-tax Income Share Families with Children, Canada (1976–79 compared to 2001–04, averages)
0%
5%
10%
15%
20%
25%
30%
35%
1 2 3 4 5
1976–79 2001–04
6 7 8 9 10
2.6
5.16.7
7.88.8
9.811.0
12.514.6
21.2
2.64.5
5.87.0
8.29.4
10.812.5
14.9
24.5

1�the rich and the rest of us
section five
Growing Gap At a 30-Year High
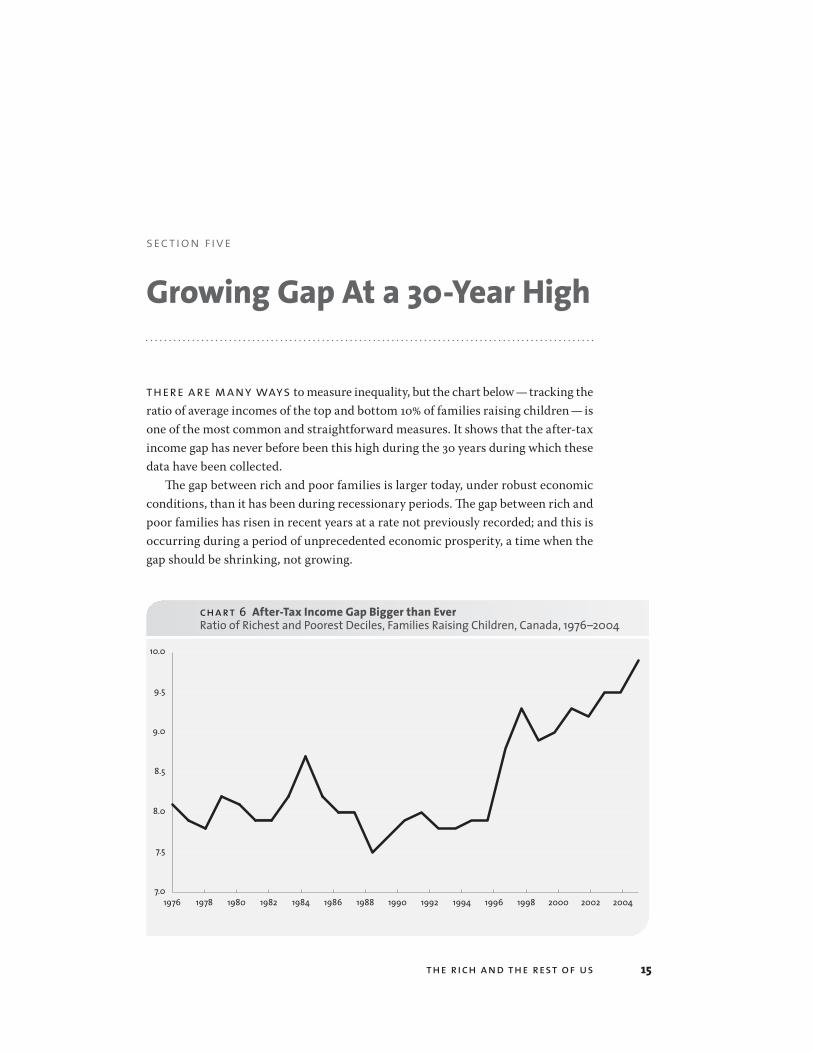
there are many ways to measure inequality, but the chart below — tracking the ratio of average incomes of the top and bottom 10% of families raising children — is one of the most common and straightforward measures. It shows that the after-tax income gap has never before been this high during the 30 years during which these data have been collected.
The gap between rich and poor families is larger today, under robust economic conditions, than it has been during recessionary periods. The gap between rich and poor families has risen in recent years at a rate not previously recorded; and this is occurring during a period of unprecedented economic prosperity, a time when the gap should be shrinking, not growing.
chart 6 After-Tax Income Gap Bigger than Ever Ratio of Richest and Poorest Deciles, Families Raising Children, Canada, 1976–2004
7.0
7.5
8.0
8.5
9.0
9.5
10.0
1976 1978 1980 1982 1984 1986 1988 1990 1992 1994 1996 1998 2000 2002 2004

1� growing gap project
The fact that the after-tax income gap is growing should be of concern. Strong economic conditions and rising employment rates of the working-age population should be pointing to more opportunities for those at the bottom. Government measures to redistribute incomes through taxes and transfers should be further closing the gap. Clearly something is going on.
Is it the tax and transfer system that is failing, or is it the market? This section looks at what we rely on the labour market to provide — earnings.
As Chart 7 shows, changes in the distribution of earnings for Canada’s families raising children have been transformed since 1997, and those changes are transform-ing Canada’s social makeup.
The strength of the economy in the last decade has disproportionately benefited those at the top of the income distribution, though families in every income group are working harder.
chart 7 Richest 10% Breaking Away From the Pack Median Earnings by Decile, Families Raising Children, Canada, 1976–2004
1976 1978 1980 1982 1984 1986 1988 1990 1992 1994 1996 1998 2000 2002 2004
1
2
3
4
5
6
7
8
9
10
0
$ 20,000
$ 40,000
$ 60,000
$ 80,000
$ 100,000
$ 120,000
$ 140,000
$ 160,000
$ 180,000

1�the rich and the rest of us
The gains in earned incomes experienced by the richest 10% of families raising children have created a breakout phenomenon in income distribution in Canada: the rich are breaking away from the rest of society, in a way we have not seen since these data began to be collected in 1976.
In 2004, the average earnings of the richest 10% of Canada’s families raising children was 82 times that earned by the poorest 10% of Canada’s families. That is approaching triple the ratio of 1976, around 31 times. Both years were characterized by strong economic conditions.
The majority in the poorest decile (the poorest 10% of families) was locked out of the labour market for most of the 1980s and 1990s. They bounced back since the late 1990s and their earnings are on the rise but those earnings are far lower for Canada’s poorest families than they were in the late 1970s. (See Tables in Appendix Two.)
In inflation-adjusted terms, the bottom half of Canadian families raising children either earned less or just the same as their predecessors almost 30 years ago. As we shall see in the next section, they are working more — but that is not translating to higher incomes compared to a generation ago.
Families in the top part of the income scale are more likely to have benefited from Canada’s expanding economy. The richest 10% — the group already most bu-oyed by the phase of economic recovery in the 1980s — have seen a dramatic rise in incomes since 1998.
Chart 8 compares the earnings of this generation of families raising children (all deciles) to the earnings of those in the late 1970s, a period when the economy was similarly strong. The relative change by income class is striking.
Those already at the top saw the biggest gain — a 30% increase for those in the rich-est decile today, compared to the earnings of the richest group in the late 1970s.
In terms of sheer scope of impact, the surprising finding is that families in the bottom half of the income scale are not back to where they were during a similarly
chart 8 Earnings Falling for Bottom Half Percent Change in Median Annual Earnings, comparing 1976–79 to 2001–04, by Decile, Families Raising Children, Canada
-100%
-80%
-60%
-40%
-20%
0%
20%
40%
1 2 3 4 5 6 7 8 9 10

1� growing gap project
strong labour market. In fact they are worse off than their predecessors were a gen-eration ago.
Despite massive changes in the labour market in the intervening period, both the late 1970s and the early years of the new millennium are marked by low unem-ployment rates. More people are working — and they’re working more — now than in the 1980s and 1990s. But, as the next section shows, working harder isn’t enough for the bottom half of Canadian families.

1�the rich and the rest of us
section six
Working More Isn’t Enough
for most of the last 30 years income inequality trends have been driven primarily by what is happening at the bottom of the income spectrum.
While recessions affect most people in an economy, a downturn typically hits those in the bottom half of an income distribution harder than those at the top.
So it follows that the rich/poor gap grows during a recession because there are more people thrown out of work or more people losing hours of work. When good economic times return, and more opportunities to work are available, more people in the poorest 10% find work and, typically, the gap narrows.
This pattern changed dramatically after the mid-1990s. These days, during the best of economic times, the gap is being driven by the ex-
treme gains the market is delivering to the richest 10% in what appears to be a self-perpetuating cycle. The richer the family, the richer that family is becoming.
It is tempting to think they are doing something different — working harder, do-ing more to earn more. Indeed, traditionally the richest 10% of Canadian families with children have put in the highest number of work weeks. Not so today. As Chart 9 shows, while everyone else is pouring more of their time into the labour market, the richest 10% of Canadian families are actually contributing less time in the labour market than they were a generation ago. And families in the ninth and eighth deciles are converging with the tenth decile with respect to how much time the average fam-ily in these income groupings are putting into the labour market.11
It could be argued that more weeks worked does not necessarily mean more hours worked, given the rise in part-time and contingent work in the past three decades.
The data source for hours of work only goes back to 1996, but the trend lines are similar: people are spending more time at their paid jobs, including families raising children. The average Canadian household with children is clocking in almost 200 hours more compared to just nine years ago.12
The overall trend is that most families are putting in more work weeks, and most families are putting in longer hours. Almost all Canadian families are putting more time into the labour market than they did in 1996, with one notable exception: the richest 10% of families.

20 growing gap project
Chart 10 shows that the average annual hours worked for those in the poorest 10% of families has risen to about 1,500 hours a year, higher in 2004 than in any oth-er year in the time period. These data are only available since 1996. Families in the second to poorest decile have added a staggering 800 hours a year, on average, since 1996 — from about 1,500 hours to about 2,300 hours a year. By 2004 families in the middle of the spectrum, deciles 4 to 8, were putting in roughly 200–250 more hours than in 1996, the equivalent of between five and six additional weeks of full-time work per household. The richest 10% of families, on average, put in 10 more hours in 2004 than 1996, but 110 hours less than in 2001. Year by year variation makes it hard to say whether they unequivocally worked fewer or the same number of hours over this nine-year period; but it is clear that they are not working more over time.
chart 9 All But Richest 10% Working More Average Annual Weeks Worked, Families Raising Children, by Decile, Canada, 1976–2004
1976 1978 1980 1982 1984 1986 1988 1990 1992 1994 1996 1998 2000 2002 2004
1
2
3
4
5
67
8
910
0
20
40
60
80
100
120
140

21the rich and the rest of us
are families economically better off for working more?
Despite the fact that families in every income category but the richest 10% are putting more time into the labour market than a generation before — more than even a dec-ade ago — the only real income gains have accrued to those who have not worked more: the richest 10% of Canadian families.
chart 10 Canadian Families Working Longer Since 1996 Average Annual Hours Worked, Families Raising Children, Canada, 1996–2004
3,000
3,050
3,100
3,150
3,200
3,250
3,300
1996 19981997 1999 2000 2001 2002 2003 2004
table 2 Canadian Families Working Longer Since 1996 Average Annual Hours Worked, Families Raising Children, by Decile, Canada, 1996–2004
Decile 1996 1997 1998 1999 2000 2001 2002 2003 2004
1 1,439 948 1,075 996 1,121 1,365 1,315 1,265 1,529
2 1,478 1,470 1,725 1,820 2,106 2,151 1,981 2,119 2,322
3 2,522 2,445 2,398 2,468 2,629 2,678 2,610 2,532 2,535
4 2,732 2,833 2,862 2,897 2,915 2,951 2,842 2,902 2,941
5 2,955 2,946 3,118 2,998 3,175 3,229 3,192 3,133 3,162
6 3,158 3,166 3,216 3,241 3,230 3,535 3,266 3,370 3,400
7 3,298 3,467 3,494 3,459 3,569 3,605 3,534 3,568 3,548
8 3,580 3,642 3,676 3,562 3,804 3,829 3,748 3,809 3,782
9 3,896 3,786 3,946 3,898 3,883 4,032 3,908 3,911 4,049
10 4,063 4,107 3,984 3,974 4,093 4,184 4,058 4,119 4,074
Average 3,065 3,053 3,099 3,075 3,171 3,262 3,155 3,179 3,225

22 growing gap project
Median earnings for the richest 10% of families raising children averaged around $122,000 between 1976 and 1986. Between 1987 and 1997 they averaged $133,000. Since 1998, median incomes for the richest 10% have grown much more rapidly, av-eraging $161,000 between 2001–04, but showing no signs of slowing down in the rate of increase. Meanwhile their average weeks of work have held steady at around 114 weeks a year per household, about six weeks a year less compared to a genera-tion ago.
Though they are working slightly less, the richest 10% of families are earning $40,000 more compared to a generation ago (in inflation-adjusted terms). That’s a 30% increase, in real terms, since the late 1970s. No other category of families has seen gains even remotely similar to the top. And though they are clearly putting a lot of time into their jobs, they are not working more compared to a generation ago. In fact they are working less.
Meanwhile, the rest of Canadian families are increasing their paid work time. For hundreds of thousands of households raising children, they are more “attached” to the workforce than their predecessors were in the late 1970s, but their incomes are lower today than they were a generation ago.
Even in the late 1970s, most families raising children had more than one worker in the labour market. But only the top two deciles clearly had two full-year workers in the 1970s. Today, about half of Canadian families depend on two full-year work-ers, and the bottom half of families is catching up rapidly to the top half in terms of work effort. Yet the bottom half is putting more time in the labour market and getting less out.
table 3 Working Harder is Not Paying Off For Most Families With Kids Percentage change in average annual weeks worked and earnings comparing 1976–79 and 2001–04
Average Annual Weeks Worked*
Decile 1976–1979 2001–2004Average
Difference % Change% Change in
Annual Earnings
1 39 45 6 15% -85%
2 60 64 4 7% -31%
3 66 74 9 14% -17%
4 69 82 12 18% -8%
5 75 90 15 20% 2%
6 79 96 17 21% 8%
7 85 100 14 17% 13%
8 94 108 14 15% 17%
9 103 113 9 9% 22%
10 120 114 -6 -5% 30%
Average 81 91 11 13% 5%

2�the rich and the rest of us
The data in the above chart suggest rates of pay may play an important role in this story but the SCF/SLID data source does not provide that kind of detail. It could be that the work of some occupations simply commands higher wages today than a generation ago, while other work has been devalued. It could also be a shift in the way the labour market values younger workers (and older) workers, with younger workers being offered lower rates of pay than their counterparts in the late 1970s, in inflation adjusted terms.
Whatever the case, the majority of Canadian families raising children have had to invest more of their most precious resource — time — into the labour market sim-ply to stay afloat, if not get ahead.
While at any point in time the key to greater income is more work, over time it appears that families raising children are faced with a predicament. The data show that if they work more, their incomes may not necessarily grow. If they don’t work more, their incomes will likely fall even further behind. But there is a limit to how much more they can work. Families in the bottom of the income scale are putting more time into the labour market, with more families dependent on two full-year workers. At some point there is no more “reserve” time to throw at the problem. How will family incomes be kept afloat then? And what happens if there is a downturn in the economy and unemployment rates go up?


2�the rich and the rest of us
section seven
What Can Government Do?
any examination of income distribution cannot end with a look at earnings alone. The role of government taxes and transfers has traditionally made a difference in narrowing Canada’s gap between the rich and the rest of us. This section examines the impact of taxes and transfers on income inequality over the past 30 years.
One of the key roles of government is its redistributive function. Taxes collected by governments raise the resources to guide defence and trade strategies, and pro-vide systems of justice, infrastructure and social supports. Taxes are also typically used to finance income supports to those who find themselves outside the labour market for reasons of unemployment, illness, injury, or retirement. Most nations
table 4 Bottom Half Losing Ground Percent Change in Median After-Tax Incomes, comparing 1976–79 to 2001–04, by Decile, Families Raising Children, Canada
DecileAverage
1976–1979Average
2001–2004Dollar change from
boom to boom% Change from boom to boom
1 $15,979 $17,222 $1,244 8%
2 $29,289 $29,095 $(194) -1%
3 $37,973 $37,275 $(698) -2%
4 $44,272 $44,927 $655 1%
5 $49,665 $53,006 $3,340 7%
6 $55,529 $60,921 $5,392 10%
7 $62,082 $69,390 $7,308 12%
8 $70,496 $80,179 $9,683 14%
9 $82,114 $95,456 $13,342 16%
10 $108,446 $131,082 $22,636 21%
Median $52,554 $56,976 $4,422 8%

2� growing gap project
also help support families with the costs of raising children, to ensure all children can put their best foot forward.
It could easily be argued that the various income elements of Canada’s redis-tributive function have been weakened in the past decade, resulting in an after-tax income gap that looks a lot like the earnings gap.
The weakening of Canada’s redistributive function has occurred through cuts to transfers which used to primarily benefit the poor, and cuts to taxes, a policy whose benefits primarily benefit the rich.
In fact, the system may be weakened, but this study finds Canada’s system of taxes and transfers made a positive difference in the incomes of families raising children over the past three decades, including the most recent 10 years.
In after-tax income terms, the poorest 10% of Canadian families raising children are doing better compared to a generation ago — but not by much. The improvement hardly amounts to another $100 a month, in inflation-adjusted terms. That extra $100 is stretched beyond limits by the increased costs of rent and housing, which have risen far more rapidly than inflation in all Canadian cities.
Compared to a generation ago, after-tax incomes of families in the next three poorest groups barely stayed in the place. Though they are working more than their predecessors, they are earning less, even in after-tax terms. The only thing that pre-vented their fortunes from falling even further was government transfers.
Families in the middle saw modest progress, primarily driven by earnings, which in turn was primarily driven by putting more time into the labour market than a generation before. They worked more so they earned more. But only a small amount more. Nothing compared to what is happening at the top.
Towards the top of the distribution, the powerful earnings increases are tem-pered in after-tax terms, but taxation did not change the fact that those already the best off experienced the biggest gains.
chart 11 Government Transfers, Not Tax Cuts, Made the Difference for the Bottom Half Percent Change in Earned, Total and After-Tax Incomes, comparing 1976–79 to 2001–04, by Decile, Families Raising Children, Canada
-100%
-80%
-60%
-40%
-20%
0%
20%
40%
1 2 3 4 5 6 7 8 9 10
After Tax IncomeTotal Income (Including Transfers)Earnings
2�the rich and the rest of us
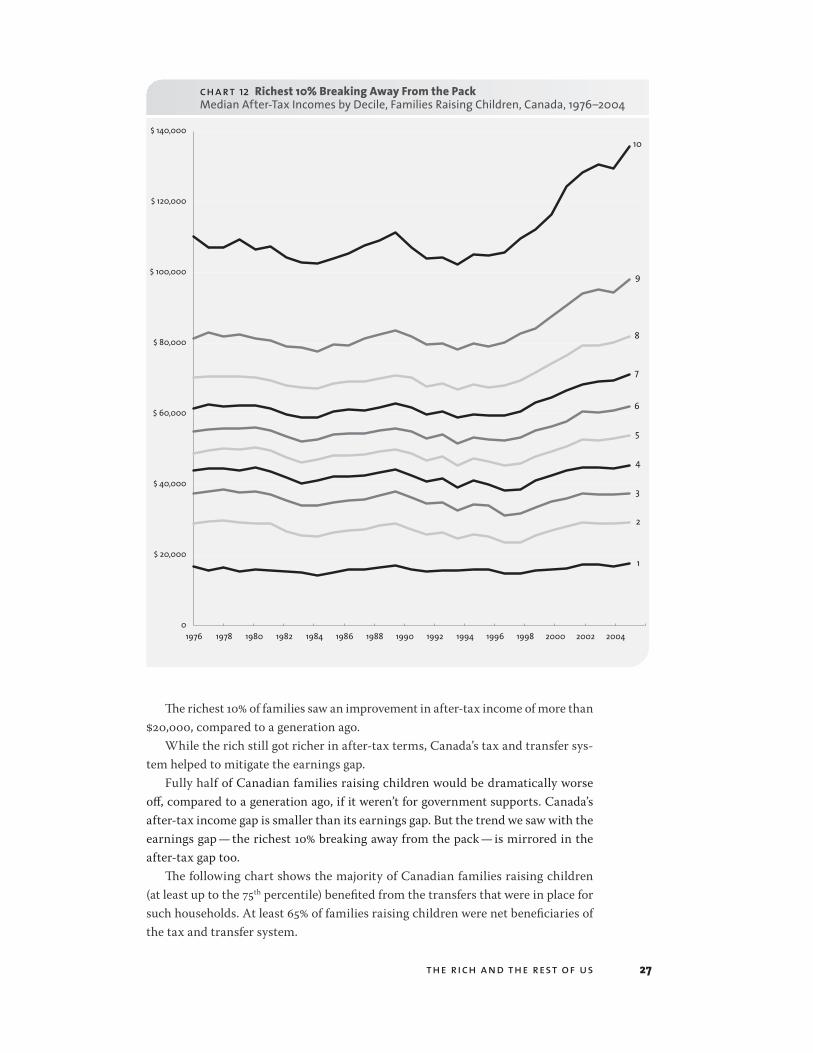
The richest 10% of families saw an improvement in after-tax income of more than $20,000, compared to a generation ago.
While the rich still got richer in after-tax terms, Canada’s tax and transfer sys-tem helped to mitigate the earnings gap.
Fully half of Canadian families raising children would be dramatically worse off, compared to a generation ago, if it weren’t for government supports. Canada’s after-tax income gap is smaller than its earnings gap. But the trend we saw with the earnings gap — the richest 10% breaking away from the pack — is mirrored in the after-tax gap too.
The following chart shows the majority of Canadian families raising children (at least up to the 75th percentile) benefited from the transfers that were in place for such households. At least 65% of families raising children were net beneficiaries of the tax and transfer system.
chart 12 Richest 10% Breaking Away From the Pack Median After-Tax Incomes by Decile, Families Raising Children, Canada, 1976–2004
1976 1978 1980 1982 1984 1986 1988 1990 1992 1994 1996 1998 2000 2002 2004
1
2
3
4
5
6
7
8
9
10
0
$ 20,000
$ 40,000
$ 60,000
$ 80,000
$ 100,000
$ 120,000
$ 140,000

2� growing gap project
Despite a decade of emphasis on how much Canadian governments can do for working families by cutting taxes, the bigger benefit to families came through income supports (transfers). That finding begs the question — which transfers?
Since the late 1970s, unemployment insurance and social assistance have been scaled back. Workers’ compensation has not substantially increased. There are new transfers for families at the very bottom of the income spectrum in the form of re-fundable GST tax credits. But the impact of the GST credit does not reach very high up in the income spectrum.
The biggest change that has taken place over the course of the generation has been the conversion of universal family allowances to a targeted Canada Child Tax Benefit. The CCTB started in 1993, but has been enhanced regularly since 1998. In 2005 it was about a $9 billion a year program.13
So the thing that has made the biggest difference for families at the bottom end of the income spectrum — the thing that prevented the free fall of half of Canadian families — has been a federal transfer payment in support of families raising chil-dren.
Even so, governments only offset — they did not reverse — the phenomenon where rich families raising children are breaking away from the pack.
The breaking away of Canada’s richest 10% of families represents a new phenom-enon at play, not seen in this generation. From 1976 to 1996 the fortunes of families raising children rose and fell during recessions and recoveries, roughly in step with one another. No single income group broke away from the rest.
But after the mid-1990s, while most families experienced some improvement after the prolonged impact of the 1991–92 recession, only the richer half of families saw any clear advance compared to the previous 20 years. Of these, families at the very top saw the greatest gains, at a rate of increase not witnessed before in these data. It has been suggested that the trends are being driven by not just the top 5%, but the top 1% in the income distribution; that the action is happening at the extreme top; that this era mirrors the excesses of the 1920s.14 The SCF/SLID data cannot provide that level of detail. But examples of extreme contrasts in how the market values workers abound in Canada.
The story of Canada’s top CEOs and the average worker provides an illustration. Since 1998 Canada’s top 100 CEOs saw a 262% increase in compensation, pocketing an average of $9.1 million in 2005 compared to $3.5 million in 1998. Meanwhile, the average Canadian worker made just over $38,000 in a year, a 15% increase over the average earnings of 1998 (just over $33,000). CPI increased by 17.85% in that same period meaning that, after adjusting earnings for inflation, the average worker ac-tually lost purchasing power.15
Those changes suggest another problem. In 1998, the country’s top executives were worth, on average, 106 times the average worker. By 2005 — only seven years later — they were worth 240 times as much. The payoff from this period of sustained prosperity has accrued mostly to those already most affluent. Hardly a sustainable trajectory, economically or socially.

2�the rich and the rest of us
Conclusion
over the past two decades a social experiment has unfolded in Canada: governments have actively pursued policies that support market dynamics and will-ingly decreased their role as a buffer against markets, particularly for the econom-ically vulnerable.
These data underscore how critical the buffer role of governments has remained in ensuring the well-being of all Canadian families.
At a time when some prefer to cast doubt about the role of the federal govern-ment in binding the destinies of our many diverse parts together, these data also underscore the importance of the existence of a strong federal program that supports families raising children — all families, throughout the income spectrum.
Some claim that insufficiency, not inequality, is the real issue to be confronted. Persistent poverty next to seemingly endless abundance is an affront, to be sure. But we learn something from looking at the trends in income distribution that we cannot perceive by focusing on solely poverty (insufficiency) as though it has no context.
When we look at the whole continuum of Canadian family incomes, we see a dynamic that is bigger than individual luck or success, lack of training, or effort, or motivation. We see how Canadian families are all engaged and interrelated in an economic system that is failing the majority while disproportionately benefiting a select few.
Canadian families are playing by the rules, getting better educated, delaying or dismissing the demands of family formation, working harder. And the best the ma-jority gets out of the deal is to stay in place, economically?
At any given point in time, working more should yield more income. Over time we see that families raising children did exactly that, worked more than ever before. But the additional weeks and hours put into the labour market by today’s families raising children are not paying off in terms of increased (inflation-adjusted) house-hold earnings for at least the bottom half of these families compared to the genera-tion of families raising children in the late 1970s.

�0 growing gap project
A smaller share going to the majority of families raises questions about the di-rection in which the country is headed, and whether this trend is sustainable, let alone desirable.
Again, these are the best of economic times, not a recessionary period. This raises a red flag: there are only 24 hours in every day, 7 days in every week, no matter how rich or poor we are. The very real and finite limitation faced by every family and in-dividual is time. Working more is literally a time-limited option for getting ahead. It is not a sustainable response to falling real incomes.
Rates of pay, not amounts of work, are driving two very troublesome new trends in Canada: Greater inequality (the growing gap) and greater polarization (the grow-ing distance between minority haves vs. the majority have nots) are being driven by one phenomenon: the economic gains of this period are accruing disproportionately to the richest 10% of Canadian families. Their incomes gains are disproportionate to their share of the population. And their income gains are also disproportionate to their work effort.
No matter how it is measured, by earnings or by after-tax dollars, the gap between Canada’s richest families and its poorest families is growing — though we were told the economic conditions we are currently enjoying would help close the gap.
The numbers in this report — the definition of the richest 10% of families raising children being those earning $131,200 or more in 2004 — don’t sound like we are talking about the rarified world of the super-rich, as seen on TV. And they are not. This is not the story of the Donald Trumps of this world.
This study lays out a portrait of what is going on in our midst, among us — not out there, happening to someone else. And it unearths a disturbing trend of increas-ing inequality and polarization in the midst of tremendous affluence.
This study also shows these trends affect us all, no matter where we sit on the income spectrum. It’s not just that the rich are getting richer and there are more of them. It’s not just that the middle class is getting a smaller share of a bigger eco-nomic pie. It’s not just that Canada’s bottom half of families have been shut out of most of the economic gains. It’s not just that Canada’s poorest families appear to be stuck in time, regardless of their increased work effort. It’s not just that every category of Canadian family — except the richest 10% — is working harder for their money. It’s that all of this is changing the nature of Canadian society in new and unforeseen ways.
In every respect the story reported in this study is based on the most conserva-tive estimates of a growing gap. And yet Canada’s gap is growing and it is growing quickly, at a time when it should be getting smaller.
In the dawning days of the new century it is a story about the rise of the affluent and the stagnation of the poor. Almost two million Canadian families (1.9 million) raising children would be worse off than their counterparts in the late 1970s without government intervention — despite the fact that they are working more than their predecessors. Three quarters of a million families are still worse off compared to families in the late 1970s, even with more targeted income support and more time in the labour market.
Greater inequality isn’t just a statistic or a fact.

�1the rich and the rest of us
The rich are getting richer, the poor aren’t going anywhere and there are fewer people in the middle to mediate the two extremes. We ignore these trends at our collective peril.
When you see that pattern repeat itself between neighbourhoods, regions, and nations, you know that inequality has become to social and economic life what cli-mate change has become to our physical world. The trendlines in both cases are unsustainable.
An intractable growing gap between rich and poor, in good times and bad, ob-livious to work effort, is akin to the slowly building impact of climate change — a clarion call for action which, ultimately, cannot be ignored.
And, like climate change, we will continue to see rising inequality until we un-derstand our connectivity to each other and to our environment.


��the rich and the rest of us
Appendix One
this study examines incomes for families raising children under 18 in Cana-da, and the work required to generate those incomes.
It looks at the differences between two periods of strong economic growth, (1976–1979 and 2001–2004) and what happened in between.
Families with children under 18 have consistently displayed the most stable and least unequal distribution of incomes over time among all Canadian households.
This work examines trends in incomes, by decile, which slices any given popu-lation into ten equally sized segments, ranked by income in order from poorest (1) to richest (10).
We examine data from 1976 to 2004, the longest available period with compara-ble annual microdata files, using both the Survey of Consumer Finance (SCF) and Survey of Labour Income Dynamics (SLID) data.
SCF was Statistics Canada survey tool for collecting cross-sectional data on in-come from 1976 to 1996. In 1996 SCF was replaced by the SLID survey, which collects longitudinal data on panels of respondents over a course of years. SLID data is used in this analysis from 1996 to the most recently available year, 2004.
These two different household surveys have methodological differences which can result in discrepancies between estimates obtained for the two series, for sub-national populations or variables with lower sample reporting (like deciles in smaller provinces). Some charts show a spike upwards in 1996, which could be driven by the change to the underlying survey as well as the particular economic conditions of 1996.
Care has been taken to ensure that variability in levels between the two series do not affect the interpretation of trends. That said, wherever numbers (not trends) are compared before and after 1996 for individual deciles, there may be some slight variability.
This analysis focuses on median incomes in each decile. Medians are the half-way point of any group of observations, a measure which shows less variability than average incomes over time because average incomes are so influenced by what is happening at the top and bottom ends of a distribution. Medians rather than aver-

�� growing gap project
ages were used throughout, since they tend to be less variable than averages, and can help establish more solid trends.
The only use of average data is to measure the gap between rich and poor, since median data in the 1st and 10th decile are, effectively, comparing the fifth and 95th percentiles. The average is a more appropriate measure to speak of differences be-tween the two most extreme groups in society, the richest and the poorest 10% of the population under study — in this case, families raising children under 18.
The data set permits us to look at five different definitions of income — earnings (from wages and salaries, plus self-employment), returns on investment, market in-come (all forms of income that do not flow from government transfers), total income (market plus government transfers, like unemployment insurance benefits, social assistance, workers’ compensation, GST tax credit, child benefits and pensions), and after-tax income (which subtracts federal and provincial income taxes).
The purchased data set also permits us to examine working time, through weeks of work (since 1976) and hours of work (since 1996). Working time data is self-re-ported and generally incorporates vacation time.
Earnings data typically includes incomes that are negative due to investment losses and losses in one’s self-employed business. It is important that these records be kept in the analysis because of the increasing role of self-employment in the Ca-nadian labour market. All negative values for these records have been set to zero to avoid skewing the results in the bottom decile and make the gap and other measures of inequality further pronounced.
All income and work time data are from unpublished custom tabulations from Statistics Canada, based on the SCF/SLID surveys. All income figures cited in this document are inflation adjusted to 2004.

��the rich and the rest of us
Appendix Two

�� growing gap project
table 1 Median Annual Earnings by Decile (in 2004$) for Families With Children Under 18, Canada, 1976–2004
1976 1977 1978 1979 1980 1981 1982 1983
Decile 1* $3,358 $1,665 $992 $2,094 $951 $1,386 $- $-
Decile 2 $23,509 $22,970 $22,508 $23,784 $21,631 $22,049 $17,129 $16,229
Decile 3 $35,902 $35,527 $34,785 $36,223 $34,755 $34,389 $29,767 $28,790
Decile 4 $44,987 $44,791 $44,367 $45,257 $44,473 $43,367 $39,193 $38,859
Decile 5 $52,601 $52,033 $51,780 $52,866 $52,313 $51,499 $47,512 $46,883
Decile 6 $60,453 $59,359 $59,534 $60,496 $59,818 $59,032 $55,486 $54,546
Decile 7 $67,842 $67,515 $67,433 $68,394 $67,993 $67,474 $64,336 $63,862
Decile 8 $78,925 $78,277 $76,918 $78,529 $78,203 $77,239 $74,857 $74,291
Decile 9 $92,654 $92,297 $91,152 $92,557 $91,776 $91,368 $88,991 $89,151
Decile 10 $126,279 $121,485 $122,511 $124,862 $120,018 $121,029 $118,511 $121,053
Median $55,845 $55,687 $55,727 $56,693 $56,455 $55,222 $51,485 $50,902
Average $61,341 $59,030 $58,691 $59,887 $58,866 $58,345 $54,965 $54,877
1984 1985 1986 1987 1988 1989 1990 1991
Decile 1* $- $- $- $- $353 $770 $- $-
Decile 2 $15,035 $17,102 $17,549 $18,577 $19,591 $20,469 $16,711 $14,201
Decile 3 $28,267 $30,324 $31,032 $32,180 $33,423 $33,578 $31,117 $27,450
Decile 4 $38,671 $40,729 $41,480 $43,113 $43,388 $44,408 $42,242 $38,645
Decile 5 $47,697 $49,840 $50,946 $51,980 $52,896 $53,515 $52,102 $48,702
Decile 6 $56,001 $58,094 $59,116 $61,066 $62,188 $62,177 $61,752 $58,189
Decile 7 $64,799 $66,890 $68,155 $70,251 $71,998 $71,540 $71,397 $68,430
Decile 8 $74,513 $77,837 $79,642 $80,296 $83,038 $83,902 $82,800 $80,208
Decile 9 $89,259 $92,146 $93,330 $96,180 $98,579 $99,400 $99,127 $95,345
Decile 10 $120,625 $122,635 $123,606 129,907 $133,701 $134,714 $133,548 $129,650
Median $51,845 $53,669 $55,272 $56,604 $57,896 $57,684 $57,074 $53,395
Average $55,194 $57,069 $58,329 $60,414 $61,605 $62,835 $60,760 $58,233
* $– means there were no reported earnings at the median for Decile 1
��the rich and the rest of us
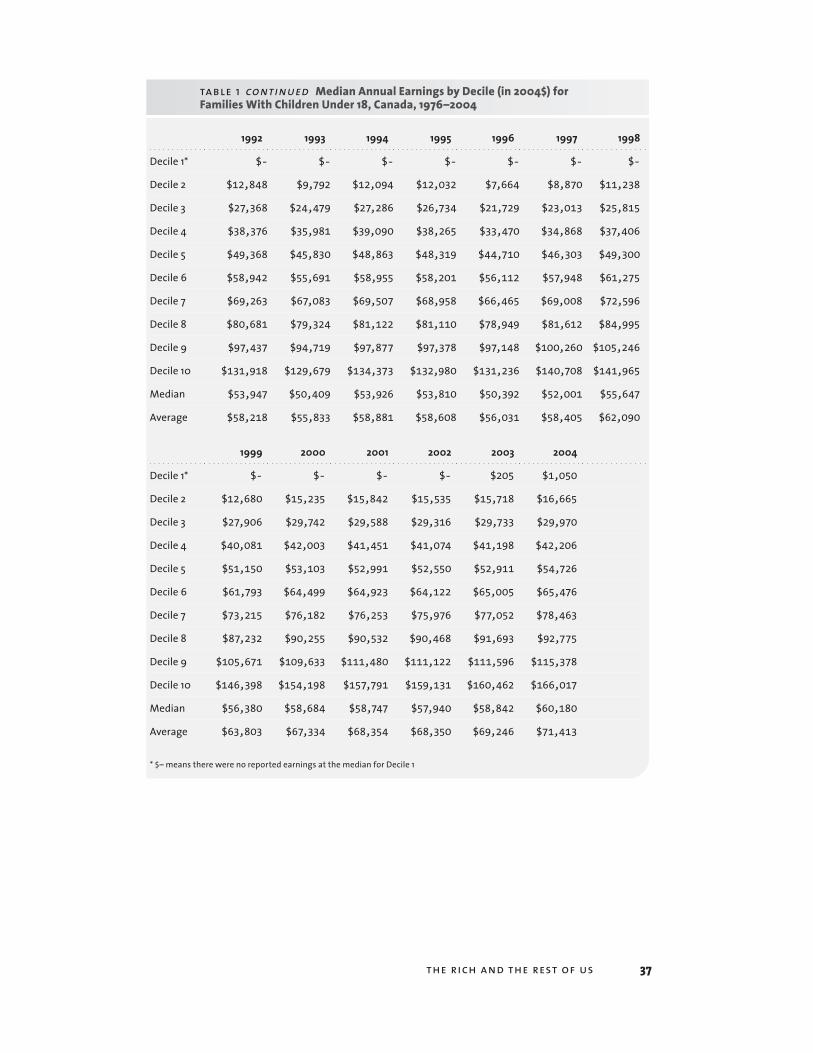
table 1 continued Median Annual Earnings by Decile (in 2004$) for Families With Children Under 18, Canada, 1976–2004
1992 1993 1994 1995 1996 1997 1998
Decile 1* $- $- $- $- $- $- $-
Decile 2 $12,848 $9,792 $12,094 $12,032 $7,664 $8,870 $11,238
Decile 3 $27,368 $24,479 $27,286 $26,734 $21,729 $23,013 $25,815
Decile 4 $38,376 $35,981 $39,090 $38,265 $33,470 $34,868 $37,406
Decile 5 $49,368 $45,830 $48,863 $48,319 $44,710 $46,303 $49,300
Decile 6 $58,942 $55,691 $58,955 $58,201 $56,112 $57,948 $61,275
Decile 7 $69,263 $67,083 $69,507 $68,958 $66,465 $69,008 $72,596
Decile 8 $80,681 $79,324 $81,122 $81,110 $78,949 $81,612 $84,995
Decile 9 $97,437 $94,719 $97,877 $97,378 $97,148 $100,260 $105,246
Decile 10 $131,918 $129,679 $134,373 $132,980 $131,236 $140,708 $141,965
Median $53,947 $50,409 $53,926 $53,810 $50,392 $52,001 $55,647
Average $58,218 $55,833 $58,881 $58,608 $56,031 $58,405 $62,090
1999 2000 2001 2002 2003 2004
Decile 1* $- $- $- $- $205 $1,050
Decile 2 $12,680 $15,235 $15,842 $15,535 $15,718 $16,665
Decile 3 $27,906 $29,742 $29,588 $29,316 $29,733 $29,970
Decile 4 $40,081 $42,003 $41,451 $41,074 $41,198 $42,206
Decile 5 $51,150 $53,103 $52,991 $52,550 $52,911 $54,726
Decile 6 $61,793 $64,499 $64,923 $64,122 $65,005 $65,476
Decile 7 $73,215 $76,182 $76,253 $75,976 $77,052 $78,463
Decile 8 $87,232 $90,255 $90,532 $90,468 $91,693 $92,775
Decile 9 $105,671 $109,633 $111,480 $111,122 $111,596 $115,378
Decile 10 $146,398 $154,198 $157,791 $159,131 $160,462 $166,017
Median $56,380 $58,684 $58,747 $57,940 $58,842 $60,180
Average $63,803 $67,334 $68,354 $68,350 $69,246 $71,413
* $– means there were no reported earnings at the median for Decile 1

�� growing gap project
table 2 Median Annual After-Tax Incomes by Decile (in 2004$) for Families With Children Under 18, Canada, 1976–2004
1976 1977 1978 1979 1980 1981 1982 1983
Decile 1 $16,628 $15,656 $16,369 $15,261 $15,963 $15,665 $15,360 $14,966
Decile 2 $28,873 $29,452 $29,724 $29,108 $28,803 $28,931 $26,530 $25,605
Decile 3 $37,558 $38,096 $38,597 $37,639 $37,925 $37,281 $35,436 $33,934
Decile 4 $43,956 $44,457 $44,610 $44,065 $44,713 $43,665 $41,887 $40,265
Decile 5 $48,829 $49,722 $50,174 $49,937 $50,589 $49,584 $47,506 $46,244
Decile 6 $54,911 $55,547 $55,750 $55,908 $56,175 $55,146 $53,500 $52,197
Decile 7 $61,444 $62,543 $62,009 $62,331 $62,312 $61,557 $59,905 $59,051
Decile 8 $70,303 $70,695 $70,545 $70,441 $70,406 $69,550 $67,973 $67,573
Decile 9 $81,232 $82,903 $81,993 $82,330 $81,180 $80,721 $79,112 $78,680
Decile 10 $110,219 $107,193 $107,070 $109,300 $106,419 $107,420 $104,191 $102,781
Median $51,721 $52,746 $52,832 $52,916 $53,003 $52,273 $50,575 $49,066
Average $57,158 $56,351 $56,790 $56,488 $56,569 $55,887 $54,184 $53,353
1984 1985 1986 1987 1988 1989 1990 1991
Decile 1 $14,150 $14,992 $15,841 $15,909 $16,502 $16,930 $15,930 $15,256
Decile 2 $25,252 $26,424 $26,873 $27,174 $28,411 $28,825 $27,156 $25,938
Decile 3 $34,064 $34,813 $35,352 $35,686 $36,770 $37,860 $36,238 $34,534
Decile 4 $41,090 $42,241 $42,235 $42,489 $43,319 $44,106 $42,656 $40,888
Decile 5 $47,078 $48,082 $48,269 $48,429 $49,337 $49,830 $48,629 $46,846
Decile 6 $52,814 $54,038 $54,400 $54,307 $55,259 $55,882 $55,080 $52,921
Decile 7 $59,041 $60,634 $61,100 $61,052 $61,915 $62,910 $61,898 $59,778
Decile 8 $67,154 $68,708 $69,072 $69,090 $70,010 $70,945 $70,253 $67,742
Decile 9 $77,760 $79,511 $79,439 $81,251 $82,490 $83,637 $81,863 $79,706
Decile 10 $102,518 $104,026 $105,291 $107,569 $109,101 $111,241 $107,135 $104,080
Median $49,968 $51,086 $51,338 $51,343 $52,333 $52,752 $51,850 $49,702
Average $53,441 $54,555 $55,049 $55,474 $56,217 $57,626 $55,657 $53,987

��the rich and the rest of us
table 2 continued Median Annual After-Tax Incomes by Decile (in 2004$) for Families With Children Under 18, Canada, 1976–2004
1992 1993 1994 1995 1996 1997 1998
Decile 1 $15,650 $15,559 $15,779 $15,794 $14,774 $14,704 $15,516
Decile 2 $26,241 $24,656 $25,785 $25,179 $23,547 $23,639 $25,582
Decile 3 $34,756 $32,632 $34,186 $34,088 $31,309 $31,866 $33,567
Decile 4 $41,631 $39,240 $41,043 $40,088 $38,240 $38,576 $41,012
Decile 5 $47,931 $45,226 $47,266 $46,538 $45,405 $45,793 $47,847
Decile 6 $54,018 $51,724 $53,169 $52,827 $52,532 $53,152 $55,338
Decile 7 $60,604 $58,853 $59,915 $59,504 $59,380 $60,770 $63,202
Decile 8 $68,449 $66,940 $68,287 $67,578 $67,901 $69,326 $71,554
Decile 9 $79,952 $78,198 $79,875 $79,109 $80,102 $82,798 $84,104
Decile 10 $104,177 $102,358 $104,997 $104,787 $105,550 $109,514 $112,326
Median $50,751 $48,282 $50,302 $49,651 $48,892 $49,328 $51,415
Average $54,305 $52,720 $54,083 $53,745 $53,313 $54,558 $56,679
1999 2000 2001 2002 2003 2004
Decile 1 $15,826 $16,220 $17,212 $17,231 $16,871 $17,574
Decile 2 $26,979 $27,944 $29,259 $28,848 $29,054 $29,221
Decile 3 $35,052 $35,981 $37,476 $37,026 $37,151 $37,445
Decile 4 $42,443 $43,798 $44,907 $44,724 $44,623 $45,454
Decile 5 $49,371 $50,715 $52,805 $52,403 $53,000 $53,814
Decile 6 $56,513 $57,936 $60,577 $60,273 $60,879 $61,955
Decile 7 $64,529 $66,614 $68,187 $69,058 $69,317 $70,997
Decile 8 $74,187 $76,588 $79,362 $79,413 $80,177 $81,765
Decile 9 $87,522 $90,568 $94,136 $95,252 $94,336 $98,101
Decile 10 $116,480 $124,262 $128,388 $130,681 $129,446 $135,810
Median $52,701 $54,001 $56,618 $56,226 $57,253 $57,806
Average $58,740 $61,372 $63,730 $63,921 $64,244 $66,249

�0 growing gap project
table 3 Upper Limits of Deciles (in 2004$) for Earnings of Families with Children Under 18, Canada, 1976–2004
1976 1977 1978 1979 1980 1981 1982 1983
Decile 1 $14,532 $13,460 $12,774 $14,672 $13,078 $13,141 $7,690 $7,213
Decile 2 $31,059 $29,904 $29,341 $30,522 $28,874 $29,024 $24,059 $22,751
Decile 3 $40,695 $40,495 $40,009 $40,707 $39,853 $39,149 $34,899 $34,174
Decile 4 $48,796 $48,560 $48,220 $49,434 $48,525 $47,547 $43,272 $42,793
Decile 5 $55,838 $55,684 $55,727 $56,690 $56,443 $55,217 $51,479 $50,900
Decile 6 $63,912 $63,119 $63,409 $64,457 $63,812 $63,081 $59,697 $59,505
Decile 7 $72,879 $72,713 $71,771 $73,407 $73,060 $72,226 $69,158 $69,121
Decile 8 $85,349 $84,395 $83,805 $84,691 $84,271 $83,317 $80,597 $80,945
Decile 9 $103,818 $103,368 $102,546 $104,470 $102,208 $101,965 $99,756 $99,716
Decile 10* $- $- $- $- $- $- $- $-
1984 1985 1986 1987 1988 1989 1990 1991
Decile 1 $6,221 $8,307 $7,586 $9,804 $9,731 $11,647 $8,013 $5,692
Decile 2 $22,259 $24,242 $24,888 $26,602 $27,506 $27,866 $24,427 $21,066
Decile 3 $34,060 $35,754 $36,375 $38,160 $38,508 $39,234 $36,750 $33,218
Decile 4 $43,225 $45,291 $46,469 $47,557 $48,124 $49,000 $47,153 $43,921
Decile 5 $51,845 $53,669 $55,269 $56,604 $57,893 $57,684 $57,073 $53,383
Decile 6 $60,439 $62,561 $63,816 $65,578 $67,143 $66,801 $66,575 $63,249
Decile 7 $69,278 $71,886 $73,453 $75,544 $76,835 $77,000 $77,273 $74,198
Decile 8 $81,424 $83,962 $85,369 $87,370 $89,630 $90,784 $90,392 $86,493
Decile 9 $100,689 $102,742 $105,296 $107,957 $111,128 $112,000 $111,271 $107,548
Decile 10* $- $- $- $- $- $- $- $-
* $– means there is no “upper limit” for the richest decile

�1the rich and the rest of us
table 3 continued Upper Limits of Deciles (in 2004$) for Earnings of Families with Children Under 18, Canada, 1976–2004
1992 1993 1994 1995 1996 1997 1998
Decile 1 $4,486 $1,836 $2,724 $3,587 $588 $1,630 $3,293
Decile 2 $21,009 $17,741 $19,863 $20,209 $14,711 $16,007 $18,846
Decile 3 $33,263 $30,296 $33,398 $33,318 $27,520 $28,741 $31,690
Decile 4 $43,799 $40,877 $44,072 $43,653 $38,827 $40,829 $43,928
Decile 5 $53,929 $50,408 $53,905 $53,810 $50,387 $51,994 $55,645
Decile 6 $63,691 $61,198 $63,722 $63,497 $61,182 $63,672 $66,519
Decile 7 $74,715 $72,727 $74,519 $74,138 $72,275 $75,094 $78,421
Decile 8 $87,711 $86,510 $88,319 $88,727 $87,509 $90,054 $93,964
Decile 9 $110,711 $106,772 $112,384 $109,436 $109,589 $113,229 $118,206
Decile 10* $- $- $- $- $- $- $-
1999 2000 2001 2002 2003 2004
Decile 1 $5,659 $7,366 $8,113 $7,760 $8,377 $9,380
Decile 2 $21,404 $23,127 $22,654 $22,641 $23,110 $23,450
Decile 3 $33,915 $35,924 $35,825 $35,709 $35,772 $35,988
Decile 4 $45,929 $47,325 $47,734 $46,843 $47,126 $48,605
Decile 5 $56,380 $58,673 $58,730 $57,924 $58,837 $60,178
Decile 6 $67,436 $70,007 $70,381 $69,853 $70,662 $71,523
Decile 7 $79,702 $82,752 $83,629 $82,663 $83,914 $85,161
Decile 8 $95,846 $98,287 $99,653 $100,082 $100,914 $102,285
Decile 9 $120,198 $125,009 $126,330 $127,876 $128,863 $131,208
Decile 10* $- $- $- $- $- $-
* $– means there is no “upper limit” for the richest decile

�2 growing gap project
table 4 Upper Limits of Deciles (in 2004$) for After-Tax Incomes of Families with Children Under 18, Canada, 1976–2004
1976 1977 1978 1979 1980 1981 1982 1983
Decile 1 $23,778 $23,300 $23,580 $22,910 $22,716 $23,319 $21,518 $20,461
Decile 2 $33,427 $34,115 $34,528 $33,702 $34,165 $33,551 $31,091 $29,904
Decile 3 $40,745 $41,467 $41,650 $40,977 $41,472 $40,648 $38,615 $37,499
Decile 4 $46,334 $47,167 $47,271 $47,000 $47,933 $46,680 $44,671 $43,386
Decile 5 $51,721 $52,743 $52,832 $52,916 $53,003 $52,271 $50,569 $49,065
Decile 6 $58,266 $58,559 $58,722 $59,096 $59,225 $58,133 $56,768 $55,614
Decile 7 $65,417 $66,533 $66,241 $66,179 $66,295 $65,027 $63,758 $62,587
Decile 8 $75,596 $75,891 $75,483 $75,595 $75,050 $74,773 $72,797 $72,813
Decile 9 $92,073 $91,326 $91,315 $92,259 $91,279 $90,256 $88,161 $87,707
Decile 10* $- $- $- $- $- $- $- $-
1984 1985 1986 1987 1988 1989 1990 1991
Decile 1 $19,739 $20,943 $21,520 $22,012 $23,248 $23,272 $21,611 $21,006
Decile 2 $29,945 $30,726 $31,450 $31,622 $32,722 $34,091 $31,807 $30,448
Decile 3 $37,746 $38,729 $39,017 $39,257 $40,089 $41,080 $39,534 $37,777
Decile 4 $44,203 $45,032 $45,220 $45,549 $46,103 $47,155 $45,879 $43,709
Decile 5 $49,968 $51,076 $51,336 $51,343 $52,328 $52,744 $51,849 $49,701
Decile 6 $55,895 $57,326 $57,464 $57,475 $58,768 $59,192 $58,308 $56,405
Decile 7 $62,741 $64,216 $64,944 $64,569 $65,528 $66,555 $65,814 $63,862
Decile 8 $71,966 $73,649 $73,607 $73,965 $75,174 $76,325 $75,631 $73,004
Decile 9 $87,144 $87,835 $88,365 $89,993 $91,794 $92,617 $90,970 $87,594
Decile 10* $- $- $- $- $- $- $- $-
* $– means there is no “upper limit” for the richest decile
��the rich and the rest of us
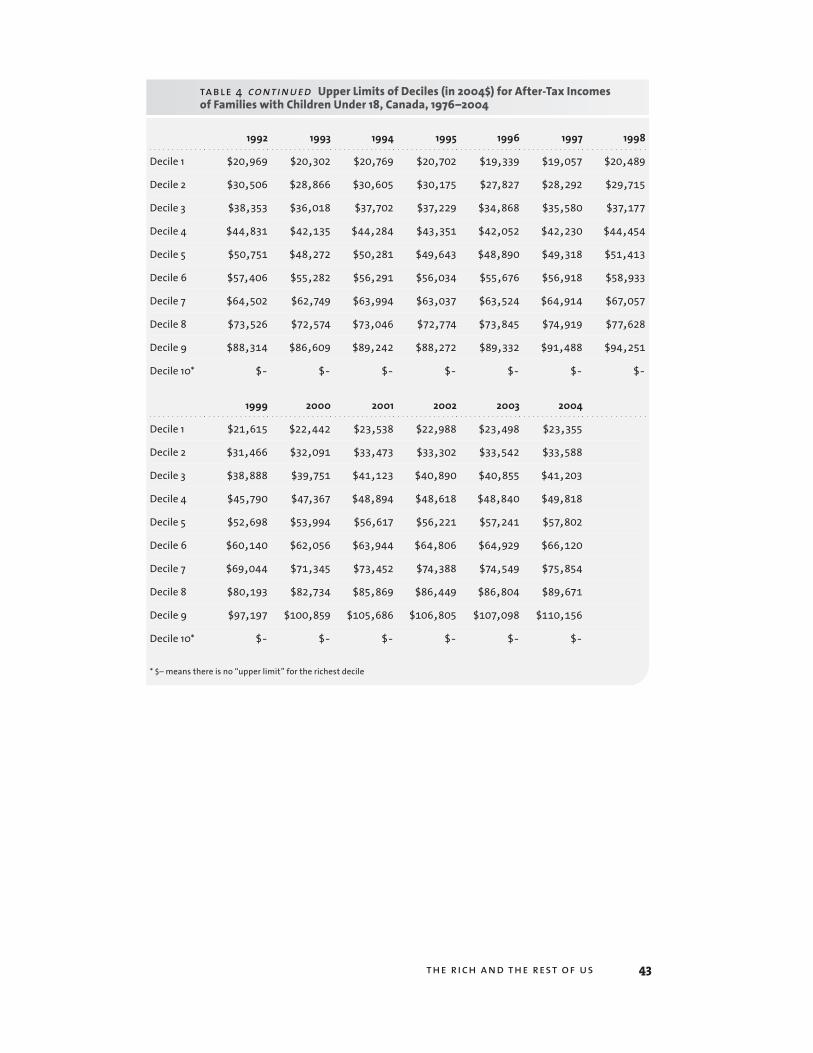
table 4 continued Upper Limits of Deciles (in 2004$) for After-Tax Incomes of Families with Children Under 18, Canada, 1976–2004
1992 1993 1994 1995 1996 1997 1998
Decile 1 $20,969 $20,302 $20,769 $20,702 $19,339 $19,057 $20,489
Decile 2 $30,506 $28,866 $30,605 $30,175 $27,827 $28,292 $29,715
Decile 3 $38,353 $36,018 $37,702 $37,229 $34,868 $35,580 $37,177
Decile 4 $44,831 $42,135 $44,284 $43,351 $42,052 $42,230 $44,454
Decile 5 $50,751 $48,272 $50,281 $49,643 $48,890 $49,318 $51,413
Decile 6 $57,406 $55,282 $56,291 $56,034 $55,676 $56,918 $58,933
Decile 7 $64,502 $62,749 $63,994 $63,037 $63,524 $64,914 $67,057
Decile 8 $73,526 $72,574 $73,046 $72,774 $73,845 $74,919 $77,628
Decile 9 $88,314 $86,609 $89,242 $88,272 $89,332 $91,488 $94,251
Decile 10* $- $- $- $- $- $- $-
1999 2000 2001 2002 2003 2004
Decile 1 $21,615 $22,442 $23,538 $22,988 $23,498 $23,355
Decile 2 $31,466 $32,091 $33,473 $33,302 $33,542 $33,588
Decile 3 $38,888 $39,751 $41,123 $40,890 $40,855 $41,203
Decile 4 $45,790 $47,367 $48,894 $48,618 $48,840 $49,818
Decile 5 $52,698 $53,994 $56,617 $56,221 $57,241 $57,802
Decile 6 $60,140 $62,056 $63,944 $64,806 $64,929 $66,120
Decile 7 $69,044 $71,345 $73,452 $74,388 $74,549 $75,854
Decile 8 $80,193 $82,734 $85,869 $86,449 $86,804 $89,671
Decile 9 $97,197 $100,859 $105,686 $106,805 $107,098 $110,156
Decile 10* $- $- $- $- $- $-
* $– means there is no “upper limit” for the richest decile

�� growing gap project
table 5 Share of All Earnings of Families With Children Under 18, by Decile, Canada 1976–2004
1976 1977 1978 1979 1980 1981 1982 1983
Decile 1 0.79% 0.63% 0.58% 0.75% 0.57% 0.63% 0.31% 0.26%
Decile 2 3.83% 3.80% 3.73% 3.90% 3.64% 3.74% 3.04% 2.89%
Decile 3 5.86% 6.01% 5.95% 5.99% 5.86% 5.88% 5.39% 5.20%
Decile 4 7.33% 7.58% 7.55% 7.55% 7.53% 7.43% 7.12% 7.01%
Decile 5 8.54% 8.82% 8.83% 8.85% 8.92% 8.83% 8.62% 8.53%
Decile 6 9.78% 10.05% 10.16% 10.10% 10.19% 10.12% 10.11% 10.01%
Decile 7 11.12% 11.48% 11.48% 11.47% 11.58% 11.56% 11.72% 11.68%
Decile 8 12.88% 13.29% 13.17% 13.15% 13.32% 13.28% 13.52% 13.59%
Decile 9 15.24% 15.72% 15.61% 15.58% 15.67% 15.73% 16.34% 16.24%
Decile 10 24.64% 22.62% 22.93% 22.66% 22.72% 22.80% 23.83% 24.58%
1984 1985 1986 1987 1988 1989 1990 1991
Decile 1 0.20% 0.30% 0.27% 0.36% 0.38% 0.48% 0.31% 0.16%
Decile 2 2.66% 2.94% 2.93% 3.10% 3.15% 3.20% 2.75% 2.38%
Decile 3 5.13% 5.29% 5.29% 5.35% 5.39% 5.33% 5.08% 4.72%
Decile 4 7.01% 7.12% 7.08% 7.13% 7.04% 7.06% 6.92% 6.63%
Decile 5 8.65% 8.72% 8.73% 8.62% 8.60% 8.51% 8.58% 8.36%
Decile 6 10.14% 10.17% 10.14% 10.09% 10.13% 9.90% 10.18% 10.01%
Decile 7 11.74% 11.75% 11.74% 11.64% 11.66% 11.43% 11.76% 11.79%
Decile 8 13.58% 13.64% 13.59% 13.37% 13.46% 13.33% 13.68% 13.77%
Decile 9 16.28% 16.21% 16.11% 15.98% 16.13% 15.92% 16.41% 16.50%
Decile 10 24.59% 23.86% 24.11% 24.37% 24.07% 24.83% 24.33% 25.68%

��the rich and the rest of us
table 5 continued Share of All Earnings of Families With Children Under 18, by Decile, Canada 1976–2004
1992 1993 1994 1995 1996 1997 1998 1999
Decile 1 0.10% 0.03% 0.04% 0.07% 0.00% 0.02% 0.07% 0.17%
Decile 2 2.22% 1.78% 2.00% 2.06% 1.35% 1.51% 1.81% 2.06%
Decile 3 4.69% 4.34% 4.60% 4.58% 3.83% 3.88% 4.12% 4.37%
Decile 4 6.61% 6.39% 6.63% 6.57% 5.92% 5.97% 6.08% 6.25%
Decile 5 8.43% 8.19% 8.34% 8.29% 8.01% 7.93% 7.95% 8.02%
Decile 6 10.11% 9.98% 10.02% 9.96% 9.99% 9.92% 9.84% 9.68%
Decile 7 11.89% 11.96% 11.78% 11.75% 11.89% 11.83% 11.68% 11.49%
Decile 8 13.87% 14.19% 13.80% 13.85% 14.14% 14.07% 13.76% 13.68%
Decile 9 16.80% 17.11% 16.83% 16.73% 17.44% 17.25% 16.99% 16.67%
Decile 10 25.27% 26.04% 25.96% 26.14% 27.44% 27.63% 27.70% 27.61%
2000 2001 2002 2003 20041976–79 Average
2001–04 Average
Decile 1 0.27% 0.29% 0.26% 0.31% 0.37% 0.7% 0.3%
Decile 2 2.25% 2.29% 2.26% 2.29% 2.34% 3.8% 2.3%
Decile 3 4.41% 4.33% 4.28% 4.28% 4.14% 6.0% 4.3%
Decile 4 6.21% 6.09% 6.03% 5.99% 5.93% 7.5% 6.0%
Decile 5 7.90% 7.77% 7.69% 7.65% 7.60% 8.8% 7.7%
Decile 6 9.56% 9.48% 9.36% 9.35% 9.23% 10.0% 9.4%
Decile 7 11.33% 11.17% 11.15% 11.14% 10.96% 11.4% 11.1%
Decile 8 13.37% 13.31% 13.23% 13.28% 13.06% 13.1% 13.2%
Decile 9 16.41% 16.40% 16.48% 16.25% 16.18% 15.5% 16.3%
Decile 10 28.27% 28.88% 29.28% 29.47% 30.20% 23.2% 29.5%
�� growing gap project
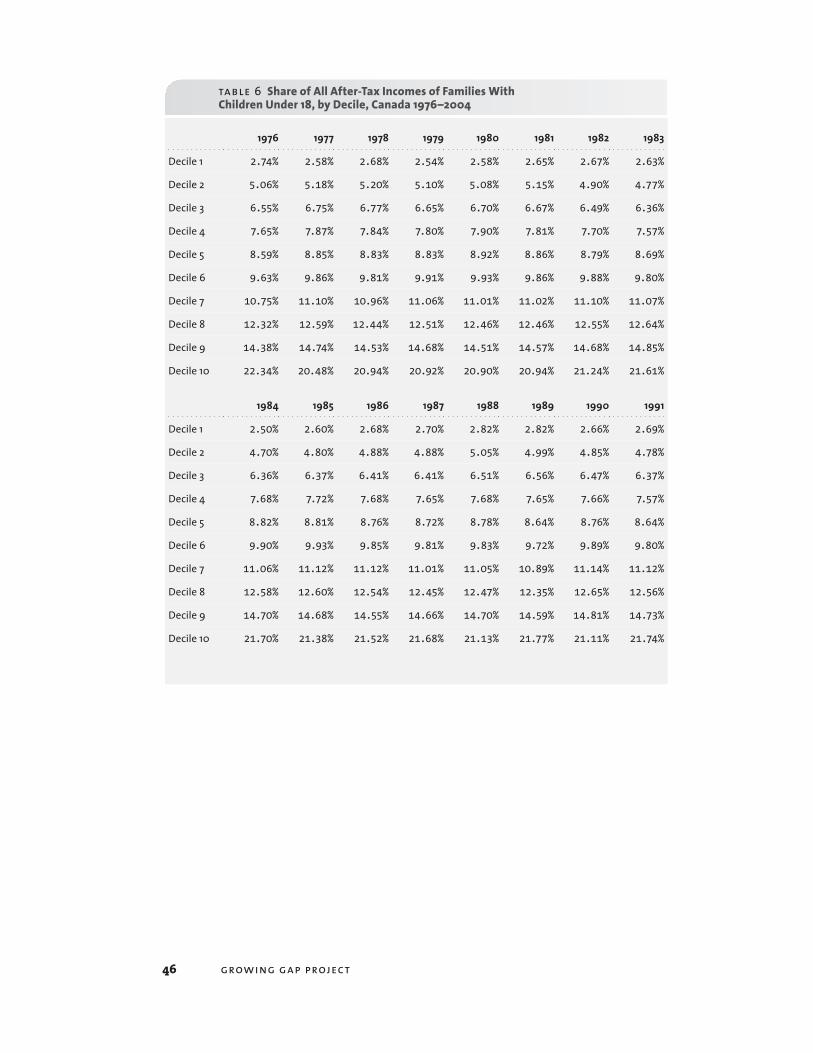
table 6 Share of All After-Tax Incomes of Families With Children Under 18, by Decile, Canada 1976–2004
1976 1977 1978 1979 1980 1981 1982 1983
Decile 1 2.74% 2.58% 2.68% 2.54% 2.58% 2.65% 2.67% 2.63%
Decile 2 5.06% 5.18% 5.20% 5.10% 5.08% 5.15% 4.90% 4.77%
Decile 3 6.55% 6.75% 6.77% 6.65% 6.70% 6.67% 6.49% 6.36%
Decile 4 7.65% 7.87% 7.84% 7.80% 7.90% 7.81% 7.70% 7.57%
Decile 5 8.59% 8.85% 8.83% 8.83% 8.92% 8.86% 8.79% 8.69%
Decile 6 9.63% 9.86% 9.81% 9.91% 9.93% 9.86% 9.88% 9.80%
Decile 7 10.75% 11.10% 10.96% 11.06% 11.01% 11.02% 11.10% 11.07%
Decile 8 12.32% 12.59% 12.44% 12.51% 12.46% 12.46% 12.55% 12.64%
Decile 9 14.38% 14.74% 14.53% 14.68% 14.51% 14.57% 14.68% 14.85%
Decile 10 22.34% 20.48% 20.94% 20.92% 20.90% 20.94% 21.24% 21.61%
1984 1985 1986 1987 1988 1989 1990 1991
Decile 1 2.50% 2.60% 2.68% 2.70% 2.82% 2.82% 2.66% 2.69%
Decile 2 4.70% 4.80% 4.88% 4.88% 5.05% 4.99% 4.85% 4.78%
Decile 3 6.36% 6.37% 6.41% 6.41% 6.51% 6.56% 6.47% 6.37%
Decile 4 7.68% 7.72% 7.68% 7.65% 7.68% 7.65% 7.66% 7.57%
Decile 5 8.82% 8.81% 8.76% 8.72% 8.78% 8.64% 8.76% 8.64%
Decile 6 9.90% 9.93% 9.85% 9.81% 9.83% 9.72% 9.89% 9.80%
Decile 7 11.06% 11.12% 11.12% 11.01% 11.05% 10.89% 11.14% 11.12%
Decile 8 12.58% 12.60% 12.54% 12.45% 12.47% 12.35% 12.65% 12.56%
Decile 9 14.70% 14.68% 14.55% 14.66% 14.70% 14.59% 14.81% 14.73%
Decile 10 21.70% 21.38% 21.52% 21.68% 21.13% 21.77% 21.11% 21.74%

��the rich and the rest of us
table 6 continued Share of All After-Tax Incomes of Families With Children Under 18, by Decile, Canada 1976–2004
1992 1993 1994 1995 1996 1997 1998 1999
Decile 1 2.69% 2.75% 2.72% 2.75% 2.56% 2.47% 2.56% 2.55%
Decile 2 4.81% 4.71% 4.76% 4.73% 4.41% 4.35% 4.50% 4.59%
Decile 3 6.38% 6.17% 6.32% 6.31% 5.87% 5.84% 5.90% 5.96%
Decile 4 7.64% 7.44% 7.59% 7.48% 7.19% 7.11% 7.22% 7.21%
Decile 5 8.84% 8.58% 8.73% 8.67% 8.52% 8.39% 8.44% 8.39%
Decile 6 9.95% 9.81% 9.85% 9.81% 9.85% 9.70% 9.76% 9.61%
Decile 7 11.19% 11.18% 11.09% 11.07% 11.11% 11.19% 11.13% 10.99%
Decile 8 12.64% 12.75% 12.63% 12.62% 12.81% 12.73% 12.69% 12.68%
Decile 9 14.73% 14.96% 14.84% 14.78% 15.17% 15.15% 14.95% 14.94%
Decile 10 21.13% 21.65% 21.46% 21.77% 22.50% 23.08% 22.84% 23.08%
2000 2001 2002 2003 20041976–79 Average
2001–04 Average
Decile 1 2.59% 2.61% 2.54% 2.54% 2.54% 2.6% 2.6%
Decile 2 4.50% 4.54% 4.49% 4.50% 4.38% 5.1% 4.5%
Decile 3 5.86% 5.87% 5.78% 5.78% 5.65% 6.7% 5.8%
Decile 4 7.11% 7.05% 7.00% 6.97% 6.87% 7.8% 7.0%
Decile 5 8.27% 8.27% 8.19% 8.25% 8.10% 8.8% 8.2%
Decile 6 9.44% 9.49% 9.46% 9.48% 9.37% 9.8% 9.4%
Decile 7 10.84% 10.74% 10.83% 10.83% 10.70% 11.0% 10.8%
Decile 8 12.52% 12.43% 12.50% 12.48% 12.40% 12.5% 12.5%
Decile 9 14.76% 14.85% 14.93% 14.90% 14.88% 14.6% 14.9%
Decile 10 24.11% 24.15% 24.28% 24.25% 25.12% 21.2% 24.5%

�� growing gap project
table 7 Earnings* and After-Tax Gap, Ratios of Average Values for Richest and Poorest Deciles, Families With Children Under 18, Canada, 1976–2004
1976 1977 1978 1979 1980 1981 1982 1983
Earnings Gap 31.2 35.6 39.2 30.2 39.8 36.0 76.5 95.3
After Tax Gap 8.1 7.9 7.8 8.2 8.1 7.9 7.9 8.2
1984 1985 1986 1987 1988 1989 1990 1991
Earnings Gap 120.6 80.0 88.3 67.3 63.7 51.2 79.0 158.5
After Tax Gap 8.7 8.2 8.0 8.0 7.5 7.7 7.9 8.0
1992 1993 1994 1995 1996 1997 1998 1999
Earnings Gap 244.6 1,027.1 643.3 380.2 11,741.7 1,215.3 404.8 165.2
After Tax Gap 7.8 7.8 7.9 7.9 8.8 9.3 8.9 9.0
2000 2001 2002 2003 2004
Earnings Gap 102.9 100.4 111.8 95.7 81.6
After Tax Gap 9.3 9.2 9.5 9.5 9.9
* Non-Negative Earnings (See Appendix One)

��the rich and the rest of us
table 8 Average Annual Weeks of Employment, Families With One or More Week of Employment, With Children Under 18, by Decile, Canada, 1976–2004
1976 1977 1978 1979 1980 1981 1982 1983
Decile 1 40 40 36 41 39 39 33 28
Decile 2 58 60 58 63 58 61 55 51
Decile 3 64 66 65 68 66 71 66 67
Decile 4 67 70 68 73 70 73 73 74
Decile 5 74 74 74 78 76 80 77 79
Decile 6 77 79 79 82 81 85 81 79
Decile 7 85 83 84 89 88 89 88 90
Decile 8 90 94 93 96 95 96 98 93
Decile 9 100 102 100 110 105 107 105 102
Decile 10 111 122 118 128 117 126 121 110
Average 78 81 79 84 81 84 82 80
1984 1985 1986 1987 1988 1989 1990 1991
Decile 1 28 30 31 30 30 34 30 28
Decile 2 51 57 59 57 59 61 57 52
Decile 3 68 69 71 73 73 72 71 69
Decile 4 74 76 79 77 80 79 77 78
Decile 5 78 81 83 83 85 86 86 82
Decile 6 82 85 86 87 89 90 93 88
Decile 7 87 90 91 94 97 97 96 97
Decile 8 97 95 103 100 105 106 105 102
Decile 9 107 109 110 113 111 118 112 111
Decile 10 120 120 121 125 125 124 123 118
Average 82 84 86 87 88 89 88 86

�0 growing gap project
table 8 continued Average Annual Weeks of Employment, Families With One or More Week of Employment, With Children Under 18, by Decile, Canada, 1976–2004
1992 1993 1994 1995 1996 1997 1998
Decile 1 28 19 24 26 48 40 38
Decile 2 51 43 46 46 52 50 54
Decile 3 67 64 68 70 73 73 73
Decile 4 76 75 76 76 77 81 82
Decile 5 80 81 84 85 86 87 90
Decile 6 90 90 90 88 92 92 92
Decile 7 95 93 96 97 95 98 102
Decile 8 104 102 104 103 105 106 107
Decile 9 111 109 112 110 110 109 113
Decile 10 114 118 120 117 114 115 112
Average 85 85 87 86 89 89 90
1999 2000 2001 2002 2003 2004
Decile 1 40 42 45 45 44 47
Decile 2 59 63 63 61 65 66
Decile 3 74 75 75 73 74 75
Decile 4 85 82 83 80 82 82
Decile 5 89 90 90 89 90 89
Decile 6 93 94 99 93 97 97
Decile 7 101 101 100 98 102 98
Decile 8 104 108 107 106 109 108
Decile 9 114 112 114 111 110 116
Decile 10 115 116 116 113 115 113
Average 91 91 92 90 91 92

�1the rich and the rest of us
table 9 Average Annual Hours of Employment, Families With One or More Week of Employment, With Children Under 18, by Decile, Canada, 1996–2004*
1996 1997 1998 1999 2000 2001 2002 2003 2004
Decile 1 1,439 948 1,075 996 1,121 1,365 1,315 1,265 1,529
Decile 2 1,478 1,470 1,725 1,820 2,106 2,151 1,981 2,119 2,322
Decile 3 2,522 2,444 2,398 2,468 2,629 2,678 2,609 2,532 2,535
Decile 4 2,732 2,829 2,862 2,897 2,915 2,951 2,842 2,901 2,941
Decile 5 2,955 2,946 3,118 2,998 3,175 3,227 3,192 3,133 3,162
Decile 6 3,158 3,166 3,216 3,241 3,230 3,535 3,266 3,370 3,400
Decile 7 3,298 3,467 3,494 3,459 3,569 3,605 3,534 3,568 3,548
Decile 8 3,580 3,641 3,676 3,562 3,804 3,829 3,748 3,809 3,782
Decile 9 3,896 3,786 3,946 3,898 3,883 4,032 3,908 3,910 4,049
Decile 10 4,063 4,107 3,984 3,974 4,093 4,184 4,058 4,119 4,074
Average 3,065 3,052 3,098 3,075 3,171 3,262 3,154 3,179 3,225
* Hours of Work data only available since 1996


��the rich and the rest of us
Notes
1 The average size of the household raising children under 18 in Canada was 3.92 in 2004, according to unpublished data from Statistics Canada. There were 3.8 million households raising children under 18 in Canada in 2004, 29% of all households in Canada. That year the population estimate for Canada was 32 million people.
2 All data for this analysis are custom-tabulated by Statistics Canada, based on data from the Survey of Consumer Finances (SCF) and the Survey of Labour Income Dynamics (SLID) These data only go back to 1976 and the most recently available data refers to incomes in 2004. See Appendix One for more details about the data and the methodology.
3 Marc Frenette, David A. Green and Garnett Picot, Rising Income Inequality in the 1990s: An Exploration of Three Data Sources, in David A. Green and Jonathan R. Kesselman, edi-tors, Dimensions of Inequality in Canada, Vancouver: UBC Press, 2006.
4 The trends since 1976 can be found in Appendix Two. The following figures are for 2004, the most recent data available through Statistics Canada. There are regional differences in the definitions of what is rich, poor and “average” in Canada, but it is important to know what the data tell us about the distribution of incomes across the country as a whole.
5 World Bank estimates the population of low-income nations to be 2.3 billion in 2003. See World Bank 2005 World Development Indicators, Table 1.1 http://devdata.worldbank.org/wdi2005/Table1_1.htm. In 2005 the combined GDP of low income nations was, according to the World Bank, $1.4 trillion US. In that year Canada’s GDP was assessed at about $1.2 tril-lion US. See World Bank 2005 World Development Indicators. http://siteresources.worldbank.org/DATASTATISTICS/Resources/GDP.pdf
6 The World Bank ranked the 2005 GDP of 183 nations in US dollars. Ahead of Canada in 2005 is, in order, the United States, Japan, Germany, China, United Kingdom, France, Italy and Spain. See http://siteresources.worldbank.org/DATASTATISTICS/Resources/GDP.pdf
7 From International Finance Corporation rankings using World Bank data based on 175 nations. See http://www.doingbusiness.org/EconomyRankings/Default.aspx?direction=asc&sort=1
8 Canadian Centre for Policy Alternatives (Ottawa: November 2006). Growing Gap, Grow-ing Concerns.
9 This paper refers to economic growth since 1981 because that is the only consistent eco-nomic series for national accounts. Population statistics are also from the national economic accounts. The SCF/SLID data for family incomes go back consistently to 1976.
�� growing gap project
10 Families in the 8th decile barely inched ahead in terms of earnings, but the progress was mostly at the top of that particular decile.
11 The spike in 1996 in the poorest decile is a function of a small sample size in that decile in that year. Those surveyed were a group that appeared to have higher average weeks worked than the previous years. That they were not atypical shows in the higher trendline in weeks worked among families in the poorest decile over time after 1996. It should be remembered that the early to mid 1990s was devastating to many of these households, as they lost jobs, weeks and hours of work until the latter part of the 1990s.
12 According to methodologists at Statistics Canada, the apparent spike in hours in 2001 is more a result of low results in 2000 due to sampling problems than high results in 2001.
13 Based on Department of Finance Canada, Fiscal Reference Tables, Table 10. Budget 2006 introduced another $2.5 billion under the rubric of this progam for a $100/month taxable allowance to families for each child under the age of six, called the Universal Child Care Benefit. The existing CCTB under-7 supplement will be erased by July 2007, saving most of this new expenditure. The Budget Plan 2006: Focusing on Priorities, Canada’s New Govern-ment, p.100
14 Saez, Emmanuel and Veall, Michael R. (2005). The Evolution of High Incomes in North America: Lessons from Canadian Evidence, American Economic Review, Vol. 95, No. 3.
15 John Partridge, “Options spell pay dirt”, in Report on Business, The Globe and Mail, April 18, 1998, pages B1 and B6. Includes executive pay of Canada’s top 100 CEOS in publicly traded and privately held companies. Janet McFarland, “How Much Is Too Much”, in Report on Busi-ness, The Globe and Mail, May 9, 2006, page B9. Executive compensation for Canada’s top 100 CEOs. Average earnings calculated from Statistics Canada, Employment Earnings and Hours, Catalogue 72-002-XIB, Table 9, October 2006; CPI calculated from Bank of Canada’s inflation calculator http://www.bankofcanada.ca/en/rates/inflation_calc.html