mapping the resilience of international river basins to future climate change
DESCRIPTION
(2010) Discussion Paper #15. Transboundary watercourses pose a variety of challenges to the management of water resources. Activities of water resources use or protection by one actor necessarily affect the opportunities of other actors and basin-wide management approaches tend to clash with state sovereignty perceptions.TRANSCRIPT

W a t e r S e c t o r B o a r d d i S c u S S i o n P a P e r S e r i e S
P a P e r n o . 1 5M a r c H 2 0 1 0
Mapping the Resilience of International River Basins to Future Climate Change-Induced Water Variability
Lucia De Stefano, James Duncan, Shlomi Dinar, Kerstin Stahl, Kenneth Strzepek and Aaron T. Wolf
Pub
lic D
iscl
osur
e A
utho
rized
Pub
lic D
iscl
osur
e A
utho
rized
Pub
lic D
iscl
osur
e A
utho
rized
Pub
lic D
iscl
osur
e A
utho
rized


March 2010
MAPPING THE RESILIENCE OF INTERNATIONAL RIVER BASINS TO FUTURE CLIMATE CHANGE-INDUCED WATER VARIABILITY
Lucia De Stefano
James Duncan
Shlomi Dinar
Kerstin Stahl
Kenneth Strzepek
Aaron T. Wolf

Disclaimer
This volume is a product of the staff of the International Bank for Reconstruction and Development/The World Bank. The findings, interpretations, and conclusions expressed in this paper do not necessarily reflect the views of the Executive Directors of The World Bank or the governments they represent.
The World Bank does not guarantee the accuracy of the data included in this work. The boundaries, colors, denominations, and other information shown on any map in this work do not imply any judgment on the part of The World Bank concerning the legal status of any territory or the endorsement or acceptance of such boundaries.
The material in this publication is copyrighted. Copying and/or transmitting portions or all of this work without permission may be a violation of applicable law. The International Bank for Reconstruction and Development/The World Bank encourages dissemination of its work and will normally grant permission to reproduce portions of the work promptly.
For permission to photocopy or reprint any part of this work, please send a request with complete information to the Copyright Clearance Center, Inc., 222 Rosewood Drive, Danvers, MA 01923, USA, telephone 978-750-8400, fax 978-750-4470, http://www.copyright.com. All other queries on rights and licenses, including subsidiary rights, should be addressed to the Office of the Publisher, The World Bank, 1818 H Street NW, Washington, DC 20433, USA, fax 202-522-2422, e-mail [email protected].

iii
TABLE OF CONTENTS
AUTHORS AND AFFILIATIONS ............................................................................................ vii
ACKNOWLEDGEMENTS .................................................................................................... vii
ABBREVIATIONS AND ACRONYMS .................................................................................... viii
FOREWORD ....................................................................................................................... ix
CHAPTER 1: INTRODUCTION ............................................................................................. 1
CHAPTER 2: METHODOLOGY ............................................................................................ 3
CHAPTER 3: DATA COLLECTION AND ANALYSIS ................................................................. 5The country-basin unit spatial database ......................................................................... 5Updating the TFDD treaty collection.............................................................................. 6River basin organization and treaty capacity .................................................................. 7Baseline water variability and future variability change ................................................. 11Combining treaty/RBO coverage with variability and variability change ......................... 16
CHAPTER 4: RESULTS ........................................................................................................ 19The country-basin unit database ................................................................................. 19Vulnerability: Treaty scope scoring and RBO presence/absence ..................................... 19Hazard: Hydrologic exposure, variability and future change in variability ....................... 23Risk: Combining treaty and RBO coverage with hydrological exposure .......................... 24
Risk related to present-day runoff variability ......................................................... 25Risk related to runoff variability change by 2030 .................................................. 28Risk related to runoff variability change by 2050 .................................................. 33
Identification of basins in need of further study ............................................................ 34Data-driven selection of basins ........................................................................... 35Basin profiles .................................................................................................... 45
CHAPTER 5: DISCUSSION ................................................................................................ 63Caveats .................................................................................................................... 63Directions for further study ......................................................................................... 64
CHAPTER 6: CONCLUSIONS ............................................................................................ 67
CHAPTER 7: REFERENCES ................................................................................................. 71
APPENDICES (Please note that the appendices are available online at the World Bank Water website.)
APPENDIX 1 – CATEGORIES OF TREATY ANALYSIS ..........................................................A1-1
APPENDIX 2 – TREATY DATA AND SCORING ..................................................................A2-1
APPENDIX 3 – RBO PRESENCE/ABSENCE BY CBU...........................................................A3-1

iv
APPENDIX 4 – TREATY/RBO SCORES BY CBU .................................................................A4-1
APPENDIX 5 – CBUs PRESENTLY AT RISK .........................................................................A5-1
APPENDIX 6 – CBUs AT RISK IN 2030 UNDER DRIEST CLIMATE SCENARIO .....................A6-1
APPENDIX 7 – CBUs AT RISK IN 2030 UNDER MIDDLE CLIMATE SCENARIO ....................A7-1
APPENDIX 8 – CBUs AT RISK IN 2030 UNDER WETTEST CLIMATE SCENARIO ..................A8-1
APPENDIX 9 – CBUs AT RISK IN 2050 UNDER DRIEST CLIMATE SCENARIO .....................A9-1
APPENDIX 10 – CBUs AT RISK IN 2050 UNDER MIDDLE CLIMATE SCENARIO ................A10-1
APPENDIX 11 – CBUs AT RISK IN 2050 UNDER WETTEST CLIMATE SCENARIO ..............A11-1
FIGURESFigure 1: An example of how country-basin units were created .......................................... 5Figure 2: Country-basin units grouped by basin continent (top panel)
and World Bank region (bottom panel) .............................................................. 7Figure 3: Histograms of the present (1961–1990) CV values for runoff (left panel)
and precipitation (right panel) ......................................................................... 12Figure 4: Global distribution of the coefficient of variation of annual precipitation
and runoff for the country-basin-units for the historic period 1961–1990 ........... 13Figure 5: Box plots for the different climate scenarios showing the distribution of the
relative changes of future CVs as compared to historic CVs in CBU runoff.......... 14Figure 6: Global distribution of projected precipitation CVs for 2030 and 2050
for the Driest, Middle and Wettest scenarios ..................................................... 15Figure 7: Global distribution of projected runoff CVs for 2030 and 2050
for the Driest, Middle and Wettest scenarios ..................................................... 16Figure 8: A conceptual model for ranking risk based on institutional vulnerability and
hydrological hazards ...................................................................................... 17Figure 9: An example of how the conceptual model of risk is applied to a particular
basin ............................................................................................................. 18Figure 10: The global distribution of treaty/RBO scores following aggregation
to the CBU of all treaty scoring ....................................................................... 21Figure 11: Percentage of total in each treaty/RBO score level by World Bank region for
(a) CBU number, (b) basin area and (c) basin population .................................. 22Figure 12: Global distribution of present runoff variability classes ...................................... 23Figure 13: Increase in runoff variability for 2030 (top) and 2050 (bottom).
Low/None is <5%, moderate is 5%–15%, and high is greater than 15% (middle scenario) ........................................................................................... 24
Figure 14: The grouped treaty/RBO score coverage for all CBUs with high present variability in runoff .............................................................................. 27
Figure 15: The grouped treaty/RBO score coverage for all CBUs with medium present variability in runoff .............................................................................. 27
Figure 16: The grouped treaty/RBO score coverage for all CBUs with low present variability in runoff ......................................................................................... 28

v
Figure 17: Distribution of high-vulnerability CBUs in pairs of present and future (2030) hazard classes................................................................................................ 28
Figure 18: The grouped treaty/RBO score coverage for all CBUs predicted to experience high increases in runoff variability for 2030 ................................. 32
Figure 19: The grouped treaty/RBO score coverage for all CBUs predicted to experience moderate increases in runoff variability for 2030 .............................................. 32
Figure 20: The grouped treaty/RBO coverage for all CBUs predicted to experience little or no increase in runoff variability for 2030 .............................................. 33
Figure 21: Distribution of high-vulnerability CBUs in pairs of present and future (2050) hazard classes................................................................................................ 33
Figure 22: The grouped treaty/RBO score coverage for all CBUs predicted to experience high increases in runoff variability for 2050 ..................................................... 35
Figure 23: The grouped treaty/RBO score coverage for all CBUs predicted to experience moderate increases in runoff variability for 2050 .............................................. 35
Figure 24: The grouped treaty/RBO score coverage for all CBUs predicted to experience little or no increase in runoff variability for 2050 .............................................. 36
Figure 25: Map of the Nile basin and its riparian countries ............................................... 45Figure 26: The distribution of treaty/RBO components and present variability classes for
the 11 riparians of the Nile basin .................................................................... 53Figure 27: Map of the Ganges-Brahmaputra-Meghna basin and its riparian countries......... 55Figure 28: The distribution of treaty/RBO components and population for the
Ganges-Brahmaputra-Meghna river basin ........................................................ 60Figure 29: The classes of vulnerability and hydrological hazard for each CBU in
the Ganges basin. .......................................................................................... 61
TABLESTable 1: Descriptions of criteria used to evaluate treaties and RBOs .................................. 8Table 2: Scoring method for CBUs based on treaty and RBO components ...................... 10Table 3: The number of CBUs that have each treaty component and RBO
presence/absence, globally and by World Bank region, with the percentage of the total CBUs for each region in parentheses .............................................. 19
Table 4: The number of CBUs receiving each treaty/RBO score grouped by World Bank regions and in total, with the percentage of the total CBUs for each region in parentheses ........................................................................ 20
Table 5: The number of CBUs falling into each risk group for present and projected future periods ........................................................................... 25
Table 6: Country-basin units in the highest risk level (high vulnerability and high hazard) for the present period . ................................................................ 26
Table 7: Country-basin units in the highest risk level (high vulnerability and high hazard) for 2030 under the middle climate scenario.................................. 29
Table 8 Country-basin units in the highest risk level (high vulnerability and high hazard) for 2050 under the middle climate scenario.................................. 34
Table 9: CBUs identified using the high present variability filter ....................................... 38Table 10: CBUs identified using the second filter applied to the 2030-middle scenario ...... 40Table 11: CBUs identified using the second filter applied to the 2050-middle scenario ...... 41Table 12: Basins identified for further study based on treaty/RBO score, present
variability hazard and basin importance of CBUs ............................................. 42

vi
Table 13: Basins identified for further study based on CBU treaty/RBO scores, hazard levels and basin importance in 2030 under the Middle climate scenario ............ 43
Table 14: Basins identified for further study based on CBU treaty/RBO scores, hazard levels and basin importance in 2050 under the middle climate scenario ............ 44
Table 15: Statistics on Nile riparian countries ................................................................. 46Table 16: All treaties for the Nile from the TFDD with information on relevant
mechanisms ................................................................................................... 47Table 17: Modeled runoff variability and projected climate change under all scenarios
for the riparians of the Nile ............................................................................. 52Table 18: Statistics on Ganges-Brahmaputra-Meghna riparian countries. Except where
noted ............................................................................................................ 55Table 19: All treaties for the Ganges-Brahmaputra-Meghna from the TFDD with
information on relevant mechanisms ................................................................ 56Table 20: Modeled runoff variability and projected climate change under all scenarios
for the riparians of the Ganges-Brahmaputra-Meghna ...................................... 59

vii
AUTHORS AND AFFILIATIONS
Lucia DeStefano – Department of Geosciences, Oregon State UniversityJames Duncan – Department of Geosciences, Oregon State UniversityShlomi Dinar – Department of Politics and International Relations, Florida International UniversityKerstin Stahl – Institute of Hydrology, University of FreiburgKenneth Strzepek – College of Engineering, University of ColoradoAaron T. Wolf – Department of Geosciences, Oregon State University
ACKNOWLEDGEMENTS
Thanks are owed to a number of colleagues who are responsible for the compilation and assessment of the immense amount of data on which this report is based. First and foremost, Prof. Ariel Dinar and Dr. Vahid Alavian were instrumental in crafting the structure and framework of the analysis. Michael Jacobsen has been infinitely patient and creative, for which we are grateful. The data included here exists due to the tremendous efforts of, and close collaboration with, a number of partners. Dr. Andrea Gerlak, Susanne Schmeier, and Dr. Marloes Bakker. Each was responsible for compilations and categorizations of the River Basin Organization data—we are thankful for their generous contributions. The OSU treaty database was vastly updated and improved thanks to close collaboration with the International Water Management Institute (IWMI); we are grateful to Dr. Mark Giordano and his colleagues Alena Drieschova and Dr. Jonathan Lautze for their efforts, as we are to Prof. Shlomi Dinar for contributing his collection as well. The design of our methodology likewise benefited from this collaboration with IWMI, as well as with Prof. Itay Fischhendler. A host of OSU and guest students contributed a vast amount of time and energy, including Stephanie Ogden, Yoshiko Sano, Amy McNally, Olivia Odom, Patrick MacQuarrie, Carolyn Jackson, Jehan Jabareen, and Geoff King. We are especially grateful to Kendra Hatcher, manager of TFDD, for her infinite expertise with data manipulation and visualization. Lynette de Silva, director of the OSU Program in Water Conflict Management, was a magician in keeping all of this activity on track, as ever.
Approving Manager: Julia Bucknall, Sector Manager, ETWWA
Contact Information
To order additional copies, please contact the Water Help Desk at [email protected]. This paper is available online at http://www.worldbank.org/water.

viii
ABBREVIATIONS AND ACRONYMS
AFR AfricaCBU Country Basin UnitCV Coefficient of VariationEAP East Asia and PacificECA Europe and Central AsiaENSO El Niño Southern OscillationGCM General Circulation ModelGDP Gross Domestic ProductIPCC Intergovernmental Panel on Climate ChangeIWMI International Water Management InstituteLCR Latin American and the CaribbeanMNA Middle East and North AfricaOECD Organization for Economic Cooperative DevelopmentOHIE Other High Income EconomiesOSU Oregon State UniversityRBO River Basin OrganizationSAR South AsiaTFDD Transboundry Freshwater Dispute Database

ix
FOREWORD
Transboundary watercourses pose a variety of challenges to the management of water resources. Basin-wide management approaches often clash with state sovereignty. Efforts in cooperatively managing shared water resources are therefore of great importance for the sustainable management of transboundary river and lake basins. The World Bank has long been engaged in transboundary water resources management starting with the support to the establishment of the Indus Treaty signed between India and Pakistan in 1960 and followed by numerous other important initiatives and projects on transboundary watercourses.
Climate change adds new challenges to the management of water resources. Increased hydrological variability will have a significant impact on all dimensions of water use and water management, including greater uncertainty and an increase in extreme events such as floods and droughts.
The World Bank has therefore commissioned the authors of this report to investigate the specific interactions between transboundary water resources management and climate change. This aims at increasing our knowledge of exposure to climate change-induced variability across different river and lake basins and resilience of the institutions established to co-operatively manage shared water resources. Such an understanding is a prerequisite for proper design of future specific measures to adapt cooperative water resources management to future challenges in a changing and uncertain climate.
The results of the report reveal significant differences in institutional resilience to climate change-induced water variability across transboundary basins, with some basins being fairly resilient to climate change on all five dimensions identified as decisive for climate change resilience while others, especially in EAP and LCR, face a range of challenges. While water treaties and RBOs are relatively common in transboundary river basins, specific variability management mechanisms are often lacking. Moreover, several CBUs have been identified in which high hydrological exposure and a lack of adaptation mechanisms fall together, indicating a particular risk of climate change-induced challenges and calling for policy action. Some basins with particularly high probability of water stress have been identified for further study.
In addition, several issues have been identified that merit further research. These include a more detailed study of climate change forecast than applied in the study, especially with regard to intra-annual variability and the different indices of changes, more case-specific analysis of water treaties and RBOs taking into account the specific institutional components influencing resilience, and the inclusion of contextual non-treaty determinants influencing cooperation between riparian states and thus resilience. Based on this, the World Bank will continue its contribution to the study of the link between transboundary water resources management and climate change in the future, contributing to the sustainable management of transboundary waters.
Julia BucknallSector Manager, ETWWA

x
1
CHAPTER 1: INTRODUCTION
Transcending political boundaries, river basins shared by two or more countries pose particularly challenging management problems. In this context, the unifying principles of integrated watershed management clash with the forces of state sovereignty. Evidence suggests that the likelihood of political tensions is related to the interaction between variability or rates of change within a basin and the institutional capacity1 to absorb that change, often exemplified by treaties or international water body management organizations (henceforth referred to as river basin organizations or RBOs2) (Wolf, et. al 2003, Yoffe et al. 2003, Yoffe et al. 2004). The increase in future water variability forecasted by most climate change scenarios is one form of change that may alter current hydropolitical balances, affecting in turn the ability of states to meet their water treaty commitments. This may raise serious questions about the adequacy of many existing transboundary arrangements and lead countries to set up new international water agreements.
Historically, extreme events of conflict over water have been statistically somewhat more frequent in regions characterized by high interannual hydrologic variability (Wolf, Stahl, and Macomber 2003, Stahl 2005). Preliminary quantitative findings also demonstrate a correlation between variability—measured in the form of precipitation variation across time, and inter-country grievances—measured as the intensity of the grievance among states (Dinar et al. 2008). However, the existence of treaty/RBO provisions to deal with water variability, even if imperfect, can help to reduce tensions that may arise during extreme climatic events by providing riparian countries with specific mechanisms and an established framework suited to facing climate uncertainty (Wolf, et. al. 2003a, Odom & Wolf 2008, Fischhendler 2004).
As climate change drives shifts in climatic variability regimes around the world, resilience in the face of these shifts will be shaped by a number of institutional factors, including provisions contained in transboundary water treaties (which we refer to here as institutional mechanisms) and the RBOs that occasionally result. The presence of a water treaty or RBO can increase cooperation and mitigate grievances over water relative to places without any treaties or RBOs. Beyond the mere existence of treaties, the design or make-up of these treaties and institutions is important (Dinar 2008), and many mechanisms found in international water law may play a role in conferring resilience and preventing or assuaging inter-country tensions.
Monitoring, enforcement, conflict resolution or a stipulation instituting a joint commission or RBO may enhance treaty stability and resilience in the face of variability. The presence of allocation mechanisms in agreements pertaining to water quantity or hydropower may suppose greater certainty in the water sharing among riparian countries (as opposed to allocation uncertainty) that could also be preferable in the context of climate uncertainty. The presence of these stipulations will add to the robustness of the agreement in uncertain contexts and variable climates, and may further institutionalize the agreement. In fact, since one of the major difficulties in achieving international cooperation relates to a state’s fear of cheating by other states (Keohane 1982), such mechanisms may add a necessary level of confidence building.
1 In this context the term institution “refers to many different types of entities, including both organizations and the rules used to structure patterns of interactions within and across organizations” (Ostrom 2007, p. 22).
2 While the RBO is the abbreviation used here, we include within this term any international body involved in the management of transboundary water bodies.

2
International treaties do not provide the sole source of resilience to uncertainty and global environmental change. Additional provisions that may contribute to the treaties’ increased institutionalization and resilience in times of uncertainty and variability include opportunities for water augmentation strategies through desalinization or wastewater reclamation (relevant in the case of water quantity agreements, for example) or the promotion of benefit-sharing opportunities whereby the agreement is linked to other water- or non-water-related issues. Other exogenous factors may also be relevant such as the degree of interdependence among the parties as measured by the extent of inter-country trade, the extent and quality of relations among the parties, the regime type of the respective countries, and the geographical typology of the river under question.
The study presented in this report aims to increase our understanding of the global distribution of treaty and RBO mechanisms that may confer resilience to variability in the hydrological regime and how that distribution aligns with current and anticipated regimes. Some basins will experience greater changes in hydrologic variability regimes than others, and we specifically seek to identify country-basin combinations with greater exposure to variability and few or no treaty/RBO provisions to manage the transboundary impacts of that variability. To do this, we assessed all available international water treaties for specific treaty mechanisms, mapped the spatial distribution of these mechanisms and RBOs, and compared it to both the current variability regime and projections of future variability regimes driven by climate change. We then identified specific basins that may merit further study in light of their potential risk of future hydropolitical stress. By identifying these areas at the global scale, we can contribute to efforts aimed at anticipating future challenges in transboundary water management and suggesting specific measures to adapt existing or new water agreements to the effects of climate change.

3
CHAPTER 2: METHODOLOGY
To accomplish this project, we had to complete several tasks in sequence, as well as work iteratively to refine our work as we moved through the process. In the end, the methodology followed a set of five steps that allowed us to generate a substantial amount of data and successfully combine institutional and climate-related information about country-basin units.
Step 1: Generation of the country-basin units database. The starting point for this work is an existing database, the Oregon State University Transboundary Freshwater Dispute Database3 (Yoffe et al. 2000) that has been customized and upgraded to meet the project needs. First of all, the spatial resolution of the TFDD database has been scaled down from international basins into country-basin units (CBUs), defined as the spatial portion of a basin that is overlapped by a single country. Secondly, treaties have been categorized according to significant institutional components such as: topical and spatial coverage, water allocation mechanisms, types of provisions to address water variability, types of treaty enforcement mechanisms, and the existence and nature of joint management commissions (after Giordano and Wolf 2003, Wolf et.al. 2003a). Treaties were combined with geographical layers to create spatial representations of all treaties. The translation of institutional capacity characteristics into geographical layers provided a spatial coverage of existing treaties that allowed us to observe significant treaty and RBO patterns and identify gaps in territorial scope and topical coverage.
Step 2: Categorization of international water treaties according to their treaty and river basin organization capacity. Several components of freshwater agreements were identified as critical to reinforcing institutional resiliency in the face of possible climate change. Treaties were scored based on these criteria and then combined with data on river basin organizations to generate an overall rating of each country-basin unit.
Step 3: Classification of baseline hydrological variability and future change in hydrological variability for each country-basin unit. The projected interannual variability of runoff was compared to baseline variability data by country-basin unit for three climate scenarios in each of two time periods to create six datasets of hydrological exposure to future water variability, as well as one dataset of risk using the baseline variability dataset.
Step 4: Classification of basins according to their treaty/RBO capacity and exposure to present hydrological variability and future increases in hydrological variability. By matching hydrological exposure maps and treaty/RBO scores, country-basin units were categorized into classes of risk. This risk corresponds to the likelihood that states will face geopolitical stresses due to the difficulties of meeting water delivery commitments or mitigating increased variability.
Step 5: Identification of basins of significant interest for future study. After synthesizing the results of the above steps, a subset of basins with country-basin units that are considered to be at high risk based on both institutional and climatic factors were identified. Two basins were profiled in greater detail to give a sample of how the complex interaction of treaty/RBO capacity, present and future climate conditions and other additional factors such as population distribution or extent of irrigated area might be approached in the future.
The specific processing and analytic actions taken to meet these five steps are described in more detail in the next section.
3 http://www.transboundarywaters.orst.edu/database/interfreshtreatdata.html

4

5
CHAPTER 3: DATA COLLECTION AND ANALYSIS
The country-basin unit spatial database
The starting point for the identification of less resilient areas at the global level is an existing database, the Oregon State University (OSU) Transboundary Freshwater Dispute Database (TFDD, Yoffe et al. 2000), which includes tabular and spatial information on more than 400 international, freshwater-related agreements worldwide. It also houses spatial and tabular data on 276 transboundary freshwater river basins.
For this project, the spatial resolution of the TFDD has been scaled down from international basins into country-basin units. We define the country-basin unit (CBU) as the spatial portion of a basin that is within a single country. Previously, all treaty data in the TFDD and other databases were linked to basins and countries separately, with two problematic consequences. First, a treaty pertaining to any part of a basin and signed by any riparian country was assigned to the whole international basin. In analyzing the spatial coverage of such an agreement, portions of the basin overlapping riparian countries that were not party to the agreement were unavoidably included. Secondly, the previous data structure at times led to a treaty referencing ambiguous or non-existent spatial areas, such as when a treaty governing several basins was signed by several countries and not all those countries overlapped all of the basins. Shifting to the country-basin unit for analysis makes the spatial relationships and references of transboundary agreements clearer, improves the analytical value and spatial resolution of the dataset and provides a more accurate depiction of any gaps in the spatial extent of existing treaties. Figure 1 shows an example of how the Juba-Shibeli river basin in the Horn of Africa is broken down into different country-basin units. This task led to the identification of 747 CBUs.
Figure 1. An example of how country-basin units were created

6
For mapping and aggregating data for this study, World Bank regions were used. Each country is classified into a particular region. There are six distinct spatial regions: East Asia and Pacific (EAP), Europe and Central Asia (ECA), Latin American and the Caribbean (LCR), Middle East and North Africa (MNA), South Asia (SAR), and Sub-Saharan Africa (AFR). Some countries are classified by their economic status instead of their geographic location. These include some members of the Organization for Economic Cooperation and Development (OECD) and Other High-Income Economies (OHIE). These last two are grouped together for the purposes of this study into combined high-earning economies (OECD/OHIE).4 Global maps in Figure 2 show the classification of the transboundary basins of the world by basin continent and by World Bank region, as both are reported in the appendices. The exact correspondence between basin-continent and World Bank region for each CBU can be found in Appendix 4.
Updating the TFDD treaty collection
Additional treaties and agreements were added to the database, and all treaties were coded in additional dimensions from previous work. Over 240 agreements were added to the database, which now houses more than 680 treaties from around the world, each coded in over 40 dimensions. Appendix 1 lists all the dimensions considered for this study and provides brief descriptions of each category. All of this data was verified, standardized and loaded into a searchable database format.
Another modification made to the TFDD data structure was a new way of coding the spatial extent of treaty documents. The concept of the “territorial treaty application” was introduced and determined for each agreement to better represent the spatial nature of both pre-existing and newly added treaties at the level of the country-basin unit. We defined the territorial treaty application as the set of present-day country-basin units that comprise the territory controlled by a signatory at the time of signing. Many water agreements were signed by colonial powers, such as the British Empire in Africa, or nation-states that no longer exist in their present configuration, such as the U.S.S.R. and Yugoslavia. Though the influence or existence of these countries may change in a given place over time, agreements signed by these parties may still directly or indirectly influence water management in these areas, as is the case under the 1969 Vienna Convention on the Law of Treaties.
To determine the territorial treaty application, treaties that referenced non-existent country-basin pairs were identified and then examined using a variety of data sources on boundary delineations (Anderson 2003) and political history of territorial change (Tir et al. 1998). Internet searches were also conducted to determine which present-day country-basin combinations best represent the area intended for management by the treaty. For each treaty with a signatory that does not match the current geospatial arrangement of state territories, the set of CBUs that recreated the territory intended by the treaty was recorded. As a result of this work, the TFDD now links the treaty content analysis to both the original signatories and the territorial treaty application CBUs. This allows research to be conducted both on the historical evolution of water law and the spatial development of where that law was applied. While this represents an improvement in detail, the scope of the work and time constraints prevented the thorough research needed to determine the actual present-day enforcement status of all treaties, and this limitation should be understood when using the territorial treaty application information.
The territorial treaty application was used for all treaty analysis in this study.
4 The classification of countries into World Bank regions designated two countries as “N.A.” which led to four CBUs not being assigned to any regions. These were the portions of the Amazon, Maroni and Oiapoque/Oyupock basins in French Guiana and the Atui basin in the Former Spanish Sahara.

7
River basin organization and treaty capacity
In parallel to the upgrade of the spatial and treaty data, the OSU research team, in collaboration with researchers from the International Water Management Institute (IMWI), Florida International University, and Hebrew University of Jerusalem, defined several treaty and RBO components that suggest higher capacity to deal with climate change-driven water variability. The presence of an international water treaty, an allocation mechanism, a variability management mechanism,
Figure 2. Country-basin units grouped by basin continent (top panel) and World Bank region (bottom panel)
World Bank Region
Basin Continent
8
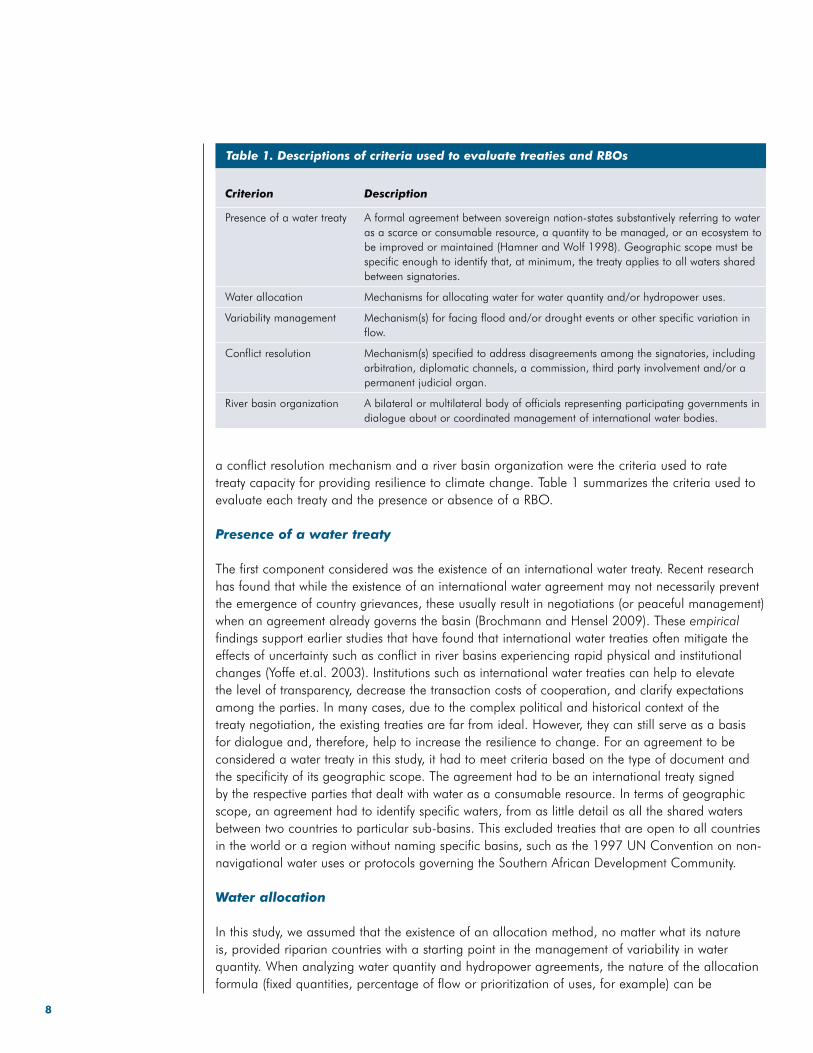
a conflict resolution mechanism and a river basin organization were the criteria used to rate treaty capacity for providing resilience to climate change. Table 1 summarizes the criteria used to evaluate each treaty and the presence or absence of a RBO.
Presence of a water treaty
The first component considered was the existence of an international water treaty. Recent research has found that while the existence of an international water agreement may not necessarily prevent the emergence of country grievances, these usually result in negotiations (or peaceful management) when an agreement already governs the basin (Brochmann and Hensel 2009). These empirical findings support earlier studies that have found that international water treaties often mitigate the effects of uncertainty such as conflict in river basins experiencing rapid physical and institutional changes (Yoffe et.al. 2003). Institutions such as international water treaties can help to elevate the level of transparency, decrease the transaction costs of cooperation, and clarify expectations among the parties. In many cases, due to the complex political and historical context of the treaty negotiation, the existing treaties are far from ideal. However, they can still serve as a basis for dialogue and, therefore, help to increase the resilience to change. For an agreement to be considered a water treaty in this study, it had to meet criteria based on the type of document and the specificity of its geographic scope. The agreement had to be an international treaty signed by the respective parties that dealt with water as a consumable resource. In terms of geographic scope, an agreement had to identify specific waters, from as little detail as all the shared waters between two countries to particular sub-basins. This excluded treaties that are open to all countries in the world or a region without naming specific basins, such as the 1997 UN Convention on non-navigational water uses or protocols governing the Southern African Development Community.
Water allocation
In this study, we assumed that the existence of an allocation method, no matter what its nature is, provided riparian countries with a starting point in the management of variability in water quantity. When analyzing water quantity and hydropower agreements, the nature of the allocation formula (fixed quantities, percentage of flow or prioritization of uses, for example) can be
Table 1. Descriptions of criteria used to evaluate treaties and RBOs
Criterion Description
Presence of a water treaty A formal agreement between sovereign nation-states substantively referring to water as a scarce or consumable resource, a quantity to be managed, or an ecosystem to be improved or maintained (Hamner and Wolf 1998). Geographic scope must be specific enough to identify that, at minimum, the treaty applies to all waters shared between signatories.
Water allocation Mechanisms for allocating water for water quantity and/or hydropower uses.
Variability management Mechanism(s) for facing flood and/or drought events or other specific variation in flow.
Conflict resolution Mechanism(s) specified to address disagreements among the signatories, including arbitration, diplomatic channels, a commission, third party involvement and/or a permanent judicial organ.
River basin organization A bilateral or multilateral body of officials representing participating governments in dialogue about or coordinated management of international water bodies.
9
important. In particular, since high variability produces fluctuations in available water, a flexible allocation mechanism may be better suited for accommodating variability than, say, a less flexible mechanism (Drieschova et.al. 2008). Binding, as opposed to less-binding, allocation mechanisms may likewise be preferred in contexts of variability since the treaty codifies clearer obligations and sets responsibilities among the parties. However, the effectiveness of a particular allocation mechanism can vary widely due to the influence of local context, and the complexity would increase even more if we attempted to compare different types of mechanisms. For these reasons, we decided to focus only on the existence or absence of an allocation mechanism rather than comparing different types, and rated each treaty based on whether an allocation mechanism was present.
Variability management
Variability management stipulations create mechanisms for dealing with climatic extremes such as droughts and floods or other specific variations. The mere existence of such stipulations implies that the treaty parties acknowledge the temporal variability of water availability and the type of mechanisms will depend on the specific characteristics of the international basin. Examples of drought mitigation mechanisms include immediate consultations between the respective states (for example, 1996 Ganges River Agreement), stricter irrigation procedures given low river levels (for example, 1997 Cuareim River Agreement), water allocation adjustments (for example, 1970 Lake Lanoux Agreement), and set reservoir releases and data sharing (for example 1989 Vuoksi River/Lake Saimaa Agreement).
Pertaining to flood issues, the establishment of specific flood-control mechanisms (for example, transboundary warning systems and information exchange) is likewise important. This is particularly noteworthy since a portion of available treaties in the TFDD which pertain to flood-control institute relatively vague stipulations. The 1964 Vistula River Agreement, for example, pertains to flood issues but only stipulates that the respective signatories agree to cooperate in order to undertake coordinated action to prevent flood damage. In her study of transboundary flood and institutional capacity Bakker (2009) finds that, on average, death and displacement tolls were lower in the basins with flood-related institutional capacity (which included flood-related treaty mechanisms).
Treaties were rated for the presence of either form of variability management, whether it was flood-control mechanisms or provisions for dealing with drought. In some cases, a treaty may contain stipulations for both of these forms of variability management.
Conflict resolution
The presence of a conflict resolution mechanism, such as third-party involvement or arbitration, could prove invaluable. The extent to which a treaty stipulates how disputes are to be resolved among the parties relates to the level of confidence the parties may have that their concerns will be met in an amicable and safe environment. Preliminary quantitative work has found that, together with enforcement and monitoring, conflict resolution mechanisms are particularly important in assuaging the intensity of country grievances (Dinar et al. 2008). We rated each treaty for the presence of any form of conflict resolution.
River basin organizations
Another mechanism that further signals that the treaty is more institutionalized and may, in turn, overcome challenges across time is the existence of a joint commission or a river basin
10
organization (hereinafter, both are collectively referred to as RBOs). In addition to being mandated with proposing water plans and projects for implementation, the RBO may also have conflict resolution, monitoring and/or enforcement mandates. Since the RBO is often made up of fellow technocrats, known also as an epistemic community, it is more likely that cooperation is facilitated given that these individuals often share a similar notion of ‘principled and normative beliefs’ (Haas 1992). In her study of the Indus Basin, for example, Zawahri (2009) finds that the joint commission established has essentially played an invaluable role in the Indus Waters Treaty’s implementation since 1960. According to Zawahri, it is in large part due to the overwhelming success of the joint commission to negotiate, monitor, and manage the Indus regime that stable cooperation over water has existed between the two riparians since the treaty’s inception. In contrast, Zawahri claims that the relative lack of a vigorous commission (the Joint Technical Commission) in the Tigris-Euphrates basin has resulted in the large failure of cooperation among Turkey, Syria, and Iraq. As is apparent for this last discussion of international RBOs, it is not only the mere existence of such a body that matters but its quality and mandate as well. Similar to our reasoning for allocation mechanisms and since there is no ‘ideal’ RBO structure, composition, or functioning, we focus here on only the presence or absence of a RBO, rather than attempting to rate the quality of RBOs. A global database of RBOs has been created as part of prior work (Bakker 2007) and ongoing research aimed at updating and expanding the information in the TFDD was also used (Schmeier and Ogden 2009). These data were used to identify all CBUs with at least one RBO, and in the few cases where an RBO has been established but the TFDD does not contain the establishing text and there are no other water treaties for the CBU, the affected CBU is also marked as having at least one water treaty.
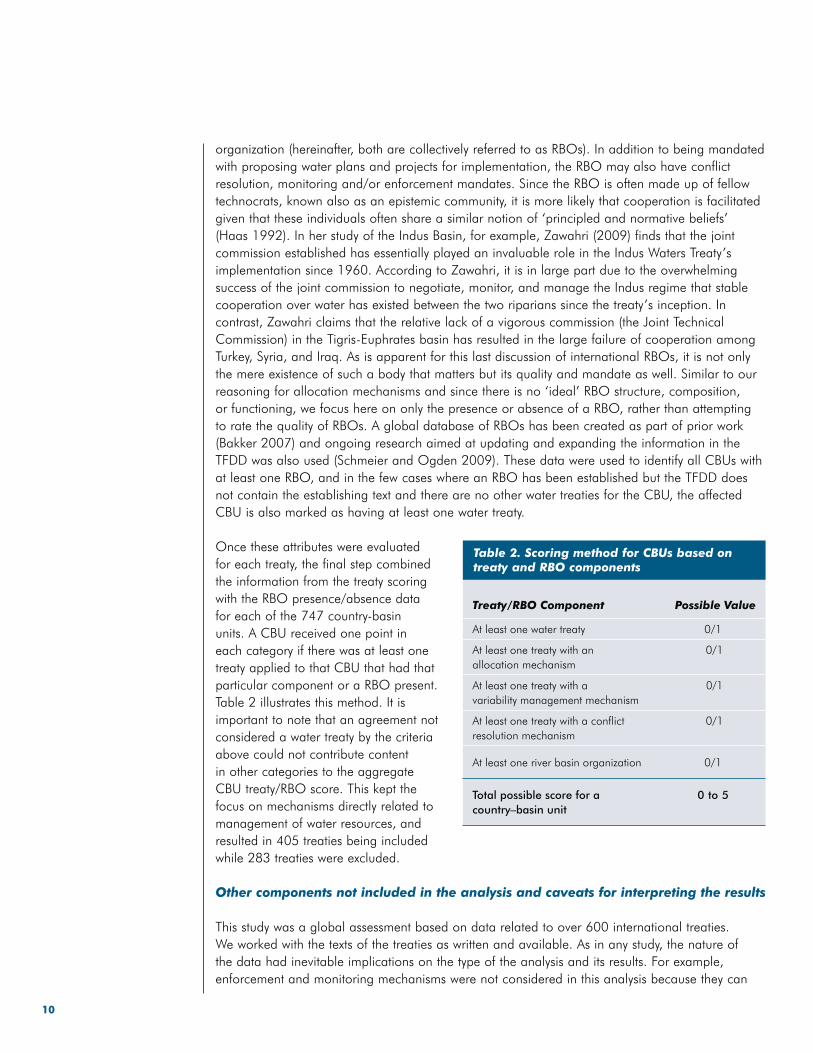
Once these attributes were evaluated for each treaty, the final step combined the information from the treaty scoring with the RBO presence/absence data for each of the 747 country-basin units. A CBU received one point in each category if there was at least one treaty applied to that CBU that had that particular component or a RBO present. Table 2 illustrates this method. It is important to note that an agreement not considered a water treaty by the criteria above could not contribute content in other categories to the aggregate CBU treaty/RBO score. This kept the focus on mechanisms directly related to management of water resources, and resulted in 405 treaties being included while 283 treaties were excluded.
Other components not included in the analysis and caveats for interpreting the results
This study was a global assessment based on data related to over 600 international treaties. We worked with the texts of the treaties as written and available. As in any study, the nature of the data had inevitable implications on the type of the analysis and its results. For example, enforcement and monitoring mechanisms were not considered in this analysis because they can
Table 2. Scoring method for CBUs based on treaty and RBO components
Treaty/RBO Component Possible Value
At least one water treaty 0/1
At least one treaty with an allocation mechanism
0/1
At least one treaty with a variability management mechanism
0/1
At least one treaty with a conflict resolution mechanism
0/1
At least one river basin organization 0/1
Total possible score for a country–basin unit
0 to 5

11
be either explicitly included in the international water treaty or be a part of the purview of RBOs. Since our study was based only on the analysis of water treaties and not on the specific functioning of RBOs, including monitoring and enforcement as indicators would have provided an inaccurate picture of the overall treaty/RBO capacity. For the same reason, our study could not measure other issues that can have a great influence on treaty/RBO resilience but that cannot be gauged through the textual analysis of the existing treaties. These included aspects such as treaty equity, existence of embedded conflicts among riparians, or the level of treaty implementation. Similarly, it should be noted that each of the variables we identify within the text of treaties might function differently (or not at all) when implemented in the real world, depending on the basin context. This could possibly occur to the detriment of constituent riparians; in fact, in some cases, the treaties themselves can be considered a source of conflict. Nevertheless, the purpose of this global study is solely to act as a filter to help identify locations that may be worthy of closer study.
For these reasons, it was inevitable that, in some cases, our methodology over- or underestimated the actual treaty/RBO capacity when compared to expert opinion or detailed local case studies. Hence, our CBUs classification could yield good treaty/RBO coverage for an area where the treaties are not, in fact, functioning to confer resilience to climate-driven water variability. This could occur because the parties no longer abide by that treaty or due to other factors such as historical legacies or sociopolitical contexts that undermine treaty functioning. Underestimation of treaty/RBO capacity occurred when basins that have resilient institutions in place were identified as low in treaty/RBO coverage by the methodology. This could happen if a treaty was missing from our database, but may primarily result when non-treaty sources of resilience, discussed in the introduction, provide effective mechanisms for confronting present and future variability.
This study provided a broad portrait of treaty and RBO capacity at a global level and highlighted global trends. Since we had to apply a coherent methodology to a specific set of global data, the reader should not expect the precision and richness of nuances typical of a case study approach, which, in turn, lacks a global perspective. Rather than treating these results as the final word on the coverage of treaty and RBO institutions capable of addressing the challenges of climate change, this work provided a first pass at identifying basins at risk due to a lack of institutional capability. From this work, further research has to be done by narrowing the focus to individual basins or regions and examining the actual expression of the treaties applied to those areas and other factors that will foster or inhibit resilience of transboundary basins to climate change.
Baseline water variability and future variability change
In terms of the actual allocation of river water, agreements and treaties often define continuous rates or seasonal or annual water volumes. In many cases rivers are regulated to ensure compliance with international agreements. Both in regulated and in free-flowing rivers, however, the interannual climatic variability can have an impact on the water flowing through the countries’ boundaries. In many regions of the world flow fluctuations can occur over longer time scales, for example by varying systematically with the five to seven year El Niño Southern Oscillation (ENSO) cycle or similar phenomena.
Ken Strzepek and Alyssa McCluskey (2009) who developed historic and future hydrologic indicators for the World Bank’s Water and Climate Change project (World Bank 2009a) provided quantitative values capturing water variability in each CBU. Based on precipitation input from the climate model and runoff from the hydrological model, among other indicators they calculated the coefficient of variation (CV) for these two variables, which is defined as the standard deviation divided by the

12
mean of all annual values within a given time period. This indicator was provided to this study for a historic baseline period of 1961–1990 and for future scenarios derived from running the hydrological model CLIRUN II with climate data from GCM runs using three SRES scenarios (World Bank 2009a). In order to cover the range of climate predictions simulated by the 22 different General Circulation Models (GCMs) available via the Fourth Assessment Report of the IPCC (AR4), World Bank researchers (2009a) identified and reported one Driest (DRY), Middle (MED) and Wettest (WET) scenario for each World Bank region based on the extremes and the median response of a ‘climate moisture index’ under all 22 models. Consequently, for each CBU used in this study the values of CVs for future DRY, MED, WET scenarios are based on the classification for each corresponding World Bank region. As these regions are groups of countries, different CBUs of the same river basin may belong to different regions and thus for a particular scenario may have CV values that were derived from different climate models. For example, the WET/MED/DRY scenario selection for the Ethiopian share of the Nile River basin is based on the ranking of models in the Africa Bank region. For the share of the Nile basin in Egypt, however, the selection is based on the ranking of model results for the Middle East and North Africa Bank region.
The CV of the two variables ‘precipitation’ and ‘runoff’ for each of the three scenarios were available to this study for two future time-slices: 2025–2035 (referred to as ‘2030’) and 2045–2055 (‘2050’), as well as historic baseline data for 1961–1990 (referred to as ‘present’). Variability was categorized for further analysis and mapping by classifying the CV into three groups following Vörösmarty et al. (2005). “Low” was less than 0.25, “medium” was 0.25 to 0.75 and “high” was greater than 0.75. Histograms of present CV values of annual precipitation and runoff in the CBUs show that the largest share of CBUs have precipitation CVs of less than 0.25, while runoff CVs also fall frequently into the classes of 0.25 to 0.75 (Figure 3). Only a small number of CBUs had CVs higher than 0.75. This difference illustrated the amplified variability of surface water availability versus precipitation (climate), highlighting the importance of looking not only at climate, but the effects of climate patterns on hydrology as well.
Figure 3. Histograms of the present (1961–1990) CV values for runoff (left panel) and precipitation (right panel)
0
50
100
150
200
250
300
350
400
0
100
200
500
300
400
600
700
Runoff CV Precipitation CV
Cou
nt
Cou
nt
0-0.
250
0.25
-0.5
0.5-
0.75
0.75
-11-
1.25
1.25
-1.5
1.5-
1.75
1.75
-22-
2.25
2.25
-2.5
2.5-
2.75
2.75
-33-
3.25
3.25
-3.5
0-0.
250
0.25
-0.5
0.5-
0.75
0.75
-11-
1.25
1.25
-1.5
1.5-
1.75
1.75
-22-
2.25
2.25
-2.5
2.5-
2.75
2.75
-33-
3.25
3.25
-3.5

13
There are clear spatial patterns in the interannual runoff variability, with the highest values generally found in transitional climate zones such as the outer tropics and sub-tropics, while core areas of the polar and tropical climate regions experience low variability (Figure 4). Precipitation variability is lower overall than the runoff variability. This systematic difference is similar to other studies that analyzed and compared the CV of annual precipitation and runoff around the world (for example, Peel et al. 2001). According to Peel et al. (2001) the variability of annual runoff is higher as it depends not only on the interannual variability of precipitation but also on the amount of precipitation which influences the amount of actual evapotranspiration, which also depends on the vegetation. Furthermore, the seasonality and timing of precipitation and, consequently, how and when water enters the river system will contribute to an increased interannual runoff variability compared to that of precipitation (World Bank 2009a). Figure 4 shows maps of CVs for the
Figure 4. Global distribution of the coefficient of variation of annual precipitation and runoff for the country-basin-units for the historic period 1961–1990

14
historic period for precipitation (upper panel) and runoff (lower panel). These data are displayed here in increments of 0.125 to show detail, but for the remainder of the report they are displayed using the ‘low’, ‘medium’ and ‘high’ classes defined above.
The absolute changes in CVs obtained by the scenario modeling experiments are generally very low. Figure 5 shows box plots of the relative changes of the future scenario periods compared to the historic periods for runoff variability. The distributions indicate that for the majority of CBUs the CV of annual runoff is predicted to increase. However there are also CBU’s where a decrease is predicted. There is no consistent CV change for different scenarios ranging from DRY to WET, nor is there a consistent further increase in 2050 over 2030. Figure 6 shows the global distributions of projected precipitation variability from each scenario for both time periods, and Figure 7 shows the projected runoff variability from each scenario for both time periods.
Identifying areas of hydrologic exposure required an assessment of both the historic variability regimes and the change that can be expected in variability in the future. We focused on runoff CV as our variable of interest since, as discussed above, the interannual variability of precipitation does not directly translate into runoff variability. To identify areas of likely future increases in runoff variability, the relative change from the historic regime was calculated for each CBU. The increase in the interannual runoff coefficient of variation was calculated for each climate scenario and year as the percent change from the historic runoff CV. These increases were partitioned into three categories of increase: “low/none” signifies any change less than a 5% increase, “moderate” is a 5–15% increase and “high” is an increase greater than 15%.5
For the purposes of this analysis, we focused on the middle climate scenario. This choice was made to represent the middle-ground of uncertainty over future changes in climate. The middle scenario projected changes that had a moderate impact on the climate moisture index
5 There were 12 CBUs that appeared to not be modeled for either historic or projected variability, and these were grouped with low variability for the present, but excluded from the projected change. For this reason, tables involving future variability change will not have all 747 CBUs.
Figure 5. Box plots for the different climate scenarios showing the distribution of the relative changes of future CVs as compared to historic CVs in CBU runoff
Rela
tive
Cha
nge
of R
unof
f CV
(in %
) 40
20
0
–20
–40
DRY_2030 MED_2030 WET_2030 MED_2050 WET_2050DRY_2050

15
Figure 6. Global distribution of projected precipitation CVs for 2030 and 2050 for the Driest, Middle, and Wettest scenarios
for each region, and represented the median estimate of future climate changes as opposed to drier or wetter outcomes forecast by the Driest and Wettest scenarios respectively. This choice was also consistent with the use of the A1B scenario for emissions forecasting, and allowed us to more clearly interpret the outcomes of our risk assessment. However, the results of the hazard and risk assessments for the other two climate scenarios are given in Appendices 6, 8, 9 and 11.

16
Combining treaty/RBO coverage with variability and variability change
Risk is generally regarded as a combination of natural or environmental hazard and sociopolitical or socioeconomic vulnerability. We then define three sets of risk by combining each set of hydrological hazard classes and the vulnerability signified by institutional arrangements. For this
Figure 7. Global distribution of projected runoff CVs for 2030 and 2050 for the Driest, Middle, and Wettest scenarios
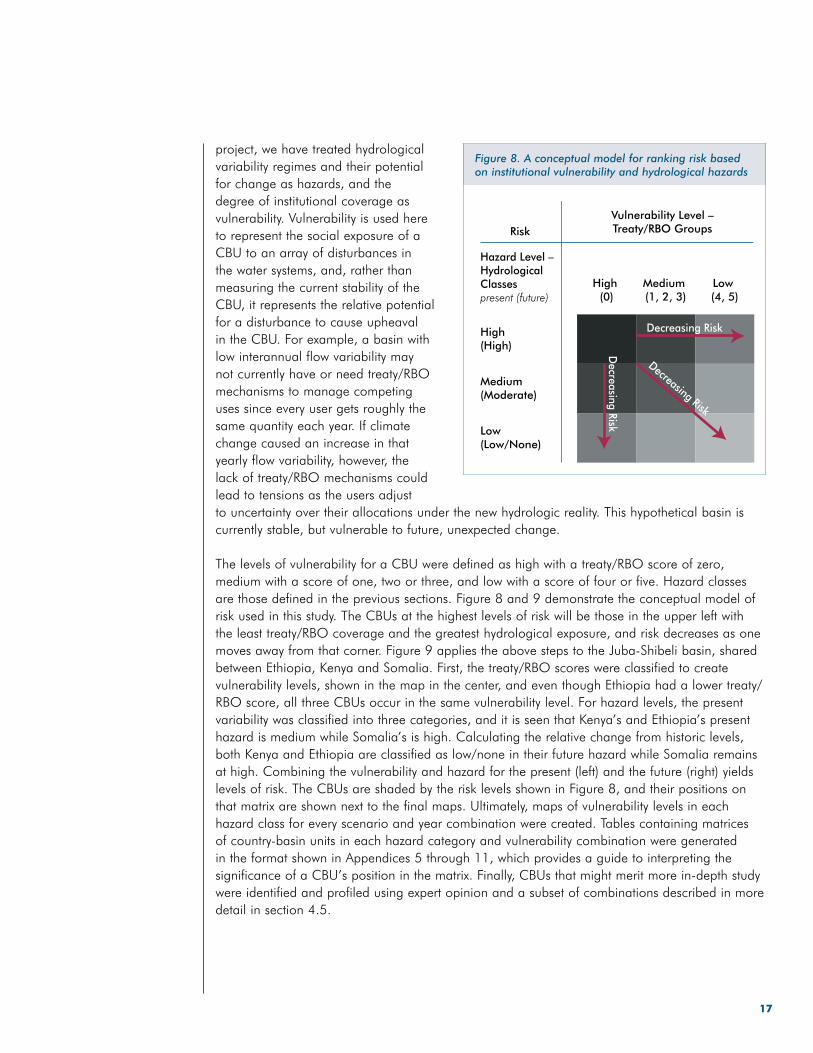
17
project, we have treated hydrological variability regimes and their potential for change as hazards, and the degree of institutional coverage as vulnerability. Vulnerability is used here to represent the social exposure of a CBU to an array of disturbances in the water systems, and, rather than measuring the current stability of the CBU, it represents the relative potential for a disturbance to cause upheaval in the CBU. For example, a basin with low interannual flow variability may not currently have or need treaty/RBO mechanisms to manage competing uses since every user gets roughly the same quantity each year. If climate change caused an increase in that yearly flow variability, however, the lack of treaty/RBO mechanisms could lead to tensions as the users adjust to uncertainty over their allocations under the new hydrologic reality. This hypothetical basin is currently stable, but vulnerable to future, unexpected change.
The levels of vulnerability for a CBU were defined as high with a treaty/RBO score of zero, medium with a score of one, two or three, and low with a score of four or five. Hazard classes are those defined in the previous sections. Figure 8 and 9 demonstrate the conceptual model of risk used in this study. The CBUs at the highest levels of risk will be those in the upper left with the least treaty/RBO coverage and the greatest hydrological exposure, and risk decreases as one moves away from that corner. Figure 9 applies the above steps to the Juba-Shibeli basin, shared between Ethiopia, Kenya and Somalia. First, the treaty/RBO scores were classified to create vulnerability levels, shown in the map in the center, and even though Ethiopia had a lower treaty/RBO score, all three CBUs occur in the same vulnerability level. For hazard levels, the present variability was classified into three categories, and it is seen that Kenya’s and Ethiopia’s present hazard is medium while Somalia’s is high. Calculating the relative change from historic levels, both Kenya and Ethiopia are classified as low/none in their future hazard while Somalia remains at high. Combining the vulnerability and hazard for the present (left) and the future (right) yields levels of risk. The CBUs are shaded by the risk levels shown in Figure 8, and their positions on that matrix are shown next to the final maps. Ultimately, maps of vulnerability levels in each hazard class for every scenario and year combination were created. Tables containing matrices of country-basin units in each hazard category and vulnerability combination were generated in the format shown in Appendices 5 through 11, which provides a guide to interpreting the significance of a CBU’s position in the matrix. Finally, CBUs that might merit more in-depth study were identified and profiled using expert opinion and a subset of combinations described in more detail in section 4.5.
Figure 8. A conceptual model for ranking risk based on institutional vulnerability and hydrological hazards
Risk
High (High)
Decreasing Risk
Decreasing Risk
Decreasing Risk
High (0)
Medium (Moderate)
Medium (1, 2, 3)
Low (Low/None)
Low (4, 5)
Hazard Level – Hydrological Classespresent (future)
Vulnerability Level –Treaty/RBO Groups

18
Figure 9. An example of how the conceptual model of risk is applied to a particular basin. The top three maps show the vulnerability levels in between the present hazard levels (left) and the future hazard levels (right), while the lower maps show the combined risk and where that risk falls on the matrix from Figure 8
present(future)present(future)
Note: Future change is for 2030-Middle scenario (Strzepek and McCluskey 2009).

19
CHAPTER 4: RESULTS
The country-basin unit database
In creating the country-basin database, 276 transboundary basins and 148 riparian countries were combined to yield 747 country-basin units. These units cover a total of 61,962,000 km2 of the earth’s surface and average 83,000 km2 per CBU. There are an average of three countries per basin, and five basins per country. Population numbers range from essentially no inhabitants in many high-latitude basins to almost 630 million people in the Indian portion of the Ganges-Brahmaputra-Meghna basin. A total of approximately 2.748 billion people live within transboundary river basins, and on average each CBU has 3.7 million people.
Vulnerability: Treaty scope scoring and RBO presence/absence
Appendix 2 lists the data collected in each content category and the score that each treaty received and Appendix 3 lists the RBO presence/absence results for each CBU. Appendix 4 lists the scores each CBU received in each category and the total treaty/RBO score. The treaty/RBO scoring analysis yielded a variety of findings. Table 3 shows the number of CBUs with at least one treaty containing each component.
Table 3. The number of CBUs that have each treaty component and RBO presence/absence, globally and by World Bank region, with the percentage of the total CBUs for each region in parentheses
Individual Treaty and RBO components
World Bank Region (Total # of CBUs in each region)
Africa(186)
East Asia and the Pacific
(68)
Europe and
Central Asia(137)
Latin America
and Caribbean
(151)
Middle East and
North Africa(39)
South Asia(23)
Combined High
Earning Economies
(139)Total(747)a
At least one water treaty
101(54%)
21(31%)
8058%)
56(37%)
16(41%)
9(39%)
106(76%)
389 (52%)
Allocation mechanism
49(26%)
13(19%)
26(19%)
20(13%)
13(33%)
6(26%)
80(58%)
207 (28%)
Variability management mechanism
40(22%)
12(18%)
38(28%)
9(6%)
5(13%)
5(22%)
48(35%)
157 (21%)
Conflict resolution mechanism
70(38%)
12(18%)
56(41%)
22(15%)
10(26%)
5(22%)
86(62%)
261 (35%)
At least one river basin organization
80(43%)
10(15%)
30(22%)
40(26%)
6(15%)
5(22%)
75(54%)
246 (33%)
a The total here includes the four CBUs classified as N.A. mentioned in footnote 4 on page 4, but these CBUs are not included in any of the data below.

20
The most frequent component is the presence of a water treaty while variability management is the least frequent component globally. For each component, CBUs in the OECD/OHIE group consistently had the highest proportion of total CBUs. Aside from these, AFR and ECA had relatively high proportions as well. LCR and EAP regions had the lowest proportions of CBUs on average (20% and 19% respectively). Allocation mechanisms were most frequent in MNA and least frequent in LCR and the pattern was similar for variability management mechanisms. With respect to conflict resolution, the ECA region had the highest frequency of occurrence while LCR again had the lowest. RBOs are most common in AFR and least so in the EAP and MNA regions. It is important to note that within these regions, each CBU may have one or several treaties that provide each of these mechanisms, and this fact is not represented in Table 3.
The second stage of this analysis scored CBUs by aggregating their treaty and RBO component ratings into a final treaty/RBO score. The global distribution of scores is shown in Figure 10, while Table 4 shows the number of CBUs that received each treaty/RBO score and the breakdown of scores and CBU counts by World Bank regions. Overall, the largest group of CBUs had a score of zero and most of these were in AFR and EAP. The group scoring five was found to be the third largest and the differences in number of CBUs between the other scores was not large.
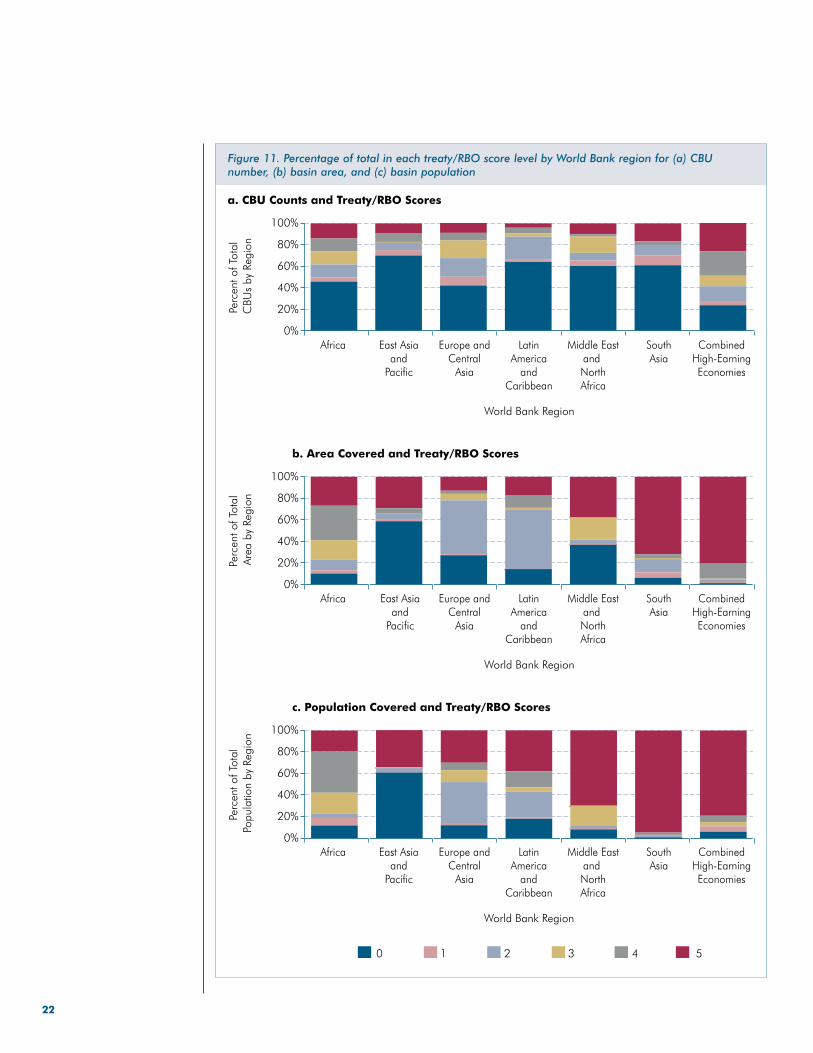
While it was a useful start to look at the absolute number of CBUs with each score, perhaps more interesting was how the scores are distributed as a percent of the total CBUs in a region, the area covered or the population affected. To illustrate this distribution, stacked plots were presented in the three panels of Figure 11 showing the percentage of the region that was covered by each treaty/RBO score in three categories. To derive these plots, the total number of CBUs, the total
Table 4. The number of CBUs receiving each treaty/RBO score grouped by World Bank regions and in total, with the percentage of the total CBUs for each region in parentheses
Treaty/RBO Score
World Bank Region (Total # of CBUs in each region)
Africa(186)
East Asia and the Pacific
(68)
Europe and
Central Asia(137)
Latin America and the
Caribbean(151)
Middle East and
North Africa(39)
South Asia(23)
Combined High
Earning Economies
(139)Total(747)
0 85(46%)
47(69%)
57(42%)
95(63%)
23(59%)
14(61%)
33(24%)
354 (47%)
1 8(4%)
4(6%)
11(8%)
4(3%)
2(5%)
2(9%)
5(4%)
36(5%)
2 22(12%)
5 7%)
24(18%)
33(22%)
3(8%)
2(9%)
19(14%)
108 (14%)
3 22(12%)
0(0%)
22(16%)
5(3%)
6(15%)
0(0%)
13(9%)
68(9%)
4 23(12%)
6(9%)
10(7%)
8(5%)
1(3%)
1(4%)
32(23%)
81(11%)
5 26(14%)
6(9%)
13(9%)
6(4%)
4(10%)
4(17%)
37(27%)
96(13%)

21
population within international basins and the total area of international basins in each region were calculated. The percentages of CBUs, area or population that fall into each score level are then represented in the stacked plot, so each can be interpreted as demonstrating the relative coverage of CBU numbers, area and population for each region.
Differences among these representations of treaty/RBO coverage by region were helpful in assessing the implications of the score distributions. When looking at the percentage of total CBUs by region (Figure 11a) for example, there were large proportions of CBUs in the SAR and LCR regions that did not have high levels of treaty/RBO coverage. This differed remarkably from the data presented in Figure 11b and c. Much of the area and nearly all the population in SAR were covered by the highest treaty/RBO score, and a similar compression of the lower treaty/RBO scores was observed for LCR. By contrast, the score distributions in the EAP region did not change appreciably between the different variables, indicating that a much larger proportion of the population and area in EAP basins had little treaty/RBO coverage. These findings were significant because basins with few people or covering a very small area are not as likely to experience the same level of stress resulting from low institutional resilience that might be expected of larger or more populous basins.
There were a number of basins that had large disparities among constituent CBUs in their treaty and RBO coverage. The range between the lowest-scoring and highest-scoring CBUs in a basin is a measure of disparity in coverage. The detected disparities show the value of using a CBU approach instead of the river basin approach previously used in most of the global-scale analyses of transboundary basins. Indeed, a CBU analysis allowed us to go beyond the
Figure 10. The global distribution of treaty/RBO scores following aggregation to the CBU of all treaty scoring
22
Figure 11. Percentage of total in each treaty/RBO score level by World Bank region for (a) CBU number, (b) basin area, and (c) basin population
East Asiaand
Pacific
Europe andCentral
Asia
LatinAmerica
andCaribbean
Middle Eastand NorthAfrica
SouthAsia
Africa CombinedHigh-EarningEconomies
East Asiaand
Pacific
Europe andCentral
Asia
LatinAmerica
andCaribbean
Middle Eastand NorthAfrica
SouthAsia
Africa CombinedHigh-EarningEconomies
0%
20%
40%
60%
80%
100%
0%
20%
40%
60%
80%
100%
a. CBU Counts and Treaty/RBO Scores
b. Area Covered and Treaty/RBO Scores
c. Population Covered and Treaty/RBO Scores
Perc
ent o
f Tot
al
CBU
s by
Reg
ion
Perc
ent o
f Tot
al
Area
by
Regi
on
World Bank Region
World Bank Region
East Asiaand
Pacific
Europe andCentral
Asia
LatinAmerica
andCaribbean
Middle Eastand NorthAfrica
SouthAsia
Africa CombinedHigh-EarningEconomies
0%
20%
40%
60%
80%
100%
Perc
ent o
f Tot
al
Popu
latio
n by
Reg
ion
World Bank Region
0 1 2 3 4 5

23
river basin and reveal sub-basin institutional weaknesses on a global scale. Eight basins had a range of five, meaning at least one CBU had all components while another CBU in the same basin had no components. These basins were the Amur, Aral Sea, Elbe, Ganges-Brahmaputra-Meghna, Garonnne, Indus, Rhine, and Tigris-Euphrates/Shatt al Arab basins. Together, these basins encompass 1.448 billion people and 7.244 million km2. An additional nine basins had a range of four, including the Congo/Zaire, Danube, Har Us Nur, Jordan, Niger, Okavango, Po, Pu Lun T’o, and Struma basins. These basins together encompass 373.7 million people and 7.688 million km2. Seven additional basins had a range in scores of three for their constituent CBUs, while many basins had small ranges of one or two. Conversely, of the 393 basins with at least one treaty in place, 74 basins were fully coherent and had the same non-zero treaty/RBO scores for all constituent CBUs, including a number of basins with more than two constituent CBUs.
Hazard: Hydrologic exposure, variability and future change in variability
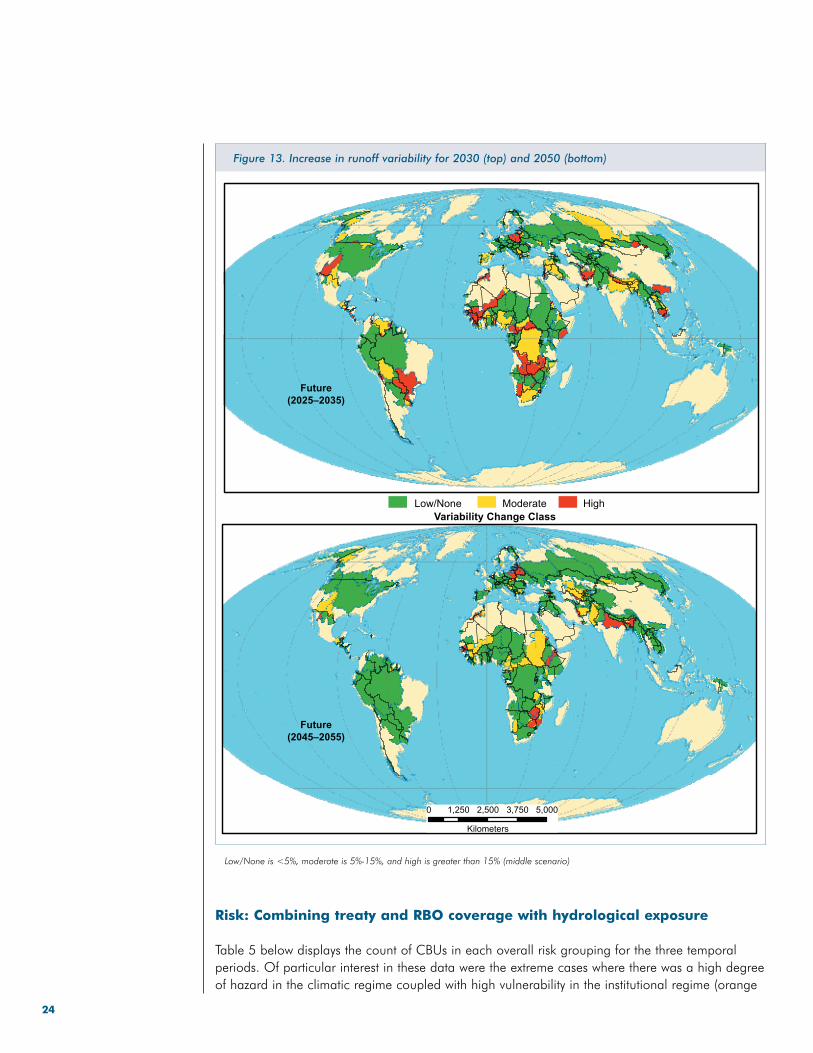
Figure 12 and Figure 13 below show the global distributions of present variability classes and future variability change classes, respectively. Much more categorical differentiation was apparent in present variability than in the variability change, and fewer areas were in the high future change class for 2050 than for 2030. There may be several reasons for this, such as the difference in sample sizes for the two datasets (the present variability is averaged over 30 years while each future time slice is only averaged over 10 years) or the thresholds chosen to bin future variability change. For a discussion of spatial trends observed in this data, see Chapter 3.
Low is a CV<0.25, medium is a CV of 0.25–0.75, and high is a CV>0.75
Figure 12. Global distribution of present runoff variability classes (1961–1990)
24
Figure 13. Increase in runoff variability for 2030 (top) and 2050 (bottom)
Low/None is <5%, moderate is 5%-15%, and high is greater than 15% (middle scenario)
Risk: Combining treaty and RBO coverage with hydrological exposure
Table 5 below displays the count of CBUs in each overall risk grouping for the three temporal periods. Of particular interest in these data were the extreme cases where there was a high degree of hazard in the climatic regime coupled with high vulnerability in the institutional regime (orange

25
highlighting in Table 5). There were 35 CBUs at high risk under current variability conditions, while 86 and 25 were in the highest risk groups for 2030 and 2050, respectively. As the classification used for the future represents risk as a change from the present variability regime while the present classification represents risk as the present variability regime itself, differences in the distributions of risk between present and the future should not be directly compared as changes in risk. In other words, if a basin is presently at risk due to its variability regime, but does not have a high enough degree of change in the future to qualify as at high risk in 2030 or 2050, this does not mean that it is no longer at risk overall. Rather, classifications of present and future risk for a particular CBU should be interpreted as two dimensions of risk that, when examined together, can provide greater insight about the hydrological hazard a CBU may face. Because risk is measured the same way in 2030 and 2050, changes between these risk distributions can be interpreted as temporal variations in future risk. In general, there was less risk in 2050 relative to 2030, with substantial shifts of high-risk CBUs to the lower future risk classes. Our classifications yielded greater proportions of CBUs in medium risk classes for present variability, while the majority of CBUs are in lower risk classes in the future. The relationships between present and future risk are examined more fully in the sections titled “Risk related to run-off variability change by 2030” and “Risk related to run-off variability change by 2050”.
To illustrate our findings, the CBUs that fell into each hazard category of variability or variability change are displayed on separate maps and the treaty/RBO vulnerability groupings of those CBUs were shown thematically. The resulting maps (figures 14, 15, 16, 18–24) can be interpreted as displaying the global distribution of treaty/RBO vulnerability or coverage levels under each hydrological regime (present variability—low, medium, high) or regime shift scenario (future variability change—low/none, moderate, high).
Risk related to present-day runoff variability
When considering the distribution of risk in the present period, there were clear spatial concentrations of CBUs at high risk. Out of a total of 35 highest-risk CBUs, 15 were located in AFR and the MNA region (Table 6). Figure 14, Figure 15 and Figure 16 show the global distribution of vulnerability levels in each present variability hazard level (high, medium and low, respectively). A combined list of the high, medium and low hazard levels for present day runoff variability is presented in Appendix 5.
Table 5. The number of CBUs falling into each risk group for present and projected future periods
Hazard Level (Hydrological)
Vulnerability Level (Treaty/RBO score)
Present VariabilityFuture Variability
Change–2030 MiddleFuture Variability
Change–2050 Middle
High Medium Low High ModerateLow/None High Moderate
Low/None
High (0) 35 181 141 86 76 188 25 70 255
Medium (1, 2, 3) 15 131 67 39 56 114 38 37 134
Low (4, 5) 15 111 51 34 44 98 7 35 134
Note: The highest risk levels for each time period are highlighted in white.

26
Table 6. Country-basin units in the highest risk level (high vulnerability and high hazard) for the present period
Country-basin unit
Relative importance
Area Population Runoff Irrigated area
Mauritania – Atui 64.6% 87.01% N.A. N.A.
Western Sahara – Atui 35.4% 12.99% N.A. N.A.
Djibouti – Awash 7.1% 0.42% 0.0% 0.0%
Somalia – Awash 0.2% 0.11% 0.0% 0.3%
Iran – BahuKalat/Rudkhanehye 99.8% 99.81% N.A. 100%
Bolivia – Cancoso/Lauca 85.8% 96.09% 70.0% 100%
Chile – Cancoso/Lauca 14.2% 3.91% 30.0% 0.0%
Uganda – Congo/Zaire ≤0.05% 0.05% 0.0% 0.0%
Algeria – Daoura 47.3% 1.18% N.A. 0.0%
Morocco – Daoura 52.7% 98.82% N.A. 100%
Iran – Dasht 21.5% 4.32% N.A. 3.0%
Pakistan – Dasht 78.5% 95.68% N.A. 97.0%
Algeria – Dra 21.4% 0.29% 0.0% 4.0%
Ethiopia – Gash 22.5% 30.01% 42.0% 5.0%
Algeria – Guir 77.5% 81.44% N.A. 85.5%
Morocco – Guir 22.5% 18.56% N.A. 14.5%
Algeria – Lake Chad 3.8% 0.03% 0.0% 0.0%
Libya – Lake Chad 0.2% 0.00% 0.0% 0.0%
Sudan – Lake Chad 3.5% 6.79% 4.8% 4.5%
Sudan – Lake Turkana 0.7% 0.05% 0.1% 0.0%
Ethiopia – Lotagipi Swamp 8.4% 7.25% 40.3% N.A.
Kenya – Lotagipi Swamp 52.4% 63.31% 29.4% N.A.
Sudan – Lotagipi Swamp 34.1% 18.76% 30.2% N.A.
Uganda – Lotagipi Swamp 5.1% 10.69% 0.0% N.A.
Algeria – Niger 7.6% 0.01% 0.0% 0.0%
Algeria – Oued Bon Naima 36.6% 37.54% N.A. 15.2%
Morocco – Oued Bon Naima 63.4% 62.46% N.A. 84.8%
Togo – Oueme 0.7% 0.33% 0.0% 0.0%
Morocco – Tafna 25.4% 38.95% 0.0% 41.2%
Pakistan – Tarim 0.2% 0.05% 2.7% 0.0%
Saudi Arabia – Tigris-Euphrates/ Shatt al Arab
≤0.05% 0.00% 0.0% 0.0%
Kenya – Umba 16.9% 12.11% 88.0% 0.0%
Argentina – Zapaleri 19.8% 2.15% 100% N.A.
Bolivia – Zapaleri 21.7% 18.82% 0.0% N.A.
Chile – Zapaleri 58.5% 79.03% 0.0% N.A.
N.A. Not Available(1) % of the area of the total basin covered by the CBU(2) % of the population of the total basin in the CBU(3) % of the runoff of the total basin that occurs in the CBU(4) % of the runoff of the total basin that occurs in the CBU

27
Figure 14. The grouped treaty/RBO score coverage for all CBUs with high present variability in runoff
Figure 15. The grouped treaty/RBO score coverage for all CBUs with medium present variability in runoff

28
Risk related to runoff variability change by 2030
The highest level of risk due to variability change by 2030 under the Middle climate scenario included 86 CBUs. Many of these were CBUs with a minimal contribution to basin-wide population, area, and runoff, making it important to consider the contribution of each high-risk CBU to their basins. The highest-risk CBUs in 2030 were more spatially dispersed than in the present time period (1961–1990), with more CBUs from Central America, Eastern Europe and Indochina classified as highest risk than in the present risk categories. Bearing in mind the interpretive notes at the beginning of Section 4.4, Figure 17 shows the pair-wise distribution of the highest vulnerability CBUs (treaty/RBO score of zero) among the present and 2030 risk classes. The majority of CBUs in the medium present variability class were in the lowest change class, but a significant portion also occurred in the highest change class, indicating
Figure 16. The grouped treaty/RBO score coverage for all CBUs with low present variability in runoff
Figure 17. Distribution of high-vulnerability CBUs in pairs of present and future (2030) hazard classes
70
98
20
35 39
2
2944
13
Num
ber
of C
BUs
0
20
40
60
80
100
Present Variability Class
LowMedium
High High
ModerateLow/None
2030 Change Class
Labels are the number of CBUs in each pair
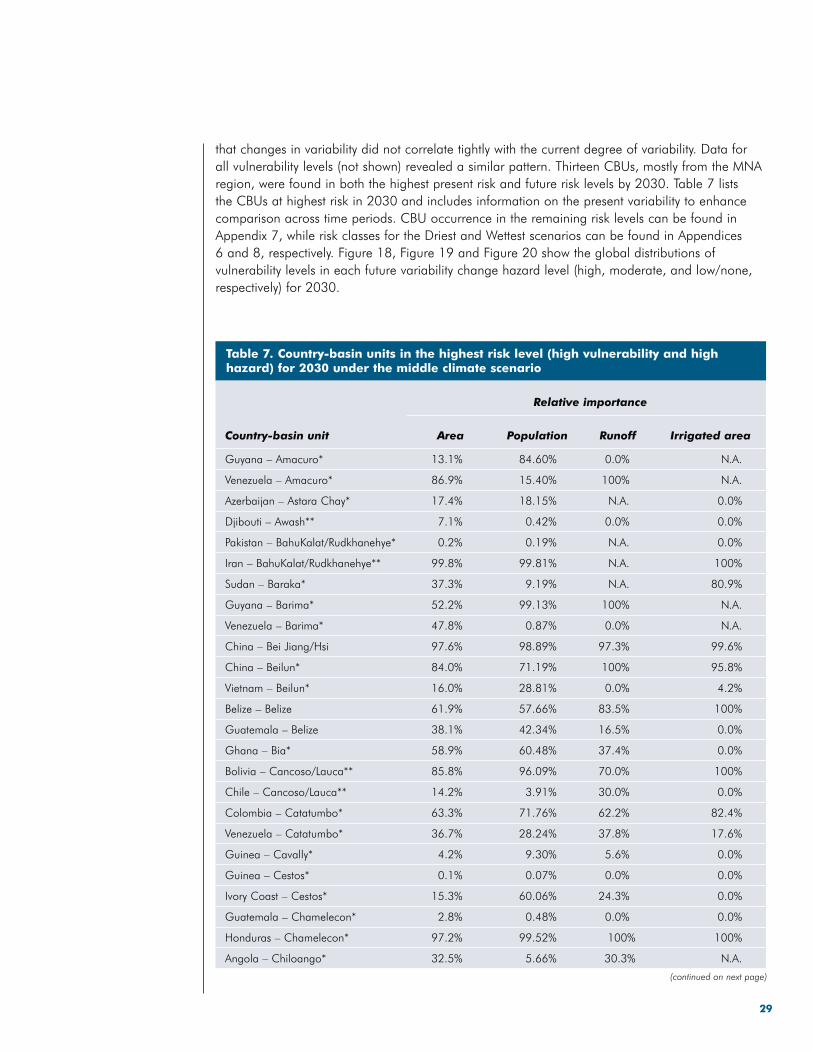
29
that changes in variability did not correlate tightly with the current degree of variability. Data for all vulnerability levels (not shown) revealed a similar pattern. Thirteen CBUs, mostly from the MNA region, were found in both the highest present risk and future risk levels by 2030. Table 7 lists the CBUs at highest risk in 2030 and includes information on the present variability to enhance comparison across time periods. CBU occurrence in the remaining risk levels can be found in Appendix 7, while risk classes for the Driest and Wettest scenarios can be found in Appendices 6 and 8, respectively. Figure 18, Figure 19 and Figure 20 show the global distributions of vulnerability levels in each future variability change hazard level (high, moderate, and low/none, respectively) for 2030.
(continued on next page)
Table 7. Country-basin units in the highest risk level (high vulnerability and high hazard) for 2030 under the middle climate scenario
Country-basin unit
Relative importance
Area Population Runoff Irrigated area
Guyana – Amacuro* 13.1% 84.60% 0.0% N.A.
Venezuela – Amacuro* 86.9% 15.40% 100% N.A.
Azerbaijan – Astara Chay* 17.4% 18.15% N.A. 0.0%
Djibouti – Awash** 7.1% 0.42% 0.0% 0.0%
Pakistan – BahuKalat/Rudkhanehye* 0.2% 0.19% N.A. 0.0%
Iran – BahuKalat/Rudkhanehye** 99.8% 99.81% N.A. 100%
Sudan – Baraka* 37.3% 9.19% N.A. 80.9%
Guyana – Barima* 52.2% 99.13% 100% N.A.
Venezuela – Barima* 47.8% 0.87% 0.0% N.A.
China – Bei Jiang/Hsi 97.6% 98.89% 97.3% 99.6%
China – Beilun* 84.0% 71.19% 100% 95.8%
Vietnam – Beilun* 16.0% 28.81% 0.0% 4.2%
Belize – Belize 61.9% 57.66% 83.5% 100%
Guatemala – Belize 38.1% 42.34% 16.5% 0.0%
Ghana – Bia* 58.9% 60.48% 37.4% 0.0%
Bolivia – Cancoso/Lauca** 85.8% 96.09% 70.0% 100%
Chile – Cancoso/Lauca** 14.2% 3.91% 30.0% 0.0%
Colombia – Catatumbo* 63.3% 71.76% 62.2% 82.4%
Venezuela – Catatumbo* 36.7% 28.24% 37.8% 17.6%
Guinea – Cavally* 4.2% 9.30% 5.6% 0.0%
Guinea – Cestos* 0.1% 0.07% 0.0% 0.0%
Ivory Coast – Cestos* 15.3% 60.06% 24.3% 0.0%
Guatemala – Chamelecon* 2.8% 0.48% 0.0% 0.0%
Honduras – Chamelecon* 97.2% 99.52% 100% 100%
Angola – Chiloango* 32.5% 5.66% 30.3% N.A.

30
Table 7. Country-basin units in the highest risk level (high vulnerability and high hazard) for 2030 under the middle climate scenario
Country-basin unit
Relative importance
Area Population Runoff Irrigated area
Congo, Democratic Republic of (Kinshasa) – Chiloango*
64.7% 92.82% 69.7% N.A.
Congo, Republic of the (Brazzaville) – Chiloango*
2.8% 1.52% 0.0% N.A.
Honduras – Coco/Segovia* 24.3% 8.04% 43.4% 7.3%
Nicaragua – Coco/Segovia* 75.7% 91.96% 56.6% 92.7%
Algeria – Daoura** 47.3% 1.18% N.A. 0.0%
Morocco – Daoura** 52.7% 98.82% N.A. 100%
Iran – Dasht** 21.5% 4.32% N.A. 3.0%
Morocco – Dra* 78.6% 99.71% 100% 96.0%
Venezuela – Essequibo 21.9% 12.59% 12.7% 0.0%
Belize – Grijalva ≤0.05% 0.00% 0.0% 0.0%
Algeria – Guir** 77.5% 81.44% N.A. 85.5%
Morocco – Guir** 22.5% 18.56% N.A. 14.5%
Turkmenistan – Hari/Harirud* 17.4% 6.35% 0.0% 21.7%
Pakistan – Helmand* 3.0% 1.68% 1.4% 0.4%
Belize – Hondo* 13.0% 8.81% 7.8% 2.3%
China – Indus* 7.5% 0.01% 19.0% 0.0%
Panama – Jurado 29.4% 26.48% N.A. N.A.
Burkina Faso – Komoe* 21.7% 21.34% 20.2% 39.5%
Ghana – Komoe* 2.9% 9.81% 0.0% 0.0%
Mali – Komoe* 0.8% 1.10% 0.0% 0.0%
Afghanistan – Kowl E Namaksar* 28.8% 6.60% 0.0% 3.0%
Libya – Lake Chad** 0.2% 0.00% 0.0% 0.0%
Guinea – Little Scarcies 31.0% 17.02% 30.5% 0.0%
Sierra Leone – Little Scarcies 69.0% 82.98% 69.5% 100%
Guinea – Loffa 11.5% 31.71% 0.0% N.A.
Liberia – Loffa 88.5% 68.29% 100% N.A.
Equatorial Guinea – Mbe 7.1% 34.41% 0.0% N.A.
Liberia – Moa 13.1% 7.50% 0.0% N.A.
Belize – Moho 76.1% 77.86% N.A. N.A.
Guatemala – Moho 23.9% 22.14% N.A. N.A.
Guatemala – Motaqua 88.5% 96.33% 91.3% 100%
Honduras – Motaqua* 11.5% 3.67% 8.7% 0.0%
Turkmenistan – Murgab* 40.2% 33.99% 10.0% 82.0%
(continued on next page)
(Continued)

31
Table 7. Country-basin units in the highest risk level (high vulnerability and high hazard) for 2030 under the middle climate scenario
Country-basin unit
Relative importance
Area Population Runoff Irrigated area
Syria – Nahr El Kebir* 86.4% 93.98% N.A. 100%
Algeria – Niger** 7.6% 0.01% 0.0% 0.0%
Togo – Oueme** 0.7% 0.33% 0.0% 0.0%
Mozambique – Pungwe* 94.3% 92.10% 77.0% 100%
Zimbabwe – Pungwe* 5.7% 7.90% 23.0% 0.0%
Malawi – Ruvuma* 0.3% 2.98% 0.0% 0.0%
Cambodia (Kampuchea) – Saigon 0.9% 0.01% 0.0% 0.0%
Vietnam – Saigon 99.1% 99.99% 100% 100%
Costa Rica – San Juan 30.1% 11.38% 46.0% 30.2%
Nicaragua – San Juan* 69.9% 88.62% 54.0% 69.8%
Cameroon – Sanaga 99.0% 99.48% 98.1% 100%
Belize – Sarstun 6.6% 0.60% 0.0% N.A.
Guatemala – Sarstun 93.4% 99.40% 100% N.A.
Guinea – Sassandra* 12.3% 6.50% 22.6% 0.0%
Cambodia (Kampuchea) – Song Vam Co Dong
49.2% 38.85% 36.5% 19.2%
Vietnam – Song Vam Co Dong 50.8% 61.15% 63.5% 80.8%
Guinea – St. John (Africa) 16.9% 25.95% 27.0% 0.0%
Liberia – St. John (Africa) 83.0% 74.05% 73.0% 100%
Liberia – St. Paul 55.5% 45.55% 63.7% 100%
Guinea – St. Paul* 44.5% 54.45% 36.3% 0.0%
Bulgaria – Struma* 58.2% 64.18% 81.3% 52.6%
Belize – Temash 85.0% 53.90% N.A. N.A.
Saudi Arabia – Tigris-Euphrates/Shatt al Arab**
≤0.05% 0.00% 0.0% 0.0%
Indonesia – Tjeroaka-Wanggoe* 62.4% 97.88% 45.0% N.A.
Papua New Guinea – Tjeroaka-Wanggoe
37.6% 2.12% 55.0% N.A.
Equatorial Guinea – Utamboni 40.9% 69.92% 43.9% N.A.
Israel – Wadi Al Izziyah* 32.2% 24.64% 100% 37.2%
Lebanon – Wadi Al Izziyah* 67.8% 75.36% 0.0% 62.8%
Note: CBUs marked with a “**” had a high present hazard level, while CBUs marked with a “*” had a medium present hazard level And CBUs with no asterisks had a low present hazard level.
(Continued)
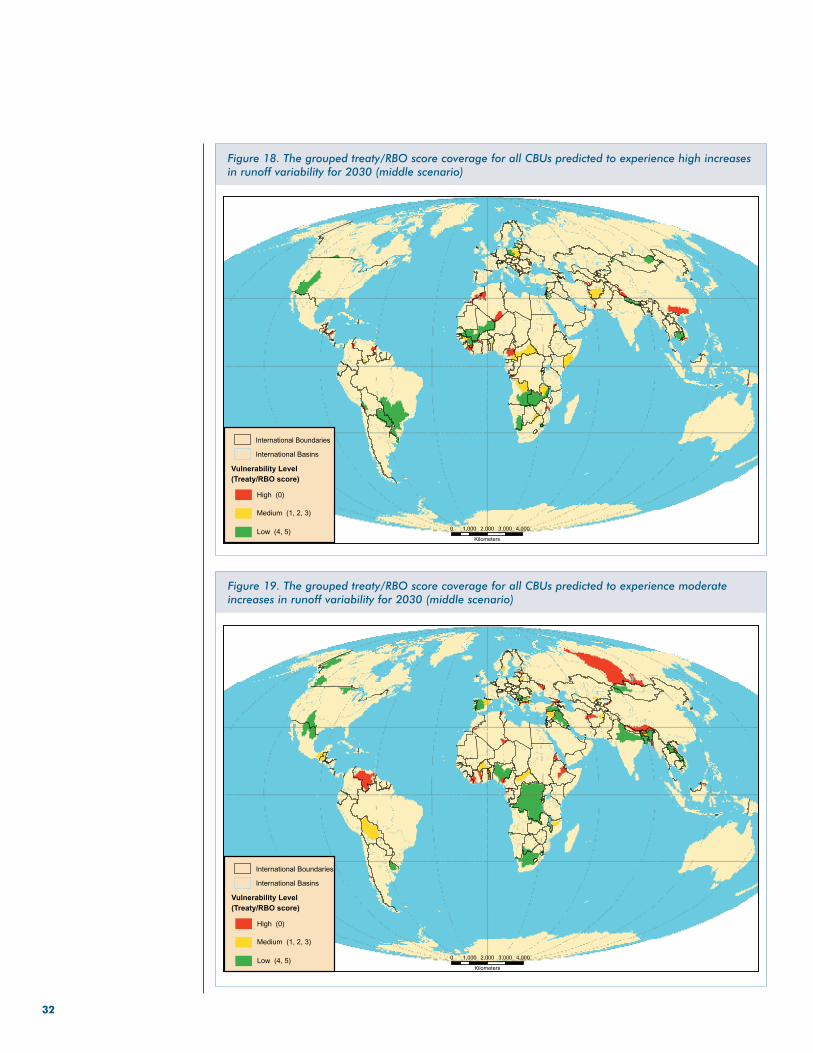
32
Figure 18. The grouped treaty/RBO score coverage for all CBUs predicted to experience high increases in runoff variability for 2030 (middle scenario)
Figure 19. The grouped treaty/RBO score coverage for all CBUs predicted to experience moderate increases in runoff variability for 2030 (middle scenario)

33
Risk related to runoff variability change by 2050
Compared to 2030, fewer CBUs were identified in the highest risk group. The 25 CBUs in this risk class are also more spatially dispersed than those in the highest present risk class. The highest risk occurred in central Asia, Eastern Europe and in many places in Africa. Bearing in mind the distinction between present risk and future risk, Figure 21 shows the pair-wise distribution of high vulnerability CBUs in present and 2050 hazard classes. The columns for high present variability class show that most of the CBUs were found in lower future hazard classes as compared to present hazard classes, and this pattern was more accentuated for the medium present variability class. There were very few CBUs that were in low present variability classes compared to higher future hazard classes. Only four CBUs, all in the MNA region, were found in the highest risk classes for both present and future.
Figure 20. The grouped treaty/RBO score coverage for all CBUs predicted to experience little or no increase in runoff variability for 2030 (middle scenario)
Figure 21. Distribution of high-vulnerability CBUs in pairs of present and future (2050) hazard classes.
Labels are the number of CBUs in each pair
Num
ber
of C
BUs
0Low
MediumHigh High
ModerateLow/None
Present Variability Class
2050 Change Class
20
40
60
80
100
120
140
106123
262540
5318
4

34
Table 8 lists the CBUs in the highest risk level with additional information about their present variability, and the remaining risk levels can be found in Appendix 10, while the risk classes for the Driest and Wettest scenarios can be found in Appendices 9 and 11, respectively. Figure 22, Figure 23 and Figure 24 show the global distributions of vulnerability levels in each future variability change hazard level (high, moderate and low/none, respectively) for this time period.
Table 8. Country-basin units in the highest risk level (high vulnerability and high hazard) for 2050 under the middle climate scenario
Country-basin unit
Relative importance
Area Population Runoff
Irrigated
area
Azerbaijan – Astara Chay* 17.4% 18.15% N.A. 0.0%
Ethiopia – Awash* 92.7% 99.47% 100% 99.7%
Djibouti – Awash** 7.1% 0.42% 0.0% 0.0%
Iran – BahuKalat/Rudkhanehye** 99.8% 99.81% N.A. 100%
Sudan – Baraka* 37.3% 9.19% N.A. 80.9%
Gabon – Benito/Ntem 23.9% 13.65% 15.0% N.A.
Ghana – Bia* 58.9% 60.48% 37.4% 0.0%
Guinea – Cavally* 4.2% 9.30% 5.6% 0.0%
Guinea – Cestos* 0.1% 0.07% 0.0% 0.0%
Algeria – Daoura** 47.3% 1.18% N.A. 0.0%
Iran – Dasht** 21.5% 4.32% N.A. 3.0%
Morocco – Dra* 78.6% 99.71% 100% 96.0%
Andorra – Ebro* 0.5% 2.46% 0.0% 0.0%
Andorra – Garonne* 0.1% 0.01% 0.0% 0.0%
Latvia – Gauja 90.4% 97.94% 100% N.A.
Turkmenistan – Hari/Harirud* 17.4% 6.35% 0.0% 21.7%
Pakistan – Helmand* 3.0% 1.68% 1.4% 0.4%
Ghana – Komoe* 2.9% 9.81% 0.0% 0.0%
Georgia – Kura-Araks* 17.7% 19.39% 33.5% 22.3%
Russia – Lake Ubsa-Nur 24.1% 17.60% 13.4% 36.9%
Zimbabwe – Pungwe* 5.7% 7.90% 23.0% 0.0%
Zimbabwe – Sabi* 73.9% 92.47% 90.7% 100%
Moldova – Sarata* 37.0% 59.14% 100% 100%
Ukraine – Sarata* 63.0% 40.86% 0.0% 0.0%
Algeria – Tafna* 74.6% 61.05% 100% 58.8%
Note: CBUs marked with a “**” had a high present hazard level, while CBUs marked with a “*” had a medium present hazard level, and CBUs with no asterisks had a low present hazard level.

35
Figure 22. The grouped treaty/RBO score coverage for all CBUs predicted to experience high increases in runoff variability for 2050 (middle scenario)
Figure 23. The grouped treaty/RBO score coverage for all CBUs predicted to experience moderate increases in runoff variability for 2050 (middle scenario)
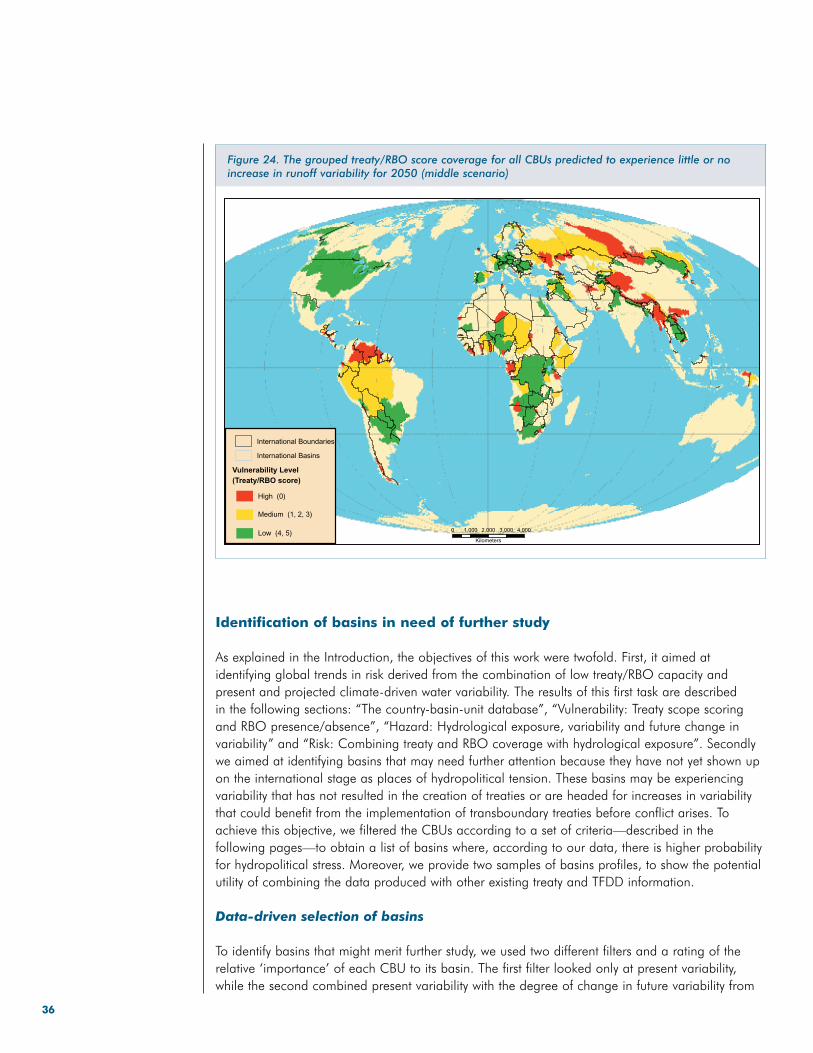
36
Figure 24. The grouped treaty/RBO score coverage for all CBUs predicted to experience little or no increase in runoff variability for 2050 (middle scenario)
Identification of basins in need of further study
As explained in the Introduction, the objectives of this work were twofold. First, it aimed at identifying global trends in risk derived from the combination of low treaty/RBO capacity and present and projected climate-driven water variability. The results of this first task are described in the following sections: “The country-basin-unit database”, “Vulnerability: Treaty scope scoring and RBO presence/absence”, “Hazard: Hydrological exposure, variability and future change in variability” and “Risk: Combining treaty and RBO coverage with hydrological exposure”. Secondly we aimed at identifying basins that may need further attention because they have not yet shown up on the international stage as places of hydropolitical tension. These basins may be experiencing variability that has not resulted in the creation of treaties or are headed for increases in variability that could benefit from the implementation of transboundary treaties before conflict arises. To achieve this objective, we filtered the CBUs according to a set of criteria—described in the following pages—to obtain a list of basins where, according to our data, there is higher probability for hydropolitical stress. Moreover, we provide two samples of basins profiles, to show the potential utility of combining the data produced with other existing treaty and TFDD information.
Data-driven selection of basins
To identify basins that might merit further study, we used two different filters and a rating of the relative ‘importance’ of each CBU to its basin. The first filter looked only at present variability, while the second combined present variability with the degree of change in future variability from

37
the present. We wanted to capture a slightly different set of relationships with this analysis than for mapping global risk by focusing in on those CBUs with treaty/RBO scores of zero or one. These CBUs either have no water treaties at all or they have a treaty but no mechanisms specifically relating to variability.
After both filters were applied, we wanted to distinguish those CBUs that made a substantial contribution to their respective basins (in terms of runoff, population, irrigation, or area) from those that may only be a small sliver or that cover almost the entire basin. For example, the Ganges-Brahmaputra-Meghna basin covers 1.6 million km2 and 862 million people, but Myanmar only overlaps 100 km2 of the basin with almost no people living within the basin. Low treaty/RBO coverage or high hazard for this CBU could classify this CBU at same level of concern as a CBU at similar risk but with a higher proportion of its total basin area or total basin population within its boundaries. Likewise, we also wanted to filter out those CBUs that cover almost the entire basin as management institutions are likely to be intra-national instead of international. An example of this would be the Iranian portion of the BahuKalat/Rudkhanehye, which has 99.8% of the population and area of the basin, with Pakistan sharing the small remainder. To filter out the above types of CBUs, a composite measure of relative basin ‘importance’ was used to identify those CBUs that made more evenly distributed contributions to the total population, areal extent, irrigated area, and runoff of their basins. To accomplish this we compared the actual proportion the CBU contributed in each of these categories, i, to an idealized ‘uniform’ proportion. This uniform proportion, μi, was calculated for each quantity as one divided by the number of CBUs (e.g. μarea = 1/# of CBUs). The deviation of the actual contribution of the CBU to each quantity from the uniform distribution was then calculated as i using Equation 1.
στ μ
μii i
i
=−( )
,2
where i = {area, population, irrigated area, runoff} Equation 1
The deviations from all four variables were averaged, and the CBUs with average deviations in the lowest 25% of CBUs returned by the filter were highlighted as particularly important in their respective basins. Since this approach privileged CBUs in basins with higher numbers of CBUs and may have omitted basins of interest to individual users, all the CBUs identified by the treaty/RBO score-hazard filters are displayed in the tables below.
To summarize, to identify the basins that best merit further study, any basins with CBUs that were (a) identified by the filter, (b) had a treaty/RBO score of zero or one, and (c) were in the top quarter of basin importance were selected. This does not mean that other basins were not worth looking at, but this selection method provided a list from which to start based on the data and analysis done for this report.
Present variability filter
The first filter applied to the data used a combination of the present variability and the treaty/RBO score. We looked specifically for those basins in the high present variability class with little or no treaty capacity. For treaty/RBO scores, we decided to look at those CBUs that had a zero or one for their treaty/RBO score. These CBUs have no treaty mechanisms or RBOs that directly relate to variability, and even if they receive a one, this indicates only that they have a water treaty, which could be about border alignment issues or other such unrelated factors. For hazard class, only those CBUs with a high present variability hazard level were considered, and future change in

38
Table 9. CBUs identified using the high present variability filter
Country-basin unit
Treaty/
RBO
Score
Area (km2)
Population (count)
Runoff (mm)
Irrigated Area (km2)
CBU share
Basintotal
CBU share
Basintotal
CBU share
Basin total
CBU share
Basin total
Mauritania – Atui 0 65% 31,700 87% 2,700 0 0
Western Sahara – Atui 0 35% 31,700 13% 2,700 0 0
Djibouti – Awash 0 7% 154,400 0% 16,407,000 0% 11,930 0% 8,000
Somalia – Awash 0 0.05% 154,400 0% 16,407,000 0% 11,930 0% 8,000
Iran – BahuKalat/Rudkhanehye
0 100% 18,000 100% 91,000 0 100% 6,300
Bolivia – Cancoso/Lauca 0 86% 23,400 96% 30,300 70% 1,090 100% 0
Chile – Cancoso/Lauca 0 14% 23,400 4% 30,300 30% 1,090 0% 0
Uganda – Congo/Zaire 0 0.05% 3,674,800 0% 81,395,000 0% 551610 0% 103,900
Algeria – Daoura 0 47% 34,500 1% 475,800 0 0% 2,000
Morocco – Daoura 0 53% 34,500 99% 475,800 0 100% 2,000
Iran – Dasht 0 22% 33,300 4% 544,000 0 3% 2,400
Pakistan – Dasht 0 78% 33,300 96% 544,000 0 97% 2,400
Algeria – Dra 0 21% 96,200 0% 1,077,000 0% 0 4% 5,100
Ethiopia – Gash 0 23% 39,900 30% 3,687,500 42% 350 5% 2,800
Algeria – Guir 0 78% 78,800 81% 306,700 0 85% 2,600
Morocco – Guir 0 22% 78,800 19% 306,700 0 15% 2,600
Algeria – Lake Chad 0 4% 2,380,500 0% 41,249,100 0% 45170 0% 39,200
Libya – Lake Chad 0 0.05% 2,380,500 0% 41,249,100 0% 45170 0% 39,200
Sudan – Lake Chad 0 3% 2,380,500 7% 41,249,100 5% 45170 4% 39,200
Sudan – Lake Turkana 0 1% 206,200 0% 18,008,400 0% 19860 0% 4,800
Ethiopia – Lotagipi Swamp
0 8% 38,700 7% 328,500 40% 850 0
Kenya – Lotagipi Swamp 0 52% 38,700 63% 328,500 29% 850 0
Sudan – Lotagipi Swamp 0 34% 38,700 19% 328,500 30% 850 0
Uganda – Lotagipi Swamp
0 5% 38,700 11% 328,500 0% 850 0
Algeria – Niger 0 8% 2,105,200 0% 88,602,400 0% 151,840 0% 80,000
Algeria – Oued Bon Naima
0 37% 500 38% 79,300 0 15% 200
Morocco – Oued Bon Naima
0 63% 500 62% 79,300 0 85% 200
Togo – Oueme 0 1% 59,100 0% 5,753,500 0% 3,310 0% 900
Morocco – Tafna 0 25% 9,400 39% 1,329,200 0% 130 41% 600
Pakistan – Tarim 0 0.05% 1,052,400 0% 9,287,600 3% 3,370 0% 157,500
(continued on next page)
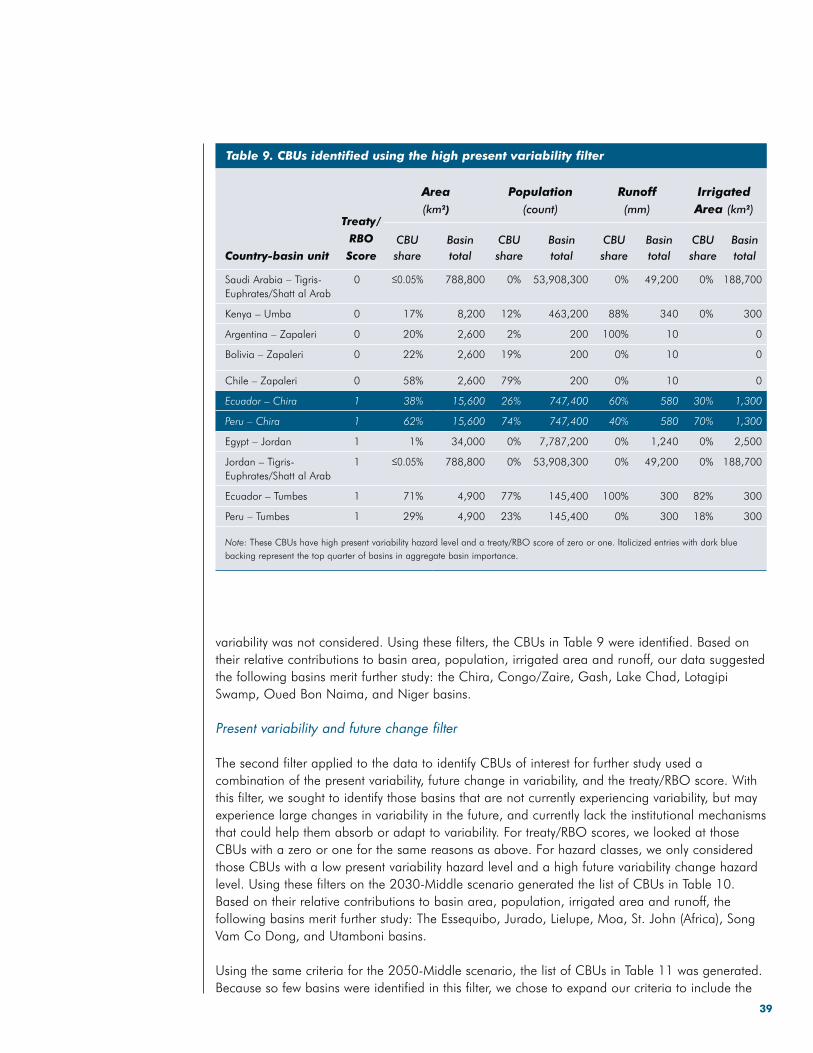
39
variability was not considered. Using these filters, the CBUs in Table 9 were identified. Based on their relative contributions to basin area, population, irrigated area and runoff, our data suggested the following basins merit further study: the Chira, Congo/Zaire, Gash, Lake Chad, Lotagipi Swamp, Oued Bon Naima, and Niger basins.
Present variability and future change filter
The second filter applied to the data to identify CBUs of interest for further study used a combination of the present variability, future change in variability, and the treaty/RBO score. With this filter, we sought to identify those basins that are not currently experiencing variability, but may experience large changes in variability in the future, and currently lack the institutional mechanisms that could help them absorb or adapt to variability. For treaty/RBO scores, we looked at those CBUs with a zero or one for the same reasons as above. For hazard classes, we only considered those CBUs with a low present variability hazard level and a high future variability change hazard level. Using these filters on the 2030-Middle scenario generated the list of CBUs in Table 10. Based on their relative contributions to basin area, population, irrigated area and runoff, the following basins merit further study: The Essequibo, Jurado, Lielupe, Moa, St. John (Africa), Song Vam Co Dong, and Utamboni basins.
Using the same criteria for the 2050-Middle scenario, the list of CBUs in Table 11 was generated. Because so few basins were identified in this filter, we chose to expand our criteria to include the
Table 9. CBUs identified using the high present variability filter
Country-basin unit
Treaty/
RBO
Score
Area (km2)
Population (count)
Runoff (mm)
Irrigated Area (km2)
CBU share
Basintotal
CBU share
Basintotal
CBU share
Basin total
CBU share
Basin total
Saudi Arabia – Tigris-Euphrates/Shatt al Arab
0 0.05% 788,800 0% 53,908,300 0% 49,200 0% 188,700
Kenya – Umba 0 17% 8,200 12% 463,200 88% 340 0% 300
Argentina – Zapaleri 0 20% 2,600 2% 200 100% 10 0
Bolivia – Zapaleri 0 22% 2,600 19% 200 0% 10 0
Chile – Zapaleri 0 58% 2,600 79% 200 0% 10 0
Ecuador – Chira 1 38% 15,600 26% 747,400 60% 580 30% 1,300
Peru – Chira 1 62% 15,600 74% 747,400 40% 580 70% 1,300
Egypt – Jordan 1 1% 34,000 0% 7,787,200 0% 1,240 0% 2,500
Jordan – Tigris-Euphrates/Shatt al Arab
1 0.05% 788,800 0% 53,908,300 0% 49,200 0% 188,700
Ecuador – Tumbes 1 71% 4,900 77% 145,400 100% 300 82% 300
Peru – Tumbes 1 29% 4,900 23% 145,400 0% 300 18% 300
Note: These CBUs have high present variability hazard level and a treaty/RBO score of zero or one. Italicized entries with dark blue backing represent the top quarter of basins in aggregate basin importance.

40
Table 10. CBUs identified using the second filter applied to the 2030-middle scenario
Country-basin unit
Treaty/
RBO
Score
Area (km2)
Population (count)
Runoff (mm)
Irrigated Area (km2)
CBU
share
Basin
total
CBU
share
Basin
total
CBU
share
Basin
total
CBU
share
Basin
total
China – Bei Jiang/Hsi 0 98% 41,6800 99% 86748,300 97% 112,550 100% 43,400
Belize – Belize 0 62% 1,1400 58% 123,800 84% 2,460 100% 0
Guatemala – Belize 0 38% 1,1400 42% 123,800 16% 2,460 0% 0
Venezuela – Essequibo 0 22% 237,600 13% 810,100 13% 104,160 0% 35,700
Belize – Grijalva 0 0% 126,400 0% 7,220,800 0% 41,090 0% 9,500
Panama – Jurado 0 29% 800 26% 500 0 0
Guinea – Little Scarcies 0 31% 18,800 17% 918.100 31% 10,070 0% 100
Sierra Leone – Little Scarcies 0 69% 18,800 83% 918,100 69% 10,070 100% 100
Guinea – Loffa 0 12% 11,400 32% 294,000 0% 8,240 0
Liberia – Loffa 0 88% 11,400 68% 294,000 100% 8,240 0
Equatorial Guinea – Mbe 0 7% 6,900 34% 30,600 0% 2,340 0
Liberia – Moa 0 13% 22,500 7% 1,907,600 0% 13,580 0
Belize – Moho 0 76% 400 78% 1,500 0 0
Guatemala – Moho 0 24% 400 22% 1,500 0 0
Guatemala – Motaqua 0 89% 16,000 96% 3,281,900 91% 4,850 100% 600
Cambodia (Kampuchea) – Saigon 0 1% 25,000 0% 6,276,800 0% 11,300 0% 800
Vietnam – Saigon 0 99% 25,000 100% 6,276,800 100% 11,300 100% 800
Costa Rica – San Juan 0 30% 42,000 11% 2,975,600 46% 17,730 30% 500
Cameroon – Sanaga 0 99% 133,400 99% 4,332,500 98% 27,650 100% 2,400
Belize – Sarstun 0 7% 2,100 1% 39,600 0% 3,930 0
Guatemala – Sarstun 0 93% 2,100 99% 39,600 100% 3,930 0
Cambodia (Kampuchea) – Song Vam Co Dong
0 49% 15,200 39% 4,533,900 36% 3,680 19% 3,100
Vietnam – Song Vam Co Dong 0 51% 15,200 61% 4,533,900 64% 3,680 81% 3,100
Guinea – St. John (Africa) 0 17% 15,500 26% 670,500 27% 6,390 0% 0
Liberia – St. John (Africa) 0 83% 15,500 74% 670,500 73% 6,390 100% 0
Liberia – St. Paul 0 55% 21,100 46% 1,052,600 64% 10,760 100% 0
Belize – Temash 0 85% 200 54% 1,000 0 0
Papua New Guinea – Tjeroaka-Wanggoe
0 38% 6,500 2% 141,300 55% 1,020 0
Equatorial Guinea – Utamboni 0 41% 7,600 70% 35,100 44% 2,960 0
Latvia – Lielupe 1 66% 14,400 68% 381,400 66% 1,500 0
Guinea – Moa 1 39% 22,500 37% 1,907,600 40% 13,580 0
Sierra Leone – Moa 1 48% 22,500 55% 1,907,600 60% 13,580 0
Note: These CBUs had a low present variability, medium or high vulnerability levels and a high level of change in future variability in the year 2030. Italicized entries with dark blue backing represent the top quarter of basins in aggregate basin importance.

41
Table 11. CBUs identified using the second filter applied to the 2050-middle scenario.
Country-basin unit
Treaty/
RBO
Score
Area
(km2)
Population
(count)
Runoff
(mm)
Irrigated
Area (km2)
CBU
share
Basin
total
CBU
share
Basin
total
CBU
share
Basin
total
CBU
share
Basin
total
Gabon – Benito/Ntem 0 24% 44,900 14% 696,700 15% 13,280 0
Latvia – Gauja 0 90% 11,600 98% 263,700 100% 1,960 0
Russia – Lake Ubsa-Nur 0 24% 63,000 18% 141,100 13% 100 37% 1,200
Latvia – Lielupe 1 66% 14,400 68% 381,400 66% 1,500 0
Byelarus – Narva 1 2% 53,200 0% 910,800 0% 5,470 0
Latvia – Narva 1 11% 53,200 14% 910,800 16% 5,470 0
Note: These CBUs had a low present variability, moderate or high vulnerability levels and a high level of change in future variability in the year 2050. Italicized entries with dark blue backing represent the top half of basins in aggregate basin importance.
top 50% of CBUs as rated by their combined relative basin importance. Based on their relative contributions to basin area, population, irrigated area and runoff, the following three basins merit further study: The Benito/Ntem, Lielupe, and Narva basins.
In total, our data-driven selection of basins found sixteen basins that merit further consideration with respect to their current or future risk levels. There are additional basins that no doubt would prove interesting and in need of further study, but this list provides a starting point for using the data developed in this study to understand what constitutes risk both now and in the future, and what might serve to ameliorate that risk. Not all of the basins identified for further study will see their variability levels change from low to high, but certain basins, such as the Narva, Lielupe and Essequibo, all have CBU where the variability is projected to increase by more than 15%. In addition, the variability level for these three basins as classified by Vörösmarty et al. (2005) will increase between now and 2030 or 2050. This could cause substantial stresses on the institutions and infrastructure of these basins, and, given that some of these places encompass millions of people, it is worth looking at these basins that are outside the traditional scope of basins currently scrutinized by the larger water community.
It is interesting to note that the global distribution of the selected basins changes with the filter used. With one exception, all the basins identified by the present variability filter are in Africa. In contrast, only four of the nine basins identified between 2030 and 2050 are in AFR, the rest being distributed between the EAP, LCR and ECA regions. This further reinforces findings in earlier parts of this study that the largest changes due to climate change are projected to occur away from those areas currently under scrutiny.
The basins meriting further study are listed below for the high present variability filter (Table 12) and the future variability change filters for 2030 (Table 13) and 2050 (Table 14). In addition to the riparians, there is additional data and information on basin statistics, existing treaties and basin distributions, and disparities of treaty/RBO scores in these tables.

42
Tab
le 1
2.
Ba
sin
s id
enti
fied
fo
r fu
rth
er s
tud
y b
ase
d o
n t
rea
ty/R
BO
sco
re,
pre
sen
t va
ria
bil
ity
ha
zard
an
d b
asi
n i
mp
ort
an
ce o
f C
BU
s
Ba
sin
Rip
ari
an
co
un
trie
s
Earl
iest
tr
eaty
si
gn
edLa
test
tre
aty
si
gn
ed
# o
f b
i-
late
ral
trea
ties
# o
f
mult
i-
late
ral
trea
ties
Co
mm
ents
o
n t
rea
ties
Trea
ty/R
BO
sco
res
an
d d
isp
ari
ty
Ba
sin
p
op
ula
tio
n
(cou
nt)
Irri
ga
ted
a
rea
(k
m2 )
Da
ms
(cou
nt)
Are
a(k
m2 )
Dis
pari
ty(H
igh/
low
)
Chi
raEc
uado
r, Pe
ru9/
27/1
971
2/26
/197
53
0
0(1
/1)
747
,400
1,
300
115
,600
Con
go/
Zaire
Ango
la, B
urun
di,
Cen
tral A
frica
n Re
publ
ic,
Cam
eroo
n, R
epub
lic o
f the
C
ongo
, Gab
on, M
alaw
i, Rw
anda
, Sud
an, T
anza
nia,
U
gand
a, D
emoc
ratic
Re
publ
ic o
f Con
go, Z
ambi
a
2/26
/188
56/
12/2
003
14
Som
e of
th
ese
are
colo
nial
tre
atie
s
4(0
/4)
81,
395,
000
103,
900
03,
674,
800
Gas
hEr
itria
, Et
hiop
ia,
Suda
n6/
15/1
925
4/18
/195
12
0O
ne o
f th
ese
is a
co
loni
al
treat
y
2(0
/2)
3,6
87,5
00
2,80
00
39,9
00
Lake
Cha
dC
entra
l Afri
can
Repu
blic
, C
amer
oon,
Alg
eria
, Li
bya,
N
iger
, N
iger
ia,
Suda
n,
Cha
d
5/22
/196
410
/10/
1973
03
3
(0/3
) 4
1,24
9,10
0 39
,200
12,
380,
500
Lota
gipi
Sw
amp
Ethi
opia
, Ke
nya,
Sud
an,
Uga
nda
——
00
0
(0/0
) 3
28,5
00
00
38,7
00
Nig
erBe
nin,
Bur
kina
Fas
o,
Cot
e d›
Ivoi
re,
Cam
eroo
n,
Alge
ria,
Gui
nea,
Mal
i, N
iger
, N
iger
ia,
The
Cha
d
2/26
/188
56/
6/20
045
9So
me
of
thes
e ar
e co
loni
al
treat
ies.
4(0
/4)
88,
602,
400
80,0
005
2,10
5,20
0
Oue
d Bo
n N
aim
aAl
geria
, M
oroc
co—
—0
0
0(0
/0)
79,
300
200
050
0

43
Tab
le 1
3.
Ba
sin
s id
enti
fied
fo
r fu
rth
er s
tud
y b
ase
d o
n C
BU
tre
aty
/RB
O s
core
s, h
aza
rd l
evel
s a
nd
ba
sin
im
po
rta
nce
in
2030 u
nd
er t
he
Mid
dle
cli
ma
te s
cen
ari
o
Ba
sin
Rip
ari
an
co
un
trie
s
Earl
iest
trea
ty
sig
ned
Late
st
trea
ty
sig
ned
# o
f
bi-
late
ral
trea
ties
# o
f
mult
i-
late
ral
trea
ties
Co
mm
ents
on
tre
ati
es
Trea
ty/R
BO
sco
res
an
d d
isp
ari
ty
Ba
sin
po
pula
tio
n
(cou
nt)
Irri
ga
ted
are
a
(km
2 )
Da
ms
(cou
nt)
Are
a
(km
2 )D
isp
ari
ty
(Hig
h/
low
)
Esse
quib
oBr
azil,
Guy
ana,
Sur
inam
e,
Vene
zual
a—
—0
0
0(0
/0)
810
,100
3
5,70
0 0
237,
600
Jura
doC
olom
bia,
Pan
ama
——
00
0
(0/0
) 5
00
00
800
Liel
upe
Latv
ia,
Lith
uani
a1/
29/1
928
7/21
/199
52
0
2(1
/3)
320
,000
0
0 1
4,40
0
Moa
Gui
nea,
Lib
eria
, Si
erra
Le
one
9/4/
1913
9/4/
1913
10
Boun
dary
tre
aty
from
the
colo
nial
per
iod
1(0
/1)
2,8
72,2
00
00
22,
500
St.
John
(A
frica
)G
uine
a, L
iber
ia—
—0
0
0(0
/0)
4,3
95,1
00
00
1,55
0
Song
Vam
Co
Don
gC
ambo
dia,
Vie
tnam
——
00
0
(0/0
) 4
,533
,900
3
,100
0
15,
200
Uta
mbo
niG
abon
, Eq
uato
rial
Gui
nea
——
00
0
(0/0
) 5
1,80
0 0
0 7
,600

44
Tab
le 1
4.
Ba
sin
s id
enti
fied
fo
r fu
rth
er s
tud
y b
ase
d o
n C
BU
tre
aty
/RB
O s
core
s, h
aza
rd l
evel
s a
nd
ba
sin
im
po
rta
nce
in
2050 u
nd
er t
he
Mid
dle
cli
ma
te s
cen
ari
o
Ba
sin
Rip
ari
an
Co
un
trie
s
Earl
iest
trea
ty
sig
ned
Late
st
trea
ty
sig
ned
# o
f
bi-
late
ral
trea
ties
# o
f
mult
i-
late
ral
trea
ties
Co
mm
ents
on
tre
ati
es
Trea
ty/R
BO
Sco
res
an
d
Dis
pa
rity
Ba
sin
Po
pula
tio
n
(cou
nt)
Irri
ga
ted
Are
a
(km
2 )
Da
ms
(cou
nt)
Are
a
(km
2 )D
isp
ari
ty
(Hig
h/
low
)
Beni
to/
Nte
mC
amer
oon,
Gab
on,
Equa
toria
l G
uine
a—
—0
0
0(0
/0)
696,
700
00
44,9
00
Liel
upe
Latv
ia,
Lith
uani
a1/
29/1
928
7/21
/199
52
0
2(1
/3)
381,
400
00
14,4
00
Nar
vaBe
laru
s, E
ston
ia,
Latv
ia,
Russ
ia19
945/
24/2
002
31
2
(1/3
)91
0,80
00
053
,200

45
Basin profiles
This section demonstrates some of the potential uses of the data generated in this study, by combining the risk data with additional TFDD data. We profiled two well-studied basins, the Ganges-Brahmaputra-Meghna and the Nile,6 to show the value of looking at any basins from the perspective of the data generated in this project. The depth and breadth of information already generated on the Ganges-Brahmaputra-Meghna and the Nile, as well as the complex socio-economic context and rich history make it impossible to fully explore the myriad nuances, but these profiles seek to show how our data could be integrated with current work and research in these or any other basins that up to now have not been on the international stage.
The Nile basin
The Nile river basin is a large international river basin in northeastern Africa (Figure 25). It encompasses roughly three million square kilometers with about 266 million people residing with its boundaries (ORNL 2008). The Nile rises in the south to form the White Nile tributary, which flows north and joins the Blue Nile in Khartoum, Sudan. Rising in the highlands of Ethiopia, the Blue Nile provides the majority of the Nile’s flow. From Khartoum, the Nile flows north through Egypt and empties into the Mediterranean Sea. There are eleven riparian countries on the Nile, with overlaps ranging from very small in the case of the Central African Republic to very substantial in the case of Sudan, where a majority of the country is within the basin (Table 15)
Current water management institutions, treaties and infrastructure are the legacy of a long history of water management, but many were initially defined by colonialism and its dissolution. In the early 1900s, a relative shortage of cotton on the world market put pressure on Egypt and the Sudan, then under a British-Egyptian condominium, to turn to this summer crop, requiring perennial irrigation over the traditional flood-fed methods. The need for summer water and flood control drove an intensive period of water development along the Nile, and resulted in an agreement on allocation and infrastructure in 1929. The proposal to build the Aswan High Dam initiated another round of negotiations in 1952 that were not completed until 1959, and these
Figure 25. Map of the Nile basin and its riparian countries
6 Selected based on interest expressed by specialists at the World Bank.

46
negotiations occurred as Sudan struggled towards its 1956 independence and then the 1958 ascension of a military regime more amiable to Egypt. This treaty assumed all other riparians would require relatively little of the overall flow, though Ethiopia exercised a legal claim to much of Blue Nile in 1957. To date, this treaty still governs transboundary basin management between Sudan and Egypt and restricts flows that other riparians can access. The Nile Basin Initiative was formed in 1999 and included all constituent riparians (except the Central African Republic) and launched its first project in 2004.
The dominance of international water management treaty-making by Sudan and Egypt is apparent in the record of treaties pertaining to the Nile that have been signed since the late 1800s. Table 16 lists all treaties from the TFDD that pertain to the Nile, and show the selected content that led to the treaty/RBO scores for each CBU in the basin.
With respect to hydrology and climate, there is already a high degree of variability in the flow of the Nile, with a standard deviation around 25%. This is reflected in the present variability in runoff in Table 17. Changes in variability are not consistent for any scenario or year. What is apparent is that some change occurs in every scenario and year, so a change in variability regime appears inevitable for some CBU(s) in the basin. Treaty coverage varies and is shown graphically in combination with present variability in Figure 26.
Table 15. Statistics on Nile riparian countries. Except where noted, all data come from the TFDD
Riparian
Area
(km2)
Irrigated
Area1
(km2)
Population2
(count)
Population
Density
(people/
km2)
Runoff1
(mm/yr)
Discharge3
(km3/yr)
Water
Stress4
(m3/person/
yr)
# of
Dams
(count)
Burundi 12,900 150 4,882,500 380 1,090 2.52 520 —
Central African Republic
1,000 — 700 — — — — —
Democratic Republic of Congo
21,100 — 2,797,900 130 230 0.53 190 —
Egypt 276,600 129,850 50,997,500 180 — — — 2
Eritrea 3,600 — 205,700 60 20 0.04 180 —
Ethiopia 354,900 18,690 29,557,500 80 57,980 133.58 4,520 1
Kenya 50,700 160 14,615,300 290 8,400 19.36 1,320 2
Rwanda 20,600 420 8,173,200 400 2,490 5.73 700 —
Sudan 1,921,900 520,590 34,327,900 20 53,490 123.23 3,590 5
Tanzania 119,400 10 8,240,500 70 6,720 15.47 1,880 —
Uganda 237,500 2,750 30,280,600 130 9,690 22.32 740 2
Total 3,020,200 672,620 184,079,300 — 140,110 322.78 — 12
1 Doll and Siebert 19992 ORNL 20083 Fekete, Vorosmarty and Grabs 20004 Following Falkenmark 1989

47
Tab
le 1
6.
All
tre
ati
es f
or
the
Nil
e fr
om
th
e TF
DD
wit
h i
nfo
rma
tio
n o
n r
elev
an
t m
ech
an
ism
s
Ori
gin
al
Sig
na
tori
esTr
eaty
Na
me
Da
te
Sig
ned
Geo
gra
ph
ic
Sco
pe
Do
cum
ent
Typ
e
All
oca
tio
n
Ca
teg
ory
All
oca
tio
n
Mec
ha
nis
m
Va
ria
bil
ity
Ma
na
gem
ent
Co
nfl
ict
Res
olu
tio
n
Italy,
Uni
ted
King
dom
Prot
ocol
bet
wee
n G
reat
Brit
ain
and
Italy
for
the
dem
arca
tion
of th
eir
resp
ectiv
e sp
here
s of
influ
ence
in
East
ern
Afric
a
4/15
/189
1Su
b-ba
sin(
s) o
r ot
her
spec
ified
ar
ea(s
)
Prim
ary
Agre
emen
tU
nive
rsal
Non
eN
one
Non
e
Ethi
opia
, U
nite
d Ki
ngdo
mEx
chan
ge o
f not
es b
etw
een
Gre
at
Brita
in a
nd E
thio
pia
3/18
/190
2Su
b-ba
sin(
s) o
r ot
her
spec
ified
ar
ea(s
)
Prim
ary
Agre
emen
tW
ater
Q
uant
ityAl
loca
tion
pres
ent b
ut ty
pe
not d
eter
min
ed
by p
revi
ous
anal
yses
Not
Ava
ilabl
e/
Not
Cod
edN
one
Ethi
opia
, U
nite
d Ki
ngdo
mTr
eatie
s be
twee
n G
reat
Brit
ain
and
Ethi
opia
, re
lativ
e to
the
front
iers
be
twee
n An
glo-
Egyp
tian
Soud
an,
Ethi
opia
, an
d Er
ythr
oea
(Rai
lway
to
conn
ect S
ouda
n w
ith U
gand
a)
5/15
/190
2En
tire
nam
ed
basi
n(s)
Prim
ary
Agre
emen
tU
nive
rsal
Non
eN
one
Non
e
Dem
ocra
tic
Repu
blic
of
Con
go,
Uni
ted
King
dom
Agre
emen
t bet
wee
n G
reat
Brit
ain
and
the
Inde
pend
ent S
tate
of t
he C
ongo
, m
odify
ing
the
agre
emen
t sig
ned
at
Brus
sels
May
12,
189
4, r
elat
ing
to
the
sphe
res
of in
fluen
ce o
f Gre
at
Brita
in a
nd th
e In
depe
nden
t Sta
te o
f th
e C
ongo
in E
ast a
nd C
entra
l Afri
ca
5/9/
1906
Sub-
basi
n(s)
or
othe
r sp
ecifi
ed
area
(s)
Amen
dmen
t to
a P
rimar
y Ag
reem
ent
Uni
vers
alN
one
Non
ePe
rman
ent
Judi
cial
O
rgan
Fran
ce,
Italy,
U
nite
d Ki
ngdo
mAg
reem
ent b
etw
een
Gre
at B
ritai
n,
Fran
ce,
and
Italy
res
pect
ing
Abys
sini
a12
/13/
1906
Sub-
basi
n(s)
or
othe
r sp
ecifi
ed
area
(s)
Prim
ary
Agre
emen
tU
nive
rsal
Non
eN
one
Non
e
(con
tinue
d on
nex
t pag
e)

48
(con
tinue
d on
nex
t pag
e)
Tab
le 1
6.
All
tre
ati
es f
or
the
Nil
e fr
om
th
e TF
DD
wit
h i
nfo
rma
tio
n o
n r
elev
an
t m
ech
an
ism
s
Ori
gin
al
Sig
na
tori
esTr
eaty
Na
me
Da
te
Sig
ned
Geo
gra
ph
ic
Sco
pe
Do
cum
ent
Typ
e
All
oca
tio
n
Ca
teg
ory
All
oca
tio
n
Mec
ha
nis
m
Va
ria
bil
ity
Ma
na
gem
ent
Co
nfl
ict
Res
olu
tio
n
Italy,
Uni
ted
King
dom
Exch
ange
of n
otes
bet
wee
n th
e U
nite
d Ki
ngdo
m a
nd It
aly
resp
ectin
g co
nces
sion
s fo
r a
barr
age
at L
ake
Tsan
a an
d a
railw
ay a
cros
s Ab
yssi
nia
from
Erit
rea
to It
alia
n So
mal
iland
12/2
0/19
25En
tire
nam
ed
basi
n(s)
Prim
ary
Agre
emen
tW
ater
Q
uant
ityPr
iorit
izat
ion
of
uses
Dry
Sea
son
Con
trol
Non
e
Egyp
t, U
nite
d Ki
ngdo
mEx
chan
ge o
f not
es b
etw
een
His
Maj
esty
s go
vern
men
t in
the
Uni
ted
King
dom
and
the
Egyp
tian
Gov
ernm
ent i
n re
gard
to th
e us
e of
the
wat
ers
of th
e Ri
ver
Nile
for
irrig
atio
n pu
rpos
es
5/7/
1929
Entir
e na
med
ba
sin(
s)Pr
imar
y Ag
reem
ent
Wat
er
Qua
ntity
Fixe
d qu
antit
ies
vary
acc
ordi
ng
to ti
me
of th
e ye
ar
Non
eAr
bitra
tion
Dip
lom
atic
C
hann
els
Egyp
t, Su
dan
Jebe
l Aw
ilya
Com
pens
atio
n Ag
reem
ent.
1932
1/1/
1932
Not
Ava
ilabl
e/N
ot C
oded
Mis
sing
Uni
vers
alN
ot a
vaila
ble/
not c
oded
Not
Ava
ilabl
e/
Not
Cod
edN
ot
Avai
labl
e/N
ot
Cod
ed
Belg
ium
, U
nite
d Ki
ngdo
mAg
reem
ent b
etw
een
the
Uni
ted
King
dom
and
Bel
gium
reg
ardi
ng
wat
er r
ight
s on
the
boun
dary
bet
wee
n Ta
ngan
yika
and
Rua
nda-
Uru
ndi
11/2
2/19
34Su
b-ba
sin(
s) o
r ot
her
spec
ified
ar
ea(s
)
Prim
ary
Agre
emen
tW
ater
Q
uant
ityPe
rcen
tage
of
flow
Non
eAr
bitra
tion
Egyp
t, U
nite
d Ki
ngdo
mEx
chan
ge o
f not
es c
onst
itutin
g an
ag
reem
ent b
etw
een
the
Uni
ted
King
dom
of G
reat
Brit
ain
and
Nor
ther
n Ire
land
and
Egy
pt r
egar
ding
th
e ut
iliza
tion
of p
rofit
s fro
m th
e 19
40
Briti
sh g
over
nmen
t cot
ton
buyi
ng
com
mis
sion
and
the
1941
join
t An
glo-
Egyp
tian
cotto
n
12/1
0/19
46N
ot A
vaila
ble/
Not
Cod
edD
oes
not
fit T
FDD
in
clus
ion
crite
ria
Uni
vers
alN
one
Not
Ava
ilabl
e/
Not
Cod
edN
one
Tab
le 1
6.
All
tre
ati
es f
or
the
Nil
e fr
om
th
e TF
DD
wit
h i
nfo
rma
tio
n o
n r
elev
an
t m
ech
an
ism
s (C
ontin
ued)

49
Tab
le 1
6.
All
tre
ati
es f
or
the
Nil
e fr
om
th
e TF
DD
wit
h i
nfo
rma
tio
n o
n r
elev
an
t m
ech
an
ism
s
Ori
gin
al
Sig
na
tori
esTr
eaty
Na
me
Da
te
Sig
ned
Geo
gra
ph
ic
Sco
pe
Do
cum
ent
Typ
e
All
oca
tio
n
Ca
teg
ory
All
oca
tio
n
Mec
ha
nis
m
Va
ria
bil
ity
Ma
na
gem
ent
Co
nfl
ict
Res
olu
tio
n
Egyp
t, U
nite
d Ki
ngdo
mEx
chan
ges
of n
otes
con
stitu
ting
an
agre
emen
t bet
wee
n th
e go
vern
men
t of
the
Uni
ted
King
dom
of G
reat
Brit
ain
and
Nor
ther
n Ire
land
and
the
gove
rnm
ent o
f Eg
ypt r
egar
ding
the
cons
truct
ion
of th
e O
wen
Fal
ls D
am, U
gand
a
5/31
/194
9Su
b-ba
sin(
s) o
r ot
her
spec
ified
ar
ea(s
)
Prim
ary
Agre
emen
tU
nive
rsal
Non
eBo
th fl
ood
and
dry
seas
on
cont
rol
Arbi
tratio
n
Dip
lom
atic
C
hann
els
Egyp
t, U
nite
d Ki
ngdo
mEx
chan
ge o
f not
es c
onst
itutin
g an
ag
reem
ent b
etw
een
the
gove
rnm
ent
of th
e U
nite
d Ki
ngdo
m o
f Gre
at
Brita
in a
nd N
orth
ern
Irela
nd a
nd th
e go
vern
men
t of E
gypt
reg
ardi
ng th
e co
nstru
ctio
n of
the
Ow
en F
alls
Dam
, U
gand
a
12/5
/194
9Su
b-ba
sin(
s) o
r ot
her
spec
ified
ar
ea(s
)
Prot
ocol
to
a pr
imar
y ag
reem
ent
Uni
vers
alN
one
Non
eN
one
Egyp
t, U
nite
d Ki
ngdo
mEx
chan
ge o
f not
es c
onst
itutin
g an
ag
reem
ent b
etw
een
the
Gov
ernm
ent
of th
e U
nite
d Ki
ngdo
m o
f Gre
at
Brita
in a
nd N
orth
ern
Irela
nd o
n be
half
of th
e go
vern
men
t of U
gand
a an
d th
e go
vern
men
t of E
gypt
reg
ardi
ng
coop
erat
ion
in m
eteo
rolo
gica
l and
hy
drol
ogic
al s
urve
y
3/20
/195
0Su
b-ba
sin(
s) o
r ot
her
spec
ified
ar
ea(s
)
Prim
ary
Agre
emen
tU
nive
rsal
Non
eN
one
Non
e
Egyp
t, U
nite
d Ki
ngdo
mEx
chan
ge o
f not
es c
onst
itutin
g an
ag
reem
ent b
etw
een
the
gove
rnm
ent
of th
e U
nite
d Ki
ngdo
m o
f Gre
at
Brita
in a
nd N
orth
ern
Irela
nd a
nd th
e go
vern
men
t of E
gypt
reg
ardi
ng th
e co
nstru
ctio
n of
the
Ow
en F
alls
Dam
in
Uga
nda
1/5/
1953
Sub-
basi
n(s)
or
othe
r sp
ecifi
ed
area
(s)
Prot
ocol
to
a pr
imar
y ag
reem
ent
Non
eN
one
(con
tinue
d on
nex
t pag
e)
Tab
le 1
6.
All
tre
ati
es f
or
the
Nil
e fr
om
th
e TF
DD
wit
h i
nfo
rma
tio
n o
n r
elev
an
t m
ech
an
ism
s (C
ontin
ued)

50
(con
tinue
d on
nex
t pag
e)
Tab
le 1
6.
All
tre
ati
es f
or
the
Nil
e fr
om
th
e TF
DD
wit
h i
nfo
rma
tio
n o
n r
elev
an
t m
ech
an
ism
s
Ori
gin
al
Sig
na
tori
esTr
eaty
Na
me
Da
te
Sig
ned
Geo
gra
ph
ic
Sco
pe
Do
cum
ent
Typ
e
All
oca
tio
n
Ca
teg
ory
All
oca
tio
n
Mec
ha
nis
m
Va
ria
bil
ity
Ma
na
gem
ent
Co
nfl
ict
Res
olu
tio
n
Egyp
t, Su
dan
Agre
emen
t bet
wee
n th
e go
vern
men
t of
the
Uni
ted
Arab
Rep
ublic
and
th
e go
vern
men
t of S
udan
for
full
utili
zatio
n of
the
Nile
wat
ers
11/8
/195
9Su
b-ba
sin(
s) o
r ot
her
spec
ified
ar
ea(s
)
Prim
ary
Agre
emen
tW
ater
Q
uant
ityFi
xed
quan
titie
sN
one
Com
mis
sion
Egyp
t, Su
dan
Prot
ocol
(to
the
Nov
embe
r 8,
19
59 a
gree
men
t) C
once
rnin
g th
e Es
tabl
ishm
ent o
f the
Per
man
ent J
oint
Te
chni
cal C
omm
ittee
. C
airo
, 17
Ja
nuar
y, 1
960
1/17
/196
0Su
b-ba
sin(
s) o
r ot
her
spec
ified
ar
ea(s
)
Prot
ocol
to
a pr
imar
y ag
reem
ent
Uni
vers
alN
one
Non
eN
one
Egyp
t, Ke
nya,
Su
dan,
Ta
nzan
ia,
Uga
nda
Agre
emen
t for
the
Hyd
rom
eteo
rolo
gica
l Sur
vey
of L
akes
Vi
ctor
ia,
Kyog
o an
d Al
bert
(Mob
utu
Sese
Sek
o)
8/17
/196
7N
ot A
vaila
ble/
Not
Cod
edM
issi
ngU
nive
rsal
Not
ava
ilabl
e/no
t cod
edN
ot A
vaila
ble/
N
ot C
oded
Not
Av
aila
ble/
Not
C
oded
Buru
ndi,
Rwan
da,
Tanz
ania
, U
gand
a
Agre
emen
t for
the
esta
blis
hmen
t of
the
orga
niza
tion
for
the
man
agem
ent
and
deve
lopm
ent o
f the
Kag
era
river
ba
sin
(with
atta
ched
map
), C
oncl
uded
at
Rus
umo,
Rw
anda
8/24
/197
7En
tire
nam
ed
basi
n(s)
Prim
ary
Agre
emen
tU
nive
rsal
Non
eN
one
Arbi
tratio
n
Dip
lom
atic
C
hann
els
Buru
ndi,
Rwan
da,
Tanz
ania
, U
gand
a
Amen
dmen
t to
the
Agre
emen
t for
the
Esta
blis
hmen
t of a
n O
rgan
izat
ion
to
Man
age
and
Dev
elop
The
Kag
era
Rive
r Ba
sin.
19
May
, 19
78
5/19
/197
8N
ot A
vaila
ble/
Not
Cod
edPr
otoc
ol to
a
prim
ary
agre
emen
t
Uni
vers
alN
ot a
vaila
ble/
not c
oded
Not
Ava
ilabl
e/
Not
Cod
edN
ot
Avai
labl
e/N
ot
Cod
ed
Buru
ndi,
Rwan
da,
Tanz
ania
, U
gand
a
Acce
ssio
n of
Uga
nda
to th
e ag
reem
ent p
erta
inin
g to
the
crea
tion
of th
e or
gani
zatio
n fo
r th
e m
anag
emen
t and
dev
elop
men
t of t
he
Kage
ra r
iver
bas
in
5/18
/198
1En
tire
nam
ed
basi
n(s)
Prot
ocol
to
a pr
imar
y ag
reem
ent
Uni
vers
alN
one
Not
Ava
ilabl
e/
Not
Cod
edN
one
Tab
le 1
6.
All
tre
ati
es f
or
the
Nil
e fr
om
th
e TF
DD
wit
h i
nfo
rma
tio
n o
n r
elev
an
t m
ech
an
ism
s (C
ontin
ued)

51
Tab
le 1
6.
All
tre
ati
es f
or
the
Nil
e fr
om
th
e TF
DD
wit
h i
nfo
rma
tio
n o
n r
elev
an
t m
ech
an
ism
s
Ori
gin
al
Sig
na
tori
esTr
eaty
Na
me
Da
te
Sig
ned
Geo
gra
ph
ic
Sco
pe
Do
cum
ent
Typ
e
All
oca
tio
n
Ca
teg
ory
All
oca
tio
n
Mec
ha
nis
m
Va
ria
bil
ity
Ma
na
gem
ent
Co
nfl
ict
Res
olu
tio
n
Egyp
t, Et
hiop
iaFr
amew
ork
for
gene
ral c
o-op
erat
ion
betw
een
the
Arab
Rep
ublic
of E
gypt
an
d Et
hiop
ia
7/1/
1993
Entir
e na
med
ba
sin(
s)Pr
imar
y Ag
reem
ent
Uni
vers
alN
one
Non
eN
one
Keny
a, T
anza
nia,
U
gand
aC
onve
ntio
n fo
r th
e es
tabl
ishm
ent
of th
e La
ke V
icto
ria F
ishe
ries
Org
aniz
atio
n w
ith a
nnex
and
fina
l act
6/30
/199
4En
tire
nam
ed
basi
n(s)
Prim
ary
Agre
emen
tU
nive
rsal
Non
eN
one
Arbi
tratio
n
Dip
lom
atic
C
hann
els
Keny
a, T
anza
nia,
U
gand
aAg
reem
ent t
o in
itiat
e pr
ogra
m to
st
reng
then
reg
iona
l coo
rdin
atio
n in
m
anag
emen
t of r
esou
rces
of L
ake
Vict
oria
8/5/
1994
Entir
e na
med
ba
sin(
s)Pr
imar
y Ag
reem
ent
Uni
vers
alN
one
Not
Ava
ilabl
e/
Not
Cod
edN
one
Keny
a, T
anza
nia,
U
gand
aTr
eaty
for
the
Esta
blis
hmen
t of t
he E
ast
Afric
an C
omm
unity
sig
ned
at A
rush
a11
/30/
1999
All w
ater
s of
tw
o or
mor
e co
untri
es
Prim
ary
Agre
emen
tU
nive
rsal
Non
eD
ry S
easo
n C
ontro
lAr
bitra
tion
Keny
a, T
anza
nia,
U
gand
aPr
otoc
ol fo
r Su
stai
nabl
e D
evel
opm
ent
of L
ake
Vict
oria
Bas
in.
Arus
ha,
29
Nov
embe
r, 20
03
11/2
9/20
03En
tire
nam
ed
basi
n(s)
Prim
ary
Agre
emen
tU
nive
rsal
Non
eBo
th fl
ood
an
d dr
y
seas
on c
ontro
l
Arbi
tratio
n
Com
mis
sion
Tab
le 1
6.
All
tre
ati
es f
or
the
Nil
e fr
om
th
e TF
DD
wit
h i
nfo
rma
tio
n o
n r
elev
an
t m
ech
an
ism
s (C
ontin
ued)

52
Climate variability is already moderately high in upstream riparians such as Uganda and Kenya, and these countries may both experience moderate or high changes in variability under different scenarios. Downstream riparians and the primary users of the water, Egypt and Sudan, have high and medium variability respectively and experience moderate increases in one climate scenario each. Ethiopia’s sensitivity to variability and climate may be the lowest, as its current variability is low and no climate scenarios result in a substantial increase in variability.
In addition to the treaty information presented in brief above, there are many other factors that can be considered for explaining the context of water management and exploring the resilience of the basin to future changes in climate. Population and irrigation create demands for freshwater, and will create stress if variability creates hindrances to meeting those demands. As shown in Table 15 there are enormous disparities in irrigated acreage, with Sudan and Egypt making up roughly 95% of the area, and most of the rest coming from Ethiopia. Population is more distributed in the basin, with large numbers of people living in Uganda and Ethiopia as well as Egypt and Sudan. The upstream-downstream orientation of the Nile would suggest that these populous upstream
Table 17. Modeled runoff variability and projected climate change under all scenarios for the riparians of the Nile
Riparians
Present
Variability
Class
Future Variability Change Class Vulnerability
Level
(Treaty/RBO
Score)
2030-
Dry
2030-
Middle
2030-
Wet
2050-
Dry
2050-
Middle
2050-
Wet
Burundi Medium Low/ None
Low/ None
Low/ None
Low/ None
Low/ None
Low/ None
Low (4)
Central African Republic
Medium Low/ None
Moderate Low/ None
Low/ None
High High Medium (2)
Egypt High Moderate Low/ None
Low/ None
Low/ None
Low/ None
Low/ None
Low (5)
Eritrea High Low/ None
Low/ None
Low/ None
Low/ None
Low/ None
Low/ None
Medium (2)
Ethiopia Low Low/ None
Low/ None
Low/ None
Low/ None
Low/ None
Low/ None
Medium (3)
Kenya Medium Moderate Low/ None
Moderate Low/ None
Low/ None
Low/ None
Low (4)
Rwanda Medium Moderate Low/ None
Low/ None
Low/ None
Low/ None
Low/ None
Low (4)
Sudan Medium Low/ None
Low/ None
Low/ None
Low/ None
Moderate Low/ None
Low (5)
United Republic of Tanzania
Medium Low/ None
Low/ None
High Low/ None
Low/ None
Low/ None
Low (5)
Uganda Medium Low/ None
Low/ None
High Low/ None
Low/ None
Low/ None
Low (4)
Democratic Republic of Congo
Medium Low/ None
Moderate Low/ None
High Low/ None
Moderate Medium (3)
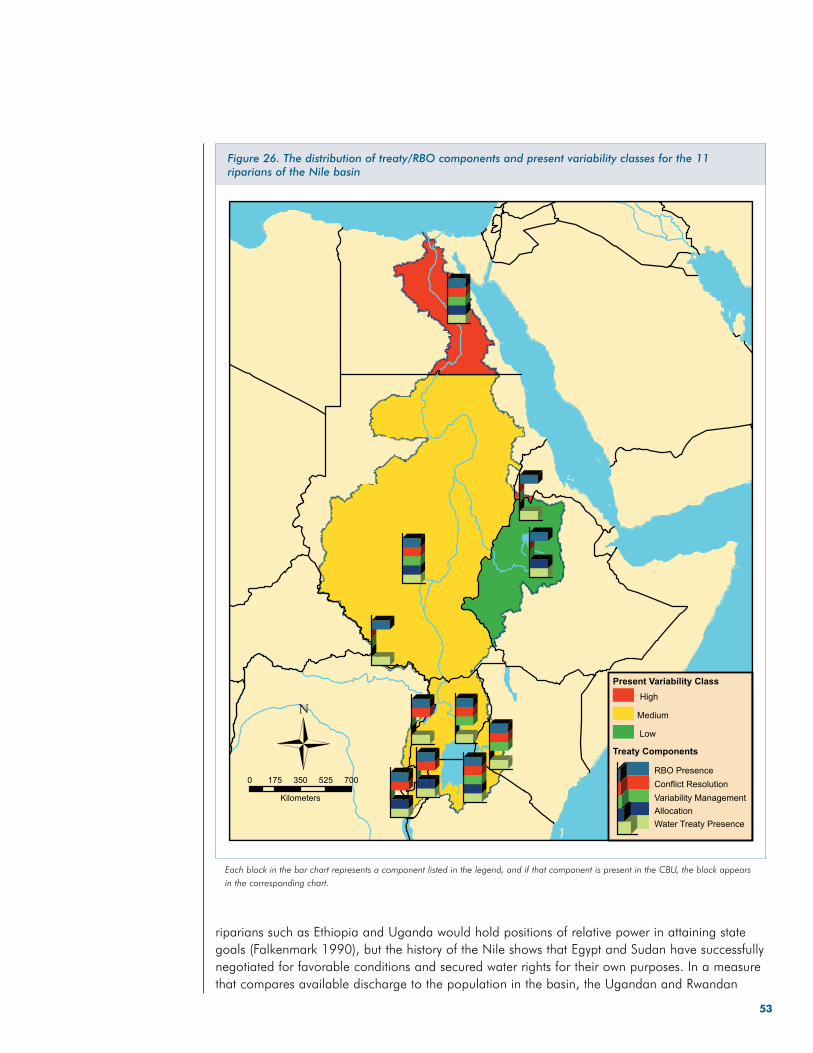
53
riparians such as Ethiopia and Uganda would hold positions of relative power in attaining state goals (Falkenmark 1990), but the history of the Nile shows that Egypt and Sudan have successfully negotiated for favorable conditions and secured water rights for their own purposes. In a measure that compares available discharge to the population in the basin, the Ugandan and Rwandan
Figure 26. The distribution of treaty/RBO components and present variability classes for the 11 riparians of the Nile basin
Each block in the bar chart represents a component listed in the legend, and if that component is present in the CBU, the block appears in the corresponding chart.

54
portions show the highest levels of water stress (490 and 460 m3/person/yr, respectively) and have relatively minor roles in transboundary treaties.
Another potentially useful indicator of capacity is country gross domestic product (GDP), as this can enable nations to find substitutes and alternative sources for water and may allow better adaptation to climate change through technological and other means. In 2008, Egypt had a GDP of roughly 162 billion USD, Sudan had 58 billion USD, Ethiopia had 27 billion USD and Uganda had 15 billion USD (World Bank 2009b). These countries all have significant infrastructure invested in the Nile or are almost entirely within the basin, as is the case for Uganda. The GDP for poorer upstream countries is as low as 1.1 billion USD for Burundi.
Examining the treaty information in Table 16 shows that since the end of colonialism, no basin-wide treaties have been signed, only the 1959 treaty between Sudan and Egypt has an allocation mechanism, excluding other riparians. Other treaties contain content related to dry season control (the 1999 treaty establishing the East African Community) or conflict resolution using arbitration and diplomatic channels (1994 establishment of the Lake Victoria Fisheries Organization) that include other riparians, but not Egypt and Sudan. This is in part due to the regionally specific nature of these bodies, but shows the lack of a unified international management structure that makes all countries party to addressing and managing variability.
This fact is particularly striking when set against the contributions of runoff from the different riparians.Water flowing from Ethiopia contributes the majority of the runoff. After Sudan and Ethiopia’s contributions, Uganda, Tanzania and Kenya all provide significant portions of the basin’s runoff. In addition, of the twelve dams along the Nile, a third are in the upstream countries of Uganda and Kenya. These statistics point to an imbalance between the content of treaties, the countries signing them and their hydrological relationships to the basin as a whole.
The Ganges-Brahmaputra-Meghna basin
The Ganges-Brahmaputra-Meghna is a complex of three major river basins draining large portions of India, Bangladesh, and China, and all of Nepal and Bhutan (a minute portion of Myanmar overlaps the basin as well, but isn’t considered further here) (Figure 27). While blessed with an abundance of water resources, much of the management problems of the Indian subcontinent come about from the dramatic seasonal variations in rainfall. This management problem is compounded by the creation of new national borders throughout the region. The seasonal rainfall variations have also contributed to the specific interstate problems that have developed between India and Bangladesh (initially India and Pakistan) over the waters of the Ganges-Brahmaputra-Meghna River. The headwaters of the Ganges-Brahmaputra-Meghna and its tributaries lie primarily in Nepal and India along the Himalayan Mountains, where snow and rainfall are heaviest. Flow increases downstream, even as annual precipitation drops, as the river flows into Bangladesh (the eastern provinces of the Federation of Pakistan before 1971), and on to the Bay of Bengal.
The problems on the Ganges-Brahmaputra-Meghna are typical of conflicting interests of up- and downstream riparians. India is both an up-stream and a down-stream riparian depending on the portion of the basin under consideration, making the arrangements of international water treaties on this basin even more complex. India, as one of the upstream riparians with respect to Bangladesh, developed plans for water diversions for its own irrigation, navigability, and water supply interests. Initially Pakistan, and later Bangladesh, had interests in protecting the historic flow of the river for its own downstream uses. The potential clash between upstream development

55
and downstream historic use set the stage for attempts at conflict management. Much of the international law that has been signed about the Ganges-Brahmaputra-Meghna has to do with dividing flow between India and Bangladesh. Agreements signed in 1977 and 1996 and a memorandum of understanding in 1985 regulated flow allocations in the dry season, but have not considered upstream uses of non-signatories, such as Bhutan and Nepal. Notably, India has used
Table 18. Statistics on Ganges-Brahmaputra-Meghna riparian countries
Riparian
Area
(km2)
Irrigated
Area1
(km2)
Population2
(count)
Population
Density
(people/km2)
Runoff1
(mm/yr)
Discharge3
(km3/yr)
Water Stress4
(m3/person/yr)
# of
Dams
(count)
Bangladesh 106,900 36,140 122,379,000 1,145 41,800 96.31 790 0
Bhutan 39,800 910 2,421,700 61 17,590 40.53 16,740 0
China 320,600 11,390 1,692,700 5 97,570 224.80 132,800 0
India 1,015,000 311,500 475,986,000 469 304,750 702.14 1,480 224
Myanmar (Burma)
100 0 300 4 0 0 0 0
Nepal 147,100 13,520 29,339,900 199 62,500 143.99 4,910 2
Total 1,629,500 373,460 631,819,600 — 524,210 1,207.77 — 226
1 Doll and Siebert 19992 ORNL 20083 Fekete, Vorosmarty and Grabs 20004 Following Falkenmark 1989
Except where noted, all data come from the TFDD.
Figure 27. Map of the Ganges-Brahmaputra-Meghna basin and its riparian countries

56
Tab
le 1
9.
All
tre
ati
es f
or
the
Ga
ng
es-B
rah
ma
putr
a-M
egh
na
fro
m t
he
TFD
D w
ith
in
form
ati
on
on
rel
eva
nt
mec
ha
nis
ms
Ori
gin
al
Sig
na
tori
esTr
eaty
Na
me
Da
te
Sig
ned
Geo
gra
ph
ic
Sco
pe
Do
cum
ent
Typ
e
All
oca
tio
n
Ca
teg
ory
All
oca
tio
n
Mec
ha
nis
m
Va
ria
bil
ity
Ma
na
gem
ent
Co
nfl
ict
Res
olu
tio
n
Indi
a, U
nite
d Ki
ngdo
mAg
reem
ent b
etw
een
the
Briti
sh
Gov
ernm
ent a
nd T
he S
tate
of J
ind,
Fo
r Re
gula
ting
the
Supp
ly o
f Wat
er
for
Irrig
atio
n fro
m th
e W
este
rn
Jum
na C
anal
4/29
/187
5N
ot A
vaila
ble/
Not
Cod
edSe
mi-
inte
rnat
iona
l tre
aty
Uni
vers
alN
ot a
vaila
ble/
not c
oded
Not
Ava
ilabl
e/
Not
Cod
edN
ot A
vaila
ble/
Not
Cod
ed
Indi
a, U
nite
d Ki
ngdo
mAg
reem
ent b
etw
een
the
Briti
sh
gove
rnm
ent a
nd th
e Pa
tiala
sta
te
rega
rdin
g th
e Si
rsa
bran
ch o
f the
W
este
rn J
umna
Can
al
8/29
/189
3Su
b-ba
sin(
s) o
r ot
her
spec
ified
ar
ea(s
)
Sem
i-in
tern
atio
nal
treat
y
Wat
er
Qua
ntity
Allo
catio
n pr
esen
t but
type
no
t det
erm
ined
by
pre
viou
s an
alys
es
Not
Ava
ilabl
e/
Not
Cod
edN
one
Bhut
an,
Indi
aAg
reem
ent B
etw
een
the
Gov
ern-
men
t of I
ndia
and
the
Roya
l Gov
-er
nmen
t of B
huta
n re
gard
ing
the
Chu
kkha
Hyd
roel
ectri
c Pr
ojec
t. C
hukk
ha H
ydro
elec
tric
Proj
ect;
Indi
a fin
ance
s hy
droe
lect
ric p
roje
ct
(60%
gra
nt;
40%
low
inte
rest
loan
) to
be
built
in.
5/27
/190
5Su
b-ba
sin(
s) o
r ot
her
spec
ified
ar
ea(s
)
Prim
ary
Agre
emen
tU
nive
rsal
Not
ava
ilabl
e/no
t cod
edN
ot A
vaila
ble/
N
ot C
oded
Not
Ava
ilabl
e/N
ot C
oded
Indi
a, U
nite
d Ki
ngdo
mAg
reem
ent b
etw
een
Gre
at B
ritai
n an
d th
e Pa
nna
stat
e re
spec
ting
the
Ken
Can
al
9/30
/190
8Su
b-ba
sin(
s) o
r ot
her
spec
ified
ar
ea(s
)
Sem
i-in
tern
atio
nal
treat
y
Uni
vers
alN
one
Not
Ava
ilabl
e/
Not
Cod
edN
one
Indi
a, N
epal
Agre
emen
t bet
wee
n th
e go
vern
men
t of I
ndia
and
the
gove
rnm
ent o
f Nep
al o
n th
e Ko
si
proj
ect
4/25
/195
4Su
b-ba
sin(
s) o
r ot
her
spec
ified
ar
ea(s
)
Prim
ary
Agre
emen
tH
ydro
pow
erPe
rcen
tage
Floo
d C
ontro
lAr
bitra
tion
Wat
er
Qua
ntity
Con
sulta
tion
Arbi
tratio
n
(con
tinue
d on
nex
t pag
e)

57
Tab
le 1
9.
All
tre
ati
es f
or
the
Ga
ng
es-B
rah
ma
putr
a-M
egh
na
fro
m t
he
TFD
D w
ith
in
form
ati
on
on
rel
eva
nt
mec
ha
nis
ms
Ori
gin
al
Sig
na
tori
esTr
eaty
Na
me
Da
te
Sig
ned
Geo
gra
ph
ic
Sco
pe
Do
cum
ent
Typ
e
All
oca
tio
n
Ca
teg
ory
All
oca
tio
n
Mec
ha
nis
m
Va
ria
bil
ity
Ma
na
gem
ent
Co
nfl
ict
Res
olu
tio
n
Indi
a, N
epal
Agre
emen
t bet
wee
n H
is M
ajes
ty›s
gove
rnm
ent o
f Nep
al a
nd th
e go
vern
men
t of I
ndia
on
the
Gan
dak
Irrig
atio
n an
d Po
wer
Pr
ojec
t
12/4
/195
9Su
b-ba
sin(
s) o
r ot
her
spec
ified
ar
ea(s
)
Prim
ary
Agre
emen
tW
ater
Q
uant
ityPe
rcen
tage
of
flow
Non
eAr
bitra
tion
Dip
lom
atic
C
hann
els
Indi
a, N
epal
Amen
ded
agre
emen
t bet
wee
n H
is
Maj
esty
›s go
vern
men
t of N
epal
an
d th
e go
vern
men
t of I
ndia
co
ncer
ning
the
Kosi
Pro
ject
12/1
9/19
66Su
b-ba
sin(
s) o
r ot
her
spec
ified
ar
ea(s
)
Repl
acem
ent
of a
Prim
ary
Agre
emen
t
Hyd
ropo
wer
Perc
enta
geFl
ood
Con
trol
Arbi
tratio
n
Dip
lom
atic
C
hann
els
Bang
lade
sh,
Indi
aSt
atut
e of
the
Indo
-Ban
glad
esh
Join
t Riv
ers
Com
mis
sion
11/2
4/19
72Al
l wat
ers
of
two
or m
ore
coun
tries
Prim
ary
Agre
emen
tU
nive
rsal
Non
eN
one
Dip
lom
atic
C
hann
els
Bang
lade
sh,
Indi
aPr
ovis
iona
l con
clus
ion
of th
e tre
aty
of 1
8 Ap
ril 1
975
on th
e di
visi
on o
f th
e w
ater
s of
the
Gan
ges
4/18
/197
5Su
b-ba
sin(
s) o
r ot
her
spec
ified
ar
ea(s
)
Prim
ary
Agre
emen
tW
ater
Q
uant
ityFi
xed
quan
titie
s,
varia
ble
(by
wat
er
avai
labi
lity)
Not
Ava
ilabl
e/
Not
Cod
edN
one
Bang
lade
sh,
Indi
aAg
reem
ent b
etw
een
the
gove
rnm
ent o
f the
Peo
ple›
s Re
publ
ic o
f Ban
glad
esh
and
the
gove
rnm
ent o
f the
Rep
ublic
of
Indi
a on
sha
ring
of th
e G
ange
s w
ater
s at
Far
akka
and
on
augm
entin
g its
flow
s
11/5
/197
7Su
b-ba
sin(
s) o
r ot
her
spec
ified
ar
ea(s
)
Prim
ary
Agre
emen
tW
ater
Q
uant
ityFi
xed
quan
titie
s va
ry a
ccor
ding
to
tim
e of
the
year
Dry
Sea
son
Con
trol
Com
mis
sion
Perc
enta
ge o
f flo
wD
iplo
mat
ic
Cha
nnel
s
Indi
a, N
epal
Agre
emen
t bet
wee
n N
epal
and
In
dia
on th
e re
nova
tion
and
exte
nsio
n of
Cha
ndra
Can
al,
Pum
ped
Can
al,
and
dist
ribut
ion
of
the
Wes
tern
Kos
i Can
al
4/7/
1978
Not
Ava
ilabl
e/N
ot C
oded
Mis
sing
Wat
er
Qua
ntity
Fixe
d qu
antit
ies
Not
Ava
ilabl
e/N
ot C
oded
Non
e
(con
tinue
d on
nex
t pag
e)
Tab
le 1
9.
All
tre
ati
es f
or
the
Ga
ng
es-B
rah
ma
putr
a-M
egh
na
fro
m t
he
TFD
D w
ith
in
form
ati
on
on
rel
eva
nt
mec
ha
nis
ms
(Con
tinue
d)

58
Tab
le 1
9.
All
tre
ati
es f
or
the
Ga
ng
es-B
rah
ma
putr
a-M
egh
na
fro
m t
he
TFD
D w
ith
in
form
ati
on
on
rel
eva
nt
mec
ha
nis
ms
Ori
gin
al
Sig
na
tori
esTr
eaty
Na
me
Da
te
Sig
ned
Geo
gra
ph
ic
Sco
pe
Do
cum
ent
Typ
e
All
oca
tio
n
Ca
teg
ory
All
oca
tio
n
Mec
ha
nis
m
Va
ria
bil
ity
Ma
na
gem
ent
Co
nfl
ict
Res
olu
tio
n
Bang
lade
sh,
Indi
aIn
do-B
angl
ades
h m
emor
andu
m o
f un
ders
tand
ing
on th
e sh
arin
g of
G
anga
wat
ers
at F
arak
ka
10/7
/198
2Su
b-ba
sin(
s) o
r ot
her
spec
ified
ar
ea(s
)
Repl
acem
ent
of a
Prim
ary
Agre
emen
t
Wat
er
Qua
ntity
Fixe
d qu
antit
ies
and
perc
enta
geN
one
Com
mis
sion
Dip
lom
atic
C
hann
els
Bang
lade
sh,
Indi
aAg
reem
ent o
n ad
hoc
sha
ring
of
the
Tees
ta w
ater
s be
twee
n In
dia
and
Bang
lade
sh r
each
ed d
urin
g th
e 25
th
mee
ting
of th
e In
do-B
angl
ades
h Jo
int R
iver
s C
omm
issio
n he
ld in
Jul
y 19
83, a
t Dha
ka
7/20
/198
3En
tire
nam
ed
basi
n(s)
Prim
ary
Agre
emen
tW
ater
Q
uant
ityPe
rcen
tage
of
flow
Non
eN
one
Bang
lade
sh,
Indi
aM
eetin
g of
the
Join
t Riv
ers
Com
mis
sion
7/20
/198
3Su
b-ba
sin(
s) o
r ot
her
spec
ified
ar
ea(s
)
Not
a tr
eaty
Wat
er
Qua
ntity
Allo
catio
n pr
esen
t but
type
no
t det
erm
ined
by
pre
viou
s an
alys
es
Not
Ava
ilabl
e/N
ot C
oded
Non
e
Bang
lade
sh,
Indi
aSu
mm
ary
reco
rd o
f disc
ussio
ns
of th
e fir
st m
eetin
g of
the
Join
t C
omm
ittee
of E
xper
ts h
eld
in D
haka
be
twee
n 16
–v18
Jan
uary
, 198
6
1/18
/198
6N
ot A
vaila
ble/
Not
Cod
edSe
mi-
inte
rnat
iona
l tre
aty
Uni
vers
alN
one
Not
Ava
ilabl
e/N
ot C
oded
Non
e
Indi
a, N
epal
Trea
ty b
etw
een
His
Maj
esty
›s go
vern
-m
ent o
f Nep
al a
nd th
e go
vern
men
t of
Indi
a co
ncer
ning
the
inte
grat
ed
deve
lopm
ent o
f the
Mah
akal
i Riv
er
incl
udin
g Sa
rada
Bar
rage
, Tan
akpu
r Ba
rrag
e, a
nd P
anch
eshw
ar P
roje
ct
2/12
/199
6Su
b-ba
sin(
s) o
r ot
her
spec
ified
ar
ea(s
)
Prim
ary
Agre
emen
tW
ater
Q
uant
ityFi
xed
quan
titie
sFl
ood
Con
trol
Arbi
tratio
n
Com
mis
sion
Bang
lade
sh,
Indi
aTr
eaty
bet
wee
n th
e go
vern
men
t of
the
Repu
blic
of I
ndia
and
the
gov-
ernm
ent o
f the
Peo
ple›
s Re
publ
ic
of B
angl
ades
h on
sha
ring
of th
e G
anga
/Gan
ges
wat
ers
at F
arak
ka
12/1
2/19
96Su
b-ba
sin(
s) o
r ot
her
spec
ified
ar
ea(s
)
Prim
ary
Agre
emen
tW
ater
Q
uant
ityFi
xed
quan
titie
s an
d pe
rcen
tage
Non
eC
omm
issi
on
Dip
lom
atic
C
hann
els
Tab
le 1
9.
All
tre
ati
es f
or
the
Ga
ng
es-B
rah
ma
putr
a-M
egh
na
fro
m t
he
TFD
D w
ith
in
form
ati
on
on
rel
eva
nt
mec
ha
nis
ms
(C
ontin
ued)

59
its position of power in the basin to insist on a series of bilateral treaties rather than engaging in multilateral negotiations. This pattern is reflected in the collection of treaties for the basin, which are all bilateral (Table 19).
Interannual variability in the Ganges-Brahmaputra-Meghna has historically been low for all country-basin units (Table 20). The distribution of climate change impacts is somewhat pronounced, with several climate scenarios leading to moderate or high increases in 2030 and
2050. Variability management in the basin has been defined by augmenting dry-season flows and monsoon flood control, and more often operates on intra-annual time scales. If indeed the system transitions to a state of greater interannual variability, then management institutions currently in place will have to adapt to meet fundamentally different challenges that could ensue.
Land use change and development plans in China and Bhutan could be particularly important for future effects of variability, as there are few or no treaties between these countries and others in the basin. While Myanmar does share a portion of the basin, it is so small to render it insignificant for these discussions. Figure 28 shows the distribution of treaty/RBO components, and illustrates one difficulty in working solely with treaty texts as written; that is the inability to know the current enforcement status of a treaty. This could translate to some components no longer being in place. For example, the 1977 treaty between Bangladesh and India was identified as having a dry-season control mechanism, but neither the 1982 memorandum of understanding nor the 1996 treaty contained such a provision. So while India has several variability management treaties with Nepal for flood control, the Bangladeshi portion of the Ganges-Brahmaputra-Meghna does not currently have a variability management mechanism in place through force of treaty, though the treaty/RBO score shows otherwise. The 1977 Ganges Water Treaty has not been in force for more than two decades, but this wasn’t captured by our analysis.
Table 20. Modeled runoff variability and projected climate change under all scenarios for the riparians of the Ganges-Brahmaputra-Meghna
Riparians
Present Variability Class
Future Variability Change Class Vulnerability Level(Treaty/RBO Score)
2030- Dry
2030- Middle
2030- Wet
2050-Dry
2050- Middle
2050-Wet
Bangladesh Low Low/ None
Moderate Low/ None
Low/ None
Low/ None
Moderate Low (5)
Bhutan Low Moderate Moderate Moderate Low/ None
Moderate Moderate Medium (1)
China Low Low/ None
Moderate Low/ None
Low/ None
Low/ None
Low/ None
High (0)
India Low High Moderate High Moderate High High Low (5)
Myanmar Low Low/ None
Low/ None
Low/ None
Moderate Low/ None
Moderate High (0)
Nepal Low High High Low/ None
Low/ None
Low/ None
Low/ None
Low (4)

60
Figure 28. The distribution of treaty/RBO components and population for the Ganges-Brahmaputra-Meghna river basin
Each block in the bar chart represents a component listed in the legend, and if that component is present in the CBU, the block appears in the corresponding chart.
Figure 29 shows the vulnerability levels and the hazard levels7 for both the present and future time periods. This graphic illustrates the distribution of climate change impacts in the basin. There is substantially wide-spread change predicted for 2030 by the middle scenario, and in some places, such as Bhutan and China, this increase will occur where there are few treaty/RBO components present. Additionally, considering that Bangladesh’s vulnerability may not be as low as rated by the global methodology, these changes in interannual variability could become more worrisome.
The other contextual variables available for this study can provide a broader picture of what is happening in the Ganges-Brahmaputra-Meghna basin than just the text of the treaties. As seen in Figure 28, there are high population concentrations in the lower reaches of the river. India has extensively dammed the river system and irrigates most of the acreage in the basin. However, there are substantial contributions in all categories from Nepal and China as well. Water stress is only
7 Given the recent revelation of a mistake in the IPCC’s Fourth Assessment Report about the relationship between climate change and glacial melt rates in the Himalayas, it is worth repeating here that the data used to derive these exposure classes do not rely on estimates of glacier melt, but as stated in Section 3.4, come from global circulation models and a moderate emission scenario, and thus are not impacted by this mistake.
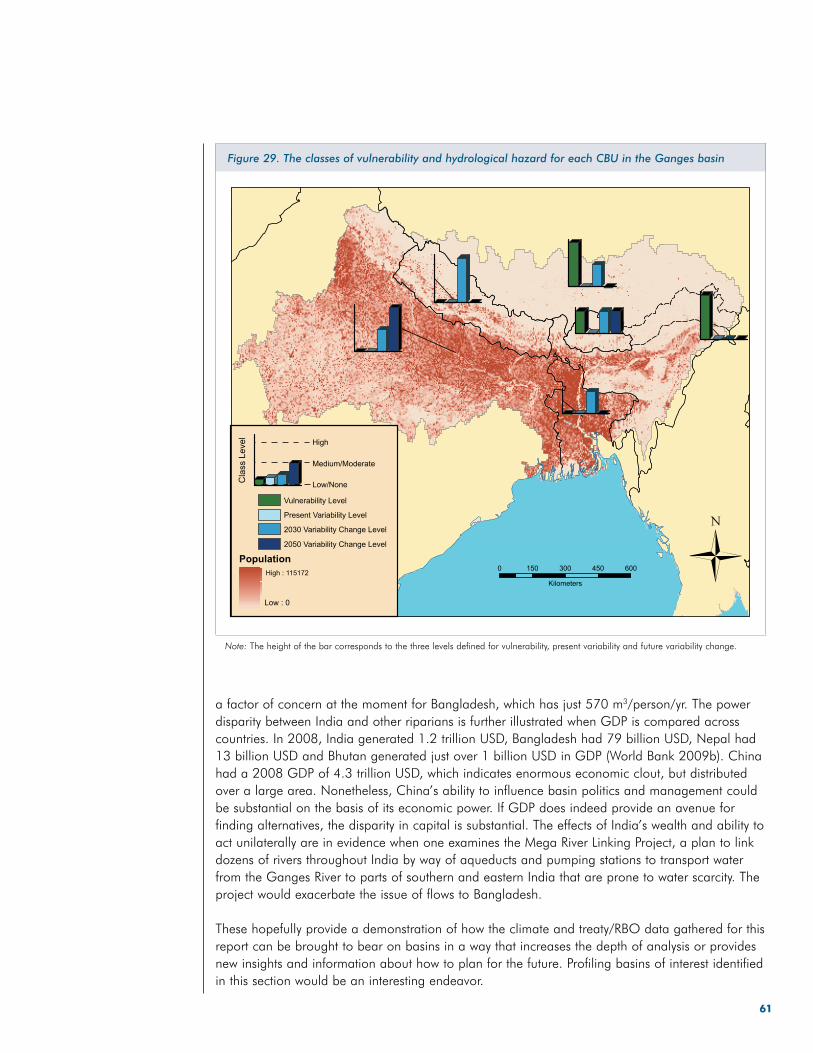
61
a factor of concern at the moment for Bangladesh, which has just 570 m3/person/yr. The power disparity between India and other riparians is further illustrated when GDP is compared across countries. In 2008, India generated 1.2 trillion USD, Bangladesh had 79 billion USD, Nepal had 13 billion USD and Bhutan generated just over 1 billion USD in GDP (World Bank 2009b). China had a 2008 GDP of 4.3 trillion USD, which indicates enormous economic clout, but distributed over a large area. Nonetheless, China’s ability to influence basin politics and management could be substantial on the basis of its economic power. If GDP does indeed provide an avenue for finding alternatives, the disparity in capital is substantial. The effects of India’s wealth and ability to act unilaterally are in evidence when one examines the Mega River Linking Project, a plan to link dozens of rivers throughout India by way of aqueducts and pumping stations to transport water from the Ganges River to parts of southern and eastern India that are prone to water scarcity. The project would exacerbate the issue of flows to Bangladesh.
These hopefully provide a demonstration of how the climate and treaty/RBO data gathered for this report can be brought to bear on basins in a way that increases the depth of analysis or provides new insights and information about how to plan for the future. Profiling basins of interest identified in this section would be an interesting endeavor.
Note: The height of the bar corresponds to the three levels defined for vulnerability, present variability and future variability change.
Figure 29. The classes of vulnerability and hydrological hazard for each CBU in the Ganges basin

63
CHAPTER 5: DISCUSSION
This study is intended to act as a first pass to identify areas that merit further attention, with the expectation that future work looking at these basins would use a finer level of detail and employ more tools and data than used here, as demonstrated in the profiles above. To perform this coarse-filter analysis at a global scale required inevitable simplifications in data. This has the effects and corollaries discussed at the end of the section titled “River basin organization and treaty capacity”. Beyond these constraints, however, there are other caveats in our approach and execution worth mentioning, and ways that this analytical approach could be broadened and extended in future work.
Caveats
The hydrological variables derived from the models and how these intersect with actual human and water systems impose certain limitations on this study. A simple measure such as the interannual variability of runoff does not capture extreme events and cycles that can pose critical threats to institutions. Floods are pulse events that occur on sub-annual time scales, while drought cycles can span multiple years. Neither of these phenomena is guaranteed to appear in a measure such as the coefficient of variation. In addition, future interannual variability had to be calculated from time-slices of only ten years. Moreover, in the analysis we treated CBUs as unconnected units, which means that we did not consider to what extent high water variability changes in one CBU within a basin might increase pressure on the water resources or inter-state relations of other CBUs in that basin.
The disparity between the modeled runoff and the actual occurrence and availability of water in the real world is another caveat worth mentioning. The modeling of runoff assumed ‘natural flows’ with no modification of the precipitation-runoff signal by human infrastructure such as dams and other structures. Similarly, the predictions for the future also reflect only changes to the ‘natural’ flow variability and only due to climate change. This inherently disregards the critical role that land use, land use change, and changes to impoundments play in determining the timing and availability of flows. Similarly, it was not possible to account for changing consumption demands, such as those driven by population growth or migration, or economic and technological changes that could significantly alter the hydrologic cycle, such as global market forces and desalination.
One possible future trend that could not be captured with the data and analysis used here is the secondary influence of land cover change that climate change has on long-term changes in runoff in glacier-fed systems. Global warming is causing a general reduction in the extent of glaciers, which has already led to earlier seasonal discharge peaks and increased runoff from melting in many glacier-fed systems (IPCC 2007a). Climate change is expected to further increase runoff in the near-term as rising temperatures increase glacial melting, but as glacial extent is reduced, the melt-season flows in rivers may decrease over longer time scales (IPCC 2007b). Glaciers are a reliable source of water that compensate hot and dry periods with increased melt and specifically moderate the interannual variability of runoff. Glacier retreat is currently difficult to model in global hydrological models, and a potential increase in variability due to future glacier loss may not be considered in this study. Thus the interaction between treaties, variability and changes in variability may look very different for regions dependent on glaciers, such as the Andes or the Himalayas. In the near-term, increased runoff and earlier peak discharges could add to flooding impacts in areas such as the Ganges river basin. The longer-term decrease in average runoff together with an increased variability may also be underestimated by the data. These secondary

64
processes that also operate at other temporal scales may differ significantly in their potential effects on engendering or ameliorating future hydropolitical tensions over water as compared to those of direct precipitation-related interannual runoff variability. We could not address these with our data and analysis, but the questions of how interannual variability will interact with near-term intra-annual variability and long-term changes in the mean, and how that interaction may affect the efficacy of and demands on transboundary institutions, deserve closer scrutiny.
From the institutional side, a significant assumption of this study is that variability, scarcity and conflict have a relationship, whereby increased variability can lead to times of scarcity that stress institutions, thus leading to conflict if institutional mechanisms are not in place to assuage those stresses. Our understanding of which institutional components work and in what contexts is not yet complete, but the data used for this study present an opportunity to explore this relationship further. In addition, this study reduced the content analysis data in the TFDD to binary presence/absence data. This was necessary to work at the global scale, but that content analysis information could be further utilized to study and profile specific country-basin suites with high levels of risk or examine the historical development of particular mechanisms in socio-political and hydrological contexts of interest. Finally, we assumed that the treaty and river basin organization landscape would not change over time, which is obviously untrue, but allowed us to explore what the institutional world today would look like projected forward into a future affected by climate change.
Directions for further study
There are three areas where further study would be both valuable and productive: future hydrological change at the country-basin level, treaty/RBO composition and efficacy with respect to variability, and the role of non-treaty contextual variables.
The hydrological effects of future climate change are very uncertain, and capturing this uncertainty is critical to examining how future change might impact water systems around the world and how institutions can be prepared to respond successfully and creatively in a context of uncertainty (Walker et al. 2004). The consideration of a larger suite of hydrological indicators of change and how those indicators interact with treaty and RBO coverage could provide interesting and complementary insights into the results detailed here. Some examples are: changes in the annual runoff mean that would indicate changes in water availability; a measure of intra-annual variability and changes in that metric over time that would reflect shifting seasonal patterns; or data on extreme events such as floods. Along the same lines, comparing the different indices of change and their effects on the robustness of the results from this methodology would be useful as well. Using different temporal windows of analysis for quantifying variability and generating hydrological indicators would help us better understand the impacts of temporal scale on the results of this study. Beyond these suggestions, the continued integration of the latest climate change science and modeling with current understandings of institutional resilience and composition is necessary, as these fields are rapidly changing both with respect to methodology and their objects of study. This makes continued reflection through model validation and re-analysis critical for refining our understanding of the system dynamics of interaction and change.
The make-up of water treaty regimes is inherently complex and varies from place to place, and yet there are certain characteristics that hold at the global scale. One avenue that would strengthen the methodological approach used by this study would be to explicitly examine the exact nature of institutional components that have provided resilience to variability in the hydrologic regime in the past without the generation of conflict, and indeed preliminary quantitative work is underway in this direction (Dinar et al. 2008). This could include on one hand a more nuanced inquiry into the

65
components examined here, such as allocation, by further studying the treaty content analysis housed in the TFDD. These analyses might examine patterns of historical treaty development or regional differences in the types of mechanisms being put into place given the transboundary basin context, both politically and hydrologically. Specifically, it would be useful to examine what institutional mechanisms have been implemented in basins with historically high variability, and learn what those basins have in common in terms of treaty or RBO capacity. On the other hand, a broader look at other components that might provide sources of resilience that could not be included here would also be valuable. One stipulation argued to be important for treaty resiliency in the context of climate variability relates to the agreement’s ability to link the water issue under contention to other issues of import to the parties. Sometimes referred to as issue-linkage (Wolf and Hamner 2000, Bennett et.al. 1998) or benefit-sharing (Phillips et. al. 2006) the strategy increases the agreement’s stability since parties may prefer not to defect as they will lose out on other benefits they have negotiated or linked to the water negotiations. In other words, the degree to which a treaty augments the incentives of the parties towards cooperation increases the level of self-enforcement achieved by the treaty (Barrett 2003). Another related strategy includes the use of side-payments or financial compensation to essentially incentivize cooperation (Dinar 2006). These financial transfers may be particularly instrumental in more challenging geographical contexts where strategic behavior is a function of an upstream-downstream river formation (Le Marquand 1977, Dinar 2008). By way of one example, benefit-sharing was clearly stipulated in the 1961 Columbia River Agreement whereby the hydropower, created as a function of Canadian dam construction upstream, was to be shared equally between Canada and the United States. Side-payment transfers were also an important part of this agreement as the United States compensated Canada not only for the upstream storage reservoirs constructed but for associated flood-control benefits. By way of another example, issue-linkage was used in the 1998 Syr Darya River Agreement in the form of coal and gas from downstream Kazakhstan and Uzbekistan for the sake of water deliveries from upstream Kyrgyzstan. Benefit-sharing, issue-linkage, and side-payment schemes are also argued to be important in increasing the self-enforceability of a given treaty in the context of high variability and uncertainty.
When considering further studies of the interaction between variability, treaty-mediated resiliency, and conflict, it is imperative to consider other contextual, non-treaty variables that may exacerbate or assuage inter-state tensions. Four factors in particular have been touted in the international relations and hydro-politics literature as important. They include overall relations among the respective parties, trade, democracy, and geography.
The extent of diplomatic ties and a history of militarized disputes may affect the incidence or intensity of conflict resulting from water variability. Yoffe et.al. 2003 (2003:1117), for example, contend that countries that cooperate in general also cooperate over water, and countries with overall unfriendly relations are also unfriendly over water. A protracted dispute may be, at least partially, a result of a history of militarized disputes (Lowi 1993). To that extent, it is logical to expect that states with a more robust history of diplomatic relations will be more likely to elicit fewer grievances, or less intense conflict, given water variability. For now, studies have demonstrated that a fairly stable and rich history of diplomatic relations over time may create better conditions for treaty formation (Dinar et.al. 2007).
Based on the claim that increased interdependence in the form of trade decreases the likelihood of militarized conflict among countries and enhances cooperative political relations (Mansfield and Pollins 2003), studies have also shown that heightened trade facilitates environmental treaty formation (Neumayer 2002a, Espey and Towfique 2004, Tir and Ackerman 2009, Dinar, Dinar, and Kurukulasuriya 2007). Given that trade is also argued to act as a contract-enforcing mechanism (Stein 2003), it is logical to expect lower incidents of conflict given climate uncertainty

66
and increased variability. In other words, trade acts (indirectly perhaps) to enforce the parties’ compliance with the treaty’s obligations. Preliminary quantitative studies support this contention in relation to grievance intensity (Dinar et al. 2008) and these findings could prove valuable to future studies of treaty coverage and resilience to variability and change in water systems.
The political make-up of the respective state regimes may also influence the incidence of country grievances or their intensity. In particular, the extant literature on international conflict and cooperation touts democracies as more peaceful to one another as opposed to, say, a dyad of non-democracies or even a dyad made up of one democracy and one non-democracy (Rummel 1993). One reason for this relative peace among democracies pertains to their domestic political culture of conflict resolution, compromise, and regulated political competition. These domestic attributes and characteristics are then translated and similarly applied to the international arena as well, specifically when democracies interact with one another (Russett 1993). This claim has been examined in the environmental politics literature in general (Neumayer 2002b) and the hydro-politics literature in particular (Espey and Towfique 2004; Brochmann and Hensel 2009). By way of a related conjecture, such empirical works have hypothesized that democracies will tend to be more inclined to demonstrate heightened environmental commitment in the form of treaty signature and formalized cooperation. Extrapolating this to the case of treaty resilience as a function of climate variability, one would expect a pair of democracies (as opposed to a pair of autocracies or a pair made up of a democracy and autocracy) to exhibit fewer country grievances or a lower intensity of grievances. The many alternative methods of conflict resolution available to these countries may be the key reason.
The geographical location of the state and the configuration of the river itself may also work to influence the incidence of country grievances due to climate variability. The extant literature has consistently claimed that rivers with an upstream-downstream typology are notoriously conflict prone (Falkenmark 1990:180). Due to the geographical asymmetry inherent in such a typology, an upstream state can theoretically halt the flow of water or pollute the river to the detriment of the downstream state (a unidirectional externality). While the relative power dynamics among the riparians is relevant for this discussion, strategic maneuvering is expected to be the norm for such a river configuration. This is contrasted with a more symmetric river configuration where the river straddles the entire border or a portion thereof. In this particular case, any state that acts to the detriment of the other riparian is, generally, also harming itself (a reciprocal externality). This is most apparent when the river straddles the entire border. Interestingly, empirical results based on studies that examine the linkage between conflict and river configuration have found some support for this claim but overall results remain ambiguous (Toset et.al. 2000; Gleditsch et al. 2006). Moreover, empirical studies that have considered the effects of geography on cooperation (measured as a treaty) have found no connection (Dinar et.al. 2007; Tir and Ackerman 2009). In other words the upstream-downstream typology does not affect the likelihood of cooperation. Rather, the geographical configuration of the river has been found to influence the type of commons regime states negotiate (Giordano 2003). Due to the strategic maneuvering upstream states may still employ in such contexts the literature has found that side-payments are a common concomitant used by downstream states to encourage upstream cooperation (Dinar 2006). Extrapolating from this onto the question of grievances based on climate variability, one would expect that the more asymmetry implicit in the river in question, the higher the likelihood of grievances or the intensity of these grievances based on the notion that strategic maneuvering and more tensions are likely in such asymmetric contexts. In complement to grievances, further study of basin-wide imbalances of treaty capacity—basins where there is a disparity in treaty/RBO scores for the constituent CBUs—with a special focus on the geography of the CBU position and orientation could yield interesting insights.
67
CHAPTER 6: CONCLUSIONS
International water agreements and RBOs are considered important instruments for dealing with rapid physical changes in a given basin. The same may be true regarding the importance of institutions in regions experiencing the effects of climate change and increased water variability. Beyond the mere existence of such a regime, the make-up and design of treaty institutions is anticipated to be particularly important in assuaging inter-state conflict or country grievances. In other words, the institutional capacity of international water agreements to deal with uncertainty is paramount to basin-wide stability. Specific treaty and RBO mechanisms for dealing with variability should, therefore, matter in enhancing treaty stability and resiliency to variability. Indeed, preliminary quantitative research has demonstrated that international water treaties with particular mechanisms such as conflict resolution and drought adaptability exhibit a reduction in the intensity of associated country grievances.
This study aimed to increase understanding of the global distribution of treaty and river basin organization mechanisms that may confer resilience to variability in the hydrological regime and how that distribution matches with current and anticipated regimes. We assessed all available international treaties for their status as a specific water treaty and the presence of allocation, conflict resolution and variability management mechanisms. We mapped the spatial distribution of these mechanisms and the presence of river basin organizations at the country-basin unit level, and compared this to both the current runoff variability regime and projections of future runoff variability regimes driven by climate change. This allowed us to identify basins at varying levels of risk. The identification of these areas at the global scale contributes to anticipating where future challenges in transboundary water management might arise and understanding the way existing or new water agreements might be adapted to accommodate the effects of climate change.
In creating the country-basin unit and treaty databases 747 CBUs were identified, and data previously collected on over 600 treaties were entered. The concept of the territorial treaty application was introduced to allow spatial analysis of treaties that were originally signed by entities that no longer exist. Of these 747 CBUs, 389 had at least one water treaty, and beyond this, conflict resolution mechanisms were the most common while variability management mechanisms were the least. Treaty/RBO score distributions grouped by regions varied by economic and geographic factors. Differences between representations of treaty/RBO coverage by region based on population or area helped us assess the implications of the observed distribution. Large proportions of CBUs in SAR and LCR did not have high levels of treaty/RBO coverage but much of the area and nearly all the population in SAR are covered by the highest treaty/RBO score with a similar picture for LCR. By contrast, a much larger proportion of the population and area in the EAP region have little treaty/RBO coverage. A number of basins had large disparities among constituent CBUs in their treaty and RBO coverage, demonstrating the value of using a CBU approach. Eight CBUs in one basin had at least one treaty with all components while another CBU in the same basin had no components, showing extreme disparity and hampering the capacity for comprehensive basin management. Conversely, of the 393 basins with at least one treaty in place, 74 basins exhibited score coherence, where all constituent CBUs had the same non-zero treaty/RBO scores.
With respect to hydrology, quantitative measures of variability at the CBU level were used. Present variability was measured using the interannual coefficient of variation for runoff, and future changes in variability in relation to three climate scenarios were quantified relative to the present.

68
There are clear spatial patterns in the present interannual runoff variability, with the highest values generally found in transitional climate zones such as the outer tropics and sub-tropics, while core areas of the polar and tropical climate regions experience low variability. Greater degrees of change were observed for 2030 than 2050, with much of the change again occurring in the subtropics, but also in some more equatorial regions.
The combination of hydrological hazard (present variability or future variability change) and institutional vulnerability (a lack of treaty/RBO coverage) generated classes of overall risk. There were 35 CBUs in the highest risk class under current variability conditions with clear spatial concentrations in the AFR and MNA regions. There were also marked differences between regions in the frequency of occurrence for certain mechanisms, particularly for allocation and variability mechanisms. There were 86 CBUs in the highest level of risk due to variability change by 2030, and they were more spatially dispersed than in the present variability class. In combining present and future risk, 29 of the most vulnerable CBUs had low present variability coupled with a high degree of change in 2030, while 13 CBUs had both high present variability and a high degree of change. In 2050, there were 25 CBUs in the highest risk group and they were also more spatially dispersed than those in the highest present risk class. The highest risk is found in central Asia, Eastern Europe and Africa. Of the most vulnerable CBUs, three were in the lowest present variability class and the highest degree of change while only four were in the highest classes for both present variability and future change.
We selected basins for further study using two filters and found sixteen that merit further consideration with respect to their current or future risk levels, their level of treaty/RBO coverage and their relative importance to several basin measures. Basins such as the Narva and Lielupe in central Asia have CBUs with variability increases greater than 15% and a shift in their actual variability class between now and 2030 or 2050, which could cause stresses on institutions and infrastructure. Interestingly, the global distribution of these basins depends on whether high present variability is considered, further reinforcing our findings that higher risk due to climate change is projected to occur away from those areas currently under scrutiny. Determining where institution-building should be focused using historic regimes of variability could miss those areas with the greatest need for increased resilience in their social systems to absorb, adapt to or transform from change in the hydrologic system. While an accounting of the present-day variability is critical to planning short-term development, building greater resilience in the overall social-hydrological system might require focusing on territories not currently exhibiting great variability.
This study is intended to act as a first pass at identifying areas that merit further attention, with the expectation that future work looking at these basins would use a finer level of detail and employ more tools and data than used here. Since we had to apply a coherent methodology globally, the precision and richness of nuance typical of a case study approach was not possible. The study worked solely with treaty texts and could not consider other factors such as treaty equity, conflicts among riparians or the degree of treaty implementation that combine to determine the overall treaty efficacy. For this reason, our methodology may yield treaty/RBO coverage that, in some cases, does not match the actual resilience of a basin because of discrepancies between the treaty text and treaty implementation. With respect to hydrology, the interannual variability of runoff does not capture all changes in hydrology expected from climate change such as long-term changes or timing and magnitude of extreme events. Another notable limitation is that the runoff modeling assumed ‘natural flows’ with no interaction between precipitation and human infrastructure, disregarding the critical role land use, land use change and impoundment play in determining the timing and availability of flows.

69
Further study should focus on how to refine the representation of treaty and RBO capacity, perhaps by considering specific formulations of mechanisms or by examining new mechanisms such as issue-linkage and benefit sharing. A closer look at disparities within basins in treaty/RBO coverage would also be useful. Beyond these formal mechanisms, there are contextual variables that may also play a role in abating or assuaging inter-state grievances and conflict due to climate variability. The extent of trade between the respective parties and the overall relations among states may be appropriate indicators of how these parties will likewise interact in terms of their shared rivers. Since the extent of trade is often a measure of the level of interdependence among the parties, countries that trade more tend to exhibit lower intensity of country complaints. A similar argument is made for the type of relations among states as countries that have robust diplomatic relations tend to have friendlier relations over water. The type of political regime of the respective countries may also play a role in either reducing the likelihood of grievances or at least reducing the intensity of such grievances since democracies (as opposed to non-democracies) may be more likely to adopt other forms of conflict resolution. Finally, the geographical configuration of the river may also have an effect on the likelihood of country grievances. The more asymmetry in a particular river typology, the higher the likelihood of strategic maneuvering one would expect from the riparians. In turn this could lead to more disputes and grievances among the countries. Finally, continuing to integrate new understandings about the timing, location, magnitude, and nature of hydrological changes in response to climate change will be critical for refining the picture of where potential risk may be found in the future.
The global distribution of treaties and river basin organizations is quite varied, and reflects a long and complex history of development in response to specific demands on water systems and larger socio-political processes. Likewise, the variability in basin-wide hydrological regimes is unevenly distributed in space, and intersects with human use and management in both intra-national and international settings. Global climate change adds another layer to this already complex picture. Understanding when and where to target capacity-building in transboundary river basins for greater resilience to both expected and unexpected change is critical. This study represents a first step toward facilitating these efforts and opens the way to many new and exciting opportunities for further research into the relationship between hydrological variability regimes and institutional capacity for accommodating variability.


71
CHAPTER 7: REFERENCES
Agreement between the government of the Polish People’s Republic and the government of the Union of Soviet Socialist Republics concerning the use of water resources in frontier waters, signed July 17, 1964. (Referred to in the text as the 1964 Vistula River Agreement).
Agreement concerning the regulations governing Lake Saimaa and the Vuoksi River (with annexes). Signed at Helsinki, signed October 26, 1989. (Referred to in the text as the 1989 Vuoksi River/Lake Saimaa Agreement).
Agreement between the governments of the Republic of Kazakhstan, the Kyrgyz Republic, and the Republic of Uzbekistan on joint and complex use water and energy resources of the Naryn Syr Darya cascade reservoirs, signed March 17, 1998. (Referred to in the text as the 1998 Syr Darya River Agreement).
Anderson, E.W. 2003. International Boundaries: A geopolitical atlas. New York: Routledge.Bakker, M. 2007. Transboundary river floods: vulnerability of continents, international river basins
and countries. Oregon State University, Ph.D. Dissertation.Bakker, M. 2009. Transboundary river floods and institutional capacity. Journal of the American
Water Resources Association, 45(3): 553–566.Barrett, S. 2003. Environment and Statecraft: The Strategy of Environmental Treaty-Making. Oxford:
Oxford University Press.Bennett, L., S. Ragland, and P. Yolles. 1998. Facilitating international agreements through an
interconnected game approach: The case of river basins. In Just, R. and S. Netanyahu (eds.) Conflict and cooperation on transboundary water resources, 61–85. Boston, MA: Kluwer Academic Publishers.
Brochmann, M. and P. Hensel. 2009. Peaceful management of international river claims. International Negotiation, 14: 393–418.
Complementary settlement to the agreement of cooperation between the government of the Eastern Republic of Uruguay and the government of the Federal Republic of Brazil for the use of natural resources and the development of the Cuareim river basin, signed May 6, 1997. (Referred to in the text as the 1997 Cuareim River Agreement).
Dinar, S., A. Dinar. and P. Kurukulasuriya. 2007. Scarperation: An empirical inquiry into the role of scarcity in fostering cooperation between international river riparians. World Bank Policy Research Working Paper, no. 4294, Washington, D.C.
Dinar, S. 2006. Assessing side-payment and cost-sharing patterns: The geographic and economic connection. Political Geography, 25 (4): 412–437.
Dinar, S. 2008. International water treaties: Negotiation and cooperation along transboundary rivers. London: Routledge.
Dinar, S., O. Odom, A. McNally, B. Blankespoor, and P. Kurukulasuriya. 2008. Climate change and state grievances: The resiliency of international river treaties to increased water variability. World Bank Working Paper.
Döll, P. and S. Siebert. 1999. A digital global map of irrigated areas. Kassel World Water Series 1, Center for Environmental Systems Research, University of Kassel, Germany, 23 pp + Appendix. Available at http://wwdrii.sr.unh.edu/download.html.
Drieschova, A, M. Giordano, and I. Fischhendler. 2008. Governance mechanisms to address flow variability in water treaties. Global Environmental Change, 18: 285–295.
Espey, M, and B. Towfique. (2004) International bilateral water treaty formation. Water Resources Research, 40, W05S05, doi:10.1029/2003WR002534.

72
Exchange of letters constituting an agreement between France and Spain amending the arrangement of 12 July 1958 relating to Lake Lanoux, signed January 27, 1970. (Referred to in the text as the 1970 Lake Lanoux Agreement).
Falkenmark, M. 1989. The massive water scarcity now threatening Africa-Why isn’t it being addressed? Ambio, 18 (2): 112–118.
Falkenmark, M. 1990. Global water issues confronting humanity. Journal of Peace Research, 27: 177–190.
Fekete, B., C.J. Vörösmarty, and W. Grabs. 2000. UNH/GRDC Composite Runoff Fields V 1.0. Available at http://www.grdc.sr.unh.edu.
Fischhendler, I. 2004. Legal and institutional adaptation to climate uncertainty: A study of international rivers. Water Policy, 6 (4): 281–302.
Giordano, M. 2003. The geography of the commons: The role of scale and space. Annals of the Association of American Geographers, 93: 366–75.
Gleditsch, N.P., K. Furlong, H. Hegre, B. Lacina, and T. Owen. 2006. Conflicts over shared rivers: Resource scarcity or fuzzy boundaries? Political Geography, 25: 361–382.
Haas, P. 1992. Introduction: Epistemic communities and international policy coordination. International Organization, 46: 1–35.
Indus waters treaty between the Government of India, the Government of Pakistan, and the International Bank for Reconstruction and Development, signed September 19, 1960. (Referred to in the text as the Indus Water Treaty).
(IPCC) Intergovernmental Panel on Climate Change. 2001. Climate change 2001: Impacts, adaptation, and vulnerability. Contribution of working group II to the third assessment report of the Intergovernmental Panel on Climate Change. Cambridge: Cambridge University Press.
IPCC. 2007a. Climate Change 2007: Synthesis Report. Contribution of Working Groups I, II and III to the Fourth Assessment Report of the Intergovernmental Panel on Climate Change. Core Writing Team, Pachauri, R.K. and A. Reisinger (eds.) IPCC, Geneva, Switzerland.
IPCC 2007b. Climate Change 2007: Impacts, Adaptation and Vulnerability. Contribution of Working Group II to the Fourth Assessment Report of the Intergovernmental Panel on Climate Change. Parry, M.L., O.F. Canziani, J.P. Palutikof, P.J. van der Linden, and C.E. Hanson (eds.) Cambridge: Cambridge University Press.
Keohane, R. 1982. The demand for international regimes. International Organization, 36: 325–355.
Kilgour, M. and A. Dinar. 2001. Flexible water sharing within an international river basin, Environmental and Resource Economics, 18: 43–60.
Le Marquand, D. 1977. International rivers: The politics of cooperation. Vancouver: Westwater Research Centre, University of British Columbia.
Lowi, M. 1993. Water and power: The politics of a scarce resource in the Jordan River Basin. Cambridge: Cambridge University Press.
Mansfield, E. and B. Pollins (eds.). 2003. New perspectives on economic exchange and armed conflict. Ann Arbor, MI: University of Michigan Press.
Neumayer, E. 2002a. Does trade openness promote multilateral environmental cooperation? World Economy, 25: 815–832.
Neumayer, E. 2002b. Do democracies exhibit stronger international environmental commitment? A cross-country analysis, Journal of Peace Research, 39: 139–164.
Oak Ridge National Laboratory (ORNL). 2008. LANDSCAN 2007 Global Population Dataset. Available at http://www.ornl.gov/sci/landscan.
Odom, O. and A.T. Wolf. 2008. Institutional resilience and climate variability in international water treaties: The Jordan River basin as “proof-of-concept.” Public Interest Environmental Law Conference, University of Oregon School of Law. Eugene, Oregon. USA.

73
Ostrom, E. 2007. Institutional rational choice, an assessment of the institutional analysis and development framework. In P.A. Sabatier (ed.), Theories of the policy process. Boulder, CO: Westview Press.
Peel M.C., T.A. McMahon, B.L. Finlayson, and F.G.R. Watson. 2001. Identification and explanation of continental differences in the variability of annual runoff. Journal of Hydrology, 250: 224–240.
Phillips, D., M. Daoudy, S. McCaffrey, J. Öjendal, and A. Turton. 2006. Trans-boundary water co-operation as a tool for conflict prevention and broader benefit sharing. Global Development Studies, 4, Ministry of Foreign Affairs, Sweden.
Rummel, R. 1983. Libertarianism and international violence. Journal of Conflict Resolution, 27: 27–71.
Russett, B. 1993. Grasping the democratic peace: Principles for a post-Cold War world. Princeton, NJ: Princeton University Press.
Schmeier, S. and S. Ogden. 2009. River Basin Organization Database, Oregon State University (unpublished data).
Stahl, K. 2005. Influence of hydroclimatology and socio-economic conditions on water-related international relations. Water International, 30 (3): 270–282.
Stein, A. 2003. Trade and conflict: Uncertainty, strategic signaling, and interstate disputes, in Mansfield, E and B. Pollins (eds.), New perspectives on economic exchange and armed conflict, Ann Arbor, MI: University of Michigan Press.
Strzepek, K. and A. McCluskey. 2009. Personal communication and unpublished data.Tir, J. and J. Ackerman. 2009. Politics of formalized river cooperation. Journal of Peace Research,
46: 623–640.Tir, J., P. Schafer, P.F. Diehl, and G. Goertz. 1998. Territorial changes, 1816–1996. Conflict
Management and Peace Science, 16: 89–97.Toset, H.P.W., N.P. Gleditsch, and H. Hegre. 2000. Shared rivers and interstate conflict. Political
Geography, 19: 971–996.Treaty between the United States of America and Canada relating to cooperative development of
the water resources of the Columbia River Basin, signed January 17, 1961. (Referred to in the text as the 1961 Columbia River Agreement).
Treaty of peace between the State of Israel and the Hashemite Kingdom of Jordan. Article 6, signed October 26, 1994. (Referred to in the text as the 1994 Jordan River Agreement).
Treaty between the government of the Republic of India and the government of the People’s Republic of Bangladesh on sharing of the Ganga/Ganges waters at Farakka, signed December 12, 1996. (Referred to in the text as the 1996 Ganges River Agreement).
Vienna Convention of the Law of Treaties, Article 2 (1), United Nations, Treaty Series, vol. 1155 (1969), p. 331. www.unep.org/ozone/Treaties_and_Ratification/2A_vienna_convention.asp.
Vörösmarty, C.J., E.M. Douglas, P.A. Green, and C. Revenga. 2005. Geospatial indicators of emerging water stress: An application to Africa. Ambio, 34 (3): 230–236.
Walker, B., C.S. Holling, S.R. Carpenter, and A. Kinzig. 2004. Resilience, adaptability and transformability in social–ecological systems. Ecology and Society 9(2): 5. Available online at: http://www.ecologyandsociety.org/vol9/iss2/art5/.
Wolf, A. and J. Hamner. 2000. Trends in transboundary water disputes and dispute resolution. In Green Cross International (ed.) Water for peace in the Middle East and Southern Africa, 55–66. Geneva: Green Cross International.
Wolf, A. T., K. Stahl, and M.F. Macomber. 2003a. Conflict and cooperation within international river basins: The importance of institutional capacity. Water Resources Update, 125. Universities Council on Water Resouces.
Wolf, A. T., S. Yoffe, and M. Giordano. 2003b. International waters: Identifying basins at risk. Water Policy, 5 (1): 29–60.

74
World Bank. 2009a. Water and climate change: Understanding the risks and making climate-smart investment decisions. Water Anchor. Energy, Transport and Water Department. Washington DC: The World Bank.
World Bank. 2009b. World Bank Development Indicators database: Gross domestic product 2008. Updated 7 October 2009. Available online at http://siteresources.worldbank.org/datastatistics/Resources/GDP.pdf. Accessed November 23, 2009.
Yoffe, S., B. Ward, B., and A. Wolf. 2000. The Transboundary Freshwater Dispute Database Project: Tools and Data for Evaluating International Water Conflict. Online at http://www.transboundarywaters.orst.edu/publications/.
Yoffe, S., A.T. Wolf, and M. Giordano. 2003. Conflict and cooperation over international freshwater resources: Indicators of basins at risk. Journal of the American Water Resources Association, 39(5): 1109–1126.
Yoffe, S., G. Fiske, M. Giordano, M.A. Giordano, K. Larson, K. Stahl, and A.T. Wolf. 2004. Geography of international water conflict and cooperation: Data sets and applications. Water Resources Research, 40, W05S04, doi:10.1029/2003WR002530.
Zawahri, N. 2009. Third party mediation of international river disputes: The case of the Indus Basin. International Negotiation, 14: 281–310.


The World Bank1818 H Street N.W.Washington, D.C. 20433USA