mapping the local organization of cell membranes using excitation
TRANSCRIPT
Biophysical Journal Volume 105 July 2013 127–136 127
Mapping the Local Organization of Cell Membranes Using Excitation-Polarization-Resolved Confocal Fluorescence Microscopy
Alla Kress, Xiao Wang, Hubert Ranchon, Julien Savatier, Herve Rigneault, Patrick Ferrand, and Sophie Brasselet*Aix Marseille Universite, CNRS, Centrale Marseille, Institut Fresnel, UMR 7249, F-13013 Marseille, France
ABSTRACT Fluorescence anisotropy and linear dichroism imaging have been widely used for imaging biomolecular orienta-tional distributions in protein aggregates, fibrillar structures of cells, and cell membranes. However, these techniques do not giveaccess to complete orientational order information in a whole image, because their use is limited to parts of the sample where theaverage orientation of molecules is known a priori. Fluorescence anisotropy is also highly sensitive to depolarization mecha-nisms such as those induced by fluorescence energy transfer. A fully excitation-polarization-resolved fluorescence microscopyimaging that relies on the use of a tunable incident polarization and a nonpolarized detection is able to circumvent these limita-tions. We have developed such a technique in confocal epifluorescence microscopy, giving access to new regions of study in thecomplex and heterogeneous molecular organization of cell membranes. Using this technique, we demonstrate morphologicalchanges at the subdiffraction scale in labeled COS-7 cell membranes whose cytoskeleton is perturbed. Molecular orientationalorder is also seen to be affected by cholesterol depletion, reflecting the strong interplay between lipid-packing regions andtheir nearby cytoskeleton. This noninvasive optical technique can reveal local organization in cell membranes when used asa complement to existing methods such as generalized polarization.
INTRODUCTION
Investigating biological processes using the polarization oflight is a well developed approach for studying the struc-tural organization of proteins and lipids. In cell biology,such organization is the direct signature of molecular inter-action mechanisms that play a determining role in biolog-ical functions such as cell shape maintenance and motility(1), vesicular trafficking (2), or signaling (3). In fluores-cence, the orientational organization of molecules comesinto play, because they are preferentially excited when theirabsorption transition dipole is parallel to the incident polar-ization direction. This property has been exploited influorescence anisotropy for decades (4) by comparing thefluorescence signals recorded along analysis directionsparallel and perpendicular to the incident polarization.Fluorescence anisotropy and its equivalent scheme, lineardichroism (which considers two orthogonal excitationpolarizations), have been primarily developed for studiesin solution, giving access to information on the orienta-tional dynamics of proteins and, consequently, on theirstructure and conformation. The application of these meth-odologies to imaging, initiated in isotropic media such asfor the mapping of cell cytoplasm viscosity (5), havebeen focused more recently on biomolecular assembliesexhibiting a degree of orientational order. Fluorescenceanisotropy and linear dichroism have helped to solveimportant questions, giving evidence of glycoprotein’sconfinement in cell membranes to nanometer-scale lipiddomains (6), septin filament conformation in cell division(7), cytoskeleton actin organization (8,9), a-synuclein
Submitted October 31, 2012, and accepted for publication May 21, 2013.
*Correspondence: [email protected]
Editor: Lukas Tamm.
� 2013 by the Biophysical Society
0006-3495/13/07/0127/10 $2.00
aggregation in fibrils involved in neurodegenerativediseases (10), membrane receptor conformational changesupon cell activation (11), and plasma membranemorphology specificities (2,12).
These techniques suffer from some limitations, however.First, they are not adapted to ordered samples, given thatthey rely on a preferential photoselection (or emission)direction imposed by the incident excitation polarization(or analyzer). They are consequently unable to providecomplete information on how the molecular assembly isoriented (defined by its average orientation) and how it isangularly ordered (defined by the molecular orientationalorder). Since only one of these two parameters is accessible,a measure of molecular orientational order requires workingwith samples of controlled geometry, where the averagedorientation can be known a priori. This explains the widerange of studies in membranes of round shapes such asred blood cells (13), giant unilamellar vesicles (14), cellblebs (15), or round cells (16). Another way to adaptanisotropy or linear dichroism to oriented structures is toaddress only particular regions of the sample where themolecules lie on average along or perpendicular to theincident polarization direction, such as horizontal or verticalparts of a membrane in the cell contour image (11,12,17).Although both workarounds have allowed new findings,their limitations considerably reduce the range of explora-tion, making it impossible to grasp the full complexity ofmolecular organization in heterogeneous samples. Finally,fluorescence anisotropy can be easily biased by depolariz-ing mechanisms such as energy transfer between neighbormolecules or the existence of an angle between absorptionand emission transition dipoles in the excited molecule.Although depolarization induced by fluorescence resonance
http://dx.doi.org/10.1016/j.bpj.2013.05.043

128 Kress et al.
energy transfer between molecules (homo-FRET) has beenadvantageously used to image changes in protein clustering(18,19) or actin polymerization in cells (20), it is detri-mental when trying to quantify molecular structural organi-zation. This mechanism can indeed introduce erroneousinterpretations of the data if they are not studied separately(17,21).
Recently, new techniques, based on tuning of the excita-tion polarization, have been proposed to circumvent theselimitations by exploiting the full potential of polarizedfluorescence imaging, (21–24). Such techniques, whichcan be considered as more universal linear dichroismmethods, allow retrieval of complete information on bothmolecular orientational order and average orientation in anonambiguous manner in a whole image of the investigatedsamples, not just in particular regions. One method (21) wasbased on two-photon excitation-polarization tuning, allow-ing sample sectioning with polarized detection, which,because it is sensitive to depolarization mechanisms (suchas homo-FRET), can suffer from a low level of signals.A second scheme (22,23) removed the polarized detectionto circumvent these effects, and improved the time resolu-tion using wide-field illumination. To avoid polarizationdistortion issues, however, this scheme was implementedin the forward-direction detection mode, which is not appro-priate for many samples, leads to faster photobleaching, anddoes not yield depth sections (24). In this work, we imple-ment an excitation-polarization-resolved technique in anepiconfocal sectioning mode, which is appropriate for thevast majority of biological systems. We discuss the temporalresolution limit of this method and its ability to work in 3Dorientational directions. In addition, we develop a dataanalysis tool that provides considerable improvement insignal processing time and precision compared to previousapproaches (21), allowing the monitoring of molecularorientational order and orientation dynamics over time-scales of seconds. This method is appropriate for themeasurement of phenomena averaged in space over thediffraction-limit size of an optical microscope and in timeover a timescale of seconds.
We demonstrate the benefits of this configuration in mo-lecular orientational order imaging along cell-membraneequatorial contours labeled with lipid probes. We show inparticular that the subdiffraction-scale local morphologicalfeatures of a cell membrane can be quantified in vivo,whereas until now these characteristics have been measuredby indirect or invasive methods (25–27). Studies of cellsaffected by pharmacological treatments that induce cyto-skeleton perturbation or cholesterol depletion show a sig-nificant change of their molecular orientational order.The observed effects corroborate previous findings basedon membrane stiffness measurements (28) and generalizedpolarization (GP), which measures lipid packing bythe spectral sensitivity of lipid probes to local polarity(29–31). The new piece of information on subdiffraction-
Biophysical Journal 105(1) 127–136
scale morphological features can complement investigationsof lipid packing and avoid biased interpretations in existingmethods such as fluorescence correlation spectroscopy(FCS).
MATERIALS AND METHODS
Cells preparation
All experiments were carried out on fibroblastlike COS-7 cells (American
Type Culture Collection (ATCC) No. CRL-1657, Manassas, VA). COS-7
cells were grown in an incubator at 37�C in Lab-Tek chambers (Nunc,
Rochester, NY) in DMEMmedium (Gibco, Saint Aubin, France) completed
by 10% FBS and 1% sodium pyruvate. Cells were washed and kept in
Hanks buffered salt solution containing 10 mM HEPES (HBSS/HEPES),
pH 7.4, at 37�C, for the duration of the imaging process. Cells were labeled
with di-8-ANEPPQ directly before measurements and after the pharmaco-
logical treatments. For labeling, cells were washed and incubated in inser-
tion buffer (NaCl 130 mM, KCl 5 mM, CaCl2 10 mM, glucose 5 mM, and
HEPES 10 mM) with 1 mMdi-8-ANEPPQ (dissolved by absolute ethanol to
1 mM for preservation and usage) for 2 min at room temperature. After
incubation, cells were washed again and kept in HBSS/HEPES at 37�Cthroughout the imaging process. Cells were labeled with DiIC18 directly
before measurements and after the pharmacological treatments. For label-
ing, cells were washed and incubated in HBSS/HEPES with 1 mM DiIC18(dissolved by absolute ethanol to 1 mM for preservation and usage) for
2 min at room temperature. After incubation, cells were washed again
and kept in HBSS/HEPES at 37�C for the whole imaging process. The
concentration of the dyes used did not affect cell shape for the duration
of the measurements. For pharmacological treatments that alter cytoskel-
eton fibers, cells were washed in HBSS/HEPES and incubated at 37�Cwith 1 mM latrunculin A (5 min), 10 mM cytochalasin D (30 min), or
0.5 mM jasplakinolide (5 min). Cells were then washed with HBSS/HEPES
and labeled and kept in HBSS/HEPES with 10-fold-diluted reagent for the
duration of the imaging process. For pharmacological treatments that
deplete cholesterol content, cells were washed in HBSS/HEPES and
incubated at 37�C in serum-free medium with either 2.5 mM or 100 mM
methyl-b-cyclodextrin (MBCD) (5 min). For treatment with cholesterol
oxidase, cells were first starved with serum-free medium for 1 h at 37�C.Either 1 or 5 units of cholesterol oxidase stock solution was added per
1 ml serum-free medium, and the mixture was then incubated for 2 h.
Cells were then washed with HBSS/HEPES and kept in HBSS/HEPES
for the entire imaging process. Finally, to induce hypotonic shock, cells
were swollen in a solution of 80% H2O and 20% HBSS/HEPES and imaged
after 15 min.
Excitation-polarization-resolved fluorescenceimaging set-up
Measurements were carried out on a custom confocal microscope system,
adapted to allow full control of the polarization state of the excitation
beam (Fig. S1 in the Supporting Material). Excitation is provided by a
polarized continuous-wave laser (Calypso, Cobolt, Solona, Sweden) emit-
ting at 491 nm that delivers linearly polarized light whose angle of polari-
zation, a, is sequentially rotated by a half-wave plate (WPH05M-488,
Thorlabs, Newton, NJ) mounted on a motorized rotation stage (PR50CC,
Newport, Irvine, CA). After reflection on a dichroic mirror (XF2037-
500DRLP, Omega Optical, Brattleboro, VT), the excitation light is focused
onto the sample by a water-immersion objective lens (C-Apochromat
40� UV-VIS-NIR, NA 1.2, Carl Zeiss, Jena, Germany). Emitted fluores-
cence is collected by the same lens in an epigeometry, passes through
the dichroic mirror, an emission filter (HQ540/80M-2P, Chroma, Bellows
Falls, VT), and a 75-mm-diameter (1.25 Airy unit) confocal pinhole. The

Excitation-Polarization-Resolved Fluorescence 129
fluorescence is detected by a single-photon counting module (SPCM-AQR-
14, Perkin Elmer, Waltham, MA). Measurements are performed at 37�C.The typical excitation power at the entrance of the objective lens is
10 mW. Imaging is performed by scanning the excitation/observation
volume in the sample using a set of two galvanometric mirrors placed
between the dichroic mirror and the objective lens. The transverse size of
the observation volume, characterized previously (32), is ~200 nm.
Polarization distortion effects in both excitation and collection arms have
been characterized at the focal spot of the objective and in the detection
path of the microscope. The polarization state of light was measured at
different places in the optical set-up, both in the excitation and emission
paths, for different incident polarization angles, a, between 0� and 180�.Indeed, several optical elements in the optical path can act as polarizing
elements because of their possible optical anisotropy properties (diattenua-
tion, g, and retardance, d). Using a polarization-state analysis based on the
rotating quarter-wave plate method (33,34), we were able to model the exci-
tation path as a series of effective polarizing elements whose optical axis
orientation is denoted by q. In particular, the reflection on the dichroic
mirror introduces a notable retardance close to p/2 that could be partially
compensated by inserting a quarter-wave plate (WPQ05M-488, Thorlabs)
in the excitation path. The remaining effective polarizing elements were
completely characterized and modeled (with parameters q, g, and d, sum-
marized in Table S1) to be accounted for in the data analysis. We dealt in
the same way with the collection path where weak polarization distortions
could be observed (Table S1). All measured polarization distortions were
introduced in the theoretical model developed for polarization-resolved
analysis (details are given in the Supporting Material). Note that these dis-
tortions are seen to be achromatic over the detection spectral range of the
measurement, as ascertained by constant excitation-polarization-resolved
data obtained in homogeneous samples (solution, giant unilamellar vesicles
(GUVs)) in different detection spectral regions. Measurements consist of
recording a stack of 90 images, obtained by varying the angle ak between
a1 ¼ 0� (with respect to the horizontal axis of the sample) and a90 ¼ 178�
by steps of 2�. Typically, 150 � 150-pixel images were recorded with
100-ms pixel dwell time, yielding to an acquisition duration of ~5 min,
including instrument communication delays.
Theoretical model and data processing
The polarization-resolved steady-state fluorescence intensity is modeled
using a formalism similar to that previously developed for two-photon fluo-
rescence (21), except that here the signal is not analyzed and is therefore
insensitive to depolarization processes at the emission. This model is based
on the expression of the polarization dependence of the excitation photose-
lection of an ensemble of molecules, whose angular extent is defined by a
molecular angular distribution function. The steady-state fluorescence
intensity emitted by an ensemble of dipoles whose orientation is contained
within an angular distribution function, fjðq;4Þ, is written as
Ir;j;hðaÞ ¼Z2p
0
d4
Zp
0
dq sin q��~mðq;4; r; hÞ ,~EðaÞ��2
� fjðq;4ÞJðq;4; r; hÞ;(1)
where the square modulus represents the excitation probability for an
absorption transition dipole, ~m, to be excited by an electric field, ~E, with
a linear state of polarization along an angle a with respect to the x axis
in the sample plane. In this model, a complete expression of~E is introduced,
including all polarization distortions measured in the set-up (see Supporting
Material). ðq;4Þ defines the orientation of~m in the local frame of the mem-
brane (x, y, z) (Fig. S2 A). ðr;hÞ defines the orientation of the distribution
function in the macroscopic laboratory frame (X, Y, Z) (Fig. S2 C). The
function J represents the detection probability of fluorescence and takes
into account the numerical aperture of the objective lens (13). Following
the methodology introduced by Axelrod (13), this function is recalculated
to account for the polarization distortions occurring in the detection path
of the microscope (see Supporting Material; note that we confirmed that
the efficiency of the detector used in this study is not dependent on the
detected polarization).
The normalized function, fjðq;4Þ, describes the dipole orientation distri-bution that is modeled by a full cone of aperture j whose symmetry axis is
oriented at angle r with respect to the x axis, and an out-of-plane angle h.
Depending on the lipid probe structure, the function fjðq;4Þ can take
different forms. In the case of a lipid probe whose dipoles lie along the
membrane lipid molecules (such as di-8-ANEPPQ) (Fig. S2 A), the angular
distribution in the frame of the membrane is written as
fjðq;4Þ ¼
8><>:
1
4p sin2ðj=4Þ if q%j=2
0 otherwise
: (2)
In the case of a lipid probe whose dipoles lie perpendicular to the membrane
lipid molecules (such as DiIC18, 1,1’-dioctadecyl-3,3,30,30-tetramethyl
indocarbocyanine perchlorate) (Fig. S2 B), the angular distribution in the
frame of the membrane is written as
fjðq;4Þ ¼
8<:
1
4p sinðj=2Þ if ðp� jÞ=2%q%ðpþ jÞ=2
0 otherwise
:
(3)
Whatever the shape of the distribution function, one can show that the
dependence on a in Eq. 1 can be written as a finite Fourier series
Ir;j;hðaÞ ¼ I0½1þ Ar;j;h cosð2aÞ þ Br;j;h sinð2aÞ�; (4)
with
Ar;j;h ¼ 2
I0p
Zp
0
da Ir;j;hðaÞcosð2aÞ
Zp
Br;j;h ¼ 2
I0p0
da Ir;j;hðaÞsinð2aÞ; (5)
and I0 ¼ 1=pR p
0da Ir;j;hðaÞ. Moreover, if h is assumed to be zero, any set
ðr;jÞ gives a unique set ðAr;j;Br;jÞ. Conversely, knowing A and B allows
us to retrieve ðr;jÞ unambiguously (as shown in simulations; Fig. S3). The
assumption h ¼ 0� supposes that the information is measured close to the
equatorial plane of the cell membranes in which the fluorophore orientation
lies close to the sample plane. This treatment is valid until the cell curvature
becomes large (n ~ 45�) (see below).In practice, the selection of the relevant pixels to be analyzed is per-
formed on the basis of the total fluorescence image obtained by summing
for each pixel photon counts obtained for all angles ak . First, to ensure
good precision (see discussion below), only pixels with >5000 counts are
considered. Pixels corresponding to the membrane signal are manually
selected by the operator using a polygon selection tool. For each selected
pixel, the photon counts, IexpðakÞ, are added to those of the neighbor pixels,yielding a binning of 3 � 3 pixels. Then, for each pixel, experimental
coefficients Aexp and Bexp are computed using
Aexp ¼ 2
I0N
XNk¼ 1
IexpðakÞcosð2akÞ
Biophysical Journal 105(1) 127–136
130 Kress et al.
2 XN
Bexp ¼I0N k¼ 1
IexpðakÞsinð2akÞ; (6)
where I0 ¼ 1=NPN
k¼1IexpðakÞ. The corresponding ðr;jÞ angles are
retrieved by finding within a set ðAr;j;Br;jÞ (where r and j have been
sampled every degree) the angle closest to ðAexp;BexpÞ, i.e., the one that
minimizes the quantity ðAr;j � AexpÞ2 þ ðBr;j � BexpÞ2. The validity of
the obtained ðr;jÞ angles is assessed by calculating the normalized
chi-square value,
c2 ¼ 1
N
XNk¼ 1
�IexpðakÞ � ItheoryðakÞ
�2s2k
; (7)
where ItheoryðakÞ ¼ I0½1þ Ar;j cosð2akÞ þ Br;j sinð2akÞ� and the variance
s2k is assumed to be equal to the photon counts ItheoryðakÞ, in agreement
with Poisson statistics of low photon counts. Data corresponding to c2>5
are discarded (Fig. S4). Thanks to this procedure, measurements that are
affected by instabilities such as by sample drift, membrane local motion,
photobleaching, etc., and therefore differ from theory by more than what
is expected from photon shot noise, are systematically rejected.
The retrieved j and r data are shown as histograms for single cells, for
~12 cells (~4000 pixels), and by bar graphs with average values indicating
the mean 5 SE over all pixels. Statistical significance was determined and
P values were calculated with an analysis of variance one-way Tukey HSD
test. This representation specifically allows evaluation of heterogeneities
from cell to cell as well as within the whole investigated population.
Note that for all data analysis related to membrane behaviors, a careful
inspection of the total fluorescence image of the cell ensures that statistics
are made on cell membrane parts that are clearly isolated and not part of an
accumulation of membranes of size above the diffraction limit.
Sensitivity to out-of plane orientations
Measurements and simulations have been performed to investigate the
range of validity of the model and results developed below, in the case of
excitation-polarization-resolved fluorescence data recorded at a different
plane of the membrane than the equatorial plane for which h ¼ 0�. Mea-
surements of (r, j) were performed on a COS-7 cell membrane contour
at different heights, Z, above the sample surface (cell adherence plane)
(Fig. S5). As expected, j is overestimated when h increases, since the
cone projection in the sample plane tends toward a more isotropic distribu-
tion function when this cone is tilted out of the sample plane. The bias on j
is nevertheless seen to remain quite low for a few-micrometers range of
variation of Z around the equatorial plane of the cell membrane, showing
that the cell membrane 3D shape is well adapted to a robust measurement
of j. In theory, the bias on j increases with respect to h in a nonlinear way
(Fig. S5), which explains why increasing h leads to a low bias on j for rela-
tively low values of h (<20�). For a case where j¼ 120�, the bias is seen tobe within a 10% range when h reaches 45�. This shows that for experiments
allowing such a bias, data far above the equatorial plane of the membrane
can be measured. In a more constraining situation where only a few degrees
of error are accepted for the measurements of j, out-of-plane tilt angles of
h < 30� are still allowed.
Modeling the cell membrane spatial profile
The change of aperture of the cone distribution of di-8-ANEPPQmolecules
in COS-7 cell membranes upon different cell treatments can be directly
related to a modification of the spatial profile of the cell membrane contour.
To model this effect in a simple way and retrieve an order of magnitude of
the cell membrane shape modification, we assume that the value of j0
measured in cells under hypotonic shock is that of a flat membrane
Biophysical Journal 105(1) 127–136
(j0 ¼ 100�, averaged over 12 cells). We assume that nontreated cells
exhibit a lateral 1D profile of sinusoidal shape with amplitude A:
PðxÞ ¼ A� cosðx � ðn� p=dÞÞ, with d ¼ 100 nm the half lateral size
of the focal spot, n the number of period folds within this spot
lateral size. The whole cone aperture induced by this curvature is
Dj ¼ 2 atanðA� ðn� p=dÞÞ. The measured cone aperture is therefore
j ¼ Djþ j0, where j0 ¼ 100� is the cone aperture value in a flat cell
membrane. Finally, to deduce a cell membrane lateral 1D profile from a
measured j value, we use the function
Pdeducedðx;jÞ¼�tan
�j� j0
2
�� d
n � p
�� cos
�x� n�p
d
�
(8)
The first term in brackets is the amplitude of the membrane profile, which
depends on the number of periods of the sinusoid profile that is assumed
within the focal spot size. Assuming one period of membrane profile sinu-
soid in the focal spot size (n¼ 1), its amplitude is seen to reach a maximum
of 30 nm in the case of j ¼ 150�, which is the higher averaged value
observed in cells treated with jasplakinolide. The minimum measurable
amplitude is of the order of 2 nm, assuming a detection limit of j ¼ 5�.These values are upper limits, since they are decreased in situations where
the profile contains more periods in the focal spot, according to Eq. 8.
RESULTS
We quantify orientational order by the extent of angularfreedom experienced by a molecule, using an angle calledc (Fig. 1, A and B), which defines the rotational hindranceimposed by local molecular interactions in cell membranesor protein assemblies. The average orientation of thisangular distribution is defined by the angles r (in the sampleplane) (Fig. 1, A and B) and h (tilt angle out of the sampleplane) (Fig. S2). Since fluorescence imaging primarilyaddresses processes that occur in the sample plane, weconcentrate on orientational distributions in this planewhere only r is relevant (h ~ 0�). The most general case of3D orientations is discussed below. Whereas the molecularorientational order, j, is intrinsic to the sample and containsbiologically relevant information, the angle r depends on itsglobal orientation and needs to be decoupled from j. Thepurpose of excitation-polarization-resolved fluorescenceimaging is to provide simultaneously information on bothj and r angles in each pixel of a fluorescence image.
Principle of excitation-polarization-resolvedfluorescence microscopy
The principle of the technique relies on the tuning of theexcitation photoselection. Several images of a sample arerecorded for a minimum of three linear, regularly spacedinput polarization directions in the sample plane, rangingbetween 0� (along the horizontal axis of the image) and180� (Fig. S1). The choice of number of input polarizationsis purely governed by the precision chosen for the orienta-tional parameter determination, which indeed depends onthe total number of photons recorded for a given pixel(Fig. S6). In this study, we represent a static picture of the
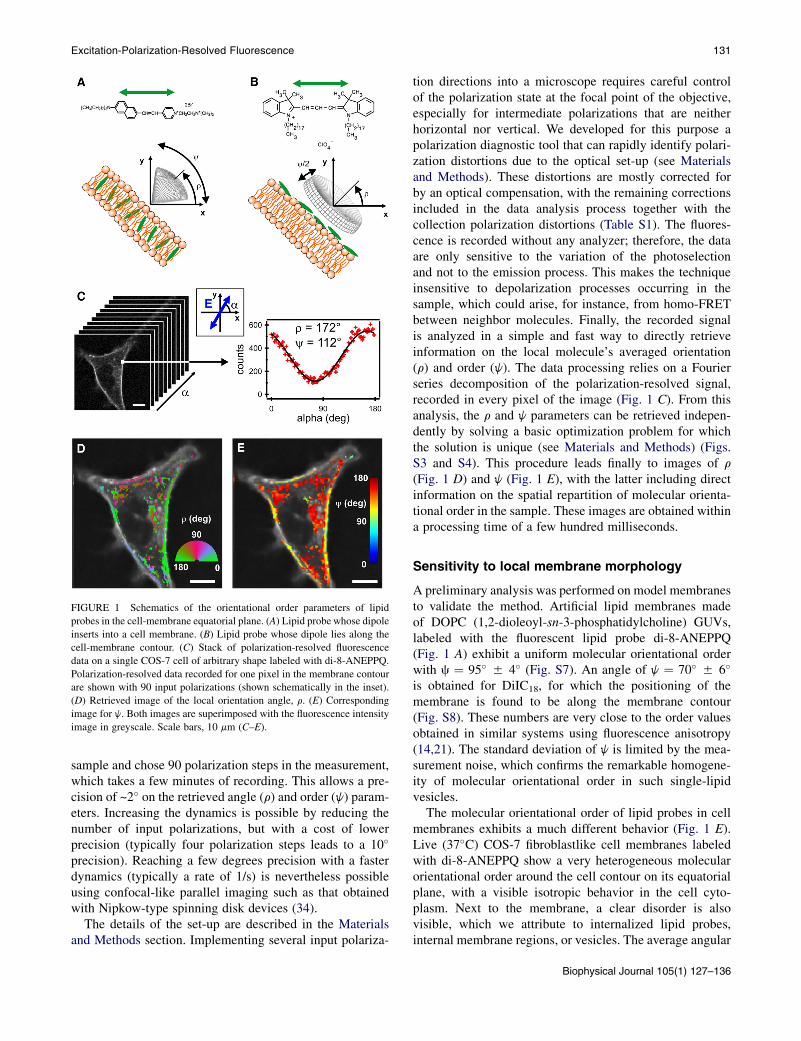
FIGURE 1 Schematics of the orientational order parameters of lipid
probes in the cell-membrane equatorial plane. (A) Lipid probe whose dipole
inserts into a cell membrane. (B) Lipid probe whose dipole lies along the
cell-membrane contour. (C) Stack of polarization-resolved fluorescence
data on a single COS-7 cell of arbitrary shape labeled with di-8-ANEPPQ.
Polarization-resolved data recorded for one pixel in the membrane contour
are shown with 90 input polarizations (shown schematically in the inset).
(D) Retrieved image of the local orientation angle, r. (E) Corresponding
image for j. Both images are superimposed with the fluorescence intensity
image in greyscale. Scale bars, 10 mm (C–E).
Excitation-Polarization-Resolved Fluorescence 131
sample and chose 90 polarization steps in the measurement,which takes a few minutes of recording. This allows a pre-cision of ~2� on the retrieved angle (r) and order (j) param-eters. Increasing the dynamics is possible by reducing thenumber of input polarizations, but with a cost of lowerprecision (typically four polarization steps leads to a 10�
precision). Reaching a few degrees precision with a fasterdynamics (typically a rate of 1/s) is nevertheless possibleusing confocal-like parallel imaging such as that obtainedwith Nipkow-type spinning disk devices (34).
The details of the set-up are described in the Materialsand Methods section. Implementing several input polariza-
tion directions into a microscope requires careful controlof the polarization state at the focal point of the objective,especially for intermediate polarizations that are neitherhorizontal nor vertical. We developed for this purpose apolarization diagnostic tool that can rapidly identify polari-zation distortions due to the optical set-up (see Materialsand Methods). These distortions are mostly corrected forby an optical compensation, with the remaining correctionsincluded in the data analysis process together with thecollection polarization distortions (Table S1). The fluores-cence is recorded without any analyzer; therefore, the dataare only sensitive to the variation of the photoselectionand not to the emission process. This makes the techniqueinsensitive to depolarization processes occurring in thesample, which could arise, for instance, from homo-FRETbetween neighbor molecules. Finally, the recorded signalis analyzed in a simple and fast way to directly retrieveinformation on the local molecule’s averaged orientation(r) and order (j). The data processing relies on a Fourierseries decomposition of the polarization-resolved signal,recorded in every pixel of the image (Fig. 1 C). From thisanalysis, the r and j parameters can be retrieved indepen-dently by solving a basic optimization problem for whichthe solution is unique (see Materials and Methods) (Figs.S3 and S4). This procedure leads finally to images of r
(Fig. 1 D) and j (Fig. 1 E), with the latter including directinformation on the spatial repartition of molecular orienta-tional order in the sample. These images are obtained withina processing time of a few hundred milliseconds.
Sensitivity to local membrane morphology
A preliminary analysis was performed on model membranesto validate the method. Artificial lipid membranes madeof DOPC (1,2-dioleoyl-sn-3-phosphatidylcholine) GUVs,labeled with the fluorescent lipid probe di-8-ANEPPQ(Fig. 1 A) exhibit a uniform molecular orientational orderwith c ¼ 95� 5 4� (Fig. S7). An angle of j ¼ 70� 5 6�
is obtained for DiIC18, for which the positioning of themembrane is found to be along the membrane contour(Fig. S8). These numbers are very close to the order valuesobtained in similar systems using fluorescence anisotropy(14,21). The standard deviation of j is limited by the mea-surement noise, which confirms the remarkable homogene-ity of molecular orientational order in such single-lipidvesicles.
The molecular orientational order of lipid probes in cellmembranes exhibits a much different behavior (Fig. 1 E).Live (37�C) COS-7 fibroblastlike cell membranes labeledwith di-8-ANEPPQ show a very heterogeneous molecularorientational order around the cell contour on its equatorialplane, with a visible isotropic behavior in the cell cyto-plasm. Next to the membrane, a clear disorder is alsovisible, which we attribute to internalized lipid probes,internal membrane regions, or vesicles. The average angular
Biophysical Journal 105(1) 127–136

132 Kress et al.
aperture j around the cell membrane is quite large (j ~120�), which confirms previous observations in two-photonmicroscopy obtained with a less direct analysis (21). The jimage also shows that the distribution of j values is muchlarger than the expected precision of the measurement (afew degrees). Although the disordered parts of the cellmembrane show high j values of ~150� (Fig. 2 A), itsmost ordered parts reach j ~ 100� (Fig. 2 B). This behaviorcan most likely be attributed to the characteristic membranemorphology, which is much more perturbed than in a GUVmembrane, which is tense by nature. The cell membrane,in particular, undergoes strong perturbations due to theinteraction of membrane proteins with the cytoskeletonand with the substrate, but also due to trafficking andits intrinsic molecular heterogeneity. We observed further-more that regions of high molecular disorder are correlatedwith high intensity (Fig. 2, A and B), which is compatiblewith folded parts of the membrane where moleculesaccumulate at a scale below the diffraction limit of themicroscope, or other types of lipid accumulation at theproximity of the plasma membrane, such as in internalmembranes or submicrometer-scale vesicles. Since thistechnique is insensitive to potential homo-FRET betweenmolecules, the retrieved information is relevant even inregions where molecules are highly concentrated, which islikely to occur in wrinkled parts of the cell membrane.The j image can ultimately be used to quantify the mem-brane fold sizes, which might be reached if wrinkles werethe primary origin of molecular disorder. For this purpose,we modeled the membrane profile using a sinusoidal shape
FIGURE 2 Zoomed areas of j images in COS-7 cell labeled with di-8-ANEP
2 mm. The histograms of j are shown together with the correlation plot betwee
angles) and j in the zoomed region. (C) Simulated 1D profile (cell-membrane
sinusoidal shape, for measured cone apertures of j ¼ 150� (left) and j ¼ 120� (is illustrated. The lateral extent of the profile is shown within the focal spot siz
Biophysical Journal 105(1) 127–136
in one dimension (see Materials and Methods). Supposingthat the membrane is locally flat when j is lowest (j ¼100�), we deduce that its amplitude reaches 10 nm forj ¼ 120�, and 30 nm for highly disordered regions(j ~150�) (Fig. 2 C). In this model, one period of sinusoidalprofile is assumed within the 200-nm-diameter length of thefocal volume (see Materials and Methods); therefore, thesevalues have to be considered as higher limits. The order ofmagnitude of the wrinkle amplitude obtained in this studyis consistent with previous estimations of the membraneprofile extent obtained using invasive or indirect methods(2,25–27). Note that this simplified curved-membranemodel includes effects that cannot be discriminated in thismeasurement. First, the membrane shape fluctuations arehighly dynamic; therefore, the retrieved membrane profileis an average over a time much larger than the timescaleof the fluctuations. Second, the measurement reflects thebehavior of molecules distributed within a whole focalvolume of 200-nm lateral size, within which other phenom-ena are likely to occur: internalization, membrane traf-ficking, vesicle formation, etc. Nevertheless, this averagedquantity, similar to those obtained from other techniquesdedicated to membranes (in particular, FCS and GPanalyses) is representative of an overall morphologicalbehavior that can be precisely measured when the cellnature or environment is affected.
To explore the efficiency of this technique in reportingmembrane morphological changes, we investigated howmolecular orientational order responded to different drugsaffecting the actin network of the cells (Fig. 3). Single cells
PQ. (A) Heterogeneous disordered region. (B) Ordered region. Scale bars,
n intensity (total number of photons summed over all incident polarization
relative height) of the lateral dimension of the cell membrane, assuming a
right) (see text). The change of orientation of the cone along the membrane
e of 200 nm.

FIGURE 3 Effect of actin perturbation on molecular order in COS-7 cells
labeled with di-8-ANEPPQ. (A) j maps (superimposed on the fluorescence
intensity image) and corresponding histograms for a typical cell under con-
ditions of (top to bottom) no treatment, and treatment with hypotonic shock,
cytochalasin D, latrunculin A, and jasplakinolide. A schematic representa-
tion of the membrane local morphology is shown. (B) Histograms of the
measured j values for 12 cells from each treatment group (gray represents
the reference histogram with no treatment). (C) Mean 5 SE values for
each treatment. All cases show significant differences (P < 10�5) except
for cytochalasin D and latrunculin A. Scale bars, 10 mm.
FIGURE 4 Effect of cholesterol depletion on molecular order in COS-7
cells labeled with di-8-ANEPPQ using cholesterol oxidase (Chol. ox.)
and combined treatments. (A) j maps superimposed on the fluorescence
intensity image and corresponding histograms for a typical cell for treat-
ment conditions (top to bottom) Chol. ox. at 1 m/mL and 5 m/mL and at
1 m/mL combined with hypotonic shock and latrunculin A. (B) Histograms
of the measured j values of 12 cells for the respective treatment groups in
A (gray, reference histogram with no cholesterol depletion; blue, reference
histogram with hypotonic shock or latrunculin A). (C) Mean 5 SE values
represented for each treatment. All cases show significant differences
(P < 10�5). Scale bars, 10 mm.
Excitation-Polarization-Resolved Fluorescence 133
are illustrated in Fig. 3 A, and distributions of j over 12 cellsare reported in Fig. 3 B. The j distributions of single cellsvisibly resemble those obtained from a population of cells,which shows that heterogeneities are intrinsic to a singlesample. Mechanical disruption of the cytoskeleton by ahypotonic shock leads to an increase of molecular orienta-tional order, an effect that is also observed using cytocha-lasin D, a drug that provokes actin depolymerization.Latrunculin A, an actin polymerization inhibitor, leads toa somewhat similar effect, with additional heterogeneities.jasplakinolide, which stabilizes actin filaments, provokes anew population of high disorder at j ~ 150�, which seemsto be correlated with the visible additional membrane wrin-kles around its contour, but also with invisible featuresoccurring at the subdiffraction scale. Interestingly, DiIC18
undergoes similar molecular orientational order changesunder cytoskeleton perturbations, except in the case ofcytochalasin D, whose cell membrane exhibits unexpected
patches, which we attribute to damage from interactionswith the lipid probe (Fig. S9).
Modification of lipid orientational order uponcholesterol depletion
Lipid orientational behavior is also governed by the mem-brane molecular content, which drives lipid packing (14).To explore the contribution of molecular orientational orderto lipid organization when local polarity changes, weinduced cholesterol depletion in the COS-7 cell membraneusing cholesterol oxidase, which specifically convertscholesterol into cholestenone, and methyl-b-cyclodextrin(MBCD), which removes cholesterol from the membrane.Under low concentrations, both treatments induce a shiftof the whole population toward a slightly higher molecularorientational order (Figs. 4 and S10), which indicates eithera local morphology change or an increased rigidity of thelocal environment surrounding the lipid probes. At higherconcentration, the behavior is reversed and orientational
Biophysical Journal 105(1) 127–136

134 Kress et al.
disorder is clearly appearing, even though the apparentmacroscopic morphology of the cell does not change. Thisindicates that under high depletion conditions (which areknown to induce a strong lipid disorder), lipid probes alsotend to undergo more orientational freedom.
Treatments combining cholesterol depletion with actincytoskeleton perturbation were also performed to measurepossible correlations between lipid packing and the natureof cytoskeleton filaments in close interaction with themembrane. When the treatments are applied in cells whosewrinkles are removed due to a preliminary hypotonic shock,a shift to even higher orientational order is visible, as iflipid packing orientational order could be probed withhigher sensitivity thanks to membrane smoothing (Fig. 4).When cholesterol depletion is performed on a cell deprivedof polymerized cytoskeleton (latrunculin A), the change oforientational order is slightly reversed and highly hetero-geneous, indicating that an intact cytoskeleton filament isrequired to produce a reaction of lipid-packing ordering tocholesterol depletion. Note that these combined treatmentslead to similar results for cholesterol oxidase and methyl-b-cyclodextrin.
DISCUSSION
We implemented an excitation-polarization-resolved fluo-rescence technique that can quantify molecular orientationalorder along the whole contour of a cell membrane, offeringthe possibility of studying orientational behavior of lipidsunder conditions that can lead to heterogeneous populationsof cells.
We show in particular that in unperturbed cells, the orien-tational order value, j, can be used as a direct signatureof the local membrane morphology, able to report mem-brane accumulations (folds, attached internal membranes,or vesicles) of smaller scale than the diffraction limit. Theseaccumulations are seen as regions richer in lipid probes andangularly more disoriented. j is, moreover, a sensitivesignature to slight modifications of the local membranemorphology, given that a change of a few degrees (corre-sponding to the precision of the measurements; seeFig. S6) is the signature of changes of the membrane profileamplitude of ~2 nm (see Materials and Methods). In partic-ular, these wrinkles are globally removed by treatmentsaffecting the actin cytoskeleton and locally enhancedwhen cells are treated with jasplakinolide (Fig. 3), whichis known to induce confined regions with a high contentof disordered polymeric actin (35). In this study, we demon-strate that these regions essentially occur at a subdiffractionscale, and we show a method of quantifying their spatialamplitude in a noninvasive way. This determination is animportant piece of information that could, for instance,allow investigation into the role of topology effects inmeasurement methodologies potentially affected by them,such as FCS.
Biophysical Journal 105(1) 127–136
This mechanical interpretation supposes that there is nostrong influence of a lower-scale lipid packing (driving lipidorientational freedom at the molecular scale) on theretrieved molecular orientational order. We implemented ameasurement of lipid packing using GP, which exploitsthe spectral sensitivity of lipid probes to local polarity andis able to inform on the presence of lipid ordered domainsin the membrane (36). GP measurements were performedon di-8-ANEPPQ in the same set-up, using the same meth-odology as in Owen et al. (36) (see Supporting Material).di-8-ANEPPQ exhibits a molecular structure similar tothat of the well-known styryl-like lipid order probe di-4-ANEPPDHQ (36), and it is expected to reflect lipid orderedphases in its blue side emission (~540 nm), whereas itspresence in lipid disordered phases would enhance its redside emission (~675 nm). In untreated cells, no significantdifference in j values was observable between these twospectral channels, showing that if distinct lipid phaseswere present in the cell, the dye experienced similar orien-tational disorder in these domains. This is most probablydue to the fact that the morphological complexity of thecell membrane prevails over all other possibly weakermolecular-scale disorder effects.
Forcing the membrane lipid packing to undergo strongerchanges, however, revealed the sensitivity of orientationalorder to lipid packing. Measurements were performed underdifferent conditions of cholesterol depletion, which isknown to strongly modify lipid packing properties in cellmembranes. Under relatively low depletion concentration,a slightly higher orientational order appears (Fig. 4), whichcorroborates previous observations of increased membranestiffness (28), decreased lateral mobility of membrane pro-teins (37), and increased degree of lipid packing (30). Forthe cell membranes investigated in this work, a GP increasewas detectable for both cholesterol oxidase and MBCD,clearly correlating with the increase in orientational order(Fig. S11). When cholesterol depletion was brought to amuch higher level, a GP decrease was observed, correlatingwith a decrease in orientational order (Fig. S11). Thisdecrease in lipid packing under a high dose of cholesteroldepletion is also consistent with previous observations incell membranes (29). Overall, these observations show thestrong relationship between lipid packing and orientationalorder when cholesterol content is affected in cells, empha-sizing the connection between local mechanical constraintand polarity.
It has been shown, however, that actin-filament attach-ment sites are strongly interrelated with the presence of lipidordered domains (28,37), recognized as high packing siteswith decreased fluidity (31). The mechanical property ofthe membrane therefore rather depends on both the organi-zation of the submembrane cytoskeleton (and its attachmentto the membrane) and on the physical properties of thelipid membrane itself. This statement is confirmed by ourmeasurement of combined cytoskeleton disruption (using
Excitation-Polarization-Resolved Fluorescence 135
latrunculin A) and cholesterol depletion, which cancels theorder effect and leads to a highly heterogeneous response.This indicates that the absence of polymerized actin in theproximity of the membrane hampers the action of lipidpacking. This is in agreement with previous findings insimilar conditions (38), reporting a faster lipid motion dueto the absence of diffusion barriers (39) and an abrogationof the stiffening effect (28). Actin filaments attached to themembrane thus favor the existence of ordered lipid domains,which is directly visible in lipid packing and orientationalorder properties at the molecular scale. Finally, experimentsperformed on a disrupted cytoskeleton (hypotonic shock) incombination with cholesterol depletion show the oppositebehavior with an increased order. Hypotonic shock probablypreserves the stabilizing function of the cytoskeleton, whichtherefore maintains a strengthening effect on the membrane.Under such conditions, the membrane morphology is alsosmoothened, which probably makes the measured quantitymore sensitive to lipid packing changes.
Overall, this technique appears to be capable of providingunique complementary information on subresolution-scalemorphological features in cell membranes. However, toachieve a finer measurement of orientational freedom atthe molecular scale in lipid domains would necessitatecombining excitation-polarization-resolved fluorescencewith lipid packing measurement in the membrane, and toaccount for the inevitable role of the cytoskeleton.
CONCLUSION
We have developed an excitation-polarization-resolved fluo-rescence microscopy technique based on an epiconfocalconfiguration that is able to circumvent the limitations offluorescence anisotropy and linear dichroism schemes.This scheme allows the quantification of molecular orienta-tional order in cell membranes of arbitrary shapes and showsits relation to local subdiffraction-scale morphology, locallipid environment, and membrane stiffness. These proper-ties can be probed locally in a noninvasive way, which yieldsnew (to our knowledge) perspectives on the architecture ofbiomolecular assembly. This technique can be exploitedin a large variety of biological processes, addressing hetero-geneous behaviors (such as proteins clustering in signaliza-tion sites, local perturbations induced by cell mechanicsunder stress, trafficking, or migration) and giving structuralinsight into biomolecular assemblies (such as insolublefibril formation in cells or tissues).
SUPPORTING MATERIAL
Eleven figures, one table, and supporting results are available at http://www.
biophysj.org/biophysj/supplemental/S0006-3495(13)00630-9.
The authors thank P. Refregier, J. Duboisset (Institut Fresnel, Marseille,
France), as well as D. Marguet, H. T. He (Centre d’Immunologie de Mar-
seille Luminy, Marseille, France), for helpful discussions and advice.
This work was supported by the Centre National de Recherche Scientifique,
Agence Nationale de la Recherche grants ANR 2010 BLAN 150902
(ReceptORIENT), 121402 (NanoDIGICODE), 18818 (RADORDER),
and ANR-10-INBS-04-01 (France-BioImaging Infrastructure network),
Conseil Regional Provence Alpes Cote d’Azur, and the China Scholarship
Council.
REFERENCES
1. Cheresh, D. A., J. Leng, and R. L. Klemke. 1999. Regulation of cellcontraction and membrane ruffling by distinct signals in migratorycells. J. Cell Biol. 146:1107–1116.
2. Anantharam, A., B. Onoa,., D. Axelrod. 2010. Localized topologicalchanges of the plasma membrane upon exocytosis visualized by polar-ized TIRFM. J. Cell Biol. 188:415–428.
3. Fooksman, D. R., G. K. Gronvall, ., M. Edidin. 2006. Clusteringclass I MHC modulates sensitivity of T cell recognition. J. Immunol.176:6673–6680.
4. Weber, G. 1953. Rotational Brownian motion and polarization of thefluorescence of solutions. Adv. Protein Chem. 8:415–459.
5. Dix, J. A., and A. S. Verkman. 1990. Mapping of fluorescence anisot-ropy in living cells by ratio imaging. Application to cytoplasmic vis-cosity. Biophys. J. 57:231–240.
6. Varma, R., and S. Mayor. 1998. GPI-anchored proteins are organized insubmicron domains at the cell surface. Nature. 394:798–801.
7. Vrabioiu, A. M., and T. J. Mitchison. 2006. Structural insights intoyeast septin organization from polarized fluorescence microscopy.Nature. 443:466–469.
8. Borejdo, J., and S. Burlacu. 1993. Measuring orientation of actinfilaments within a cell: orientation of actin in intestinal microvilli.Biophys. J. 65:300–309.
9. Gould, T. J., M. S. Gunewardene, ., S. T. Hess. 2008. Nanoscaleimaging of molecular positions and anisotropies. Nat. Methods. 5:1027–1030.
10. Roberti, M. J., T. M. Jovin, and E. Jares-Erijman. 2011. Confocal fluo-rescence anisotropy and FRAP imaging of a-synuclein amyloid aggre-gates in living cells. PLoS ONE. 6:e23338.
11. Lazar, J., A. Bondar,., S. J. Firestein. 2011. Two-photon polarizationmicroscopy reveals protein structure and function. Nat. Methods.8:684–690.
12. Benninger, R. K. P., B. Vanherberghen, ., B. Onfelt. 2009. Live celllinear dichroism imaging reveals extensive membrane ruffling withinthe docking structure of natural killer cell immune synapses.Biophys. J. 96:L13–L15.
13. Axelrod, D. 1979. Carbocyanine dye orientation in red cell membranestudied by microscopic fluorescence polarization. Biophys. J. 26:557–573.
14. Florine-Casteel, K. 1990. Phospholipid order in gel- and fluid-phasecell-size liposomes measured by digitized video fluorescence polariza-tion microscopy. Biophys. J. 57:1199–1215.
15. Rocheleau, J. V., M. Edidin, and D. W. Piston. 2003. IntrasequenceGFP in class I MHC molecules, a rigid probe for fluorescence anisot-ropy measurements of the membrane environment. Biophys. J.84:4078–4086.
16. Benninger, R. K. P., B. Onfelt,., P. M. W. French. 2005. Fluorescenceimaging of two-photon linear dichroism: cholesterol depletion disruptsmolecular orientation in cell membranes. Biophys. J. 88:609–622.
17. Kress, A., P. Ferrand, ., S. Brasselet. 2011. Probing orientationalbehavior of MHC class I protein and lipid probes in cell membranesby fluorescence polarization-resolved imaging. Biophys. J. 101:468–476.
18. Pentcheva, T., and M. Edidin. 2001. Clustering of peptide-loadedMHC class I molecules for endoplasmic reticulum export imaged byfluorescence resonance energy transfer. J. Immunol. 166:6625–6632.
Biophysical Journal 105(1) 127–136
136 Kress et al.
19. Chan, F. T. S., C. F. Kaminski, and G. S. Kaminski Schierle. 2011.HomoFRET fluorescence anisotropy imaging as a tool to study molec-ular self-assembly in live cells. ChemPhysChem. 12:500–509.
20. Vishwasrao, H. D., P. Trifilieff, and E. R. Kandel. 2012. In vivo imagingof the actin polymerization state with two-photon fluorescence anisot-ropy. Biophys. J. 102:1204–1214.
21. Gasecka, A., T. J. Han, ., S. Brasselet. 2009. Quantitative imaging ofmolecular order in lipid membranes using two-photon fluorescencepolarimetry. Biophys. J. 97:2854–2862.
22. DeMay, B. S., N. Noda, ., R. Oldenbourg. 2011. Rapid and quantita-tive imaging of excitation polarized fluorescence reveals ordered septindynamics in live yeast. Biophys. J. 101:985–994.
23. DeMay, B. S., X. Bai, ., A. S. Gladfelter. 2011. Septin filamentsexhibit a dynamic, paired organization that is conserved from yeastto mammals. J. Cell Biol. 193:1065–1081.
24. Lesoine, J. F., J. Y. Lee, ., J. Hwang. 2012. Quantitative scheme forfull-field polarization rotating fluorescence microscopy using a liquidcrystal variable retarder. Rev. Sci. Instrum. 85:053705.
25. Sund, S. E., J. A. Swanson, and D. Axelrod. 1999. Cell membraneorientation visualized by polarized total internal reflection fluores-cence. Biophys. J. 77:2266–2283.
26. van Rheenen, J., and K. Jalink. 2002. Agonist-induced PIP2 hydrolysisinhibits cortical actin dynamics: regulation at a global but not at amicrometer scale. Mol. Biol. Cell. 13:3257–3267.
27. Adler, J., A. I. Shevchuk, ., I. Parmryd. 2010. Plasma membranetopography and interpretation of single-particle tracks. Nat. Methods.7:170–171.
28. Byfield, F. J., H. Aranda-Espinoza, ., I. Levitan. 2004. Cholesteroldepletion increases membrane stiffness of aortic endothelial cells.Biophys. J. 87:3336–3343.
Biophysical Journal 105(1) 127–136
29. Gaus, K., E. Gratton, ., W. Jessup. 2003. Visualizing lipid structureand raft domains in living cells with two-photon microscopy. Proc.Natl. Acad. Sci. USA. 100:15554–15559.
30. Mahammad, S. S., J. J. Dinic,., I. Parmryd. 2010. Limited cholesteroldepletion causes aggregation of plasma membrane lipid rafts inducingT cell activation. Biochim. Biophys. Acta. 1801:625–634.
31. Dinic, J., P. Ashrafzadeh, and I. Parmryd. 2013. Actin filaments attach-ment at the plasma membrane in live cells cause the formation ofordered lipid domains. Biochim. Biophys. Acta. 1828:1102–1111.
32. Ferrand, P., M. Pianta, ., D. Marguet. 2009. A versatile dual spotlaser scanning confocal microscopy system for advanced fluorescencecorrelation spectroscopy analysis in living cell. Rev. Sci. Instrum.80:083702.
33. Collett, E. 1993. Polarized Light: Fundamentals and Applications.CRC Press, Boca Raton, FL.
34. Wang, X., A. Kress, ., P. Ferrand. 2013. High frame-rate confocalpolarization resolved fluorescence microscopy. Rev. Sci. Instrum.84:053708.
35. Bubb, M. R., I. Spector, ., K. M. Fosen. 2000. Effects of jasplakino-lide on the kinetics of actin polymerization. An explanation for certainin vivo observations. J. Biol. Chem. 275:5163–5170.
36. Owen, D. M., C. Rentero, ., K. Gaus. 2012. Quantitative imaging ofmembrane lipid order in cells and organisms. Nat. Protoc. 7:24–35.
37. Kwik, J., S. Boyle,., M. Edidin. 2003. Membrane cholesterol, lateralmobility, and the phosphatidylinositol 4,5-bisphosphate-dependent or-ganization of cell actin. Proc. Natl. Acad. Sci. USA. 100:13964–13969.
38. Sun, M., N. Northup, ., G. Forgacs. 2007. The effect of cellularcholesterol on membrane-cytoskeleton adhesion. J. Cell Sci. 120:2223–2231.
39. Lenne, P.-F., L. Wawrezinieck,., D. Marguet. 2006. Dynamic molec-ular confinement in the plasma membrane by microdomains and thecytoskeleton meshwork. EMBO J. 25:3245–3256.

Mapping the Local Organization of Cell Membranes Using Excitation-Polarization-Resolved Confocal Fluorescence Microscopy
Alla Kress, Xiao Wang, Hubert Ranchon, Julien Savatier, Hervé Rigneault, Patrick Ferrand, and Sophie Brasselet*
Institut Fresnel, Centre National de Recherche Scientifique UMR 7249, Aix-Marseille Université, Ecole Centrale, Marseille, Domaine Universitaire St. Jérôme, Marseille, France
Kress et al.
Excitation-Polarization-Resolved Fluorescence
Submitted October 31, 2012, and accepted for publication May 21, 2013.
*Correspondence: [email protected]
Editor: Lukas Tamm.
Supporting Material
Mapping the local organization of cell membranes
using excitation polarization resolved fluorescence microscopy
Alla Kress et al.
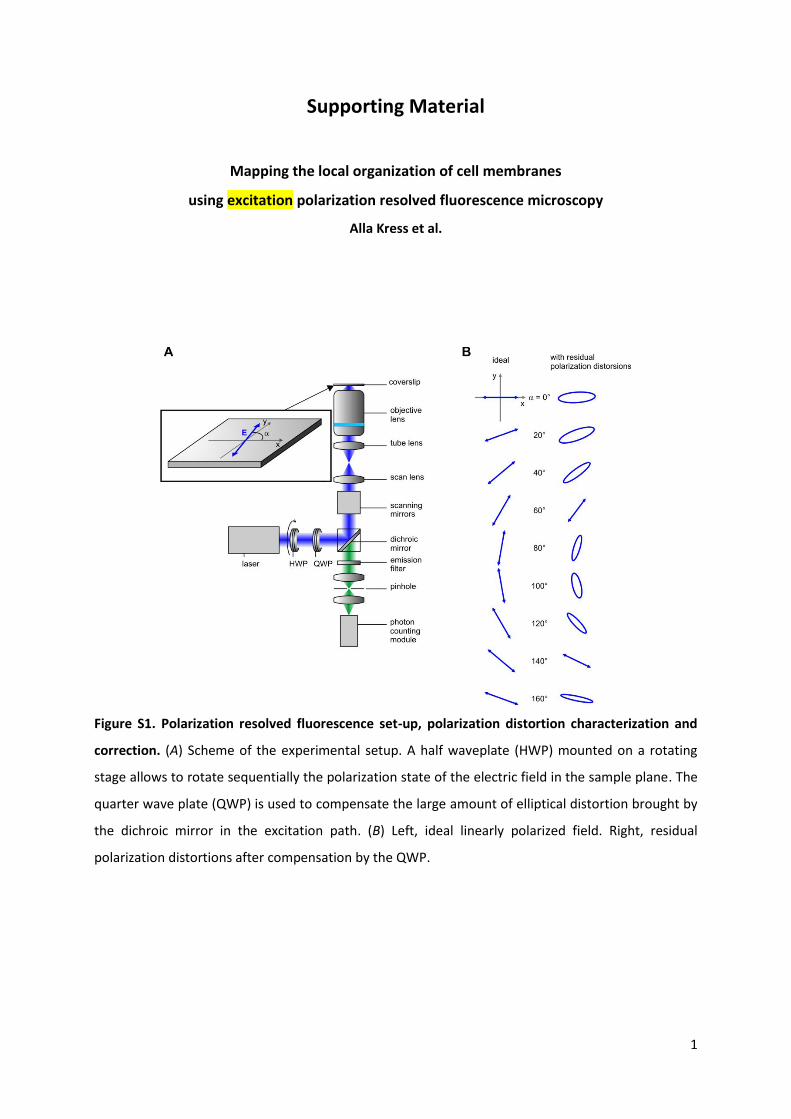
Figure S1. Polarization resolved fluorescence set-up, polarization distortion characterization and
correction. (A) Scheme of the experimental setup. A half waveplate (HWP) mounted on a rotating
stage allows to rotate sequentially the polarization state of the electric field in the sample plane. The
quarter wave plate (QWP) is used to compensate the large amount of elliptical distortion brought by
the dichroic mirror in the excitation path. (B) Left, ideal linearly polarized field. Right, residual
polarization distortions after compensation by the QWP.
1

2
A B
x
y
z
xy
z
C
XY
x
y
Figure S2. Definition of the orientation distribution function and angles used in the model. (A) di-8-
ANEPPQ lipid probe orientation in the membrane leaflets (the green arrow represents the direction
of its absorption transition dipole moment with respect to the molecule), orientation ( ) of the
molecules in the cone microscopic frame (x,y,z). (B) DiIC18 orientation along the membrane contour.
(C) 3D orientation ( ) of the distribution function in the (X,Y,Z) macroscopic frame. (X,Y) defines the
sample plane in which the incident polarization lies, Z is the propagation direction.

3
Figure S3. Reference maps for data processing. Simulated colormaps illustrating the unambiguous
relationship between the coefficients (A, B) (coordinates) and the values (color scale, angles
are in degrees). (A) for the di-8-ANEPPQ lipid probe; (B) for the DiIC18 lipid probe. Top: ideal optical
system with no polarization distortions; bottom: with the polarization distortions of the system used
in this work. This graphic representation shows that for any couple of values (A,B), there is a unique
solution ( ) (a direct read-out on the graphs leads to a unique color-value for and a unique
color-value for ). This solution can be found by minimizing differences between experimental (A,B)
values and computed (A,B) values which are directly related to an expected ( ) set of data.

4
0 20 40 60 80 100 120 140 160 180200
400
600
800
1000
1200
1400
(deg)
Inte
nsity (
counts
)
Rho = 7, Psi = 142
Exp
Fit
0 20 40 60 80 100 120 140 160 180-200
-100
0
100
200
(deg)
Inte
nsity (
counts
)
Rho = 7, Psi = 142, Chi2 = 3.0649
Iexp
- Itheory
0 20 40 60 80 100 120 140 160 1800
500
1000
1500
2000
(deg)
Inte
nsity (
counts
)
Rho = 17, Psi = 126
Exp
Fit
0 20 40 60 80 100 120 140 160 180-300
-200
-100
0
100
200
300
(deg)
Inte
nsity (
counts
)
Rho = 17, Psi = 126, Chi2 = 19.3167
Iexp
- Itheory
Figure S4. Illustration of the data filtering procedure. Raw data are plotted with blue circles. The
fitting theoretical curve is displayed in black. Below: corresponding plot of the residuals Iexp - Itheory.
The range ± the standard deviations is represented by red curves. Left: in this case, = 3.1 is below
the rejection threshold. The retrieved values are = 142° ± 1°, = 7° ± 1°. Right: in this case, the
measurement is affected by intensity fluctuations. The fit leads to = 9, which is above the
rejection threshold. This dataset is discarded. Note that both cases (left and right) pass the “number
of photon” test, since their total intensity is above the 5000 photons threshold. The difference
between the two data is in their fit quality ( value), introduced to remove the data containing
artifacts that would lead to a biased psi (fluctuations of the membrane, motion of the sample,
defocusing, bleaching…).

5
B C DA
E
Fig. S5. Polarization resolved fluorescence measurements and simulations, out of the membrane
equatorial plane. (A) definition of the out-of plane angle in a cell membrane. (B) Fluorescence
images of a COS-7 cell at different Z values above the sample adherence plane. (C) Average value
on the cell membrane contour, measured for each plane represented in (A). (D) Corresponding
images. (E) Simulation of biased values from the modeled situation: = 120°, = 20°, for an
increasing from 0° to 90°. The data where generated using 5000 total number of photons. The
error bars represent the standard deviation obtained from a set of 1000 simulated experiments
generated with Poisson noise. values are seen to vary only slightly for < 45°. The main reason for
this is that the molecular-optical field coupling occurs in the sample plane; therefore the intensity of
the fluorescence light becomes negligible if the molecules are out of plane, which makes the
technique highly selective for in-plane processes. The information retrieved is consequently robust to
out-of-plane orientations until tilt angles up to 45°.

6
0 20 40 60 80 100 120 140 160 1800
20
40
60
80
100
120
140
160
180
155 160 1650
100
200
300
= 1.5451
Retrieved
Nb o
f occure
nce
120 130 1400
50
100
150
200
= 2.3129
Retrieved
Nb o
f occure
nce
Fig. S6. Precision analysis. The precision of this method for measuring and has been assessed by
means of Monte Carlo simulations. For a given set ( ), the theoretical dependence on given by
Eq. 1 has been simulated for a total intensity counts. Using a Poisson random number
generator, 1000 different artificial datasets have been generated, and processed by the method
described above, allowing to measure the average values and standard deviations of the retrieved
and values. These simulations have been performed for several starting sets ( ), and are
summarized in this figure. Black crosses indicate the starting values . The result is summarized
by a rectangle whose center is located at the average of the retrieved values . The full width
(and height) of the rectangle corresponds to twice the standard deviation on (on , respectively).
They show that in the range of that is covered by this work, namely between 60° and 180°, the
precision on is better than 3° for this threshold intensity of 5000 counts. Moreover, this precision
is getting better for higher intensities, since we have checked that it varies as . Histograms
illustrate the retrieved values for the case = 160°, = 130°, with the corresponding standard
deviations.

7
Fig. S7. Validation of the method in a homogeneous sample: Giant Unilamellar Vesicles. DOPC (1,2-
dioleoyl-sn-3-phosphatidylcholine) Giant Unilamellar Vesicles (GUVs) were labeled with di-8-
ANEPPQ. The GUVs were prepared by electroformation with a molecular ratio of lipid probes to
DOPC lipids of 1:1000. Such sample should lead to a homogeneous distribution of molecular order
( ) around a perfectly spherical membrane. (A) -image superimposed with the fluorescence
intensity image. (B) -image. For all the GUVs measured (about 10), is constant along the whole
membrane contour with a value ~ 95°, with a standard deviation of 4° which is close to the value
expected from a shot noise limited measurement. (C) image of the error factor 2, showing possibly
discarded pixels for which 2 >5. (D) Resulting histogram of .
8
Psi (deg)
20
40
60
80
100
120
140
160
180
Rho (deg)
20
40
60
80
100
120
140
160
180
A B(deg) (deg)
CD
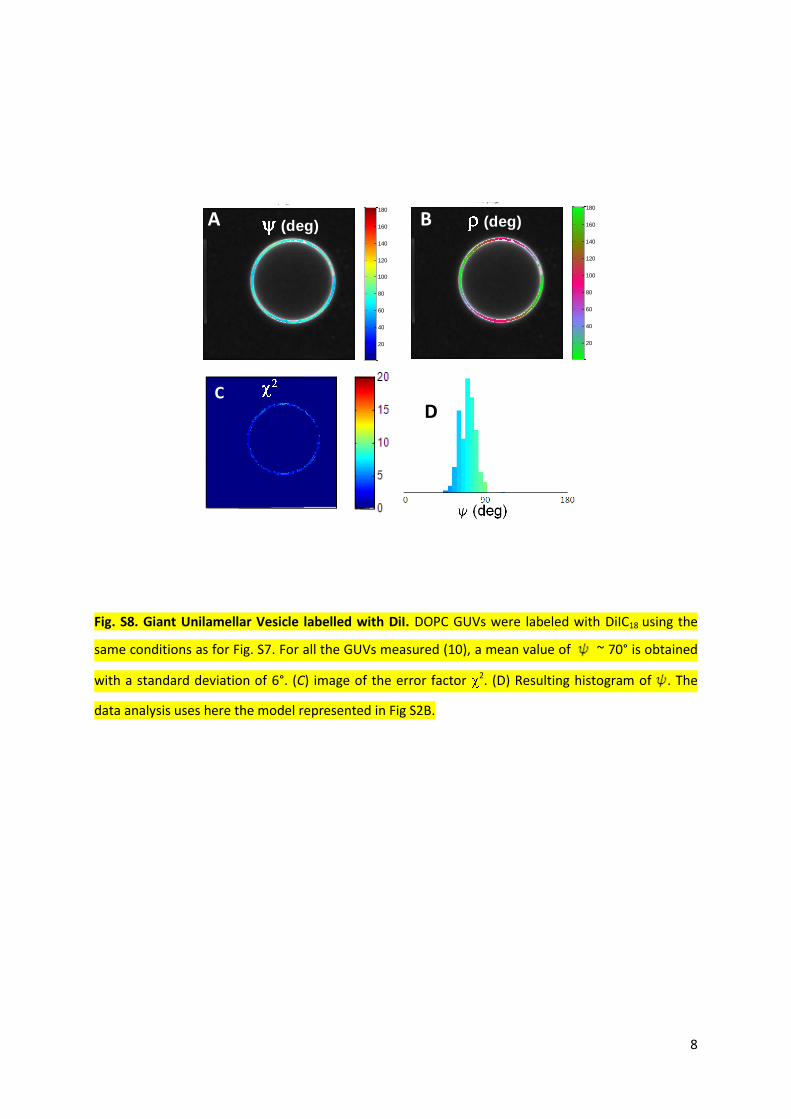
Fig. S8. Giant Unilamellar Vesicle labelled with DiI. DOPC GUVs were labeled with DiIC18 using the
same conditions as for Fig. S7. For all the GUVs measured (10), a mean value of ~ 70° is obtained
with a standard deviation of 6°. (C) image of the error factor 2. (D) Resulting histogram of . The
data analysis uses here the model represented in Fig S2B.

9
Fig. S9. Molecular order effect of actin perturbation in COS-7 cells labelled with DiIC18. (A) maps
(superimposed to the fluorescence intensity image) and corresponding histograms for a typical cell,
from top to bottom: no treatment, Hypotonic shock, Cytochalasin D, Latrunculin A, Japlakinolide. (B)
Histograms of the measured values on 12 cells for each treatment (in grey: reference histogram
with no treatment). (C) Average and SEM values represented for each treatment. All cases show
significant differences (P < 10-5). Scale bars: 10 m. The intensity fluorescence image in the case of
Cytochalasin D shows visible patches along the membrane contour that can explain the higher
disorder obtained in this case, a priori not expected.

10
Fig. S10. Molecular order effect of cholesterol depletion in COS-7 cells labelled with di-8-ANEPPQ
using methyl-β-cyclodextrin (MBCD) and combined treatments. (A) maps (superimposed to the
fluorescence intensity image) and corresponding histograms for a typical cell, from top to bottom:
MBCD at 2.5 M, 100 M, and 2.5 M combined with hypotonic shock and latrunculin A (Lat A). (B)
Histograms of the measured values on 12 cells for each treatment (in grey: reference histogram
with no cholesterol depletion, in blue: reference histogram (with hypotonic shock or Latrunculin A).
(C) Average and SEM values represented for each treatment. All cases show significant differences (P
< 10-5) except for Lat A. Scale bars: 10 m.

11
Generalized Polarization (GP) results on di-8-ANEPPQ.
di-8-ANEPPQ is a styryl dye structurally and spectrally very similar to di-4-ANEPPDHQ (36), a lipid
probe which undergoes strong spectral sensitivity to local polarity in the membrane. Such sensitivity
was probed for di-8-ANEPPQ using a two-color simultaneous detection at 540nm and 675nm,
similarly as for di-4-ANEPPDHQ (28aa). A simultaneous two-color detection imaging in conjunction
with excitation polarization tuning was implemented using a dichroic mirror (BS605, Semrock) used
for separation of the two wavelengths channels, one centered at 540nm and the other centered at
675nm (H675/100, Semrock), directed towards two avalanche photodiodes. The detection dichroic
was seen to not induce any additional dichroism effect, the GP factor being homogeneous in DOPC
GUVs and solutions. The generalized polarization factor (GP) is defined by a ratiometric comparison
of the two color detected channels:
The GP factor is measured only in pixels of the cells that have passed the selection for the
orientational order determination (see Fig. S4). For these pixels, an averaged GP is deduced from
the accumulation of GP values over 10 cells (about 4000 pixels). The GP of all cells are compared to
the one from untreated cells, set at value 0 for easier visualization (Fig. S10). Note that at the scale of
an isolated cell, no strong correlation between GP and at the pixel level is visible, which prevents
any conclusion of clear interpretation of as a lipid packing probe. This is most probably due to
morphology effects which bring additional sources or disorder, but also to the relatively low
efficiency of di-4-ANEPPDHQ as a lipid order probe (the shifts observed in GP upon cholesterol
depletion are indeed not high as compared to values given for di-4-ANEPPDHQ in the literature (36).

12
Fig. S11. Generalized Polarization (GP) results on di-8-ANEPPQ in cholesterol depleted cells.
Combined measurements of averaged and GP for pixel populations taken over 10 cells. The psi
values are similar for both color channels. GP values are shown relative to untreated cells for which
GP = 0. Data are shown for chol. ox treatments (white markers) at low (1 u/mL, low value) and high
concentration (5 u/mL, high value), and for MBCD treatments (black markers) at low (2.5 M, low
value) and high concentration (100 M, high value). The value obtained for untreated cells is
shown for comparison (grey marker). Bars are SEM values over about 3000 pixels. The overall trend is
a clear correlation between increasing GP values and decreasing values.

Polarization distortions
Optical path Element No Orientation (°) Diattenuation Retardance (°)
Excitation 1 -16 0.28 22
2 39 0.24 -20.5
Collection 3 79 0.20 140
4 80 0 12
5 127 0.2 12
Table S1. Summary of the characteristics of polarization distortions in the optical setup. The
polarization distortions are modelled by introducing virtual distorting optical elements characterized
by their orientation, diattenuation and retardance. The angle is the orientation of the fast axis of
one optical element with respect to the horizontal axis X. The diattenuation is the amplitude
factor of the field along its slow axis. The retardance is the phase shift of the field introduced along
its slow axis. All these elements are obtained by fitting the characteristic curves obtained by applying
the quarter wave plate technique in the optical path of the set-up, for different angles of the
incident linear polarization. For the excitation path, two elements were necessary to reproduce the
measured distortions. For the detection path, three elements were necessary.
Accounting for polarization distortions in the model
The steady state fluorescence intensity emitted by an ensemble of dipoles which orientation is
contained within an angular distribution function is written as:
Two types of polarization distortions should be accounted for in this equation:
Excitation path distortions
To account for the distortions undergone by the excitation field , we replace the non distorted field
(expressed here in the laboratory frame)
13

Where is the field amplitude, by:
Where M is the matrix product , which accounts for the
distorsion parameters summarized in Table S1 for the equivalent optical elements i=1,2
acting as polarization distorsion sources (phase plates) in the excitation path, with:
Detection path distortions
In the detection path, the function is the quantity affected by polarization distortions
since it contains the information on how the radiation of emission dipoles is modified by optical
elements acting as phase plates. Following the same methodology and notations introduced in (13),
this function is re-calculated to account for the polarization distortions occurring in the detection
path of the microscope. After calculating how emission dipoles’ radiation fields are affected by the
equivalent phase plates summarized in Table S1, it is found that
is the sum of two polarized analysis X (horizontal) and Y
(vertical) fluorescence emission components, which can be expressed as follows:
where ( ) are polarization coupling factors which depend on the numerical aperture of the
objective as defined in (13), and an additional parameter representative of an
additional emission polarization cross talk due to collection path distortions:
14
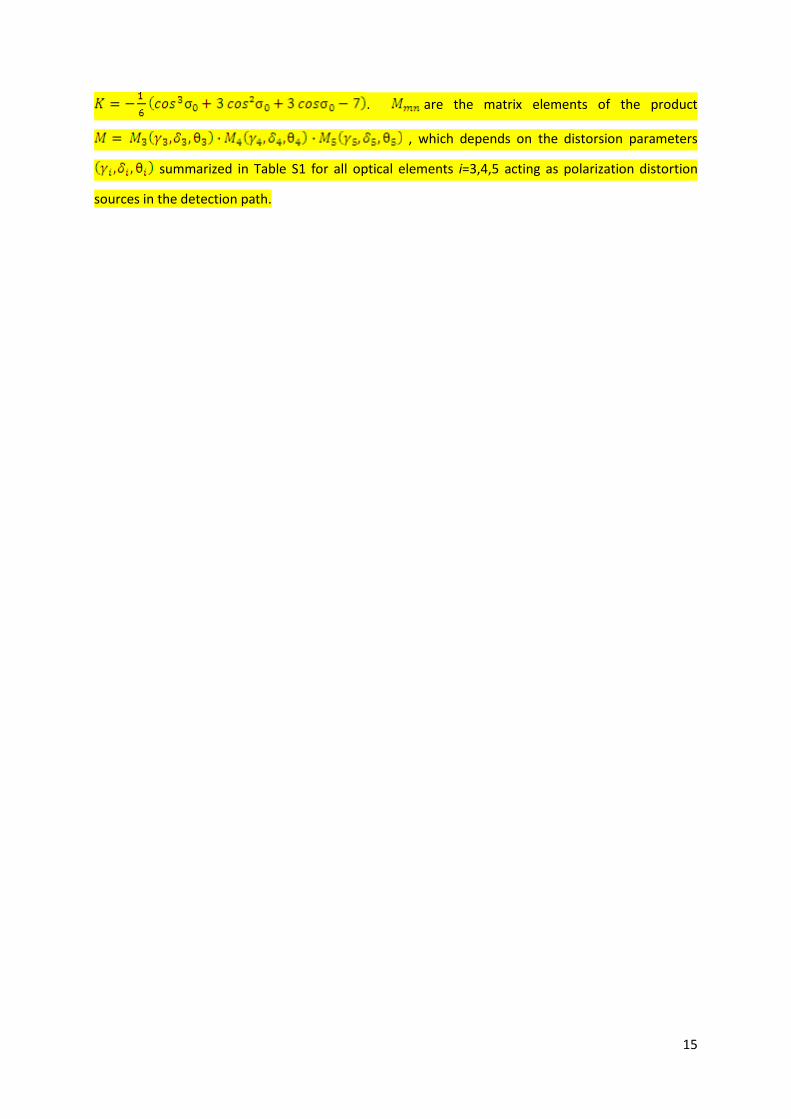
. are the matrix elements of the product
, which depends on the distorsion parameters
summarized in Table S1 for all optical elements i=3,4,5 acting as polarization distortion
sources in the detection path.
15