mapping population over time: new ways of exploiting open data · mapping population over time: new...
TRANSCRIPT

Mapping population over time: new ways of exploiting Open Data
Open Data Masterclass, Ordnance Survey, 28 September 2011
David Martin, University of Southampton

2

3
Presentation overview
• Mapping population over time
– Intercensal change
– Spatiotemporal modelling
• Exploiting Open Data
• Census 2011: prospects
• Modelling and mapping population 24/7
Acknowledgements: Samantha Cockings, Samuel Leung, ESRC Award RES-062-23-1811, ONS

Mapping population over time
• Inherent importance of population redistribution
• Updating resource allocation formulae: large areas > small areas
• Targeting services/marketing, site location decisions/ transportation demand/ denominator populations appropriate to date-stamped events
• BUT limitations of changing geographical boundaries, limited access to multiple reference geographies and absence of data on high temporal resolutions
4
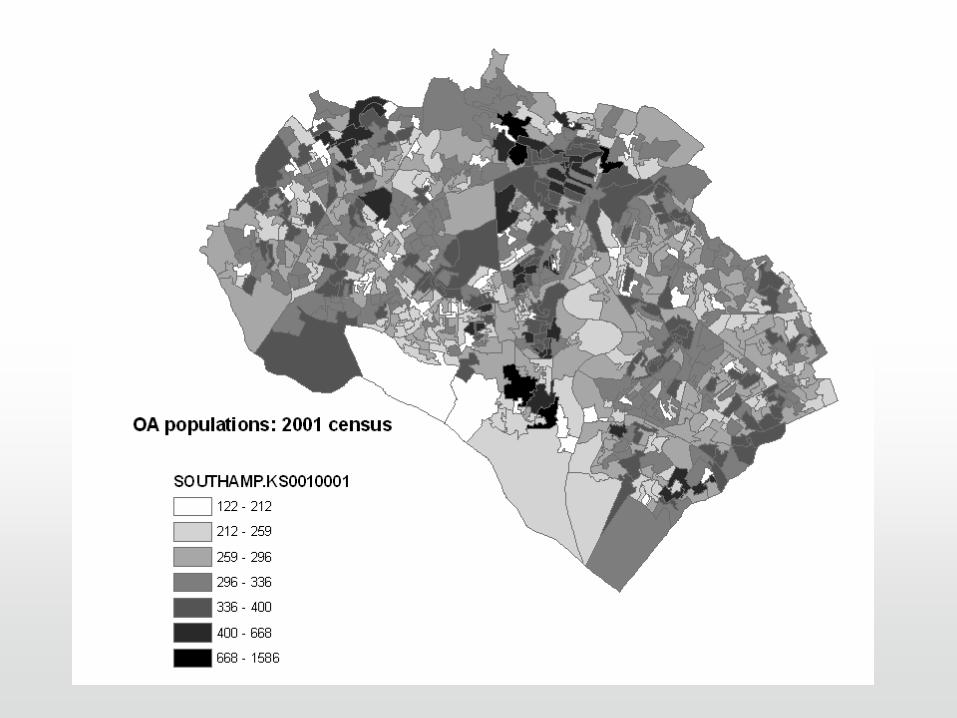

Conventional (census) population map
• Irregular zonal boundaries (census output areas)
– Which are themselves strongly related to residential geography through address locations
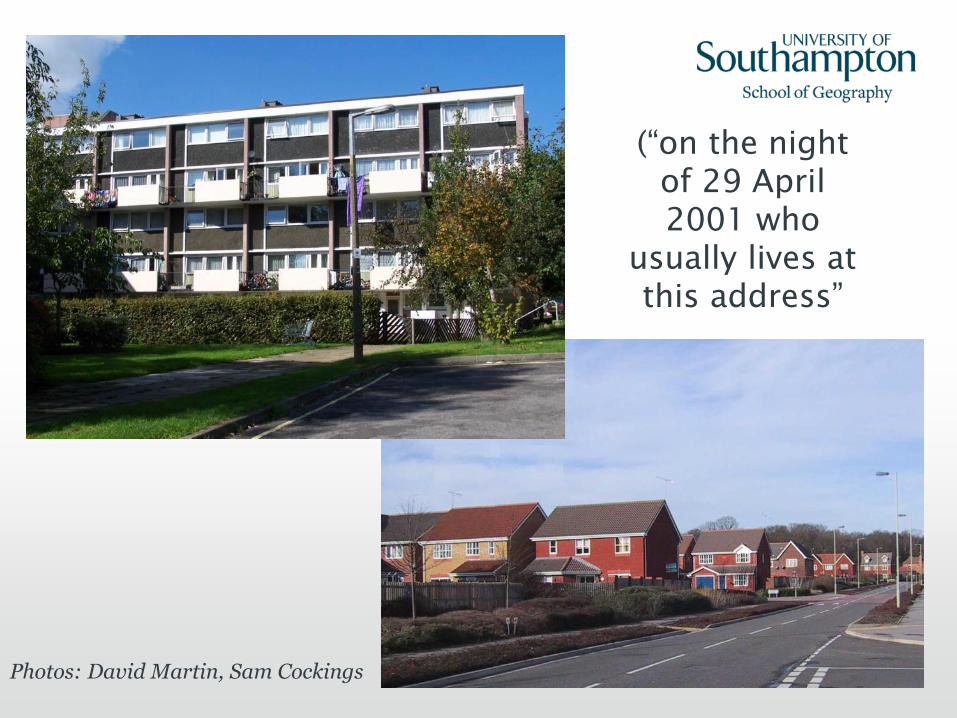
• Fixed reference date and time (“on the night of 29 April 2001 who usually lives at this address”)
• Locations are residential addresses and main workplaces of those in employment (or education in Scotland)
• Annual mid-year estimates, but larger areas and only residential locations
6
7 Photos: David Martin, Sam Cockings
(“on the night
of 29 April
2001 who
usually lives at
this address”
8
Ho
me R
esid
ence
Offic
e W
ork
Outd
oors
Work
All E
mp
loym
ent
Oth
er W
ork
Ed
ucation b
y S
tage
All E
ducation
Oth
ers
Ro
ad
s
Tra
nsport
Hubs
0%
20%
40%
60%
80%
100%
00:00
02:00
04:00
06:00
08:00
10:00
12:00
14:00
16:00
18:00
20:0022:0000:00
Po
pu
lati
on
D
istr
ibu
tio
n
(%)
Time(Hour)
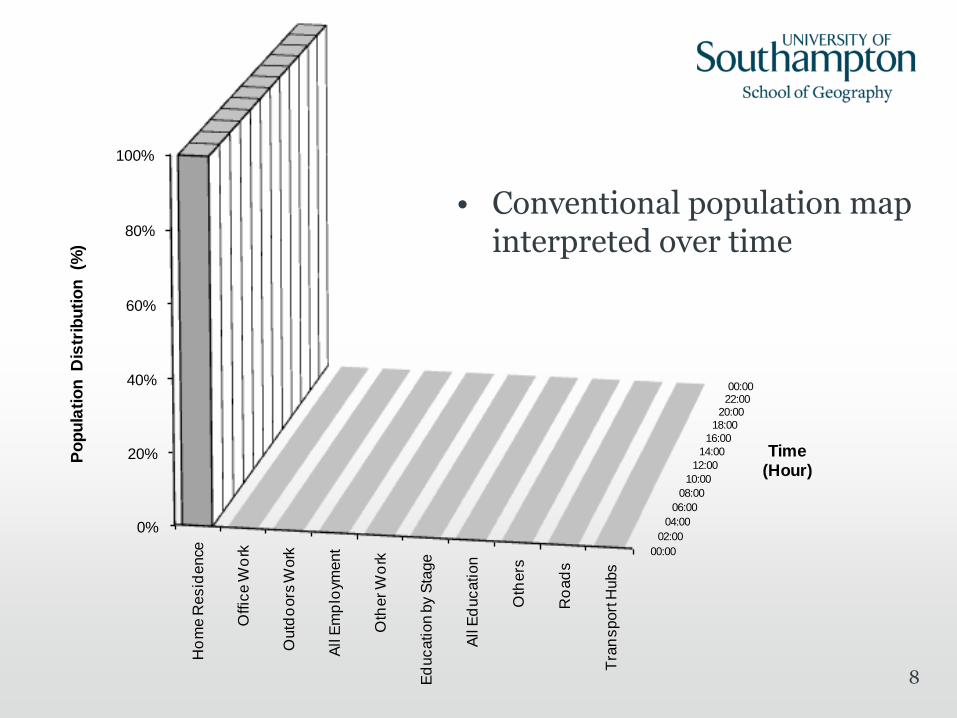
• Conventional population map interpreted over time

9 Photos: David Martin
Does not capture
new residential
development,
second homes...
10 Photos: David Martin
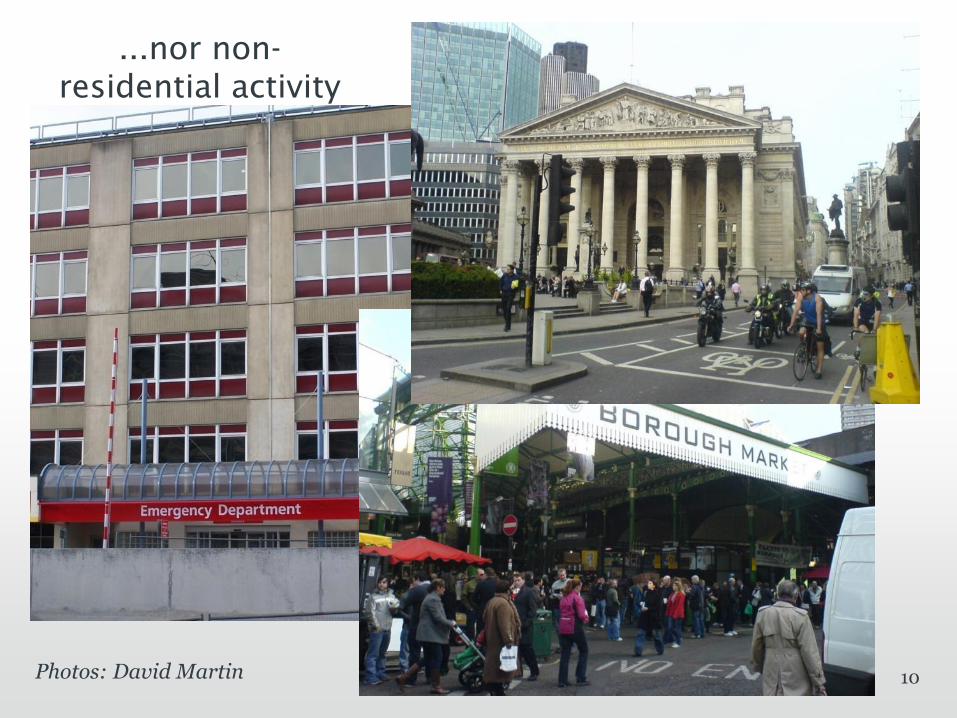
...nor non-
residential activity

11
Photos:
David Martin

12
00:00
02:00
04:0006:00
08:0010:00
12:0014:00
16:0018:00
20:0022:0000:00
Hom
e R
esid
ence
Offic
e W
ork
Outd
oors
Work
Reta
il W
ork
Oth
er
Work
School E
ducatio
n
Hig
her
Educatio
n
Oth
ers
Roads
Tra
nsport
Hubs
0%
20%
40%
60%
80%
100%
Po
pu
lati
on
Dis
trib
uti
on
(%
) .
Time
(Hour)
• Integrated multi-source datasets interpreted over time

Exploiting Open Data

14
http://cwswg.wikidot.com/
http://w
ww
.neighbourhood.statistics.gov.
uk/
http://data.gov.uk/

Acronyms: QLFS Quarterly Labour Force; DCSF Department for Children, Schools and Families; HESA Higher Education Statistics Agency;
Survey; DCMS Department for Culture, Media and Sport; ALVA Association for Leading Visitor Attractions; DfT Department for
Transport; TfL Transport for London; CAA Civil Aviation Authority
Total
population
+/-
external
visitors
Private dwellings
Non-
residential
Communal ests.
Transport
Employment
Education
Residential
Temp accomm.
Generalised local
Family/social
Retail
Leisure
Tourism
Healthcare
Rail
Metro/subway
Air
Water
Road
Locations Data Sources
- Census, Mid-Year Population Estimates (MYEs)
- Census, Mid-Year Population Estimates (MYEs)
- Census, Annual Business Inquiry, QLFS
- School pupil numbers, locations, HE statistics
- Prison pops, VisitBritain, Annual Business Inquiry
- VisitBritain
- Annual Business Inquiry, commercial sources
- ALVA Visitor Statistics, DCMS
- ALVA Visitor Statistics, DCMS
- Hospital Episode Statistics
- National Rail station usage data
- DfT Light Rail Statistics, TfL Tube customer metrics
- CAA UK Airport Statistics
- DfT Sea Passenger Statistics, London River Services
- Traffic count by road/area/vehicle, road map
-
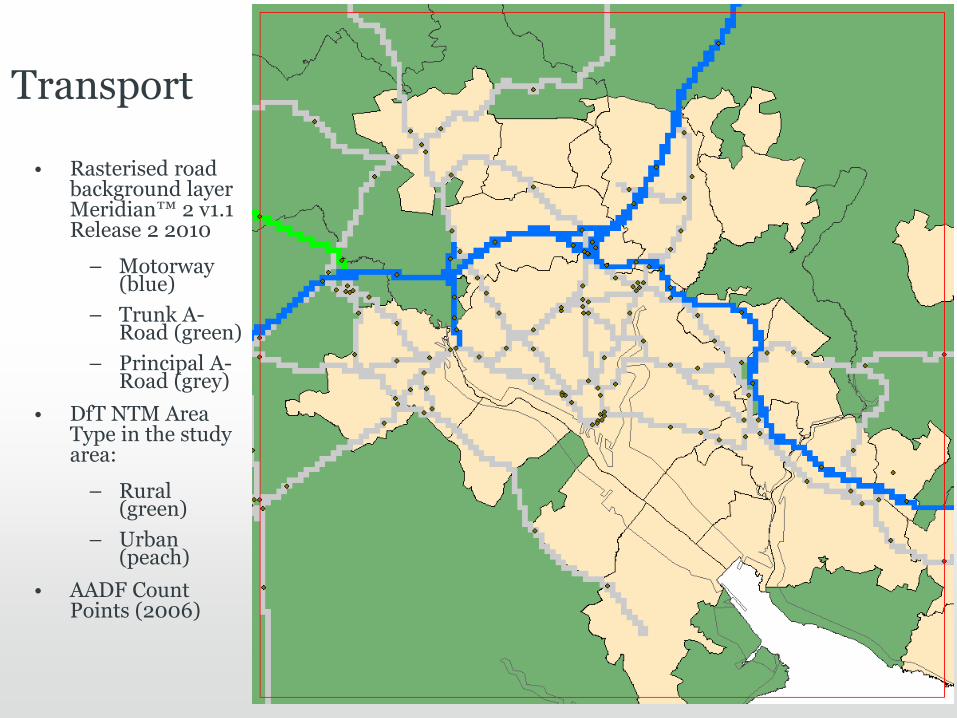
Transport
• Rasterised road background layer Meridian™ 2 v1.1 Release 2 2010
– Motorway (blue)
– Trunk A-Road (green)
– Principal A-Road (grey)
• DfT NTM Area Type in the study area:
– Rural (green)
– Urban (peach)
• AADF Count Points (2006)


Census 2011 as Open Data?
2011 census
• Census day 27 March: broadly conventional census, with internet completion channel
• Mail-out and mail-back reliant on address listing
• Flexible enumeration effort focused on most difficult areas
• Extended imputation methodology
• Overall cost ~£500m
• First data July 2012: basic demographic statistics for local authorities, detailed data for small areas follow in autumn
19


Photos: David Martin
How has it gone?
• Early days, but looking encouraging:
– No foot and mouth epidemic
– No significant cyber-attack
– No large scale civil disobedience
– No systematic addressing/postal system failures
• Response rate 94 per cent nationally and over 80 per cent in every local authority. Most London boroughs 5-15 percentage points better than in 2001; overall over 90 per cent. [Glen Watson, 2011 Census Director - July 2011] i.e. we can expect good small area data
22

What about 2011 data?
• Broadly comparable questionnaire content to 2001
• Broadly comparable set of data outputs planned (2001+)
• More questions on citizenship, place of residence
• New population bases possible – daytime, weekday, majority of time, non-term time, etc.
• High degree of geographical boundary stability, based on 2001 output areas
23

2011 geographies
• Output area geography retains as many as possible 2001 output areas. Hierarchical splits and mergers only where required by population change.
– Caveat: OA boundaries changed by consultation and some split by local authority boundaries (very few).
• New geography of workplace zones based on hierarchical splits and mergers of 2011 OAs to produce WZs suitable for publication of workplace (“daytime”) data with much more detail than in 2001
24

25
OAs split to form
WZs
OAs merged to form
WZs
OAs equivalent to
WZs
Southampton workplace zones –
test data
2011 data products
• Principal outputs free at point of use, and expected to be under some form of Open Government Licence
• Anticipated that this will include the OA/WZ boundary products also (ONS-OS!)
• Plans for user API-based access to data direct from ONS (alongside more conventional means of access)
• Much more ‘Open’ census user community and richer tools for comparison over time
• Practical example = InFuse!
26

27

Data considerations (DM ★ ratings??)
• Some sources are explicitly Open (e.g. OS OpenData); some like Census 2011 are heading in the right direction
• Some sources are ‘National Statistics’: very clear definitions, standards and documentation (e.g. census); not formally Open, maybe Linked data
• Some sources are thoroughly documented: at least we understand the limitations, reference dates, completeness (e.g. DfT), limitations, temporal consistency (e.g. HES)
• Some sources are as yet not Open or Linked (e.g. ABI) or are not government sources (e.g. ALVA): widely varying metadata and reliability 28

Mapping and modelling
Population 24/7

Space-time population modelling
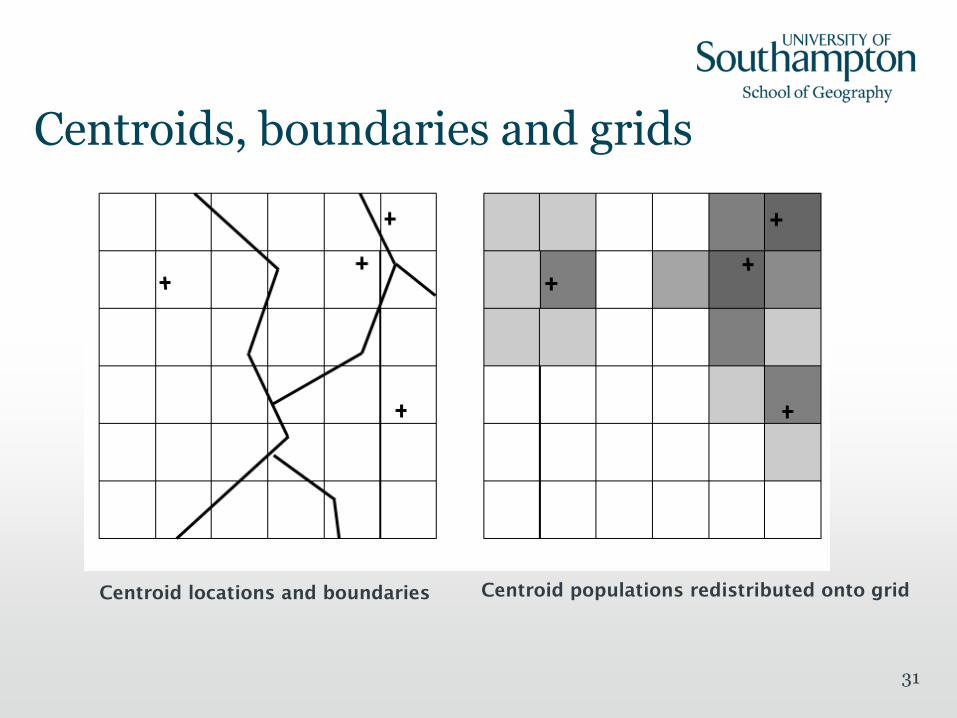
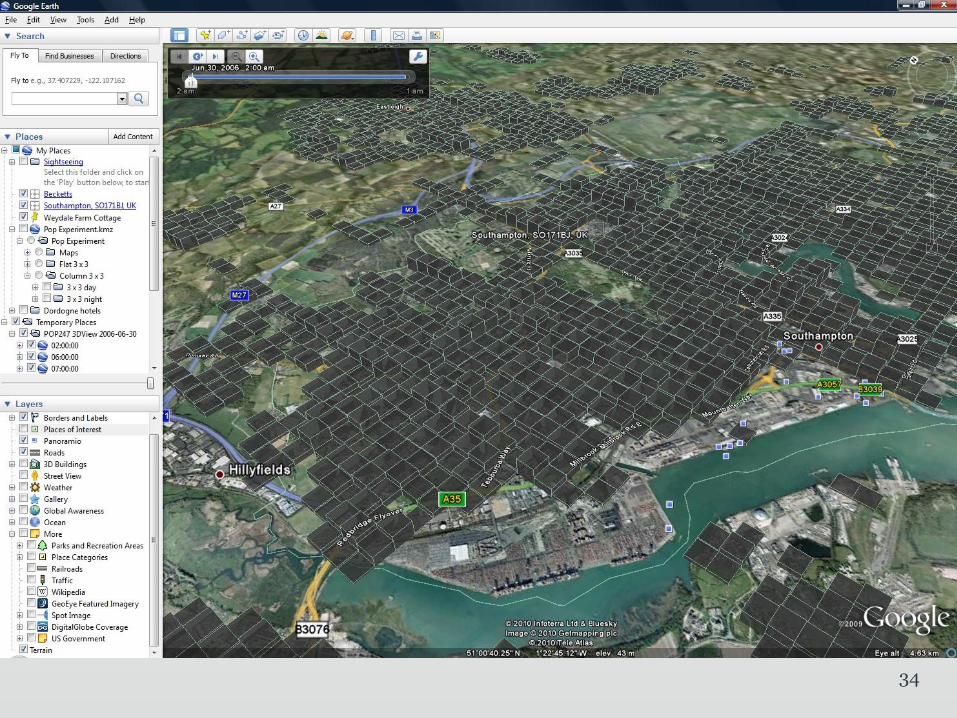
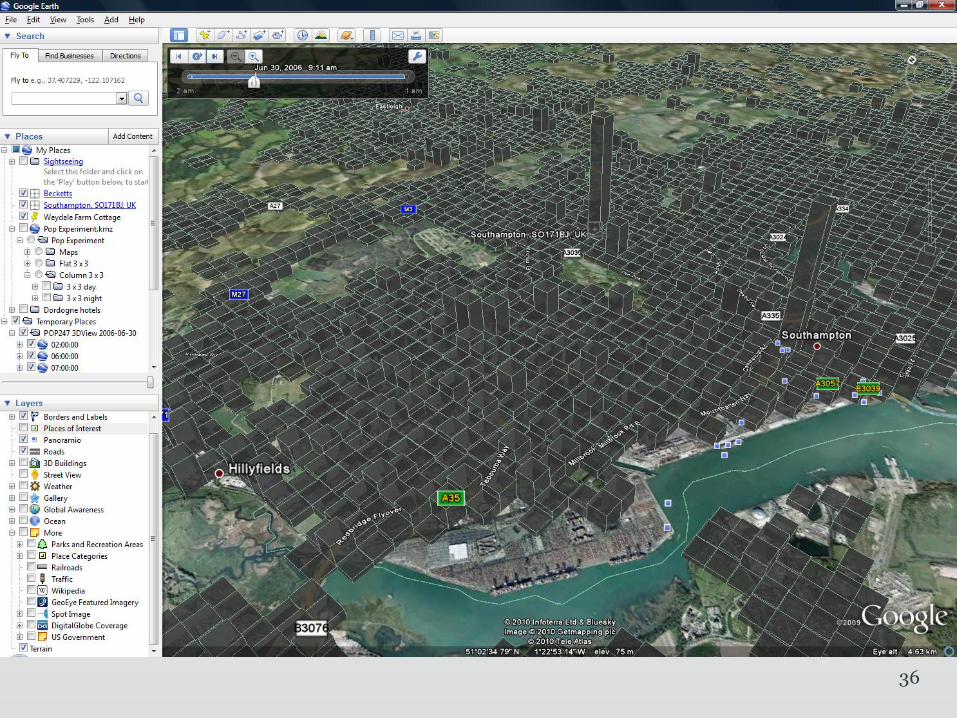
• Have developed gridded population modelling tool which takes library of time-profiled population centroid locations and redistributes population onto grid for a specified target time
• Modelling tool SurfaceBuilder247 available and demonstrator data being prepared by MIMAS (although data download and library requirements currently substantial)
• Gridded approach stronger for all time-based applications because basic spatial units do not change!
31
Centroids, boundaries and grids
Centroid locations and boundaries Centroid populations redistributed onto grid
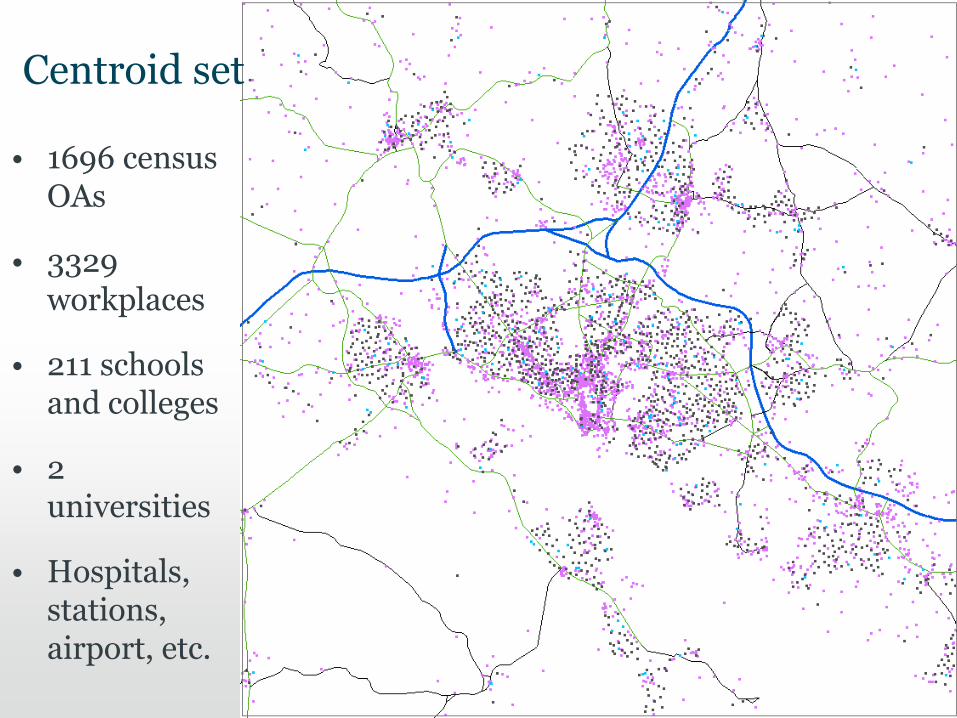
Centroid set
• 1696 census OAs
• 3329 workplaces
• 211 schools and colleges
• 2 universities
• Hospitals, stations, airport, etc.

Origin centroid within area of influence j
study area a
area of influence j
local extent d
centroid i
background layer b
time
t
34

35
36

Conclusion
• Huge new possibilties for time-based population mapping, whether comparing successive censuses or modelling day-night redistribution of population
• Open Data agenda is very significant in facilitating this. Fundamentally, facilitating techniques and tools not previously viable
• Community watching closely relevant developments and consultations – e.g. Public Data Corporation, National Address Gazetteer, etc.
37
38
Acknowledgements
• ESRC Award RES-062-23-1811; Employee data from the Annual Business Inquiry Service, National Online Manpower Information Service, licence NTC/ABI07-P3020. Office for National Statistics 2001 Census: Standard Area Statistics (England and Wales): ESRC Census Programme, Census Dissemination Unit, Mimas (University of Manchester). National Statistics Postcode Directory Data: Office for National Statistics, Postcode Directories: ESRC Census Programme, Census Geography Data Unit (UKBORDERS), EDINA (University of Edinburgh). Quarterly Labour Force Survey, Economic and Social Data Service, usage number 40023. Meridian™ 2 v1.1 Release 2 2010, Contains Ordnance Survey data © Crown copyright and database right 2010