mapping political support the 1990s: global analysismishler/criticalcitizens chapt 2.pdfspecific...
TRANSCRIPT
Mapping Political Support in the 1990s: A Global Analysis
HANS-DIETER KLlNCEMANN
0 VER the past quarter-century, an unprecedented and often unantici- pated wave of democratization has spread over large parts of the world.
While some scepticism is reasonable regarding both the level and durability of many of the new experiments within the 'third wave' of de~rlocratization (Huntington 1991), the direction and scope of these developments are largely beyond dispute. One need not adhere to the premiss that this movement is an inevitable endpoint (Fukuyama 1991) in human governance in order, none the less, to acknowledge the current historical reality. The breadth and depth of the trend need not, however, carry with it the presumption of permanence. The previous two waves of democratization over the past century were fol- lowed by considerable backsliding. Evidence of similar retrogression is evident within the third wave. Some countries, such as Nigeria, have been participants in both the second and the third wave, and have already fallen back. Others, such as Turkey and varlous Latin American cases, continue to struggle with an apparently tenuous grasp on the climb to status as stable democracies. Most democratic theorists would argue that the success or failure of such experi- ments is in large part a function of the support built among the citizenry, sup- port that lends legitimacy to the regime. It is further asserted that legitimacy is heavily influenced by, or almost a function of, the performance of the regime (Lipset 1959, 1993, 1994).
The main goal of this chapter is to use an extensive body of comparative sur- vey research to map patterns and forms of political support across a wide range of political conditions. While the goal is primarily descriptive, at least two interesting themes emerge. First, there are no major trends suggesting a decline in support for democracy as a form of government in the abstract or as applied to existing democratic experience. Certainly, there is no evidence of a crisis of democracy (see Klingemann and Fuchs 1995; in contrast, see Crozier, Huntington, and Watanuki 1975). There are, to be sure, citizens of
Richard 1. Hofferbert has helped to cut and substantially rewrite an earlier draft of this chapter. I want to gratefully acknowledge his generous help.

ources of the World Valm Suvqs to ort among the mass p a C S in estab-
cracies. SpecificWl this chapter
of cornparable national surYeys. can differentiate between differ- c o m m ~ t Y l the desirabiliV Of a
schOIZiIIY h & t a c e on neeh for c o n ~ c e bemeen the Of govan- ,, ,,,aons, on one and political d m e t on the can be
traced an ?& at least to AristotLe. Among modem
and Eastern E m ~ e a n countries are prepared least they not want to give up their newly Or Ieturn to the regime. U l e r and
Of their most recent survey analysis this to fear that the collapse of
au thOr~~~~anism is inevitable. TO
zens higW value, scqtidsm is Most scholars agree that the
deep of support f~uIldatim of legitimacy are r=ies' that are ineffective in time can lose legti th20retical =-om,
.x
. . . - * I ' . I , - . L - U k - .

Cross-national Trends in Confidence
could well accept the current Polish regime but campaign vigorowly for electoral victory of the opposition.
Data from the World Values Surveys aUow for measurement of these political support, namely: identification with the political community as the legitimacy of demoaatic principles, and the effectiveness af the performance. These attitudinal constellations can be mapped aaoss coun by geographic regions, by the age and level of democracy. and by the ge level of economic &veIopment. Mappmg these components is a sign% start toward comparative understanding of the breadth and forms of poli support across the world of established, fledgling, and would-be democra near the turn of the millennium.
Surveys, Tirnepoints, and Indicators .I Today, in many counb5es, the attitudes of citizens are monitored routinely but
comparable data aaoss countries and time are not easily available. Such efforts as the International Social Survey Programme (ISSP) and of the New Democracies Barometer (NDB), sponsored by the Austrian Paul Lazarsfeld. Society, have done a lot to improve the situation.
This study relies mainly on the World Valuer Surveys (WV8.1 This study, co- ordinated by Ronald Inglehart, is stiU the only comparative wvey project that, in principle, aims at global co~erage.~ Surveys during the mid-1990s from the World Values Surveys, appropriate for measuring the relevant aspects of political support, were available for 39 states. They include countries in inNorth and Central America (4). South America (6), Australia (I), M i (5). Africa (2). Western Eump (8) and Eastern Europe (13).' In addition, diEfering lev& of political suppon in the mid-1990s can be compared to those at the beghnhg of the 1990s in 25 countries. Since not all of the indicators selected for analy- sis are available in every survey, the enan number of countries on which spe- dfic analyses are based are reported for each .table. In addition to the World Values &veyi,'the chapter also draws on three regional comparative surveys monitoring satisfaction with the democ~atic process, an important indicator of regime performance.* Based on these sources, in total 87 surveys are avail-
Data wllection in the former republics of the Soviet Unfon and in W& and East Germany has baen supported by a grant from the WW Foundation.
For the &st major analyses of the early waves of the World Values Sumy. see Ronald IngMwt (1977,1990, 1997~).
For our purposes, West and E m Gemmy were analysed separately and counked as two cases. These are (1) t h e 1 9 9 6 ~ ~ ~ c o o r d t n a ~ by Marra Lagas which avers 11 coun-
tcles; (2) the West European 199s Emborometa Survey carried out on behalf of &e heopean Commfsion whtch together with an associated Norwegian survey comprises 18 Eounttle (Great Bdtain and Northam Ireland as well as Wet and East Gernaany counting as %para@ oases); and (3) the 1996 Cenbal and Bartern EumlxMntaa S v (I9 coun*Lr) also sponsored on a sew bsris by the Eumpean C o m ~ o n . Cross-time cornpadsoar for the pedormm lndlcslor Wth th eadp 1990s are possible for s m of countries both for the Wesdem &-opean B2oobmometer S m y r (15 countries) and the Central fUUi Eartan Euro- Svmys (19 coun~es).
able for 63 countries for the mid-1990s. These countries include about 45 per cent of the world population. Yet, as already noted, limited availability of spedic, comparable indicators restricts the number of countries included in different aspects of the analysis.
Large-scale aos-national surveys are, by necessity, co-opuative projects. Funding by a single source is virtually impossible to obain. This implies that indicators which finally enter the questionnaire are a result of much discus- sion and some compmmtre or they are, as is the case of the surveys paid for by the European Commission, beyond control by academic researchers. For this reason analysts face problems of secondary analysis. They are obliged to use
'
those indicators that iinally entered the questionnaire, even though alterna- tives might have been preferred. This should be kept in mind when it comes to the choice of indicators for the dierent types of political support.
The immediate task is to test how far key theoretically posited dimensions of political support can be identified within the available data. I )
Political Community
Two indicators are available for the measuement of support for political corn- munity:
'Hm proud are you to, be a [citizen of this country]? (4) V a y p o d t (3) qik proud, (2) not very plod, (1) not at all proud.'
#Of course we all hope that there will not be anothor war, but i f it were to come to thatr would you be willing to fight for )our C O U ~ ? (1) )yr (0) no.'
Democracy as an Ideal Form of Government
It is basic to my thesis that citizens can compare and evaluate alternative types of regimes, beyond merely assessing the immediate attractiveners of the particula regime under which they are currently living. Thus, inquiry into the attractiveness of democracy is possible (assuming authorities allow the
, research to Qe conducted);ven among populations living under non- or quasi- democratic regimes. Iri the sanS@ sense that people can discriminate between specific incumbent authorities and the reghe, so they can discriminate between their current regime and conceivable alternatives. Thus, the respon- dents in the World Values Surveys were asked the following two questions regarding demoaatic principles:
' I mn going m describe various types ofpolitical systems and ask what you think abovt arch as a way of governing this couniiy. For each would you say it ir (4) a very good, (3) a fairly good (2) a fairly bad, or (1) a very bad way ofgovein- inx this country? Having a democratic ~ystem.'~
a The item has been asked in the context of a four-item batterg. The addltlonal three items read
- as follows: 'Hm'ng a sbong lwder who dws not hove to bother with parlimnont and elections; 'Hm.ng expa% nittpmrnent, make &&ions m d i w to what they thhk b best fa the counbf; 'Having the
38 Cross-national Trends in Confidence Mapping Political Support in the 1990s 39
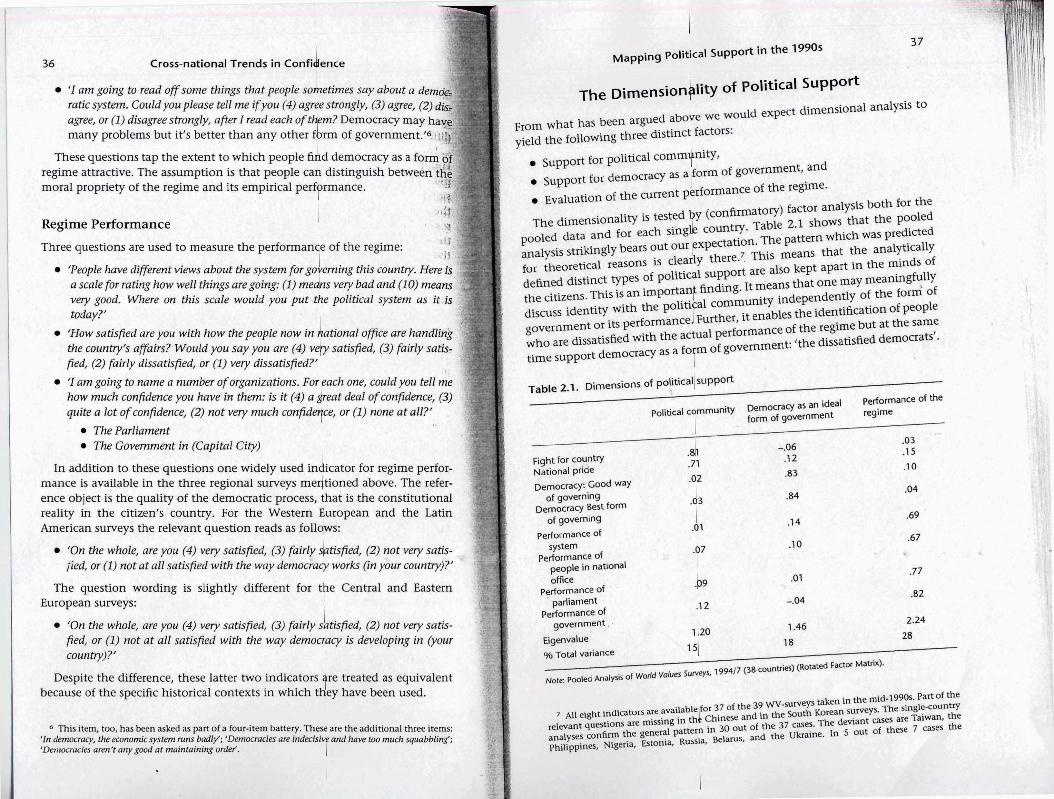
The analyses reported in Table 2.1, thus, clearly confirm that these three dimensions are present and distinct across a multi-country (pooled) set of respondents. Given, however, that the general fit and specific factor loadings vary somewhat from country to country, it is less cumbersome to use the facr tor analysis to guide the construction of simpler, additive in dice^.^ Thus, 1 have constructed three such indices-one for each of the three concept^.^
(1) Support for political community: The variables 'fight for country' (011) and 'national pride' (recoded 1,2 = 0; 3,4 = 1) are added to form a three-point scale of support for the political community: 1 = low sup- port; 2 = medium support; and 3 = high support. Proportion of citizens with high support for political community are displayed in the respec- tive tables.
(2) Support for democracy as a form of govemment: The variables 'democ- racy best form of government' and 'democracy good way of governing' are added to form a seven-point scale, ranging from 1 = low support to 7 = high support. Proportion of citizens with scale values 5-7 are displayed in the respective tables.
(3) Performance of the regime: The variables 'performance of the system for governing' (recoded 1-3 = 1; 4 5 = 2; 6-7 = 3; 8-10 = 4), 'performance o f people in national office' (1-4), 'confidence in parliament-' (1-4), and 'conti- dence in government' (1-4) are added to form a 13-point scale: 1 = low performance to 13 = high performance. Proportion of citizens with scale values 8-13 are displayed in the respective tables.
Support for Political Community
An expressed willingness to fight for one's country, combined with a high degree of national pride might be variously labelled. Here we use these ques-
dimension of democracy as a form of government stands out as it should. In Nigeria and Russia the same is true for the political community dimension. However, although the general hypothesis is not borne out in all countries, it holds in the overwhelming majority.
1 could have used factor scores from the pooled analysis; however, those scores for any single country would be directly weighted by the overall distribution across countries. An additive score avoids this statistical encumbrance. - -~ ~ ~ ~ - - ~
1 have checked the intercorrelations of the variables involved and found them satisfactory in the cases of support for democracy as a form of government (pooled correlation .44, average of single country correlations .39) and evaluation of performance of democracy (pooled correlations system for governing: people in national office .40; system for governing: confidence in parliament .30; sys- tem for governing: confidence in government .37; people in national office: confidence in parlia- ment .32; people in national office: confidence in government .37; confidence in parliament: confidence in government .63; averaged single country correlations correspond in all cases to those reported for the pooled analysis). The intercorrelation between the two indicators formlng the dimension of support for the political community, however, were considerably weaker (pooled cor- relation .19) and not significant at the .001 level in 2 of the 38 countries (Philippines and Taiwan; average single country correlation .19).Thus, in addition to discussing scale distributions we might wish to look at the two indicators forming the scale also separately.
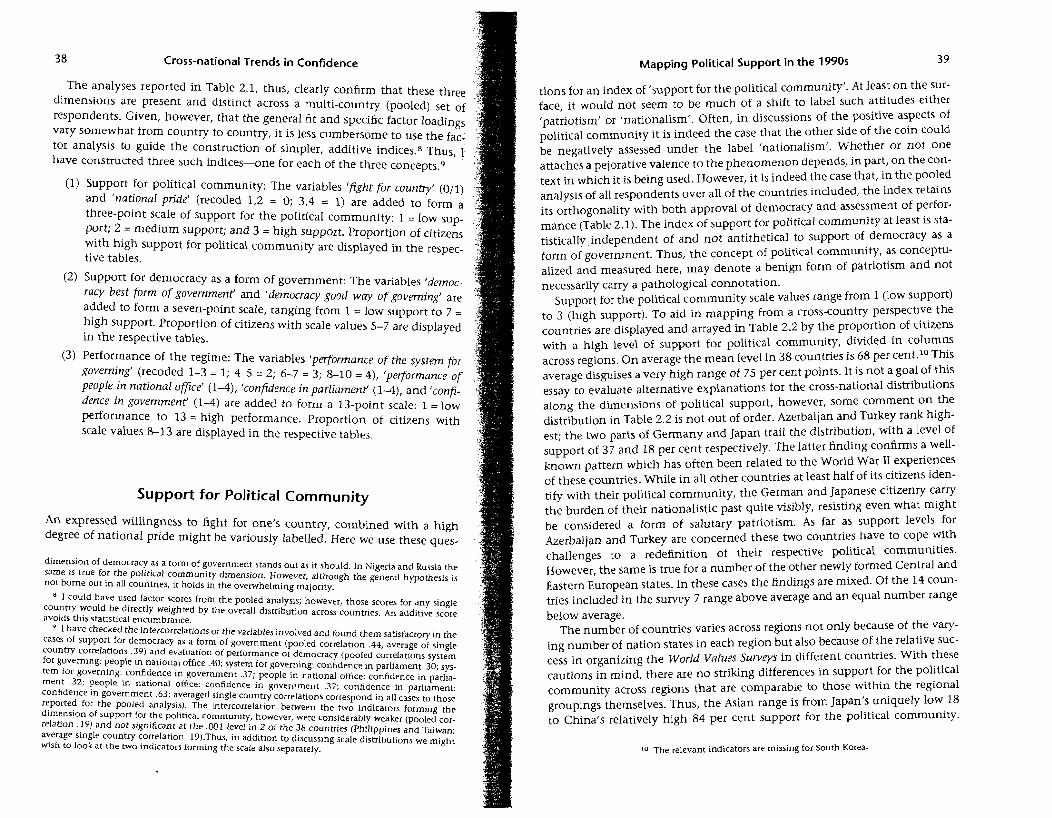
tions for an index of 'support for the political community'. At least on the sur- face, it would not seem to be much of a shift to label such attitudes either 'patriotism' or 'nationalism'. Often, in discussions of the positive aspects of political community it is indeed the case that the other side of the coin could be negatively assessed under the label 'nationalism'. Whether or not one attaches a pejorative valence to the phenomenon depends, in part, on the con- text in which it is being used. However, it is indeed the case that, in the pooled analysis of all respondents over all of the countries included, the index retains its orthogonality with both approval of democracy and assessment of perfor- mance (Table 2.1). The index of support for political community at least is sta- tistically independent of and not antithetical to support of democracy as a form of government. Thus, the concept of political community, as conceptu- alized and measured here, may denote a benign form of patriotism and not necessarily carry a pathological connotation.
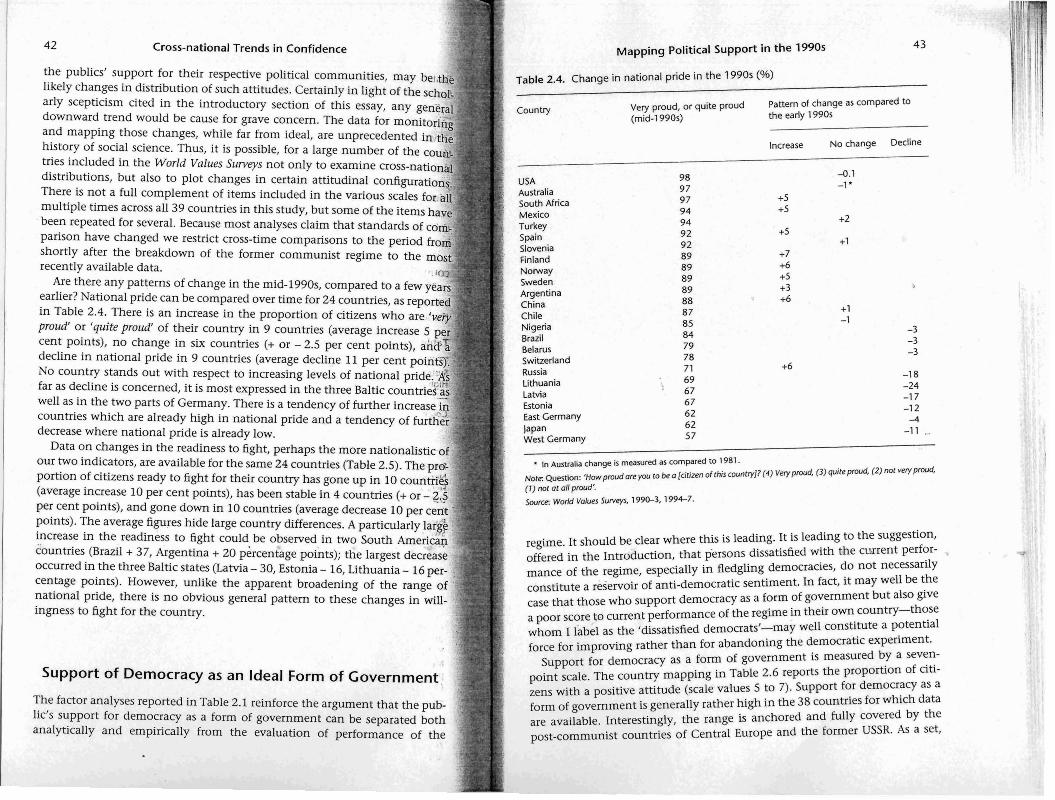
Support for the political community scale values range from 1 (low support) to 3 (high support). To aid in mapping from a cross-country perspective the countries are displayed and arrayed in Table 2.2 by the proportion of citizens with a high level of support for political community, divided in columns across regions. On average the mean level in 38 countries is 68 per cent.1° This average disguises a very high range of 75 per cent points. It is not a goal of this essay to evaluate alternative explanations for the cross-national distributions along the dimensions of political support, however, some comment on the distribution in Table 2.2 is not out of order. Azerbaijan and Turkey rank high- est; the two parts of Germany and Japan trail the distribution, with a level of support of 37 and 18 per cent respectively. The latter finding confirms a well- known pattern which has often been related to the World War II experiences of these countries. While in all other countries at least half of its citizens iden- tify with their political community, the German and Japanese citizenry carry the burden of their nationalistic past quite visibly, resisting even what might be considered a form of salutary patriotism. As far as support levels for Azerbaijan and Turkey are concerned these two countries have to cope with challenges to a redefinition of their respective political communities. However, the same is true for a number of the other newly formed Central and Eastern European states. In these cases the findings are mixed. Of the 14 coun- tries included in the survey 7 range above average and an equal number range below average.
The number of countries varies across regions not only because of the vary- ing number of nation states in each region but also because of the relative suc- cess in organizing the World Values Surveys in different countries. With these cautions in mind, there are no striking differences in support for the political community across regions that are comparable to those within the regional groupings themselves. Thus, the Asian range is from Japan's uniquely low 18 to China's relatively high 84 per cent support for the political community.
Iu The relevant indicators are missing for South Korea.
Cross-national Trends in Confidence Mapping Political Support in the 1990s 41
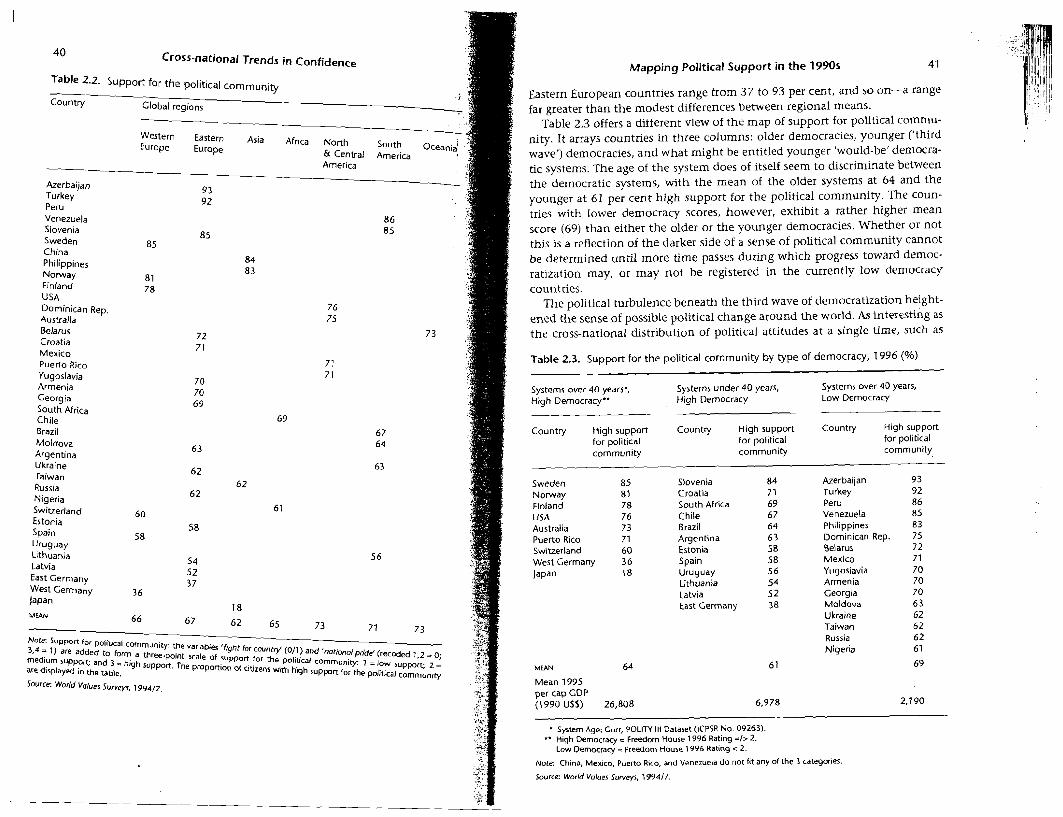
Table 2.2. Support for the political community
Country Global regions 1 Eastern European countries range from 37 to 93 per cent, and so on-a range far greater than the modest differences between regional means.
Table 2.3 offers a different view of the map of support for political cornmu- nity. It arrays countries in three columns: older democracies, younger ('third wave') democracies, and what might be entitled younger 'would-be' democra- tic systems. The age of the system does of itself seem to discriminate between the democratic systems, with the mean of the older systems at 64 and the younger at 61 per cent high support for the political community. The coun- tries with lower democracy scores, however, exhibit a rather higher mean score (69) than either the older or the younger democracies. Whether or not this is a reflection of the darker side of a sense of political community cannot be determined until more time passes during which progress toward democ- ratization may, or may not be registered in the currently low democracy countries.
The political turbulence beneath the third wave of democratization height- ened the sense of possible political change around the world. As interesting as the cross-national distribution of political attitudes at a single time, such as
- western Eastern Asia Africa ~ o r t h south oceanid Europe Europe & Central America
rb'IICI
Azerbaijan o a Turkey Peru Venezuela Slovenia Sweden China Philippines Norway Finland USA Dominican Rep. Australia Belarus Croatia Mexico Puerto Rico Yugoslavia Armenia Georgia South Africa Chile Brazil Moldova Argentina Ukraine Taiwan Russia Nigeria Switzerland Estonia Spain Uruguay Lithuania Latvia East Germany West Germany lapan
Table 2.3. Support for the political community by type of democracy, 1996 (%)
Systems over 40 years', Systems under 4 0 years, Systems over 40 years, High Democracy" High Democracy Low Democracy
Country High support Country High support Country High support for political for political for political community community community
Sweden 85 Slovenia 84 Azerbaijan 93
Norway 81 Croatia 7 1 Turkey 92
Finland 78 South Africa 69 Peru 86
USA 76 Chile 67 Venezuela 85
Australia 73 Brazil 64 Philippines 8 3 Puerto Rico 71 Argentina 6 3 Dominican Rep. 75 Switzerland 60 Estonia 58 Belarus 72 West Germany 36 Spain 58 Mexico 71
lapan I 8 Uruguay 5 6 Yugosiavia 70 Lithuania 54 Armenia 70 Latvia 5 2 Georgia 70 East Germany 38 Moldova 6 3
Ukraine 62 Taiwan 62 Russia 62 Nigeria 61
MEAN 64 61 69
Mean 1995
MEAN 66 67 62 65 73 71 73
Note S u p ~ f i f o r political community: the var~ables 'fight for couuntq (011) and *mtjo,,o,pnh, Crecoded 1 = 0. 3,4 = lie added to form a three-point r a i of support for the political c ~ m m u n , ~ : I =low 5 u P p o ~ medium supPo' and 3 =high support. The PrOpoRion of citizens with high Supporn for the politics) comm&,itv are displayed in the table.
per cap COP (1 990 USS) 26,808
System Age: Curr, POLITY Ill Dataset (ICPSR No. 09263). *' High Democracy = Freedom House 1996 Rating =I> 2.
Low Democracy = Freedom House 1996 Rating < 2.
Note. China, Mexico, Puerto Rico, and Venezuela do not fit any of the 3 categories.
Source: World Values Surveys, 199417.
mm
m m,hrUP-
I I
I rN-7
v
II
II
I
7 - +
I
"-,"-I
"-I h
wr
nm
u,
\o
++
+
++
++
+
Mapping Political Support in the 1990s 44 Cross-national Trends in Confidence
Table 2.5. Change In willingness t o f i gh t for country i n t h e 1990s (%) Table 2.6. supp~f l for democracy as an ideal f o r m o f government (%)
Pattern c the early
Country Would fight for (mid-1990s pel
y country i tage 'yes')
)f change as compar 1 990s ( O h )
Global regions
Country western €astern Asia Africa North & south Oceania Europe Europe
Central America America Increase No change
Turkey 96.3 +4.3 ..1:. > . h
China 93.4 -3.63 Sweden 92.1 +3.6 ?. j Slovenia 89.8 +7.5 .-a j
88.6 Norway +3.4 , .
Belarus 87.8 -2.8 1 .! Finland 84.2 -3.3'+ -
Russia 82.2 .t , USA 77.4 '1 :
Australia 74.6 Estonia 74.6 -1 7.5 ..- Chile 74.0 Mexico 73.0 Brazil 71.8 South Africa 70.4 -6.7 Switzerland 70.3 . i f
Nigeria 69.5 -1 0.4 Lithuania 68.1 -1 5.6 : Latvia 67.6 -29.8 Argentina 67.0 +20.1 Spain 58.8 East Germany 49.9 -3.0 West Germany 49.2 +7.5 l a ~ a n 24.2 +3.9
Azerbaijan Croatia Uruguay West Germany 9 3
Norway 93
sweden 9 3 Spain 92 swiuerland 91 East Germany ~ rgen t ina Dominican Rep. Turkey lapan Yugoslavia USA Nigeria puerto Rico ~ithuania Peru south Africa Estonia Georgia Venezuela south Korea Taiwan ~ustral ia Slovenia Latvia Chile Brazil Belarus Finland 75
Armenia Ukraine Philippines Mexico
In Australia change is measured as compared to 1981. ': Notes: Questions: 'Of course we all hope that there will be not another war, but rf it were to come to that, would you .: be wrllina to fiaht for vour countrv? ( 1 ) ves. (0) no.'
Sources: Wc
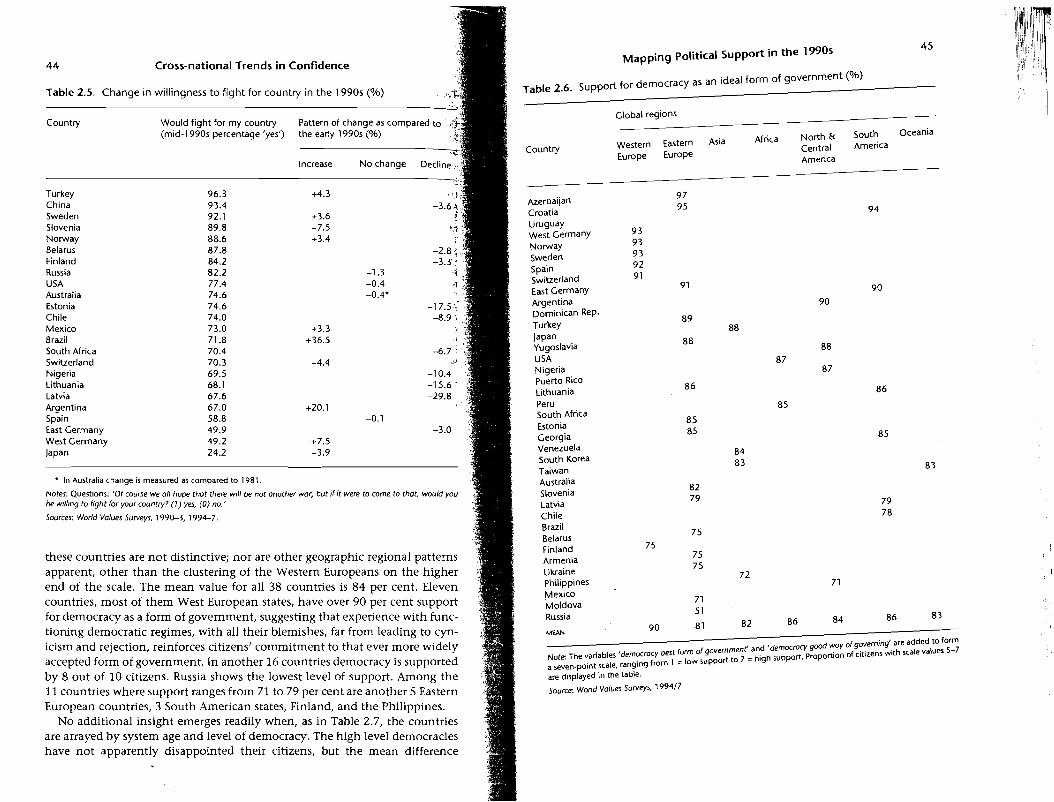
these countries are not distinctive; nor are other geographic regional patterns apparen end of 1
the clusteril I mean valuc
of the We! 3r all 38 cc
iropeans on the is-84 per cent.
countries, most of them West European states, have over 90 per cent support j for democracy as a form of government, suggesting that experience with hnc- + tioning democratic regimes, with all their blemishes, far from leading to cyn- 1 icism and rejection, reinforces citizens' commitment to that ever more widely accepted form of government. In another 16 countries democracy is supported by 8 out of 10 citizens. Russia shows the lowest level of support. Among the 11 countries where support ranges from 71 to 79 per cent are another 5 Eastern 1
European countries, 3 South American states, Finland, and the Philippines. No additional insight emerges readily when, as in Table 2.7, the countries
are arrayed by system age and level of democracy. The high level democracies have not apparently disappointed their citizens, but the mean difference
Moldova Russia 3 1
86 84 86 83 MEAN 90 81 82
N~~~ ~h~ *,jemocrocy best form of government' and 'democran 9 ~ d WOY of 9 0 ~ ~ ~ 9 ' ~ ~ ~ added 'Orm
a Xvepwlnt scale, from 1 = low supp0fi to 7 = high suppofi. propofiion of citlzens with scale values 5-7
are dispiayed in the table.
Source, World Values Surveys, 199417.
4 6 Cross-national Trends in Confidence
between the older (88 per cent mean) and younger (86 per cent) democracies is hardly noteworthy. Some doubt is spread among those not attaining a high democracy score, but still a large majority of the citizens of these countries approve of democracy as a form of government, thus perhaps warranting the reference to them as 'would-be' democracies.ll
Table 2.7. Support for democracy as an ideal form of government by type of democ- racy, 1996 (96)
- -
Systems over 40 years*, Systems under 40 years, Systems over 40 years, High Democracy" High Democracy Low Democracy
Country High support Country High support Country High support for democracy for democracy for democracy
West Germany 93 Croatia 95 Azerbaijan 97 Norway 9 3 Uruguay 94 Dominican Rep. 90 Sweden 93 Spain 92 Turkey 89 Switzerland 9 1 East Germany 91 Yugoslavia 88 Japan 88 Argentina 90 Nigeria 8 7 USA 88 Lithuania 86 Peru 86 Puerto Rico 8 7 South Africa 85 Georgia 85 Australia 83 Estonia 85 Venzuela 85 Finland 75 South Korea 84 Taiwan 83
Slovenia 82 Belarus 75 Latvia 79 Armenia 75 Chile 79 Ukraine 75 Brazil 78 Philippines 72
Moldova 71 Mexico 71 Russia 51
MEAN 88 86 80
System Age: Curr, POLIlY Ill Dataset (ICPSR No. 09263). " High Democracy = Freedom House 1996 Rating =I> 2.
Low Democracy =Freedom House 1996 Rating < 2.
Source: World Valuer Surveys, 199417.
Evaluations of the Performance of the Regime
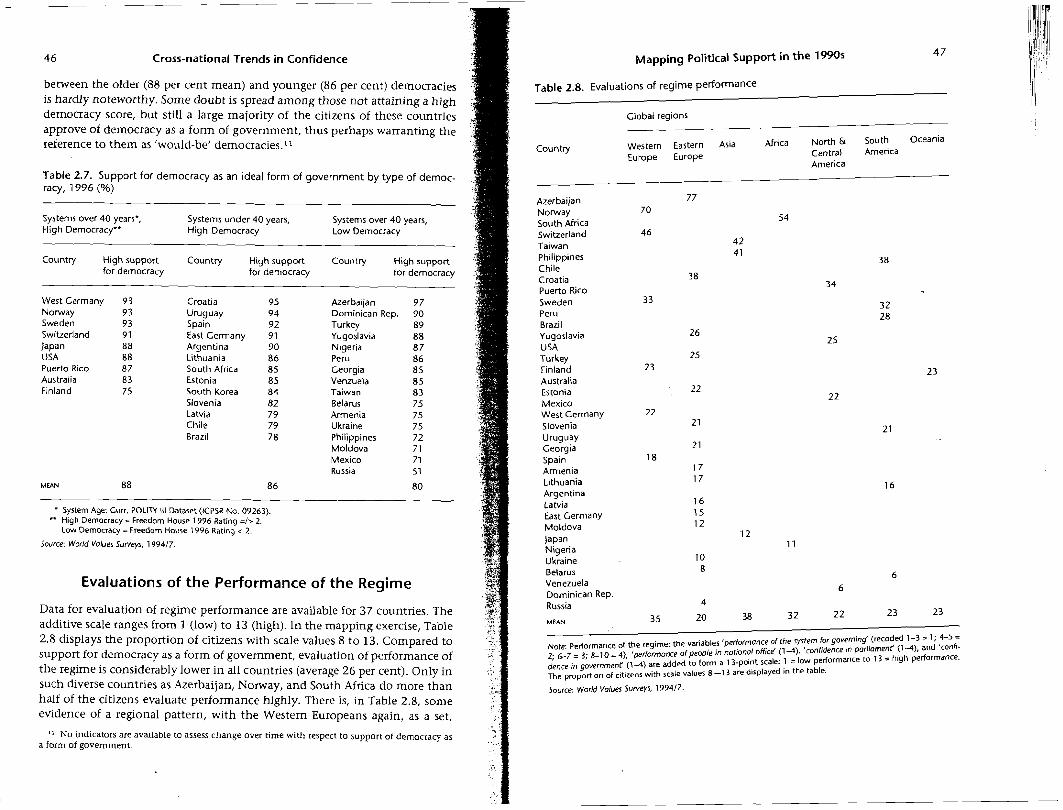
Data for evaluation of regime performance are available for 37 countries. The additive scale ranges from 1 (low) to 13 (high). In the mapping exercise, Table 2.8 displays the proportion of citizens with scale values 8 to 13. Compared to support for democracy as a form of government, evaluation of performance of the regime is considerably lower in all countries (average 26 per cent). Only in such diverse countries as Azerbaijan, Norway, and South Africa do more than half of the citizens evaluate performance highly. There is, in Table 2.8, some evidence of a regional pattern, with the Western Europeans again, as a set,
Mapping Political Support in the 1990s
Table 2.8. Evaluations of regime performance
Global regions
Country Western Eastern Asia Africa North & South Oceania Europe Europe Central America
America
Azerbaijan 77 N o w a y 70 South Africa
54
Switzerland 46 Taiwan 42
Philippines 4 1 Chile Croatia ~ u e r t o Rico Sweden 33 Peru Brazil Yuqoslavia 26 usi Turkey Finland Australia Estonia Mexico West Germany Slovenia Uruguay Georgia Spain Armenia Lithuania Argentina Latvia East Germany Moldova
lapan Nigeria Ukraine Belarus Venezuela Dominican Rep. Russia Lac"., -,-.
Note: Performance of the regime: the variables 'performance of the system for governing' (recoded 1-3 = 1; 4-5 = 2; 6 7 = 3; 8-1 0 = 4), 'performance of people in national office' (1 A), 'confidence ln porliomenf (1 -4), and 'confi- dence in governmenf (1-4) ore added to form a 13-point scale: 1 = low performance to 13 = high performance. The proportion of citizens with scale values -13 are displayed in the table.
Source: World Values Surveys, 199417.
" N o irtdicators are available to assess change over time w i t h respect to support o f democracy as a form o f government.

48 Cross-national Trends i n Confidence
manifesting high assessments although, even there, the spread from Spain's 18 to Norway's 70 per cent, is much wider than the interregional means.
No doubt, democracy thrives and can be built on a widespread, healthy dose of scepticism. And it is not at all clear where the bottom is for positive benefit. But surely in some cases these surveys must be tapping more than scepticism and moving more into the zone of dismay. There must be some concern for the situation in Russia (4 per cent), the Ukraine (10 per cent) and Belarus (8 per cent), as well as in Venezuela (6 per cent) and the Dominican Republic (6 per cent). In these countries taken together only 1 citizen out of 10 is satisfied with the performance of the respective political regime.
Again, I must stress the value of separating support for democracy as an ideal form of government from citizens' evaluations of the contemporary per- formance of their particular political regime, however much it may meet or stray from democratic norms. Thus, for example, 87 per cent of Nigerians hold to the belief that democracy is the desired form of government, even though only 11 per cent of them approve of the performance of their troubled politi- cal system (realistically, most would argue, in this time period). Likewise, over 89 per cent of Turks support the principles of democracy, while barely a quar- ter assess contemporary performance highly. Such disparities are not confined to polities having long experience with such dramatic regime changes as mil- itary coups, as have both Nigeria and Turkey. There is likewise a broad differ- ence in the support for and evaluation of democracy in both Germanys. Support for democracy as a form of government in the recently reunited parts of that country is 93 and 91 per cent, West and East respectively, while evalu- ation of current performance is only 22 per cent in the West and 15 per cent in the East.
Table 2.9, arraying the countries again by system age and level of democra- tization, is perhaps more revealing in the case of evaluations of system perfor- mance than were its counterparts for support for the political community (Table 2.3) or for democracy as a form of government (Table 2.7). There is a clear stepwise decline in the mean evaluations as one moves from the older (mean = 32 per cent) to the younger democracies (27 per cent), and from these to the 'would-be' democracies (23 per.cent).12
'Satisfaction with the way democracy works' has long been used as an indi- cator for the citizens' evaluation of the performance of democracy in their respective countries (Fuchs, Guidorossi, and Svensson 1995) and it correlates .46 with the performance of democracy scale discussed above.13 The indicator is not available for most of the World Values Surveys. However, it has been widely included in the three regional surveys mentioned earlier. This data- base allows for cross-national comparison for the mid-1990s for 50 countries
The interesting case of Azerbaijan, of course, broadens the range in the set of younger, low-scor- i ng polit ical systems.
l 3 The association o f the index 'performance of democracy' and the indicator 'satisfaction wi th the democratic process' can be assessed for 10 Eastern European countries and West Germany. The intra-country correlations range from .30 for Belarus and .55 for East Germany. The mean o f the intra-country correlations is .43 which is on ly slightly lower than the pooled correlation (.46).
Mapp ing Political Support i n the 1990s
Table 2.9. Evaluations of regime performance by type of democracy, 1996 (%)
Systems over 40 years', Systems under 40 years, Systems over 40 years, High Democracy" H igh Democracy Low Democracy
Country High regime Country High regime Country High regime performance performance performance
Norway 70 South Africa 54 Azerbaijan 7 7 Switzerland 46 Chile 38 Taiwan 42 Puerto Rico 34 Croatia 38 Philippines 4 1 Sweden 3 3 Brazil 28 Peru 32 USA 25 Estonia 22 Yugoslavia 2 6 Finland 23 Slovenia 21 Turkey 25 Australia 23 Uruguay 21 Mexico 22 West Germany 22 Spain 1 8 Georgia 21 lapan 1 2 Lithuania 1 7 Armenia 17
Argentina 16 Moldova 1 2 ' Latvia 1 6 Nigeria 11 East Germany 15 Ukraine 10
Belarus 8 Dominican Rep. 6 Venezuela 6 Russia 4
MEAN 32 27 23
System Age: Curr, POLITY I l l Dataset (ICPSR No. 09263). '* High Democracy = Freedom House 1996 Rating =/> 2.
Low Democracy = Freedom House 1996 Rating c 2.
Source. World Values Surveys, 1994/7.
(Table 2.10). Among these are 17 Western European countries, 22 from Central and Eastern Europe, and eleven South American countries. Satisfaction with the democratic process has not been particularly stunning in the mid-1990s. The average proportion of those who are very or fairly satisfied is only 40 per cent. But again the average hides much difference across coun- tries. While the Western Europeans, with the exception of the southern coun- tries (Spain, Portugal, and Italy, in particular) are on the higher side (the average, including the southern countries, is 56 per cent), the Latin Americans are certainly on the lower end (average 29 per cent). Of the Central and Eastern Europeans, Hungary, Slovakia, Belarus, Ukraine, Armenia, Russia, Moldova, and Bulgaria score very low indeed.
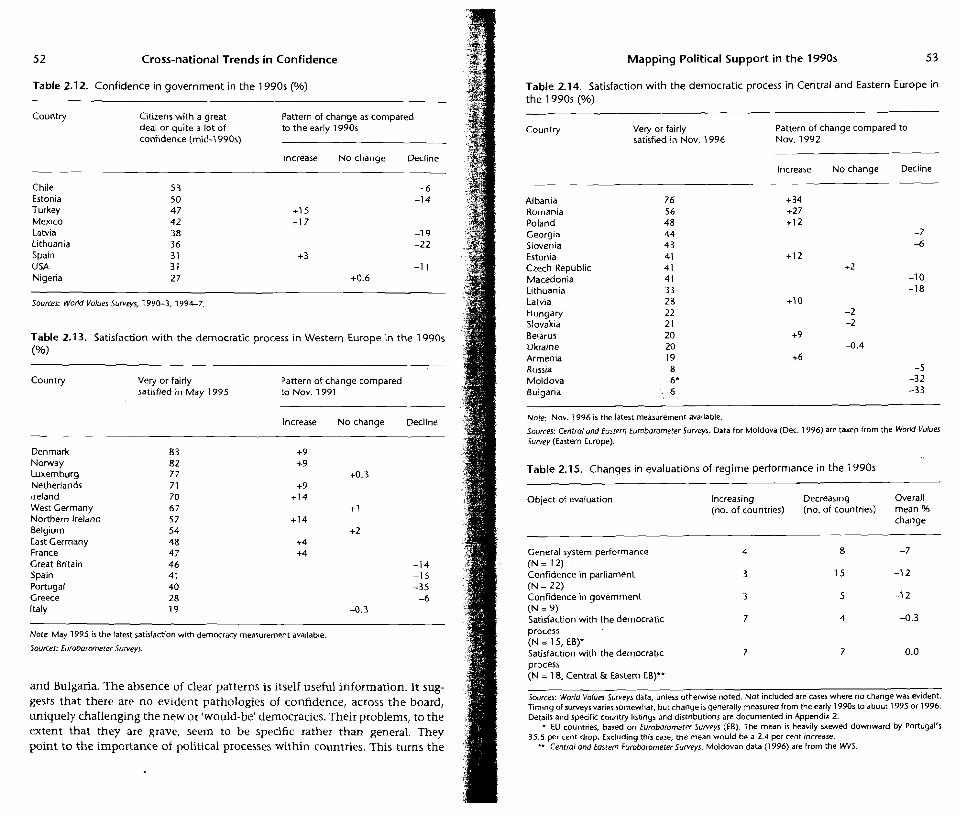
Change over time in performance is difficult to assess. In part, because the respective indicators are not available in a large number of cases, and in part because the indicators which are available are not exactly comparable. Tables 2.11-2.14 present information about the publics' evaluations of different facets of regime performance, including confidence in parliament and government, and satisfaction with the democratic process, with the results summarized in Table 2.15. In general, the common theme of declining assess- ment of political institutions is reflected, with both the number of countries
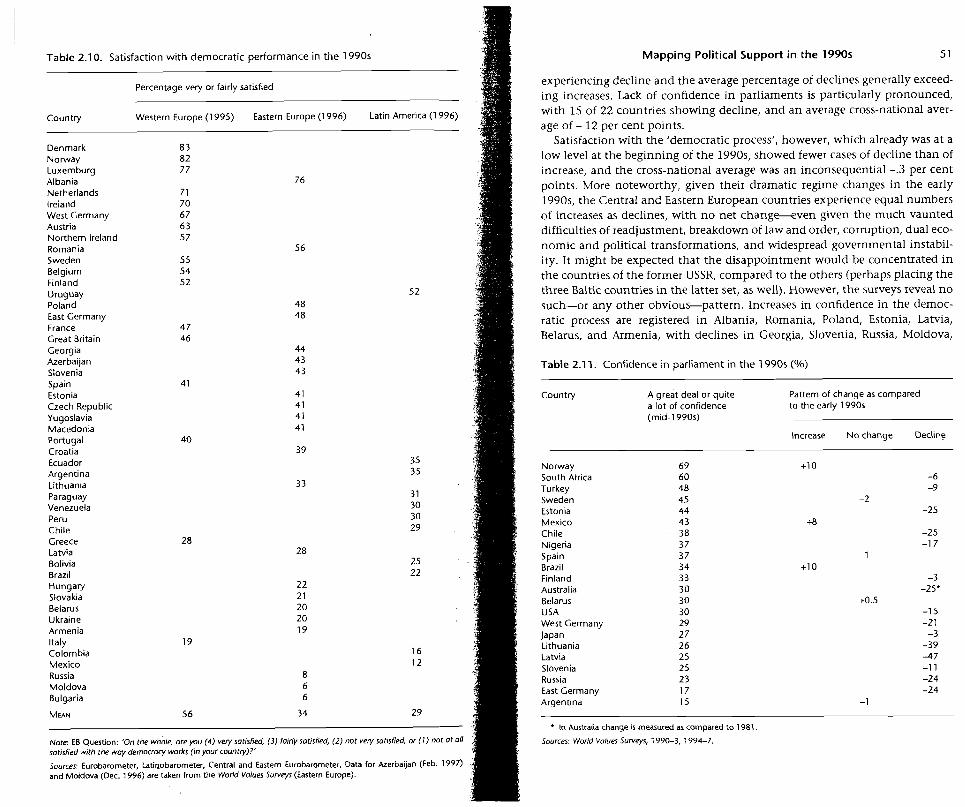
Table 2.10. Satisfaction with democratic performance in the 1990s Mapping Political Support in the 1990s 5 1
Percentage very or fairly satisfied
Country Western Europe (1 995) Eastern Europe (1 996) Latin America (1 996)
Denmark 8 3 Norway 82 Luxemburg 77 Albania 76 Netherlands 71 Ireland 70 West Germany 67 Austria 6 3 Northern Ireland 5 7 Romania Sweden 55 Belgium 54 Finland 52 Uruguay Poland East Germany France 4 7 Great Britain 46 Georgia Azerbaijan Slovenia Spain 41 Estonia Czech Republic Yugoslavia Macedonia Portugal Croatia Ecuador Argentina Lithuania Paraguay Venezuela Peru Chile Greece Latvia 28 Bolivia Brazil Hungary 22 Slovakia 2 1 Belarus 20 Ukraine 20 Armenia 19 Italy Colombia Mexico Russia 8 Moldova 6 Bulgaria 6
MEAN 56 34 29
Note: EB Question: 'On the whole, ore you (4) very satisfied, (3) fairly satisfied, (2) not very sotisfied, or ( 1 ) not ot 01 sotisfied with the way democracy works (in your country)?'
Sources: Eurobarometer, Latinobarometer, Central and Eastern Eurobarometer. Data for Azerbaijan (Feb. 1997) and Moldova (Dec. 1996) are taken from the World Volues Surveys (Eastern Europe).
experiencing decline and the average percentage of declines generally exceed- ing increases. Lack of confidence in parliaments is particularly pronounced, with 15 of 22 countries showing decline, and an average cross-national aver- age of - 12 per cent points.
Satisfaction with the 'democratic process', however, which already was at a low level at the beginning of the 1990s, showed fewer cases of decline than of increase, and the cross-national average was an inconsequential -.3 per cent points. More noteworthy, given their dramatic regime changes in the early 1990s, the Central and Eastern European countries experience equal numbers of increases as declines, with no net change-ven given the much vaunted difficulties of readjustment, breakdown of law and order, corruption, dual eco- nomic and political transformations, and widespread governmental instabil- ity. It might be expected that the disappointment would be concentrated in the countries of the former USSR, compared to the others (perhaps placing the three Baltic countries in the latter set, as well). However, the surveys reveal no such-or any other obvious-pattern. Increases in confidence in the democ- ratic process are registered in Albania, Romania, Poland, Estonia, Latvia, Belarus, and Armenia, with declines in Georgia, Slovenia, Russia, Moldova,
Table 2.1 1. Confidence in parliament in the 1990s (%)
Country A great deal or quite Pattern of change as compared a lot of confidence to the early 1990s (mid-1990s)
Increase N o change Decline
Norway South Africa Turkey Sweden Estonia Mexico Chile Nigeria Spain Brazil Finland Australia Belarus USA West Germany lapan Lithuania Latvia Slovenia Russia East Germany Argentina
In Australia change is measured as compared to 1981
Sources: World Volues Surveys, 1990-3, 1994-7.
52 Cross-na t iona l Trends in C o n f i d e n c e
Table 2.12. Confidence in government in the 1990s (%)
Country Citizens with a great Pattern of change as compared deal or quite a lot of to the early 1990s confidence (mid-1 990s)
lncrease No change Decline
Chile Estonia Turkey Mexico Latvia Lithuania Spain USA Nigeria
Sources: World Values Surveys, 1990-3, 1994-7.
Tab le 2.13. Satisfaction with the democratic process in Western Europe in the 1990s
(%I
Country
- -
Very or fairly Pattern of change compared satisfied in May 1995 to Nov. 1991
Increase No change Decline
Denmark Norway Luxemburg Netherlands Ireland West Germany Northern lreland Belgium East Germany France Great Britain Spain Portugal Greece Ita[y
Note: May 1995 is the latest satisfaction with democracy measurement available.
Sources: Eurobarorneter Surveys.
and Bulgaria. The absence of clear p a t t e r n s i s i tsel f useful information. It sug- gests t h a t t h e r e are no evident pathologies of confidence, across t h e board, uniquely challenging the new or 'would-be' democracies. Their problems, to the e x t e n t t h a t t h e y are grave, seem to b e speci f ic r a t h e r t h a n general. T h e y
point to the importance of p o l i t i c a l processes within countr ies. This turns the
Mapping Po l i t i ca l S u p p o r t in the 1990s 5 3
Tab le 2.14. Satisfaction with the democratic process in Central a n d Eastern Europe in
the 1990s (%)
Country Very or fairly Pattern of change compared to satisfied in Nov. 1996 Nov. 1992
lncrease No change Decline
--
Albania 76 + 34 Romania 56 +27 Poland 48 +12 Georgia 44 Slovenia 4 3 Estonia 41 +12 Czech Republic 4 1 Macedonia 41 Lithuania 3 3 Latvia 28 +10 Hungary 22 Slovakia 21 Belarus 20 +9 Ukraine 20 Armenia 19 +6 Russia 8 Moldova 6' Bulgaria ,, 6
Note: Nov. 1996 is the latest measurement available.
Sources: Central and Eastern Eurobarorneter Surveys. Data for Moldova (Dec. 1996) are taken lrom the World Values Survey (Eastern Europe).
Tab le 2.15. Changes in evaluations of regime performance in the 1990s
Object of evaluation Increasing Decreasing Overall (no. of countries) (no. of countries) mean %
change
-
General system performance 4 8 -7 (N = 12) Confidence in parliament 3 15 -1 2 (N = 22) Confidence in government 3 5 -1 2 (N = 9) Satisfaction with the democratic 7 4 -0.3 process (N = 15, €0)' Satisfaction with the democratic 7 7 0.0 process (N = 18, Central & Eastern EB)"
Sources: World Values Surveys data, unless otherwise noted. Not included are cases where no change was evident. Timing of surveys varies somewhat, but change is generally measured from the early 1990s to about 1995 or 1996. Details and specific country listings and distributions are documented in Appendix 2.
EU countries, based on Eurobarometer Surveys (EB). The mean is heavily skewed downward by Portugal's 35.5 per cent drop. Excluding this care, the mean would be a 2.4 per cent increase. " Central and Eastern Eurobarorneter Surveys. Moldovan data (1 996) are trom the WVS.

54 Cross-national Trends in Confidence
attention to the macro level. Let us conclude by highlighting a few critical macro observations that bring the threads of this discussion somewhat together.
Conclusions: The Relationship Between Community, Democracy, and Performance
The factor analysis reported in Table 2.1 supported the utility of at least a part of the taxonomy of system support. We have compared measures constructed out of surveys from dozens of countries to gauge:
Support for political community Attitude object-the political community Mode of attitude-expressive
Approval of democracy as an ideal form of government Attitude object-the regime Mode of attitude-moral
Evaluation of the current performance of the regime Attitude object-the regime Mode of attitude-instrumental
The factor analysis (Table 2.1) demonstrated that the indices used for these three concepts tapped clearly distinguishable and distinct dimensions at the level of individual survey respondents. That micro distinctness, however, does not rule out the possibility of interesting relationships between these three phenomena at the macro level. Two figures demonstrate the extent to which such relationships may prove interesting.
By way of introducing the relevant figures of the different attitudes, we can return to the phenomenon of the 'dissatisfied democrats'. This is the label applied to people who put a high rating on the attractiveness of democracy as a form of government but at the same time place a low rating on the perfor- mance of their particular democratic regime. For the present, I shall not dis- tinguish between dissatisfied democrats in estdblished, fledghg, or 'would-be' democracies. Of course, extrapolations as to the systemic consequences of actions based on such a disjunction between desired and actual states would need to account for the setting in which the disjunction occurs. The likely actions of mobilized dissatisfied democrats in pre- or non-democratic systems would, no doubt, take very different form from their counterparts in func- tioning democracies. The former could be hypothesized, for example, as hav- ing a high revolutionary potential, while the latter might be expected to serve a reforming and enhancing role in their respective democracies. Some insight may be suggested by the aggregate relationships.
Figure 2.1 plots the percentage of high support for the political community on the vertical axis. The horizontal axis is an aggregate relative ot the 'dissat- isfied democrats', in that it is the difference in the percentage of respondents
Mapping Political Support in the 1990s
. Azerbaijan m Turkey Peru
Venezuela Philippines
Noway
~wltzer~and' Uruguay
Lithuania
m E. Germany ,
m lapan
0 1 I I I I c I I I I
0 10 20 30 40 50 60 70 80 90 Performance of democracy (YO positive)
Fig. 2.1. Support for political community. Source: World Values Surveys 1994-7.
expressing support for democracy as a form of government and the percent- age evaluating the regime's current performance positively. Thus, the figure tells us that countries with a wide disparity between the moral assessment of democracy and the instrumental performance of the regime are also likely to be countries with a relatively low support for the political community. Thus, there is indeed a potential for erosion of the broadest, perhapsmost basic idtn- tity within a polity that can be linked to the extent to which its performance matches the moral aspirations of the population. However, there is sufficient ambiguity in the fit of my measure to the concept of political community (as noted in the earlier discussion of 'patriotism' and 'nationalism') and sufficient spread in the relationship to put this proposition on the agenda as just that- a proposition, worthy of further exploration.
Similar material for further exploration is presented in Figure 2.2, plotting countries according to the percentage approving democracy as an ideal versus the performance of their particular system. Again, good performance, at the system level, is associated with increased approval of democracy as an abstraction. Performance cannot be ignored. The evidence of Figure 2.2, to be sure, is consistent with the standing claim that effectiveness is a condition for

Cross-national Trends in Confidence
Fig. 2.2. Support for democracy as an ideal form of government. Source: World Values Surveys 1 994-7.
Uruguay Azerbaijan. -
E. Germany. 'W. 'Sweden N o w a y .- 2 Dominican R. . ~ p a i n .Switzerland 'g 90 - Lgentina -Turkey n m USAiSerbia
P South Africa
E E E 80- Slovenia
legitimacy. However, I think the evidence is sufficiently mixed to underscore the need for considerable refinement, especially now that the range of national political experience has been broadened so dramatically and now that there is a growing body of heretofore hardly imaginable evidence avail- able for more detailed exploration of the inner workings of embryonic, ado- lestent, and m a k e democracies.
The data, remarkable as they are, do not provide all the answers to the ques- tions posed here. However, the evidence is sufficient to invite a great deal more exploitation. My effort at mapping should serve as an introduction. But it also is consistent with other recent inquiry in casting doubt on the much- acclaimed 'decline' or 'crisis' critiques of modern democracy. I can find no evi- dence of growing dissatisfaction with democracy as a form of government. Further, there is no apparent evidence that the dissatisfied democrats across the globe constitute a danger to democracy. Quite the contrary, they may well be the hope for the future of democratic governance.
0
0 m L
E 2 70- m ., m 5 E X $ 6 0 - n
50
. Latvia . Brazil . Chile
Ukraine. m *Finland Armenia
Philippines = Moldova
'Rusia I I I I I I I I
0 10 20 30 40 50 60 70 80 Performance of democracy (Oh positive)