mapping of existing gender-disaggregated data and ... · the study aimed at mapping all exiting...
TRANSCRIPT

Mapping of Existing Gender-Disaggregated Data and Methodologies in
Agriculture and Rural Development in Kenya
FINAL REPORT Submitted to
JICA, Kenya Office and
Agricultural Sector Coordination Unit (ASCU)
Consultant:
Dr John Kabutha Mugo Gelai Gardens (C1)
Off Matumbato Road, Upperhill P.O. Box 18637 00100 Nairobi
Tel.: 0736684561/0711123222 [email protected]
Assistant Consultants Dr Urbanus Mutwiwa
Mrs Lydia Miriti
1st March, 2011

2 Mugo, Mutwiwa & Miriti: Mapping of Gender Disaggregated Data and Methodologies, February 2011
ACKNOWLEDGEMENTS The completion of this mapping exercise has witnessed the committed contribution
of various individuals and institutions. Foremost, we would like to acknowledge the
facilitation we received from our JICA contact team: Natsue Miyata, Saito Shinichi
and Caroline Murandafu. You accompanied us to the very end, and you were
always there whenever we needed assistance or clarification.
Second, we wish to acknowledge the facilitation we received from the Agricultural
Sector Coordination Unit (ASCU); thanks Anne Chele and Dorcas Mwakoi. We
thank all the gender officers in the line ministries: Beatrice Mwaura (Agriculture),
Judy Amadiwa (Fisheries), Angeline Owino (Regional Development), Teresia
Wasike (Water), Hannah Kinyanjui (Environment), Grace Kimitei (Planning), Rose
Okeda (Forestry) and Mr Sakunda (Livestock). Together with your colleagues, you
created time to meet us and gave us invaluable information.
We wish to acknowledge the personal commitment portrayed by some informants,
who went out of their way to get us the most information from their offices. Allow
us to single out Philip Makheti, the coordinator of NAAIAP, Rosemary Magambo of
NALEP and Stephen Kioko of SHEP-UP. We also thank Dr Mungai of KAPAP, who
we didn’t meet, but who ensured that we were fully facilitated to obtain information
data from his office.
And to all our informants, from Universities, private sector, projects and other
experts, we cannot mention all of you by name, but accept our most humble and
heartfelt appreciation.
Dr John Mugo and Consultants’ Team
3 Mugo, Mutwiwa & Miriti: Mapping of Gender Disaggregated Data and Methodologies, February 2011
LIST OF ABBREVIATIONS AND ACRONYMS
AFIPEK Kenya Fish Processors and Exporters Association
ALLPRO ASAL Based Livestock and Rural Livelihoods Support Project
ASCU Agricultural Sector Coordination Unit
ASDS Agriculture Sector Development Strategy
ASTI Agriculture Science and Technology Indicators
CDA Coast Development Authority
CRF Coffee Research foundation
ENNDA Ewaso Ng’iro North Development Authority (ENNDA),
FAO Food and Agricultural Organization
FA-UN Faculty of Agriculture University of Nairobi
FGD Focus Group Discussion
FVS-UN Faculty of Veterinary Science University of Nairobi
JICA Japan International Cooperation Agency
JKUAT Jomo Kenyatta University of Agriculture and Technology
KAPAP Kenya Agricultural Production and Agribusiness Project
KAPP Kenya Agricultural Productivity Project
KARI Kenya Agricultural Research Institute
KENFAP Kenya National Federation of Agricultural Producers
KIRDI Kenya Industrial Research and Development Institute
KVDA Kerio Valley Development Authority
LBDA Lake Basin Development Authority
MoA Ministry of Agriculture
MDGs Millennium Development Goals
MoFD Ministry of Fisheries Development
MoLD Ministry of Livestock Development
MoPND Ministry of Planning and National Development
MoRD Ministry of Regional Development
NALEP National Agriculture and Livestock Extension Program
PRA Participatory Rural Appraisal
RDAs Regional Development Authorities
SHDP Small Scale Horticulture Development Programme
SHEP Smallholder Horticulture Empowerment Programme
SIPMK Study of the Smallholder Irrigation Project Mount Kenya Region
SoP Status of Progress
TARDA Tana and Athi River Development Authority
4 Mugo, Mutwiwa & Miriti: Mapping of Gender Disaggregated Data and Methodologies, February 2011
Contents 1 ........................................................................................................................7 INTRODUCTION
1.1 .....................................................................................................7 Background Information1.2 ...............................................................................................................7 Terms of Reference
2. .........................................................................................................8 STUDY METHODOLOGY
2.1 ...................................................................................................................8 Mapping Design2.2 ........................................................................................................................8 Study Process
3. ...................................................................9 EXISTING GENDER DISAGGREGATED DATA
3.1 .................................9 Overview: Available gender-disaggregated data in Agriculture3.2 ........................................................................10 Gender and Employment in Agriculture3.3 ........................................................................17 Gender and Participation in Agriculture3.4 ...............................................................................19 Gender and Average Farm Earnings3.5 Asset ownership and accumulation................................................................................20 3.6 Adoption and utilization of technologies.......................................................................22 3.7 ...........................................................................................24 Causes of gender inequalities
4. .......................................26 METHODOLOGIES FOR GENDER DISAGGREGATED DATA
4.1 Overview..............................................................................................................................26 4.2 ..............................................................................................................26 Secondary Review4.3 ....................................................................................................26 Daily Activity Calendar4.4 ..........................................................................26 Questionnaires and Inventory Surveys4.6 ...................................................................................................27 Key Informant Interview4.7 ......................................................................................28 Focus Group Discussion (FGDs)4.8 ...........................28 Participatory Rural Appraisal (PRA) and Stages of Progress (SoP)4.9 ............................................................29 Local histories, timelines and life history traces4.10 ...........................................................................29 Key success factors for methodologies
5. ...............................................30 TOWARDS A GENDER POLICY: RECOMMENDATIONS References ...........................................................................................................................................32
Annexes:
1. List of Persons Interviewed 2. List of Key Data Sources (with key words) 3. Summary of Data and Methodologies (Ms Excel doc)
ADDENDUM – Compilation of (27) Key Data Sources
5 Mugo, Mutwiwa & Miriti: Mapping of Gender Disaggregated Data and Methodologies, February 2011
List of Tables Table 1: Summary of existing gender disaggregated data............................................ 9
Table 2: Percentage of female staff members along job groups in 9 Ministries (2009)
................................................................................................................................. 11
Table 3: Staffing Statistics at the Faculty of Agriculture, Egerton University............ 13
Table 4: Graduation Statistics from Egerton University (December 2010)................. 15
Table 5: Gender distribution of the labour force by employment categories
(rural/urban) (percentages in brackets)........................................................... 16
Table 6: Education levels across the different sectors of the labour market (%)…… 16
Table 7: Perceptions of crop ownership in Kisii, Nyandarua, Transnzoia
and Bungoma ....................................................................................................... 17
Table 8: Division of labour in the crop farming.............................................................. 18
Table 9: Gender and Participation in the fisheries sector.............................................. 19
Table 10: Average earnings of female and male farmers in 4 districts.......................... 19
Table 11: Required inputs and equipment for enhancing agricultural productivity by
rural farmers by sex............................................................................................. 23
Table 12: Adoption levels for indigenous poultry Technologies in western Kenya... 23
Table 13: Causes of gender inequalities: A case of forestry Institutions....................... 24
6 Mugo, Mutwiwa & Miriti: Mapping of Gender Disaggregated Data and Methodologies, February 2011
List of Figures Figure 1: Ministry of Agriculture Technical Staff by Gender (June-December 2009).. 10
Figure 2: Age of professional agricultural research and higher education
staff by gender, 2008............................................................................................ 11
Figure 3: Seniority of professional agricultural research and higher education staff by
gender, 2008.......................................................................................................... 12
Figure 4: Female share in total Full Total Equivalent (FTE) research staff by degree
across various agencies in 2008.......................................................................... 13
Figure 5: Discipline-mix of professional agricultural staff in five Kenyan agencies by
gender..................................................................................................................... 14
Figure 6: Share of female students enrolled in and graduating from the Faculties of
Agriculture (JKUAT and University of Nairobi) in 2007................................ 15
Figure 7: Division of labour among family members in rural poultry production in
western Kenya....................................................................................................... 18
Figure 8: What a woman can own in the community...................................................... 20
Figure 9: Control of farm implements in smallholder Irrigation Projects in Mount
Kenya Region in 2008........................................................................................... 20
Figure 10: Ownership and control of farming land........................................................... 21
Figure 11: Ownership patterns of rural poultry in Western Kenya................................ 22
Figure 12: Reasons why it is difficult for women to own land........................................ 25

7 Mugo, Mutwiwa & Miriti: Mapping of Gender Disaggregated Data and Methodologies, February 2011
1 INTRODUCTION
1.1 Background Information The constitution of Kenya (2010) recognizes gender equity as a key right to all women and men, girls and boys in Kenya. Similarly, various development policies, both global and national, recognize gender as a key driver to socio-economic development. Subsequently, the Millennium Development Goals (MDGs) and the Kenyan Vision 2030 single out gender a key pillar in human capital development. A concrete foundation for gender in development in Kenya has been laid by the Sessional Paper No. 2 of 2006, on Gender Equality and Development. In the agricultural sector, equal participation of women and men is acknowledgement as a key determinant of productivity. The Agricultural Sector Development Strategy (ASDS) [2010-2020] recognizes the role of women and men in developing the agricultural sector in Kenya. Beyond all theory, a project implemented by the Ministry of Agriculture and JICA in four regions in Kenya (Smallholder Horticulture Empowerment Programme - SHEP) has demonstrated that empowering both women and men in horticulture can raise productivity through reduction in costs of labor, but also promote social empowerment through reduced conflict and even accelerate economic development through synergy-building among wives and husbands. Following the recognition of gender as a national priority, various Ministries, including Education and Health, have developed gender policies for their sectors, while other ministries have even established Gender Units and Sections to coordinate mainstreaming. Such efforts have even become more imperative under the new constitutional dispensation. However, not all Agricultural Sector Ministries have initiated such mechanisms. Following this, the need to develop a specific Agricultural Sector Gender Policy has been urgently felt. To offer direction for the policy, the Agricultural Sector Coordination Unit (ASCU) conducted mapping of existing gender-disaggregated data and methodologies in Agriculture and Rural Development. 1.2 Terms of Reference 1.2.1 Purpose and Objectives of the Exercise The study aimed at mapping all exiting gender-disaggregated data and methodologies in Agriculture and Rural Development, with the view of identifying bottlenecks to women’s economic empowerment and offering platform for establishment of proactive gender policies and gender mainstreaming frameworks. The specific objectives of the exercise were to: 1. Provide a set of recommendations to the sector on activities that can be financed
under the program with the aim to expand women’s economic empowerment; 2. Provide data which will be a critical input for the agricultural sector gender policy; 3. Allow for the analysis of critical and timely themes on the link between women’s
economic empowerment and development; and 4. Provide the basis for evaluating the impact of the Agriculture Sector Development
Strategy (ASDS) at Midterm and Final review.
8 Mugo, Mutwiwa & Miriti: Mapping of Gender Disaggregated Data and Methodologies, February 2011
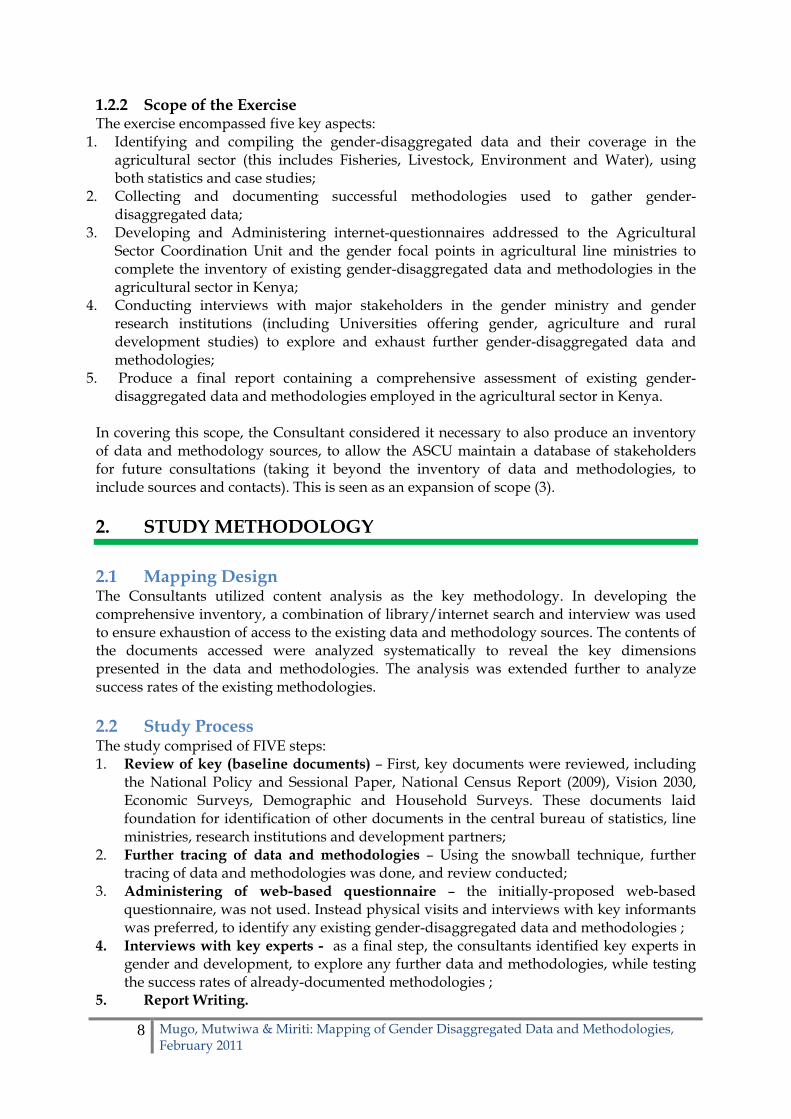
1.2.2 Scope of the Exercise The exercise encompassed five key aspects:
1. Identifying and compiling the gender-disaggregated data and their coverage in the agricultural sector (this includes Fisheries, Livestock, Environment and Water), using both statistics and case studies;
2. Collecting and documenting successful methodologies used to gather gender-disaggregated data;
3. Developing and Administering internet-questionnaires addressed to the Agricultural Sector Coordination Unit and the gender focal points in agricultural line ministries to complete the inventory of existing gender-disaggregated data and methodologies in the agricultural sector in Kenya;
4. Conducting interviews with major stakeholders in the gender ministry and gender research institutions (including Universities offering gender, agriculture and rural development studies) to explore and exhaust further gender-disaggregated data and methodologies;
5. Produce a final report containing a comprehensive assessment of existing gender-disaggregated data and methodologies employed in the agricultural sector in Kenya.
In covering this scope, the Consultant considered it necessary to also produce an inventory of data and methodology sources, to allow the ASCU maintain a database of stakeholders for future consultations (taking it beyond the inventory of data and methodologies, to include sources and contacts). This is seen as an expansion of scope (3). 2. STUDY METHODOLOGY
2.1 Mapping Design The Consultants utilized content analysis as the key methodology. In developing the comprehensive inventory, a combination of library/internet search and interview was used to ensure exhaustion of access to the existing data and methodology sources. The contents of the documents accessed were analyzed systematically to reveal the key dimensions presented in the data and methodologies. The analysis was extended further to analyze success rates of the existing methodologies. 2.2 Study Process The study comprised of FIVE steps: 1. Review of key (baseline documents) – First, key documents were reviewed, including
the National Policy and Sessional Paper, National Census Report (2009), Vision 2030, Economic Surveys, Demographic and Household Surveys. These documents laid foundation for identification of other documents in the central bureau of statistics, line ministries, research institutions and development partners;
2. Further tracing of data and methodologies – Using the snowball technique, further tracing of data and methodologies was done, and review conducted;
3. Administering of web-based questionnaire – the initially-proposed web-based questionnaire, was not used. Instead physical visits and interviews with key informants was preferred, to identify any existing gender-disaggregated data and methodologies ;
4. Interviews with key experts - as a final step, the consultants identified key experts in gender and development, to explore any further data and methodologies, while testing the success rates of already-documented methodologies ;
5. Report Writing.
9 Mugo, Mutwiwa & Miriti: Mapping of Gender Disaggregated Data and Methodologies, February 2011
3. EXISTING GENDER DISAGGREGATED DATA
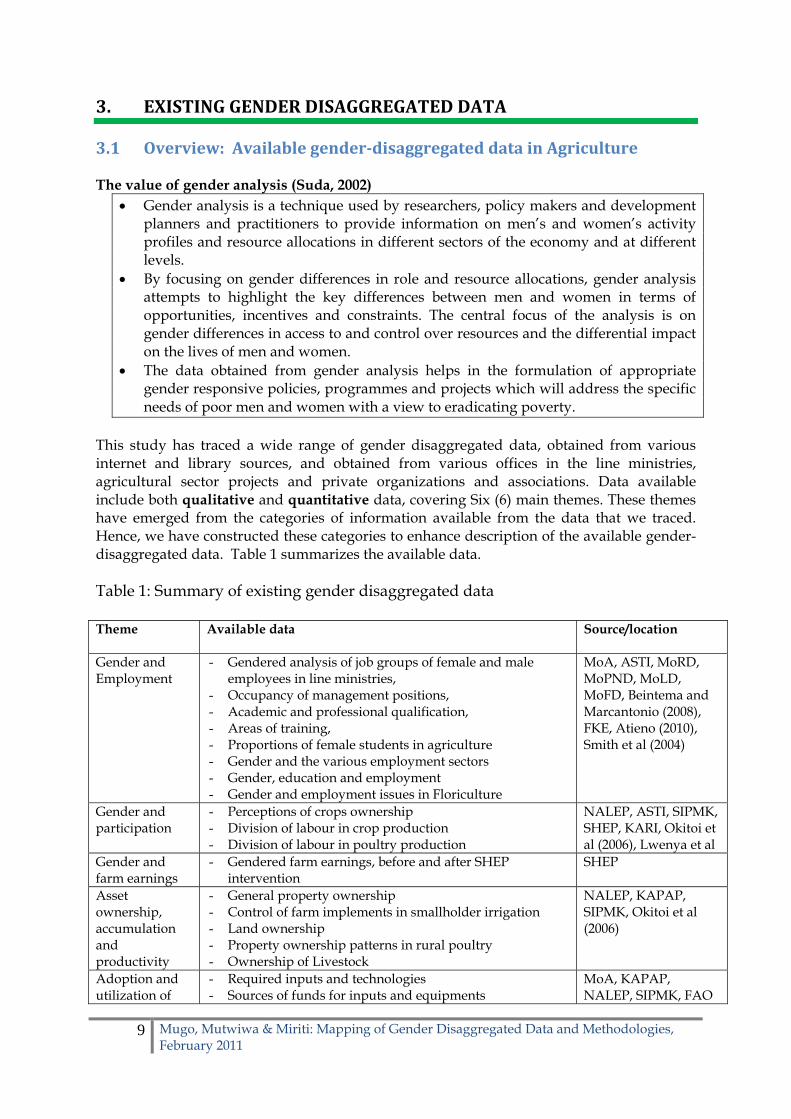
3.1 Overview: Available genderdisaggregated data in Agriculture The value of gender analysis (Suda, 2002)
Gender analysis is a technique used by researchers, policy makers and development planners and practitioners to provide information on men’s and women’s activity profiles and resource allocations in different sectors of the economy and at different levels.
By focusing on gender differences in role and resource allocations, gender analysis attempts to highlight the key differences between men and women in terms of opportunities, incentives and constraints. The central focus of the analysis is on gender differences in access to and control over resources and the differential impact on the lives of men and women.
The data obtained from gender analysis helps in the formulation of appropriate gender responsive policies, programmes and projects which will address the specific needs of poor men and women with a view to eradicating poverty.
This study has traced a wide range of gender disaggregated data, obtained from various internet and library sources, and obtained from various offices in the line ministries, agricultural sector projects and private organizations and associations. Data available include both qualitative and quantitative data, covering Six (6) main themes. These themes have emerged from the categories of information available from the data that we traced. Hence, we have constructed these categories to enhance description of the available gender-disaggregated data. Table 1 summarizes the available data. Table 1: Summary of existing gender disaggregated data Theme
Available data Source/location
Gender and Employment
- Gendered analysis of job groups of female and male employees in line ministries,
- Occupancy of management positions, - Academic and professional qualification, - Areas of training, - Proportions of female students in agriculture - Gender and the various employment sectors - Gender, education and employment - Gender and employment issues in Floriculture
MoA, ASTI, MoRD, MoPND, MoLD, MoFD, Beintema and Marcantonio (2008), FKE, Atieno (2010), Smith et al (2004)
Gender and participation
- Perceptions of crops ownership - Division of labour in crop production - Division of labour in poultry production
NALEP, ASTI, SIPMK, SHEP, KARI, Okitoi et al (2006), Lwenya et al
Gender and farm earnings
- Gendered farm earnings, before and after SHEP intervention
SHEP
Asset ownership, accumulation and productivity
- General property ownership - Control of farm implements in smallholder irrigation - Land ownership - Property ownership patterns in rural poultry - Ownership of Livestock
NALEP, KAPAP, SIPMK, Okitoi et al (2006)
Adoption and utilization of
- Required inputs and technologies - Sources of funds for inputs and equipments
MoA, KAPAP, NALEP, SIPMK, FAO

technologies - Technology adoption in rural poultry - Awareness of extension support services
Causes of gender inequalities
- causes of gender inequalities in forestry - Inhibitors of land ownership by women
FAO, NALEP, KAPAP, SIPMK
The following sections provide a brief overview of the available data. The data are provided as annexes, including the complete documents containing the data.
3.2 Gender and Employment in Agriculture It has been established that a wide range of gender-disaggregated data are available, on the staff placement and mobility in the agricultural sector. Many institutions in the sector are professing awareness of the 30% representation rule, and remarkable progress is being achieved. However, serious gender gaps (in favour of men) are still evident in the sector. Following is a profile of the data obtained by this study. Women representation is wider at lower job groups, and diminishes at the top. Even in the private and research sectors, very few women are in leadership positions. Most women are research assistants and administrators, while men are senior researchers and managers. In the informal sector, data indicate that most women are in unpaid labour, while majority of women are engaged on casual basis, under extremely poor working conditions. Introduction to Job Groups in the Kenyan Civil Service In the civil service, the job groups are arranged alphabetically, from lowest to highest cadre, ranging from A (lowest) to U (highest). Job groups A to H mainly comprise of support staff, J to N is mid-level management, P to T is senior management and U is the highest level i.e. the chief accounting officer.
Figure 1: Ministry of Agriculture Technical Staff by Gender (June-December 2009)
5866
72
100
4234
28
00
20
40
60
80
100
A to H J to N P to T U
Population, %
Job Group
Male Female
Source: Ministry of Agriculture Reports
10 Mugo, Mutwiwa & Miriti: Mapping of Gender Disaggregated Data and Methodologies, February 2011
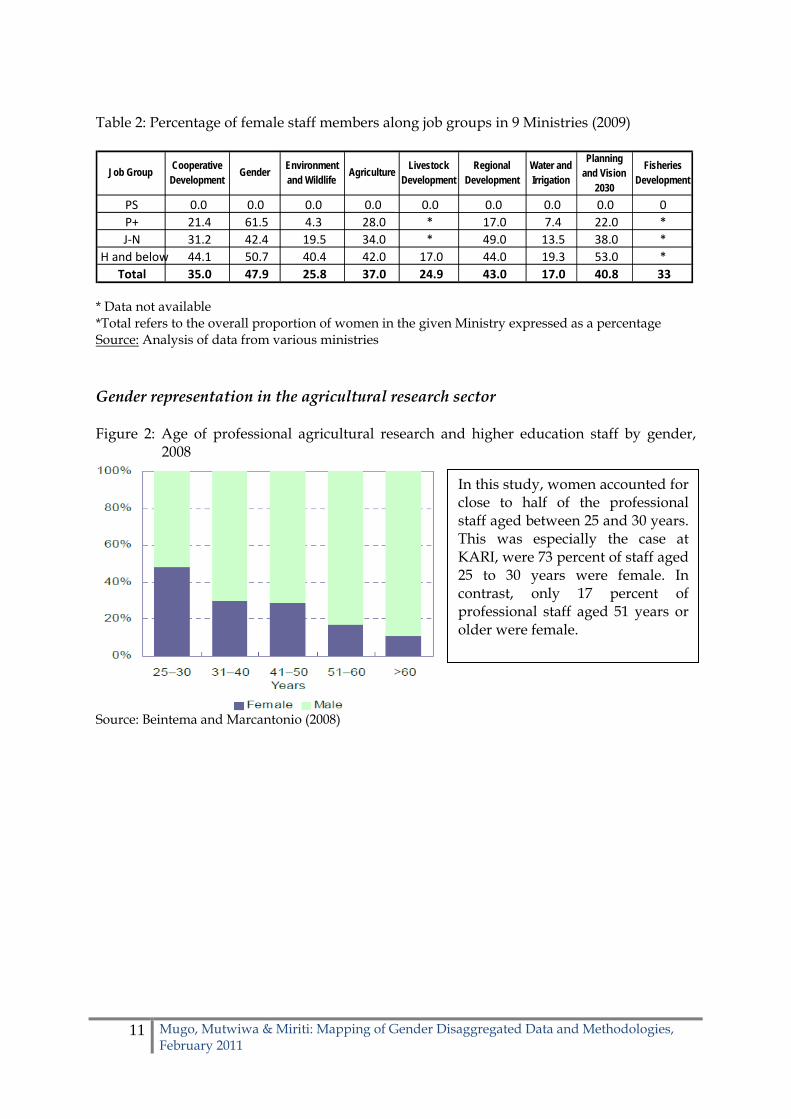
Table 2: Percentage of female staff members along job groups in 9 Ministries (2009)
* Data not available *Total refers to the overall proportion of women in the given Ministry expressed as a percentage Source: Analysis of data from various ministries Gender representation in the agricultural research sector Figure 2: Age of professional agricultural research and higher education staff by gender,
2008
Job Group Cooperative Development
Gender Environmentand Wildlife
AgricultureLivestock
DevelopmentRegional
DevelopmentWater and Irrigation
Planning and Vision
2030
Fisheries Development
PS 0.0 0.0 0.0 0.0 0.0 0.0 0.0 0.0 0
P+ 21.4 61.5 4.3 28.0 * 17.0 7.4 22.0 *
J‐N 31.2 42.4 19.5 34.0 * 49.0 13.5 38.0 *
H and below 44.1 50.7 40.4 42.0 17.0 44.0 19.3 53.0 *
Total 35.0 47.9 25.8 37.0 24.9 43.0 17.0 40.8 33
In this study, women accounted for close to half of the professional staff aged between 25 and 30 years. This was especially the case at KARI, were 73 percent of staff aged 25 to 30 years were female. In contrast, only 17 percent of professional staff aged 51 years or older were female.
Source: Beintema and Marcantonio (2008)
11 Mugo, Mutwiwa & Miriti: Mapping of Gender Disaggregated Data and Methodologies, February 2011
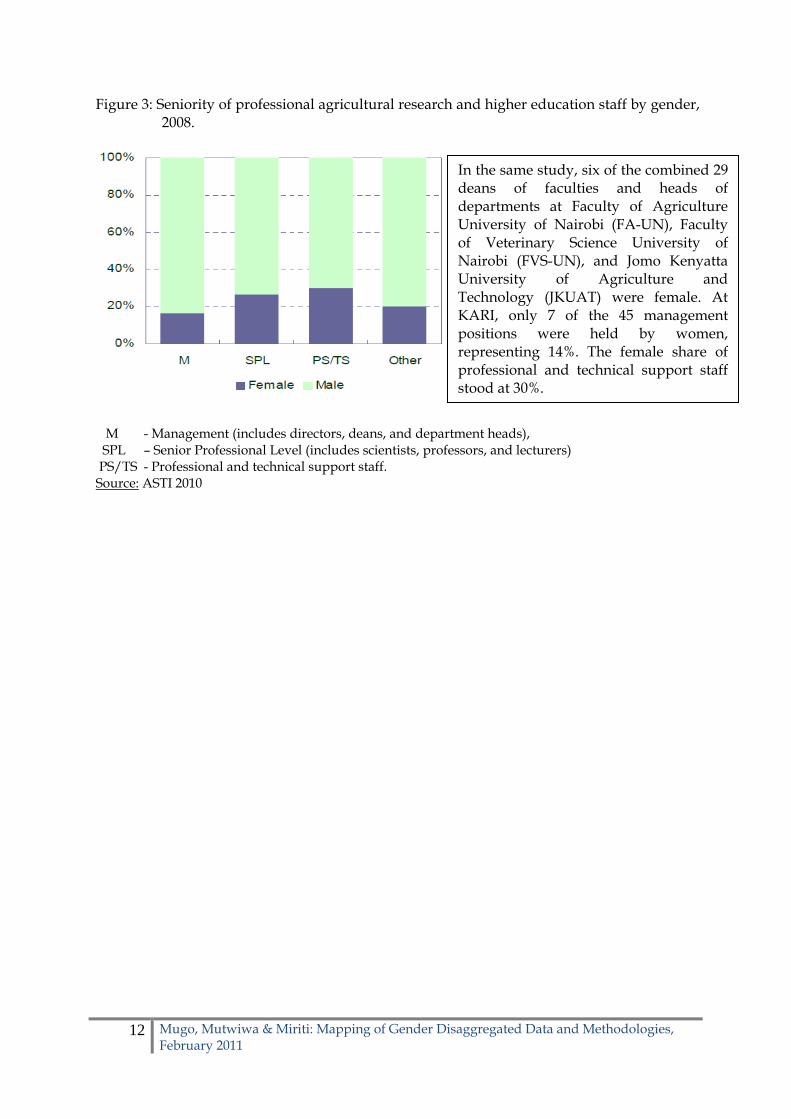
Figure 3: Seniority of professional agricultural research and higher education staff by gender, 2008.
In the same study, six of the combined 29 deans of faculties and heads of departments at Faculty of Agriculture University of Nairobi (FA-UN), Faculty of Veterinary Science University of Nairobi (FVS-UN), and Jomo Kenyatta University of Agriculture and Technology (JKUAT) were female. At KARI, only 7 of the 45 management positions were held by women, representing 14%. The female share of professional and technical support staff stood at 30%.
M - Management (includes directors, deans, and department heads), SPL – Senior Professional Level (includes scientists, professors, and lecturers) PS/TS - Professional and technical support staff. Source: ASTI 2010
12 Mugo, Mutwiwa & Miriti: Mapping of Gender Disaggregated Data and Methodologies, February 2011

Academic qualification of male and female researchers Figure 4: Female share in total Full Total Equivalent (FTE) research staff by degree across
various agencies in 2008
According to Beintema and Marcantonio (2008), KIRDI employed the highest share of female researchers, at 39%, but none of these researchers held PhD degrees. At KARI, 30% of the researchers were female, and among them, 9% held PhD degrees, 16% held MSc degrees, and 4% held BSc degrees. In contrast, only 9% of researchers at the other universities (as a combined average) were female, but almost all of them were PhD qualified.
Source: ASTI, 2010 Table 3: Staffing Statistics at the Faculty of Agriculture, Egerton University DESIGNATION QUALIFICATION GENDER TOTAL F M 1 Professors Doctorate - 7 7 2 Associate Professors Doctorate 2 12 14 3 Senior Lecturer Doctorate 7 21 28 4 Lecturer Doctorate 2 16 18 5 Lecturer Masters 8 29 37 6 Assistant Lecturer Masters 3 6 9 7 Chief Technologist Master - 2 2 7 Chief Technologist HND 1 4 5 8 Chief Technologist Diploma - 2 4 9. Senior Technologist BSc 4 9 13 10 Technician Diploma 1 4 5 11 Technician Certificate 1 2 3 Total 29 114 143 Source: Statistics from Faculty of Agriculture, Egerton University, February 2011
13 Mugo, Mutwiwa & Miriti: Mapping of Gender Disaggregated Data and Methodologies, February 2011
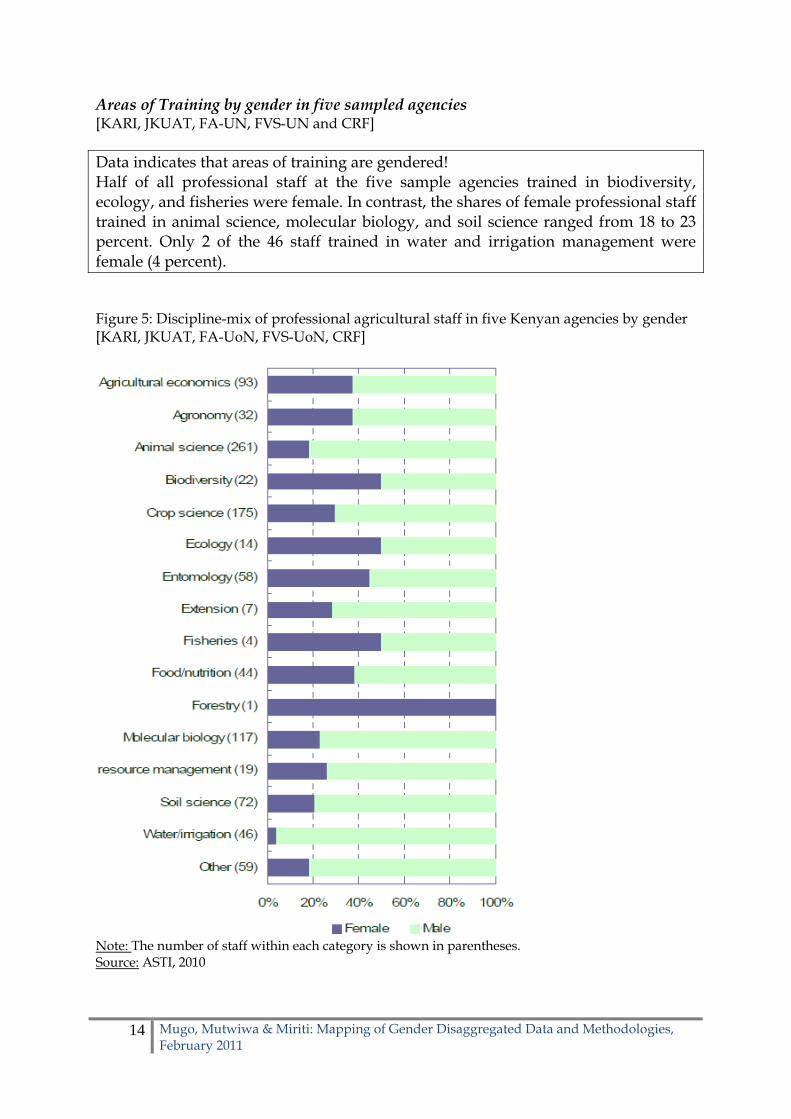
Areas of Training by gender in five sampled agencies [KARI, JKUAT, FA-UN, FVS-UN and CRF] Data indicates that areas of training are gendered! Half of all professional staff at the five sample agencies trained in biodiversity, ecology, and fisheries were female. In contrast, the shares of female professional staff trained in animal science, molecular biology, and soil science ranged from 18 to 23 percent. Only 2 of the 46 staff trained in water and irrigation management were female (4 percent). Figure 5: Discipline-mix of professional agricultural staff in five Kenyan agencies by gender [KARI, JKUAT, FA-UoN, FVS-UoN, CRF]
Note: The number of staff within each category is shown in parentheses. Source: ASTI, 2010
14 Mugo, Mutwiwa & Miriti: Mapping of Gender Disaggregated Data and Methodologies, February 2011
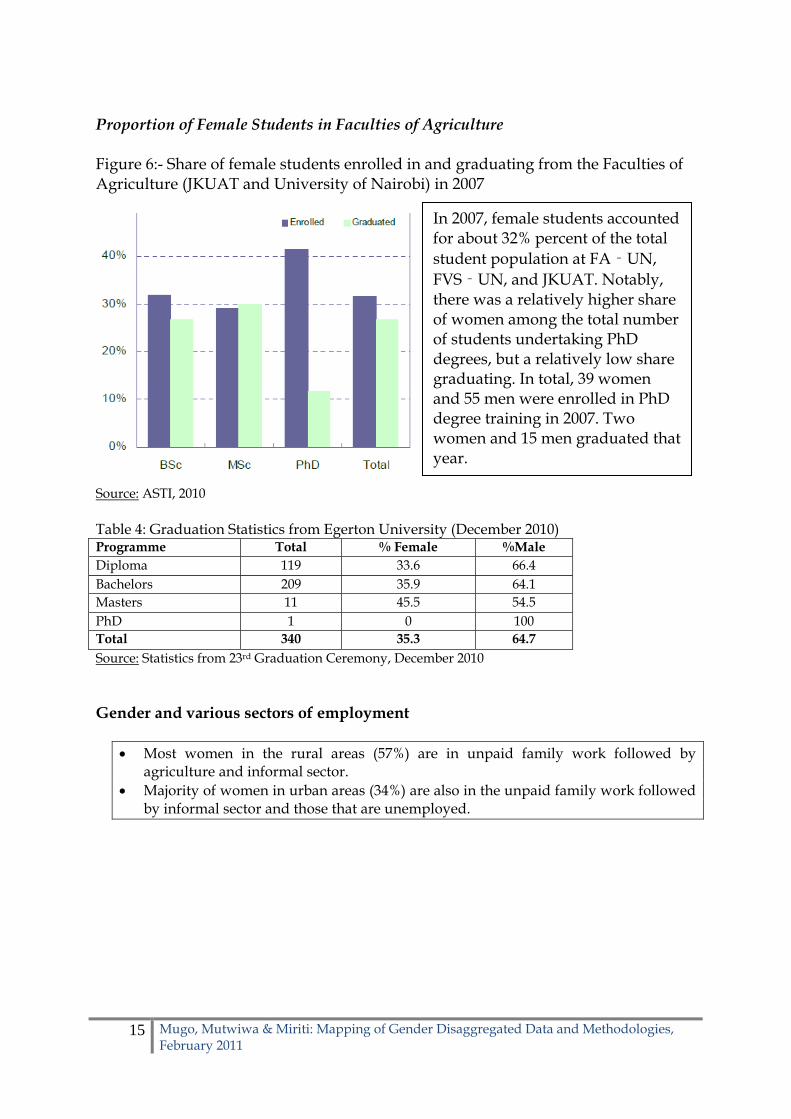
Proportion of Female Students in Faculties of Agriculture Figure 6:- Share of female students enrolled in and graduating from the Faculties of Agriculture (JKUAT and University of Nairobi) in 2007
In 2007, female students accounted for about 32% percent of the total student population at FA‐UN, FVS‐UN, and JKUAT. Notably, there was a relatively higher share of women among the total number of students undertaking PhD degrees, but a relatively low share graduating. In total, 39 women and 55 men were enrolled in PhD degree training in 2007. Two women and 15 men graduated that year.
Source: ASTI, 2010 Table 4: Graduation Statistics from Egerton University (December 2010) Programme Total % Female %Male Diploma 119 33.6 66.4 Bachelors 209 35.9 64.1 Masters 11 45.5 54.5 PhD 1 0 100 Total 340 35.3 64.7 Source: Statistics from 23rd Graduation Ceremony, December 2010 Gender and various sectors of employment
Most women in the rural areas (57%) are in unpaid family work followed by agriculture and informal sector.
Majority of women in urban areas (34%) are also in the unpaid family work followed by informal sector and those that are unemployed.
15 Mugo, Mutwiwa & Miriti: Mapping of Gender Disaggregated Data and Methodologies, February 2011
16 Mugo, Mutwiwa & Miriti: Mapping of Gender Disaggregated Data and Methodologies, February 2011
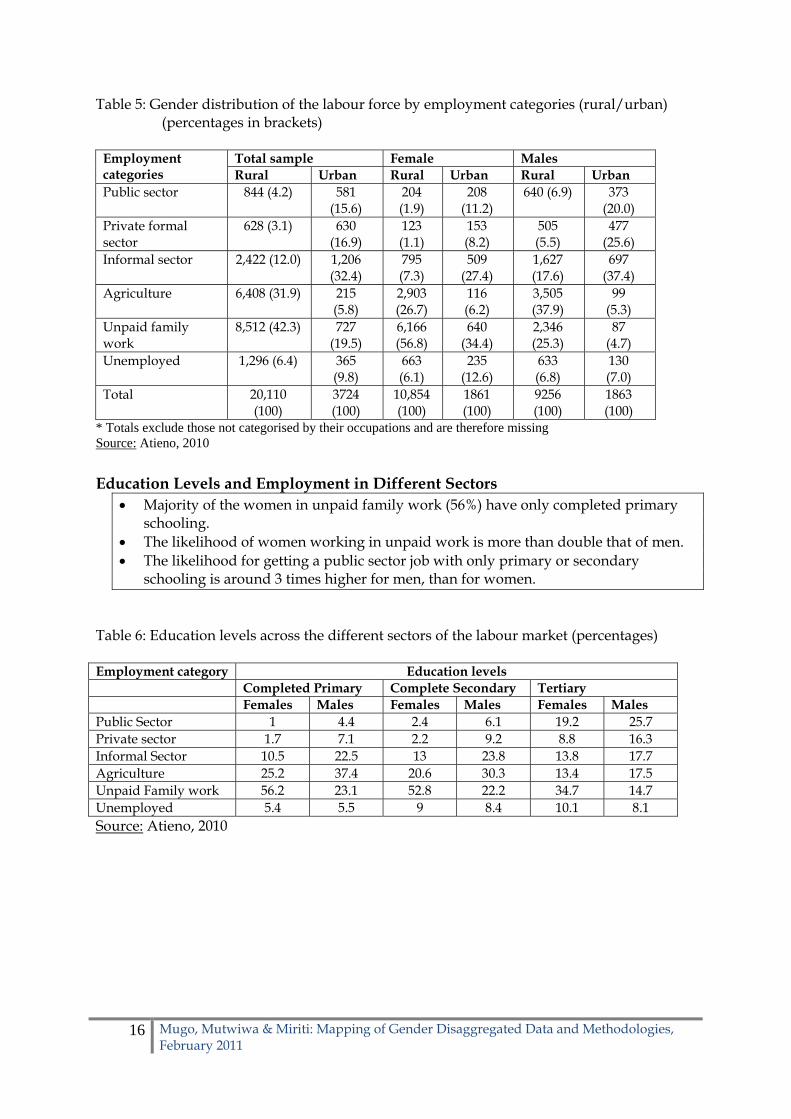
Table 5: Gender distribution of the labour force by employment categories (rural/urban) (percentages in brackets)
Total sample Female Males Employment
categories Rural Urban Rural Urban Rural Urban Public sector 844 (4.2) 581
(15.6) 204 (1.9)
208 (11.2)
640 (6.9) 373 (20.0)
Private formal sector
628 (3.1) 630 (16.9)
123 (1.1)
153 (8.2)
505 (5.5)
477 (25.6)
Informal sector 2,422 (12.0) 1,206 (32.4)
795 (7.3)
509 (27.4)
1,627 (17.6)
697 (37.4)
Agriculture 6,408 (31.9) 215 (5.8)
2,903 (26.7)
116 (6.2)
3,505 (37.9)
99 (5.3)
Unpaid family work
8,512 (42.3) 727 (19.5)
6,166 (56.8)
640 (34.4)
2,346 (25.3)
87 (4.7)
Unemployed 1,296 (6.4) 365 (9.8)
663 (6.1)
235 (12.6)
633 (6.8)
130 (7.0)
Total 20,110 (100)
3724 (100)
10,854 (100)
1861 (100)
9256 (100)
1863 (100)
* Totals exclude those not categorised by their occupations and are therefore missing Source: Atieno, 2010
Education Levels and Employment in Different Sectors Majority of the women in unpaid family work (56%) have only completed primary
schooling. The likelihood of women working in unpaid work is more than double that of men. The likelihood for getting a public sector job with only primary or secondary
schooling is around 3 times higher for men, than for women. Table 6: Education levels across the different sectors of the labour market (percentages) Employment category Education levels Completed Primary Complete Secondary Tertiary Females Males Females Males Females Males Public Sector 1 4.4 2.4 6.1 19.2 25.7 Private sector 1.7 7.1 2.2 9.2 8.8 16.3 Informal Sector 10.5 22.5 13 23.8 13.8 17.7 Agriculture 25.2 37.4 20.6 30.3 13.4 17.5 Unpaid Family work 56.2 23.1 52.8 22.2 34.7 14.7 Unemployed 5.4 5.5 9 8.4 10.1 8.1 Source: Atieno, 2010

17 Mugo, Mutwiwa & Miriti: Mapping of Gender Disaggregated Data and Methodologies, February 2011
Employment in the Floriculture: Gender Issues (Smith, S. et al, 2004) Seventy five per cent of the employment in the cut flower industry is female, and
over 65 percent of the total employment numbers are employed in temporary, seasonal, or casual basis.
Legally, Kenyan employers are required to promote casual or temporary workers to permanent status after eight months, but they are often found returning year after year on a renewed temporary contract. Women in particular suffer from this legal loophole as a result of gender discrimination in Kenyan employment embedded in social norms that consider women more compliant and better suited to certain types of horticultural work (such as picking and packing), coupled with perceptions that women’s income is supplementary, rather than central, to household well-being.
The vulnerability of such non-permanent employment also leads to links with other unethical conditions, such as the obligation to work overtime (often excessively so) as a condition of employment, miscalculated wages, or dismissal or lack of contract extension due to pregnancy. The latter form of gender discrimination contravenes most codes, and yet appears to be common practice. In the area of sick pay, medical care and childcare, women are further disadvantaged as these are typically not covered by codes. Non-permanent employees were also found to be more prone to verbal and occasional physical abuse, dismissal without just cause, wages being docked as a disciplinary measure, corruption and favouritism. Fear of non-renewal of their contracts prevented complaints, and with women being under represented in both trade unions and workers committees, avenues for addressing these fears are limited or non-existent.
Despite positive steps taken by producers in the wake of the ethical trade advocacy by NGOs and movements such as the Ethical Trade Initiative, problems persist for female flower workers through both a lack of comprehensive social chapters within the codes that address the gendered nature of employment inequalities in the industry, and the lack of proper implementation of those relevant codes that do exist.
3.3 Gender and Participation in Agriculture Perception of crop ownership The evaluation reports of the Smallholder Horticulture Empowerment Project (SHEP), a project implemented by JICA and Ministry of Agriculture, indicate the gendering of crops grown in 4 districts: Kisii, Nyandarua, Trans Nzoia and Bungoma. Table 7: Perceptions of crop ownership in Kisii, Nyandarua, Transnzoia and Bungoma
Crops for Women Crops for men Sorghum, bananas, vegetables and other horticulture crops
Tea, maize, coffee, pyrethrum
Source: SHEP Report, JICA 2010

Basically, the crops for women1 involved mostly those that are consumed in the household, while crops for men involved mostly the larger scale cash crops that usually brought higher incomes. Similarly, work done by women involved mostly planting and weeding, and other roles that involved more bending, while men did mostly land preparation and spraying. Division of labour in crop farming Table 8: Division of labour in the crop farming Task Male Female Ploughing 55 45 Weeding 49 51 Harvesting 51 49 Marketing 53 47 All processes 47 53
A study by NALEP (2010) indicates that division of labour in crop farming is influenced by gender. More women are involved in light duties like weeding while men are involved in heavier tasks like ploughing, harvesting and marketing. However female famers dominate in all processes.
Source: NALEP, 2010 The study further indicates that there are specific duties for males and females in different enterprises (livestock farming, fish farming. Division of labour in rural poultry production Figure 7: Division of labour among family members in rural poultry production in western
Kenya
Secondly, another set of data indicates division of labour among family members in rural poultry production in Western Kenya. Participation in selling eggs and consumption of eggs is predominantly for women. Men and children mainly do construction of poultry sheds. Women mainly do cleaning, feeding and treatment of rural poultry.
Source: Okitoi et al, 2006
1 This denotes crops that should be grown by women, and also taken to the market by women
18 Mugo, Mutwiwa & Miriti: Mapping of Gender Disaggregated Data and Methodologies, February 2011
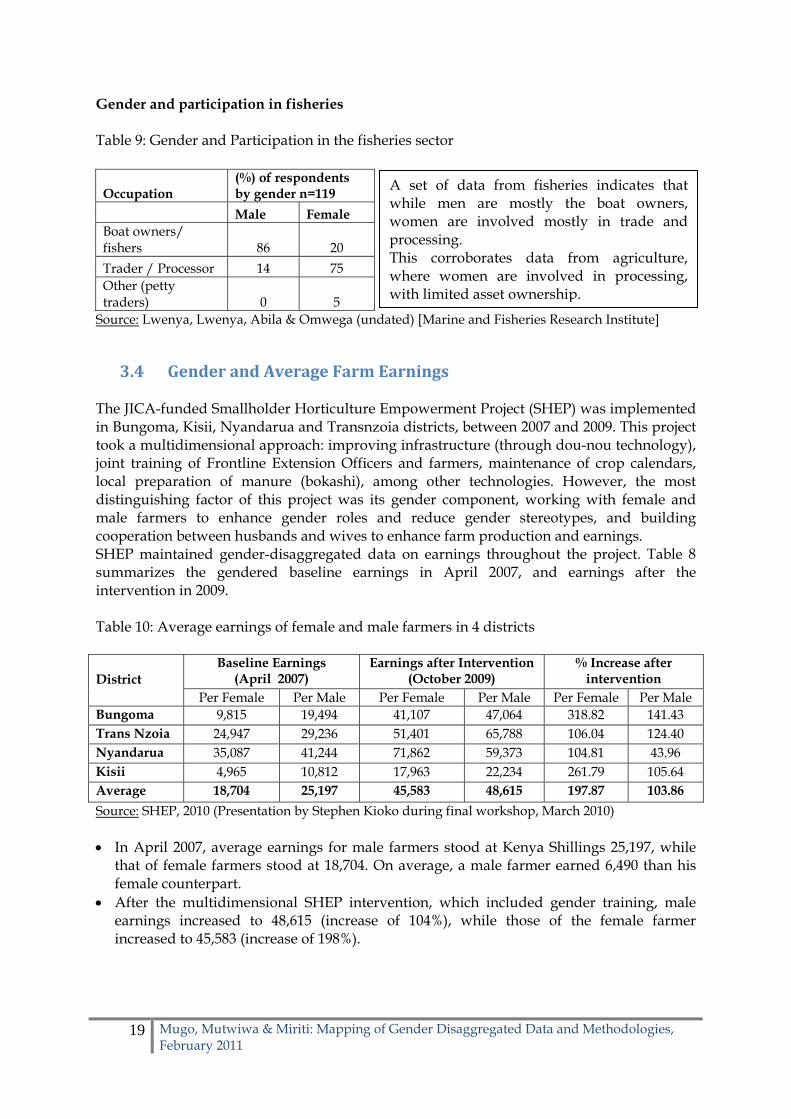
Gender and participation in fisheries Table 9: Gender and Participation in the fisheries sector
Occupation
(%) of respondents by gender n=119
Male Female Boat owners/ fishers 86 20
Trader / Processor 14 75 Other (petty traders) 0 5
A set of data from fisheries indicates that while men are mostly the boat owners, women are involved mostly in trade and processing. This corroborates data from agriculture, where women are involved in processing, with limited asset ownership.
Source: Lwenya, Lwenya, Abila & Omwega (undated) [Marine and Fisheries Research Institute]
3.4 Gender and Average Farm Earnings The JICA-funded Smallholder Horticulture Empowerment Project (SHEP) was implemented in Bungoma, Kisii, Nyandarua and Transnzoia districts, between 2007 and 2009. This project took a multidimensional approach: improving infrastructure (through dou-nou technology), joint training of Frontline Extension Officers and farmers, maintenance of crop calendars, local preparation of manure (bokashi), among other technologies. However, the most distinguishing factor of this project was its gender component, working with female and male farmers to enhance gender roles and reduce gender stereotypes, and building cooperation between husbands and wives to enhance farm production and earnings. SHEP maintained gender-disaggregated data on earnings throughout the project. Table 8 summarizes the gendered baseline earnings in April 2007, and earnings after the intervention in 2009. Table 10: Average earnings of female and male farmers in 4 districts
Baseline Earnings (April 2007)
Earnings after Intervention (October 2009)
% Increase after intervention
District
Per Female Per Male Per Female Per Male Per Female Per Male Bungoma 9,815 19,494 41,107 47,064 318.82 141.43 Trans Nzoia 24,947 29,236 51,401 65,788 106.04 124.40 Nyandarua 35,087 41,244 71,862 59,373 104.81 43.96 Kisii 4,965 10,812 17,963 22,234 261.79 105.64 Average 18,704 25,197 45,583 48,615 197.87 103.86
Source: SHEP, 2010 (Presentation by Stephen Kioko during final workshop, March 2010) In April 2007, average earnings for male farmers stood at Kenya Shillings 25,197, while
that of female farmers stood at 18,704. On average, a male farmer earned 6,490 than his female counterpart.
After the multidimensional SHEP intervention, which included gender training, male earnings increased to 48,615 (increase of 104%), while those of the female farmer increased to 45,583 (increase of 198%).
19 Mugo, Mutwiwa & Miriti: Mapping of Gender Disaggregated Data and Methodologies, February 2011
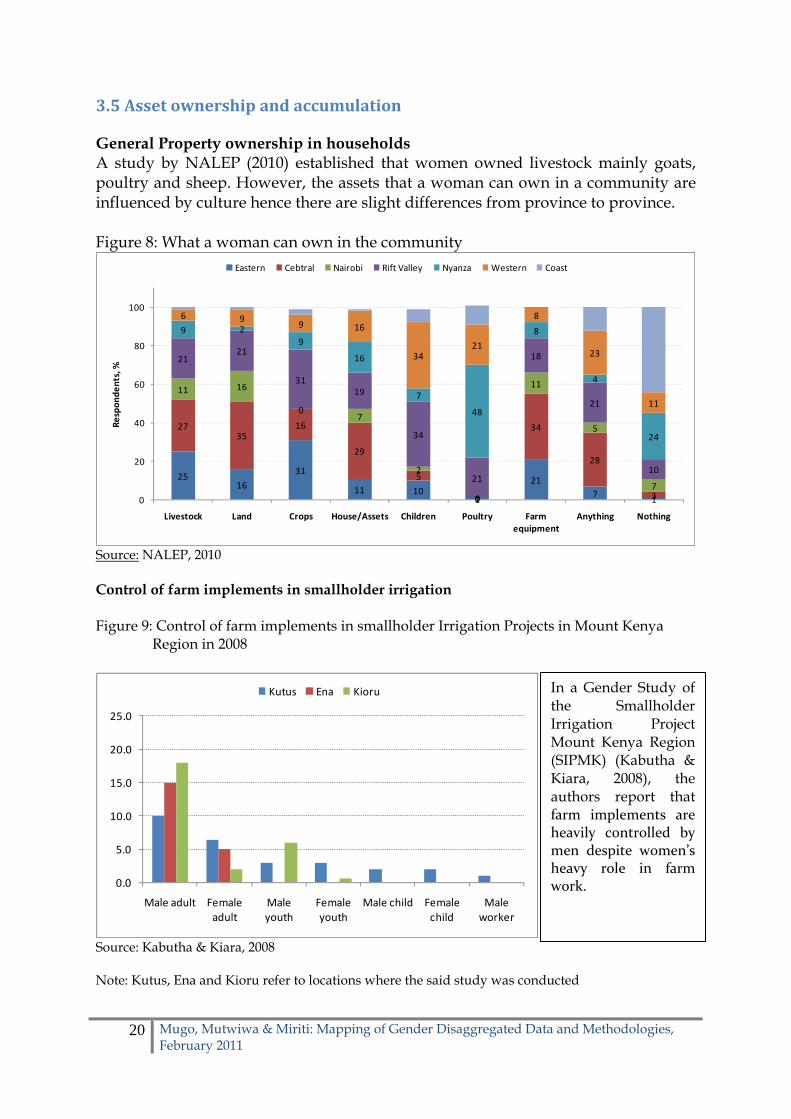
3.5 Asset ownership and accumulation General Property ownership in households A study by NALEP (2010) established that women owned livestock mainly goats, poultry and sheep. However, the assets that a woman can own in a community are influenced by culture hence there are slight differences from province to province. Figure 8: What a woman can own in the community
2516
31
11 101
21
71
2735
16
29
5
0
34
28
3
11 16
07
2
0
11
5
7
2121
3119
34
21
18
21
10
9 2
9
16
7
48
8
4
24
6 99 16
3421
8
23
11
0
20
40
60
80
100
Livestock Land Crops House/Assets Children Poultry Farm equipment
Anything Nothing
Respondents, %
Eastern Cebtral Nairobi Rift Valley Nyanza Western Coast
Source: NALEP, 2010 Control of farm implements in smallholder irrigation Figure 9: Control of farm implements in smallholder Irrigation Projects in Mount Kenya
Region in 2008
0.0
5.0
10.0
15.0
20.0
25.0
Male adult Female adult
Male youth
Female youth
Male child Female child
Male worker
Kutus Ena Kioru
In a Gender Study of the Smallholder Irrigation Project Mount Kenya Region (SIPMK) (Kabutha & Kiara, 2008), the authors report that farm implements are heavily controlled by men despite women’s heavy role in farm work.
Source: Kabutha & Kiara, 2008 Note: Kutus, Ena and Kioru refer to locations where the said study was conducted
20 Mugo, Mutwiwa & Miriti: Mapping of Gender Disaggregated Data and Methodologies, February 2011
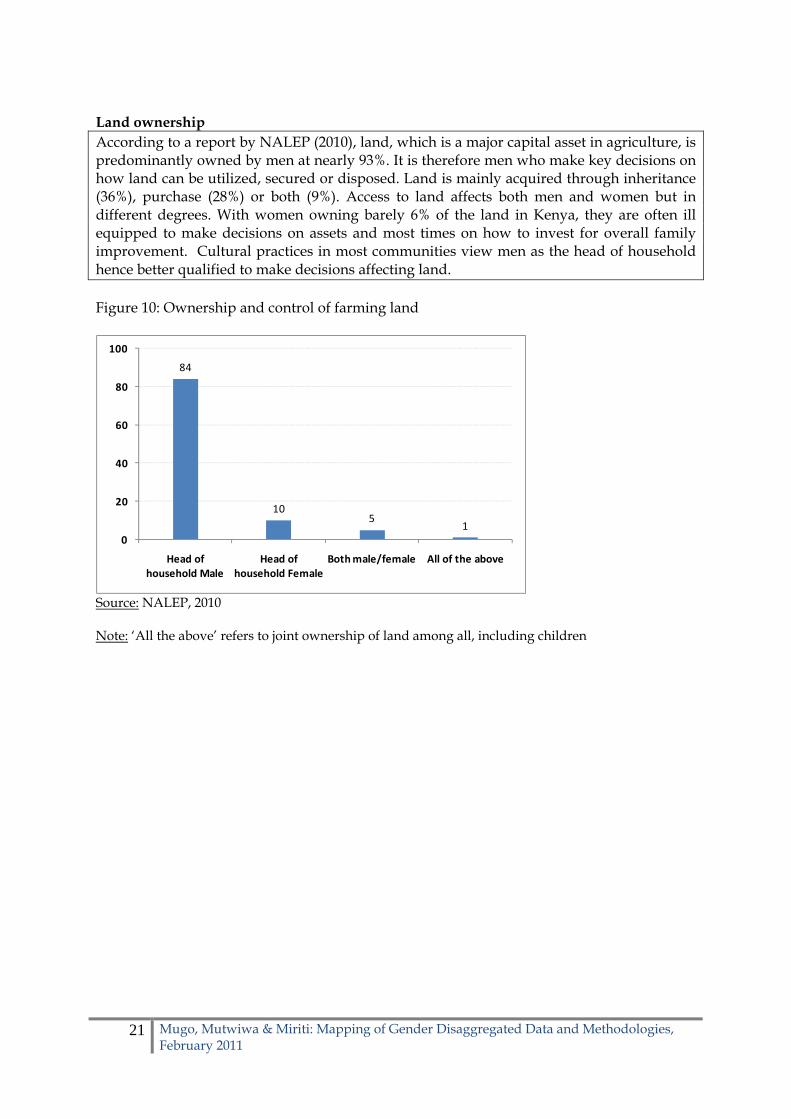
Land ownership According to a report by NALEP (2010), land, which is a major capital asset in agriculture, is predominantly owned by men at nearly 93%. It is therefore men who make key decisions on how land can be utilized, secured or disposed. Land is mainly acquired through inheritance (36%), purchase (28%) or both (9%). Access to land affects both men and women but in different degrees. With women owning barely 6% of the land in Kenya, they are often ill equipped to make decisions on assets and most times on how to invest for overall family improvement. Cultural practices in most communities view men as the head of household hence better qualified to make decisions affecting land. Figure 10: Ownership and control of farming land
84
105
10
20
40
60
80
100
Head of household Male
Head of household Female
Both male/female All of the above
Source: NALEP, 2010 Note: ‘All the above’ refers to joint ownership of land among all, including children
21 Mugo, Mutwiwa & Miriti: Mapping of Gender Disaggregated Data and Methodologies, February 2011
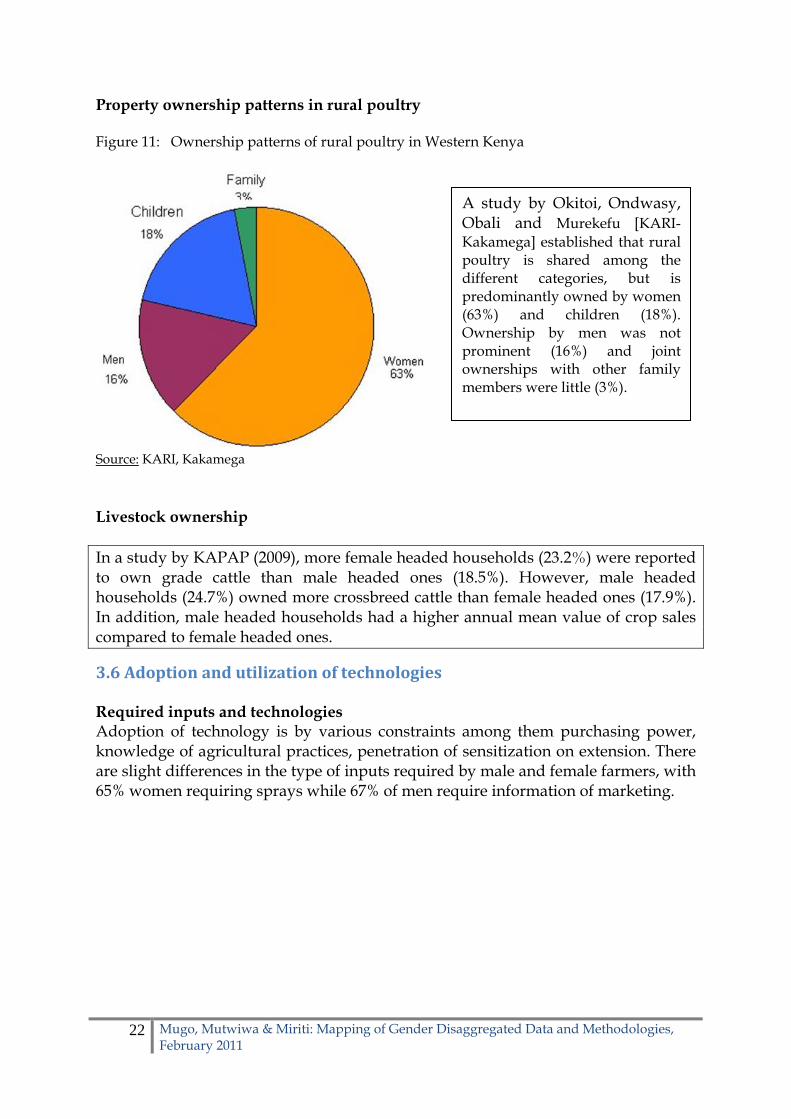
Property ownership patterns in rural poultry Figure 11: Ownership patterns of rural poultry in Western Kenya
A study by Okitoi, Ondwasy, Obali and Murekefu [KARI-Kakamega] established that rural poultry is shared among the different categories, but is predominantly owned by women (63%) and children (18%). Ownership by men was not prominent (16%) and joint ownerships with other family members were little (3%).
Source: KARI, Kakamega Livestock ownership In a study by KAPAP (2009), more female headed households (23.2%) were reported to own grade cattle than male headed ones (18.5%). However, male headed households (24.7%) owned more crossbreed cattle than female headed ones (17.9%). In addition, male headed households had a higher annual mean value of crop sales compared to female headed ones.
3.6 Adoption and utilization of technologies Required inputs and technologies Adoption of technology is by various constraints among them purchasing power, knowledge of agricultural practices, penetration of sensitization on extension. There are slight differences in the type of inputs required by male and female farmers, with 65% women requiring sprays while 67% of men require information of marketing.
22 Mugo, Mutwiwa & Miriti: Mapping of Gender Disaggregated Data and Methodologies, February 2011
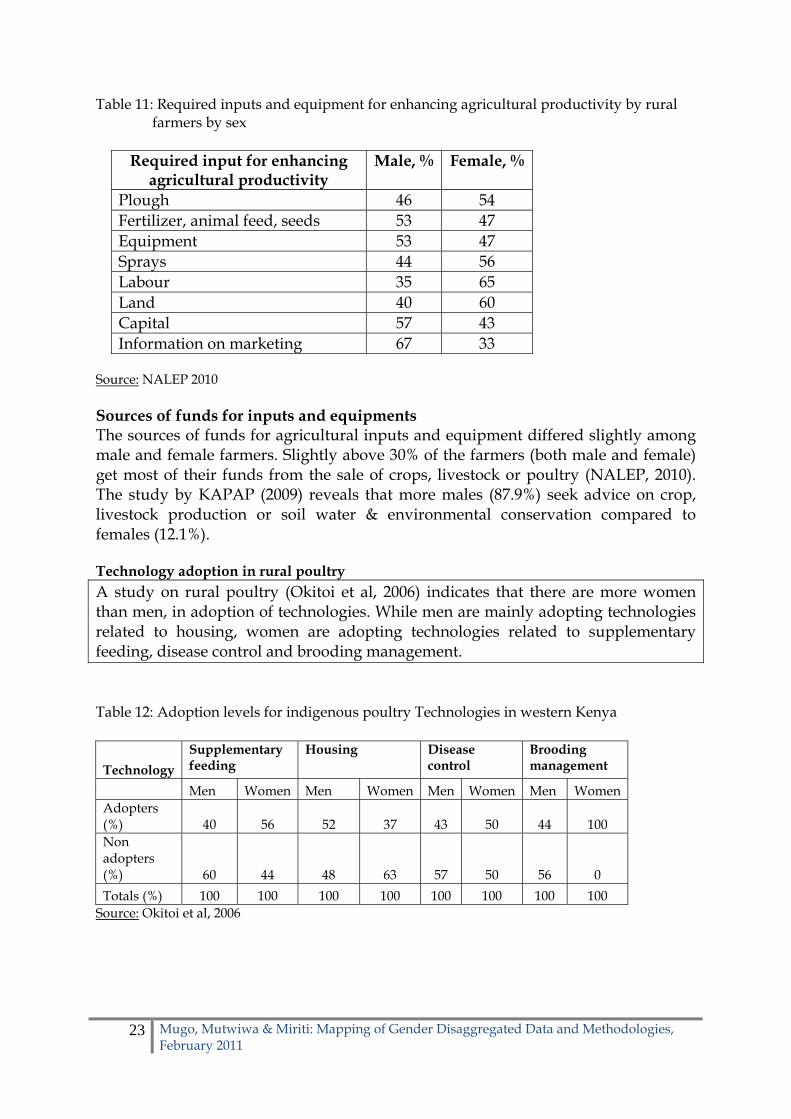
Table 11: Required inputs and equipment for enhancing agricultural productivity by rural farmers by sex
Required input for enhancing agricultural productivity
Male, % Female, %
Plough 46 54 Fertilizer, animal feed, seeds 53 47 Equipment 53 47 Sprays 44 56 Labour 35 65 Land 40 60 Capital 57 43 Information on marketing 67 33
Source: NALEP 2010 Sources of funds for inputs and equipments The sources of funds for agricultural inputs and equipment differed slightly among male and female farmers. Slightly above 30% of the farmers (both male and female) get most of their funds from the sale of crops, livestock or poultry (NALEP, 2010). The study by KAPAP (2009) reveals that more males (87.9%) seek advice on crop, livestock production or soil water & environmental conservation compared to females (12.1%). Technology adoption in rural poultry A study on rural poultry (Okitoi et al, 2006) indicates that there are more women than men, in adoption of technologies. While men are mainly adopting technologies related to housing, women are adopting technologies related to supplementary feeding, disease control and brooding management. Table 12: Adoption levels for indigenous poultry Technologies in western Kenya
Technology
Supplementary feeding
Housing Disease control
Brooding management
Men Women Men Women Men Women Men Women Adopters (%) 40 56 52 37 43 50 44 100 Non adopters (%) 60 44 48 63 57 50 56 0
Totals (%) 100 100 100 100 100 100 100 100 Source: Okitoi et al, 2006
23 Mugo, Mutwiwa & Miriti: Mapping of Gender Disaggregated Data and Methodologies, February 2011
24 Mugo, Mutwiwa & Miriti: Mapping of Gender Disaggregated Data and Methodologies, February 2011
Awareness of extension support services Awareness of extension services is well balanced among male and female farmers. However, slightly more than half (52%) of the farmers who have access to extension services are men. Gender disaggregated data on the reason for the low interaction with staff is available from NALEP, (2010).
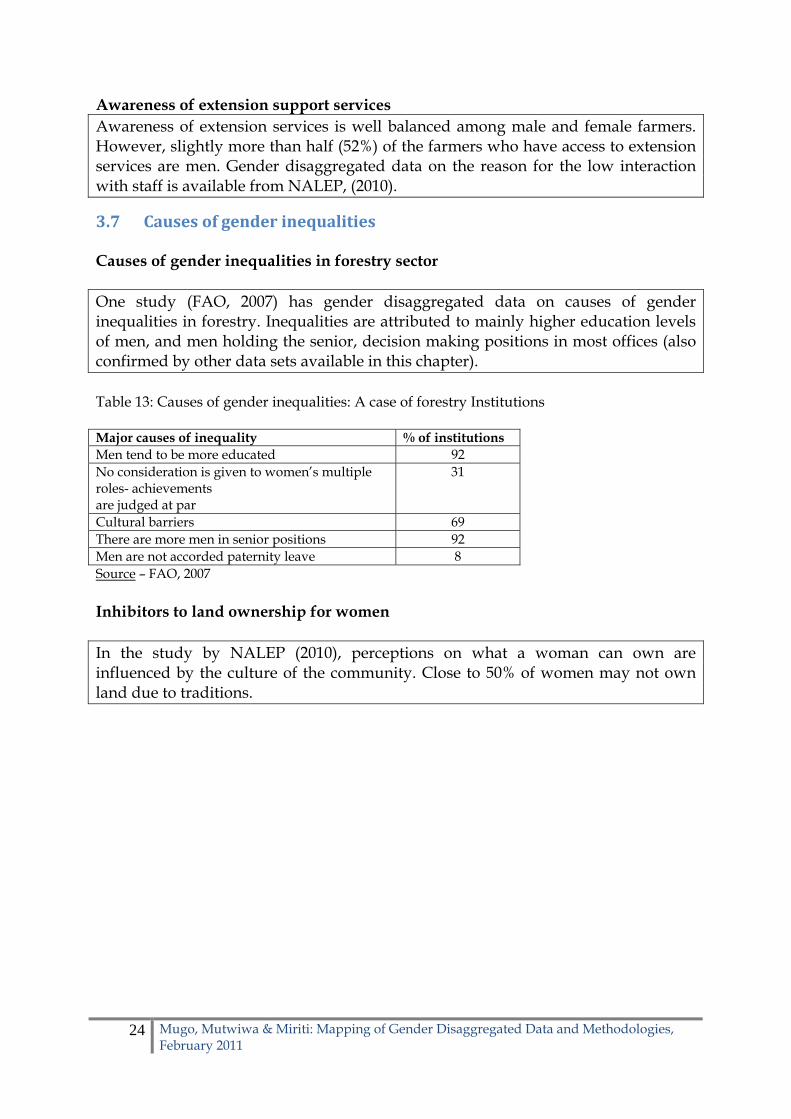
3.7 Causes of gender inequalities Causes of gender inequalities in forestry sector One study (FAO, 2007) has gender disaggregated data on causes of gender inequalities in forestry. Inequalities are attributed to mainly higher education levels of men, and men holding the senior, decision making positions in most offices (also confirmed by other data sets available in this chapter). Table 13: Causes of gender inequalities: A case of forestry Institutions Major causes of inequality % of institutions Men tend to be more educated 92 No consideration is given to women’s multiple roles- achievements are judged at par
31
Cultural barriers 69 There are more men in senior positions 92 Men are not accorded paternity leave 8 Source – FAO, 2007 Inhibitors to land ownership for women In the study by NALEP (2010), perceptions on what a woman can own are influenced by the culture of the community. Close to 50% of women may not own land due to traditions.

Figure 12: Reasons why it is difficult for women to own land
1
1
1
52
46
0 10 20 30 40 50 60
They don't have interest/skills to purchase land
Women are not aggressive
Change of technology
Purchase of land is expensive and women do not have money
Traditions do not allow women to inherit land
Source: NALEP 2010
25 Mugo, Mutwiwa & Miriti: Mapping of Gender Disaggregated Data and Methodologies, February 2011

26 Mugo, Mutwiwa & Miriti: Mapping of Gender Disaggregated Data and Methodologies, February 2011
4. METHODOLOGIES FOR GENDER DISAGGREGATED DATA
4.1 Overview The study has established a variety of methodologies that have been used to collect gender-disaggregated data in agriculture. Eight (8) methodologies have been documented, namely:
1. Secondary review 2. Daily activity calendar 3. Questionnaires and inventory surveys 4. In-depth interview 5. Key informant interview 6. Focus Group Discussions 7. Local histories, timelines and life history traces 8. Participatory Rural Appraisal (PRA)/Stages of Progress (SoP)
4.2 Secondary Review Several studies have utilized analysis of archival data from the Kenya National Archives, and review of documentations, reports and publications. Related to this, some studies have emphasized collection of records (farm records kept by men and women; attendance and leadership records of farmer groups, etc) from the field, and using these as ingredients for deep secondary reviews.
4.3 Daily Activity Calendar
The Daily Activity Calendar (DAC) was utilized by the SHEP project to understand variances between activities of men and women in the target districts. This emerged as a powerful tool in understanding power relations, indicated by how women and men spent their time every day. This in turn formed basis for gender mainstreaming training.
4.4 Questionnaires and Inventory Surveys This methodology has been utilized in almost all the studies documented in this analysis. It is argued that questionnaires and inventories are preferred for various reasons: They are able collect data from larger samples within limited timeframe They are good for generating statistical data Farmers and staff members are able to give personal and confidential information, due
to the anonymous nature of the tools Data gathered through these tools are easy to analyze, using various statistical analysis
software. However, some arguments have been raised against the questionnaire in generating
gender disaggregated data in agriculture: Most farmer populations, especially women, are non-literate, and questionnaires have
to be administered by researchers; The provision of choices, through closed-ended questions, limits generation of in-depth
data The focus on quantifying responses trivializes responses in extremes, as concentration is
laid on means and percentages.
27 Mugo, Mutwiwa & Miriti: Mapping of Gender Disaggregated Data and Methodologies, February 2011
Good practice in use of questionnaire Administer the questionnaire personally for higher response rates Create reasonable balance between open and closed-ended questions Combine the questionnaire with other methods for generation of in-depth data 4.5 In-depth Interview In some studies, in-depth interviews have been used to generate data from both male and female heads of households. Questions in these interviews target personal narratives and experiences. In-depth interviews are valuable because they give a good understanding of important gender and energy issues. An example is a household energy poverty assessment. In such an assessment, interviews are held with the various household members. In relation to gender, this means you have to ensure that women’s voices are heard. Therefore, it is best to interview the women separately from the men whenever possible. One way of achieving this is to interview the man and the woman from the same household simultaneously, using two interviewers. If women and men are interviewed together, women can be culturally constrained from speaking. It is also important to realise that there are different types of households. Some are man-headed, some are woman-headed and increasingly there are child-headed households. Woman-headed households might have different levels, of energy poverty, needs, opinions, etc. The same goes for poor and wealthy women, educated and uneducated women, etc. To get a good overview of the situation (and to assure the quality of your interviews) you need to interview a representative sample of the population you want to address with your project. The size of this sample depends on the situation, but you should at least interview two or three people from each identified subgroup in the population.
4.6 Key Informant Interview Interviewing is a commonly used way to gather information for a project proposal. Interviews usually give more detailed and specific information than just statistical data. An interview is a good tool to gather qualitative information. Interviewing is not as easy or straightforward as some people think: it is much more than just asking some predefined questions. Before, during and after the interview there are some things you need to be conscious of, and take into consideration. The interview utilizes mostly open-ended questions, which require an elaborate answer from the interviewee. Usually such questions are used to explore an issue in depth and gather as much information as possible; To a limited extent, key informant interviews also utilize closed-ended questions, which require a short, simple answer from the interviewee. These questions are useful to acquire specific information or to confirm assumptions or data. Good practice in Key Informant Interviews Usually a combination of different types of questions gives the best result.

28 Mugo, Mutwiwa & Miriti: Mapping of Gender Disaggregated Data and Methodologies, February 2011
4.7 Focus Group Discussion (FGDs) This method is utilized for collection of in-depth data, and obtaining group consensus on gender issues affecting communities. To enhance success, 3 step model (women only, men only, mixed gender groups). In a group discussion, the researcher observes the community members as they discuss a certain topic. The objectives of the researcher should be twofold: first, the researcher can use the focus group discussion to gather information about an issue - such as the consensus or lack of consensus on a certain issue; secondly, the researcher can gain an insight into the decision structures within the focus group: who has the power to make decisions? Who merely listens and only speaks when directly asked? Focus group discussions, especially when they are held with mixed groups of men and women, can give an insight into the gender relationships within a community: what are the women allowed to decide, when do the men have this power, and how do men and women perceive various issues?
4.8 Participatory Rural Appraisal (PRA) and Stages of Progress (SoP) This method was applied in one study on rural poultry production (Okitoi, Ondwasy, Obali & Murekefu), using a gender analysis matrix (GAM). In another case (Participatory Poverty Assessment, 2005/2006), PRA tools were employed for poverty diagnostics and the analysis of the impact of policy and service delivery on the people. Although the PRA was designed to give respondents ‘space’ to express their own perspectives on their lives and livelihoods, the approach was semi-structured, with a range of issues defined and incorporated into the training of field staff. The Stages of Progress methodology was used to solicit information on poverty dynamics (in the Participatory Poverty Assessment). In this method, community members were asked to give reasons why particular households have remained in poverty and the frictions that the non-poor encounter in ascending to prosperity. Based on the experiences gained by this Study, they recommend that:
1. There is need to use experienced personnel for such exercise especially those who can articulate the study and its objectives. A databank of trained research assistants should be maintained either at the district level or the national level for future exercises;
2. More time should be allocated for training of research assistants to ensure that all the tools are well understood and articulated in the whole process;
3. There is need to allocate more time for report writing at the district level to ensure that all the information collected is packaged at source;
4. Adequate publicity for the exercise to create awareness in the communities to be studied should be done in advance to ensure maximum cooperation especially in urban areas. This could probably be done through the media;
5. The research assistants should be well compensated for such a demanding exercise.
29 Mugo, Mutwiwa & Miriti: Mapping of Gender Disaggregated Data and Methodologies, February 2011
4.9 Local histories, timelines and life history traces This data collection method aims to assess how life has changed in the community over a specific time period. Remember villagers will probably not use calendar years (e.g. 1950) as their reference point but rather some significant event (e.g. since independence or since the drought when there was no harvest for three seasons). This data collection method can be carried out in an informal way with one or a number of people. The advantage of involving more than one person is that events are moderated and there is a consensus on what happened and when. This data gathering method can be useful as an icebreaker as well as providing useful data about changes that have taken place both in terms of resources and infrastructure (e.g. a forest area was closed off stopping wood gathering, the power line came within five kilometers of the village) and in socioeconomic terms (e.g. women were able to attend literacy classes; men began to help in collecting water). Time lines help mark when events occurred, and life history traces help identify what caused the event. Remember poverty is a dynamic condition – people and communities move in and out of poverty. This method helps to uncover this dynamic and identifies drivers of change and looks for explanations about why those drivers come into force.
4.10 Key success factors for methodologies - Time spent in the field/researcher-field contact – longer contact with farmers
seems to yield better quality of data, gaining understanding of gender roles and relations, and aspects of culture;
- Understanding culture and gender roles within research contexts – in some studies, asking men about women has proven unfruitful, same with asking women about men, making it difficult to apply triangulation. In other cultures, mixing women and men is unacceptable, while in other cultures, women speak out and correct men stereotypes in mixed groups;
- Triangulation of methods and data sources – collecting same data from various sources (secondary data, asking men, asking women etc.), and combining different methodologies within one study seems to generate richer data.
- Participation of local communities – field studies need to identify various opportunities for participation of local communities. Farmer groups seem to be critical contact and entry points for farmers in the various regions, and can be critical sources of documented data.
30 Mugo, Mutwiwa & Miriti: Mapping of Gender Disaggregated Data and Methodologies, February 2011
5. TOWARDS A GENDER POLICY: RECOMMENDATIONS Various insights have emerged from the interviews with experts, on the critical points to consider in conceptualizing a gender policy in agriculture. A summary of some of the recommendations raised by the gender experts interviewed together with what the Consultants obtained from literature is presented below.
Addressing Policy
‐ Raise the bar high. Though the policy talks of 30% representation for every gender, target 50% gender representation in agriculture, at all levels;
‐ Policy needs to consider gender issues e.g. in irrigation schemes and water user associations are male dominated with no youth, infrastructure operation and maintenance ought to be gender friendly. Look at the sector holistically, not just at the top;
‐ Review of some government policies e.g. on transport-when a young mother is travelling to the field in a government vehicle, she should be allowed to carry her baby and nanny with her. At the moment, this is not the case.
‐ Every organization should also have a gender policy and ensure that women’s priorities receive equal consideration. This way, gender mainstreaming then becomes part of a change process in the institutional culture and practice.
Gender mainstreaming and Gender empowerment ‐ Coordination is an important aspect of gender mainstreaming. Although the overall
responsibility for gender mainstreaming is collective and institutional, each organization should set up a Gender Focal Point. The primary responsibility of the Gender Focal Point would be to coordinate and facilitate gender mainstreaming activities as well as to share information within and between organizations in a catalytic fashion (Suda, 2008);
‐ Another important step in gender mainstreaming is to have senior management personnel who deal with policy formulation and resource allocation committed to the goal of gender equality. This could be achieved through systematic sensitization and targeted buy-in of senior management in all offices in the sector;
‐ Women’s increased access to educational and training opportunities not only increases their participation in the labour force but also expands the range of occupational options available in the market. The vulnerability of poor women in Kenya is closely linked to illiteracy and low levels of education. Thus, adult literacy programmes must form part of gender mainstreaming efforts;
‐ There is a need to create awareness for women and men to venture in the ‘non-traditional’ and stereotyped careers e.g. Females drivers and male Secretaries in the sector, through affirmative action. This could be achieved through systematic gender capacity building at all levels to create understanding and appreciation In addition sufficient resources should be provided for gender issues;
‐ Some findings indicate that women, even when elected into management committees, are not able to contribute meaningfully to debates during meetings, often because of

31 Mugo, Mutwiwa & Miriti: Mapping of Gender Disaggregated Data and Methodologies, February 2011
various reasons such as lack of exposure and socialization that fails to prepare them for these kinds of roles. It is necessary to introduce leadership training for women to build their capacity and put them in a position to make a difference.
Engendering service delivery and Improving Working Environments ‐ Even though there is need to ensure that service delivery reaches the public across
the country, deployment of both men and women should take into account the special needs of women such as ability to work optimally in hardship areas and access to maternal health services;
‐ Workplace environment should be gender sensitive and responsive e.g. a place for young mothers to breastfeed, vehicles fitted with a pedestal for use by ladies when entering, lady ‘friendly’ motorcycles in extension services, and so on.
Improving collation of gender-disaggregated data In all offices and projects, performance indicators should be made gender sensitive
through disaggregation of all data by sex in order to adequately measure the differential impacts of interventions on men and women;
Suda (2008) advices that all institutions and employment sectors should improve their data collection and analysis skills so as to generate gender disaggregated data showing the contributions of men and women in all sectors of the national economy, including their participation in the informal sector. This kind of data allow for a baseline understanding of socio-economic and gender issues on a sector-by-sector basis and also helps with proper targeting when appropriate investments are made. Gender disaggregated data are therefore essential resources for gender-responsive planning and programming which seek to bring to an end the continuing social, cultural, economic and political marginalization of women so that they can move out of poverty.
32 Mugo, Mutwiwa & Miriti: Mapping of Gender Disaggregated Data and Methodologies, February 2011
References Agricultural Science and Technology Indicators [ASTI] (2010). ASTI Data in Focus – Kenya,
August 2010. Agricultural Science and Technology Indicators [ASTI] (2008). Women’s participation in
agricultural research and higher education. Kenya Factsheet, 2008. Atieno, R. (2010). Explaining Female Labour Force Participation: The Case of Kenya’s
Informal Sector and the Effect of the Economic Crisis. Paper presented during the 2010 annual IAFFE Conference, Buenos Aires, July 22-24, 2010.
Beintema, N. and F. Di Marcantonio, 2008. Women’s Participation in Agricultural Research and Higher Education. Kenya Fact Sheet 2008. International Food Policy Research Institute. Available at:
http://www.asti.cgiar.org/pdf/kenya_cb8.pdf. Centre for Governance and Development (CGD) (2009). A Gender analysis of NASEP. CGD
Policy Brief, Issue 01/09, April 2009. Creighton, C., Yieke, F. (2006). Gender inequalities in Kenya. UNESCO, 2006. Evaluation of Adoption of Agricultural Technologies in the KAPP Phase I Project Areas,
Kenya Agricultural Productivity Project, November 2009. FAO (2007). Gender mainstreaming in forestry in Africa (Kenya). Rome: FAO. FAO 2003. Gender-Disaggregated Data for Agriculture and Rural Development: Guide for
facilitators. Socio-Economic and Gender Analysis Programme (SEAGA). FAO, 1999. Filling the data gap: gender-sensitive statistics for agricultural development.
Rome 1999. Gender and Water Alliance (GWA), (2003). The Gender and Water Development Report,
2003. IFPRI and KARI, 2010. Agricultural Science Technology Indicators data in focus, Kenya Kabutha, C. And E. Kiara, 2008. Gender Study of the Smallholder Irrigation Project Mount
Kenya Region (SIPMK). Lwenya C. A., Lwenya, K.R., Abila, R and Omwega, R. (undated). Gender participation in
fisheries management of Lake Victoria, Kenya. Kenya Marine and Fisheries Research Institute, Kisumu.
Ministry of Agriculture. Gender Mainstreaming Strategy, 2009-2012 Ministry of Agriculture (2006), Strategic Plan, Nairobi Ministry of Agriculture and the Ministry of Livestock and Fisheries Development (2004),
Strategy for Revitalizing Agriculture, Nairobi Ministry of Fisheries (2005). Draft Kenya Fisheries Policy, October 29, 2005. Ministry of Water and Irrigation, Gender Baseline Survey, June 2010. Ministry of Water and Irrigation, sex Disaggregated Data on Promotions, Appointments and
Trainings for the FY 2009/2010 Ministry of Water and irrigation, Gender Mainstreaming Guidelines Ministry of Water and Irrigation, Strengthening the Gender Mainstreaming Capacity in the
Water Sector Institutions. NALEP (2009). Particular Assets and Vulnerabilities of rural Women within the Agricultural
Sector in Kenya 2009. NALEP (2002). Gender Analysis and Gender Sensitive Technology for Improved
Agricultural Extension. NALEP (2002). Gender Integration in Agricultural and Livestock Extension, a Training
Guidebook.
33 Mugo, Mutwiwa & Miriti: Mapping of Gender Disaggregated Data and Methodologies, February 2011
Ndubi, J.M., Karanja, G.M and Lanyasunya, T. (2005). Towards the promotion of food security and gender equity: The case of Samburu Wings of Mercy in Samburu District. KARI Headquarters, Nairobi, Kenya
Ngugi, J.N. Nyongesa J.W., and L.O. Okitoi (2002). Gender Concerns in Research and
Household Poverty Reduction: The Case of Kenya Agricultural Research Institute Project on Indigenous Poultry in Western Kenya. KARI-KABETE, KARI-HEADQUARTERS KARI-KAKAMEGA,
Okitoi, L.O, H O Ondwasy, M P Obali and F Murekefu (2006). Gender issues in poultry production in rural households of Western Kenya. KARI-Kakamega, Ministry of Livestock and fisheries, Kakamega.
Republic of Kenya (2001), Poverty Reduction Strategy Paper, Ministry of Finance and Planning, Nairobi, Kenya.
Smith, S. et al, (2004). Ethical Trade in African Horticulture: gender, rights and participation, IDS Working Paper 223.
Suda, C. (2002). Gender disparities in the Kenyan Labour Market: Implications for Poverty Reduction. Nordic Journal of African Studies, 11(3), 301-321 (2002).
Tanui P.J. (2005). The impact of differential gender access to resources on agricultural production: the case of Nandi District. Unpublished PhD Thesis, Kenyatta University.
The World Bank (2003). The Kenya Strategic Country Gender Assessment. PREM and ESSD – Africa Region.
Were, E., Roy, J. & Swallow, B. (2008). Local organisation and gender in water management: A case study from the Kenyan highlands. Journal of International Development 20, 69-81 (2008).

Annex 1: List of People Interviewed
# Name Institution Designation Contact 1 Anne Chele ASCU [email protected] 2 Dorcas Mwakoi ASCU [email protected] 3 Beatrice M.
Mwaura Ministry of Agriculture-Gender Section
Head, Gender Section
Tel: 254-20-2718870/9 Ext. 48394 [email protected]
4 Jane Kaberia Small-Scale Horticulture Development Programme
Gender Specialist Email: [email protected]
5 Ms.Judy Amadiwa and Matilda
Ministry of Fisheries Development
Gender Officer
6 Mr. Francis M. Wario
Fresh Produce Exporters Association of Kenya
Technical Manager Email: [email protected] Tel:0722 753851
7 Ms. Rosemary Magambo
National Agriculture and Livestock Extension Programme
Coordinator, Gender and Social Economics
Email : [email protected], [email protected] Tel : 0724 256157
8 Ms. Beth Wagude Kenya Fish Processors & Exporters Association
CEO
9 Ms. Lucy Mwangi Kenya National Federation of Agricultural Producers
Gender issues, Monitoring and Evaluation
[email protected] Tel: 0722851433
10 Ms. Angelline Owino
Ministry of Regional Development
Gender Desk Officer
11 Ms. Rebecca Biegon
ASAL Based Livestock and Rural Livelihoods Support Programme
Gender Desk Officer Hill Plaza, 9th floor
12 Dorcas Otieno Ministry of Water and Irrigation
Superitendent, Irrigation
Mobile: +254 (0) 722-161680 [email protected]
13 Teresia Wasike Ministry of Water and Irrigation
Gender Desk Officer
14 Mr. Wilson Oduor Njaa Marufuku Kenya Grants Coordinator Maendeleo Hosue 5th Floor 15 Mr. Philip Makheti NAAIAP Coordinator Maendeleo House 5th Floor 16 Ms. Esther
Musyoka NAAIAP Gender Desk Officer Maendeleo House 5th Floor
17 Ms. Jane Ngugi KAPAP Gender Desk Officer Capital Hill Plaza 18 Ms. Hannah
Kinyanjui Ministry of Environment
NHIF Building Tel: 0720698891
19 Mr. Sakunda Ministry of Livestock Development
Kilimo house, 2nd floor room 15
20 Mr Stephen Kioko SHEP-UP 0721310903 21 Ms. Grace Kimitei Ministry of Planning,
National Development and Vision 2030
Gender Desk Officer 0727695223
22 Ms. Rose Okeda Ministry of Forestry Tel: 0725425708 Email: [email protected]
23 Harrison Okech Federation of Kenyan Employers
Senior Executive Officer, Industrial relations and legal services
0722 203 487, 0733 333 291
34 Mugo, Mutwiwa & Miriti: Mapping of Gender Disaggregated Data and Methodologies, February 2011
35 Mugo, Mutwiwa & Miriti: Mapping of Gender Disaggregated Data and Methodologies, February 2011
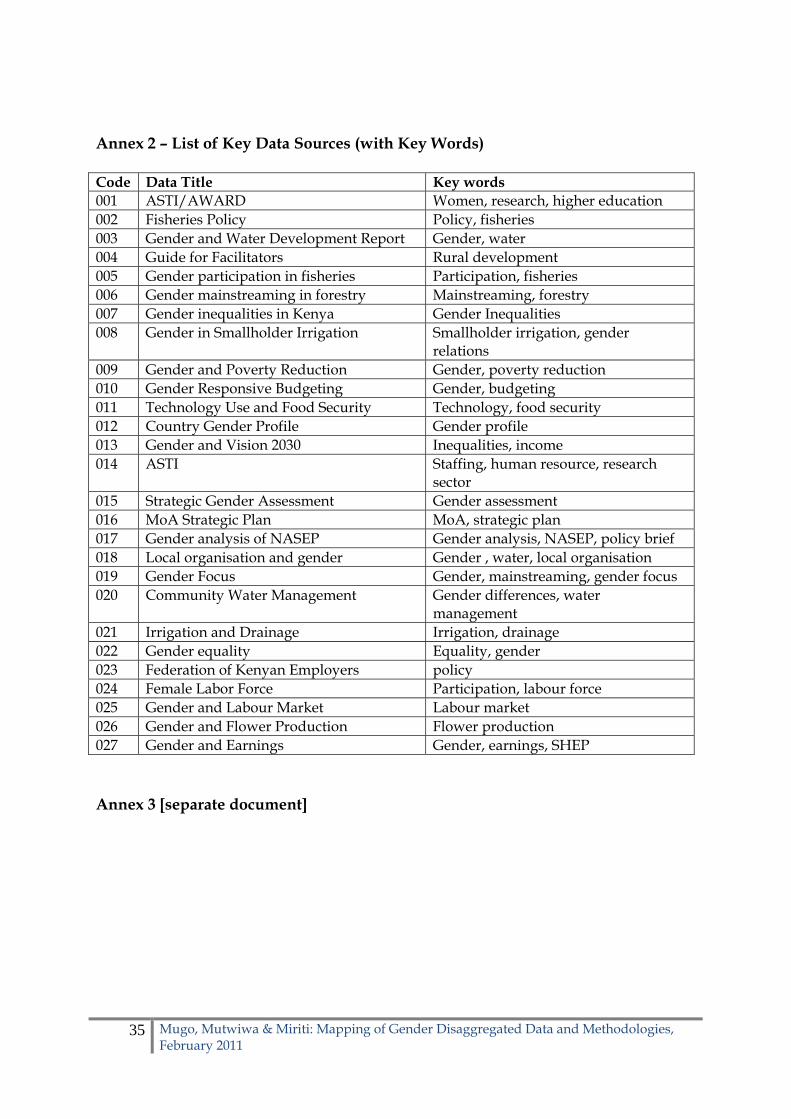
Annex 2 – List of Key Data Sources (with Key Words) Code Data Title Key words 001 ASTI/AWARD Women, research, higher education 002 Fisheries Policy Policy, fisheries 003 Gender and Water Development Report Gender, water 004 Guide for Facilitators Rural development 005 Gender participation in fisheries Participation, fisheries 006 Gender mainstreaming in forestry Mainstreaming, forestry 007 Gender inequalities in Kenya Gender Inequalities 008 Gender in Smallholder Irrigation Smallholder irrigation, gender
relations 009 Gender and Poverty Reduction Gender, poverty reduction 010 Gender Responsive Budgeting Gender, budgeting 011 Technology Use and Food Security Technology, food security 012 Country Gender Profile Gender profile 013 Gender and Vision 2030 Inequalities, income 014 ASTI Staffing, human resource, research
sector 015 Strategic Gender Assessment Gender assessment 016 MoA Strategic Plan MoA, strategic plan 017 Gender analysis of NASEP Gender analysis, NASEP, policy brief 018 Local organisation and gender Gender , water, local organisation 019 Gender Focus Gender, mainstreaming, gender focus 020 Community Water Management Gender differences, water
management 021 Irrigation and Drainage Irrigation, drainage 022 Gender equality Equality, gender 023 Federation of Kenyan Employers policy 024 Female Labor Force Participation, labour force 025 Gender and Labour Market Labour market 026 Gender and Flower Production Flower production 027 Gender and Earnings Gender, earnings, SHEP Annex 3 [separate document]
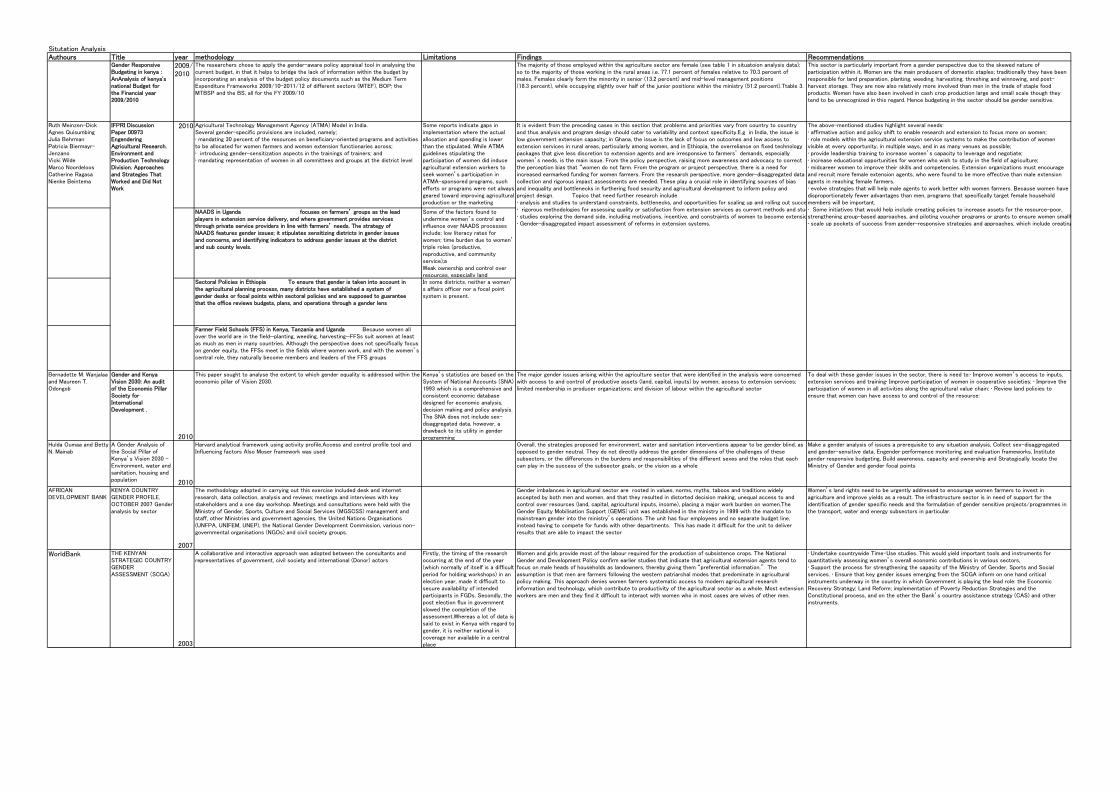
Situtation AnalysisAuthours Title year methodology Limitations Findings Recommendations
Gender ResponsiveBudgeting in kenya :AnAnalysis of kenya'snational Budget forthe Financial year2009/2010
2009/2010
The researchers chose to apply the gender-aware policy appraisal tool in analysing thecurrent budget, in that it helps to bridge the lack of information within the budget byincorporating an analysis of the budget policy documents such as the Medium TermExpenditure Frameworks 2009/10-2011/12 of different sectors (MTEF), BOP; theMTBSP and the BS, all for the FY 2009/10
The majority of those employed within the agriculture sector are female (see table 1 in situatoion analysis data);so to the majority of those working in the rural areas i.e. 77.1 percent of females relative to 70.3 percent ofmales. Females clearly form the minority in senior (13.2 percent) and mid-level management positions(18.3 percent), while occupying slightly over half of the junior positions within the ministry (51.2 percent).Ttable 3.
This sector is particularly important from a gender perspective due to the skewed nature ofparticipation within it. Women are the main producers of domestic staples; traditionally they have beenresponsible for land preparation, planting, weeding, harvesting, threshing and winnowing, and post-harvest storage. They are now also relatively more involved than men in the trade of staple foodproducts. Women have also been involved in cash crop production large and small scale though theytend to be unrecognized in this regard. Hence budgeting in the sector should be gender sensitive.
Ruth Meinzen-DickAgnes QuisumbingJulia BehrmanPatricia Biermayr-JenzanoVicki WildeMarco NoordeloosCatherine RagasaNienke Beintema
2010 Agricultural Technology Management Agency (ATMA) Model in India.Several gender-specific provisions are included, namely;• mandating 30 percent of the resources on beneficiary-oriented programs and activitiesto be allocated for women farmers and women extension functionaries across;• introducing gender-sensitization aspects in the trainings of trainers; and• mandating representation of women in all committees and groups at the district level
Some reports indicate gaps inimplementation where the actualallocation and spending is lowerthan the stipulated. While ATMAguidelines stipulating theparticipation of women did induceagricultural extension workers toseek women’s participation inATMA-sponsored programs, suchefforts or programs were not alwaysgeared toward improving agriculturalproduction or the marketing
i fSome of the factors found toundermine women’s control andinfluence over NAADS processesinclude; low literacy rates forwomen; time burden due to women’triple roles (productive,reproductive, and communityservice);aWeak ownership and control overresources, especially land
h• scale up pockets of success from gender-responsive strategies and approaches, which include creating
NAADS in Uganda focuses on farmers’ groups as the leadplayers in extension service delivery, and where government provides servicesthrough private service providers in line with farmers’ needs. The strategy ofNAADS features gender issues; it stipulates sensitizing districts in gender issuesand concerns, and identifying indicators to address gender issues at the districtand sub county levels.
Sectoral Policies in Ethiopia To ensure that gender is taken into account inthe agricultural planning process, many districts have established a system ofgender desks or focal points within sectoral policies and are supposed to guaranteethat the office reviews budgets, plans, and operations through a gender lens
In some districts, neither a women’s affairs officer nor a focal pointsystem is present.
Farmer Field Schools (FFS) in Kenya, Tanzania and Uganda Because women allover the world are in the field—planting, weeding, harvesting—FFSs suit women at leastas much as men in many countries. Although the perspective does not specifically focuson gender equity, the FFSs meet in the fields where women work, and with the women’scentral role, they naturally become members and leaders of the FFS groups
Bernadette M. Wanjalaaand Maureen T.Odongob
Gender and KenyaVision 2030: An auditof the Economic PillarSociety forInternationalDevelopment .
2010
This paper sought to analyse the extent to which gender equality is addressed within theeconomic pillar of Vision 2030.
Kenya’s statistics are based on theSystem of National Accounts (SNA)1993 which is a comprehensive andconsistent economic databasedesigned for economic analysis,decision making and policy analysis.The SNA does not include sex-disaggregated data, however, adrawback to its utility in genderprogramming
The major gender issues arising within the agriculture sector that were identified in the analysis were concernedwith access to and control of productive assets (land, capital, inputs) by women; access to extension services;limited membership in producer organizations; and division of labour within the agricultural sector
To deal with these gender issues in the sector, there is need to:• Improve women’s access to inputs,extension services and training• Improve participation of women in cooperative societies: • Improve theparticipation of women in all activities along the agricultural value chain: • Review land policies toensure that women can have access to and control of the resource:
Hulda Oumaa and BettyN. Mainab
A Gender Analysis ofthe Social Pillar ofKenya’s Vision 2030 –Environment, water andsanitation, housing andpopulation 2010
Harvard analytical framework using activity profile,Access and control profile tool andInfluencing factors Also Moser framework was used
Overall, the strategies proposed for environment, water and sanitation interventions appear to be gender blind, asopposed to gender neutral. They do not directly address the gender dimensions of the challenges of thesesubsectors, or the differences in the burdens and responsibilities of the different sexes and the roles that eachcan play in the success of the subsector goals, or the vision as a whole
Make a gender analysis of issues a prerequisite to any situation analysis, Collect sex-disaggregatedand gender-sensitive data, Engender performance monitoring and evaluation frameworks, Institutegender responsive budgeting, Build awareness, capacity and ownership and Strategically locate theMinistry of Gender and gender focal points
AFRICANDEVELOPMENT BANK
KENYA COUNTRYGENDER PROFILE,OCTOBER 2007 Genderanalysis by sector
2007
The methodology adopted in carrying out this exercise included desk and internetresearch, data collection, analysis and reviews; meetings and interviews with keystakeholders and a one day workshop. Meetings and consultations were held with theMinistry of Gender, Sports, Culture and Social Services (MGSCSS) management andstaff, other Ministries and government agencies, the United Nations Organisations(UNFPA, UNIFEM, UNEP), the National Gender Development Commission, various non-governmental organisations (NGOs) and civil society groups.
Gender imbalances in agricultural sector are rooted in values, norms, myths, taboos and traditions widelyaccepted by both men and women, and that they resulted in distorted decision making, unequal access to andcontrol over resources (land, capital, agricultural inputs, income), placing a major work burden on women.TheGender Equity Mobilisation Support (GEMS) unit was established in the ministry in 1999 with the mandate tomainstream gender into the ministry’s operations. The unit has four employees and no separate budget line,instead having to compete for funds with other departments. This has made it difficult for the unit to deliverresults that are able to impact the sector
Women’s land rights need to be urgently addressed to encourage women farmers to invest inagriculture and improve yields as a result. The infrastructure sector is in need of support for theidentification of gender specific needs and the formulation of gender sensitive projects/programmes inthe transport, water and energy subsectors in particular.
WorldBank THE KENYANSTRATEGIC COUNTRYGENDERASSESSMENT (SCGA)
2003
A collaborative and interactive approach was adopted between the consultants andrepresentatives of government, civil society and international (Donor) actors
Firstly, the timing of the researchoccurring at the end of the year(which normally of itself is a difficultperiod for holding workshops) in anelection year, made it difficult tosecure availability of intendedparticipants in FGDs. Secondly, thepost election flux in governmentslowed the completion of theassessment.Whereas a lot of data issaid to exist in Kenya with regard togender, it is neither national incoverage nor available in a centralplace
Women and girls provide most of the labour required for the production of subsistence crops. The NationalGender and Development Policy confirm earlier studies that indicate that agricultural extension agents tend tofocus on male heads of households as landowners, thereby giving them “preferential information.” Theassumption is that men are farmers following the western patriarchal modes that predominate in agriculturalpolicy making. This approach denies women farmers systematic access to modern agricultural researchinformation and technology, which contribute to productivity of the agricultural sector as a whole. Most extensionworkers are men and they find it difficult to interact with women who in most cases are wives of other men.
• Undertake countrywide Time-Use studies. This would yield important tools and instruments forquantitatively assessing women’s overall economic contributions in various sectors,• Support the process for strengthening the capacity of the Ministry of Gender, Sports and Socialservices. • Ensure that key gender issues emerging from the SCGA inform on one hand criticalinstruments underway in the country in which Government is playing the lead role: the EconomicRecovery Strategy; Land Reform; implementation of Poverty Reduction Strategies and theConstitutional process, and on the other the Bank’s country assistance strategy (CAS) and otherinstruments.
IFPRI DiscussionPaper 00973EngenderingAgricultural Research.Environment andProduction TechnologyDivision. Approachesand Strategies ThatWorked and Did NotWork
The above-mentioned studies highlight several needs:• affirmative action and policy shift to enable research and extension to focus more on women;• role models within the agricultural extension service systems to make the contribution of womenvisible at every opportunity, in multiple ways, and in as many venues as possible;• provide leadership training to increase women’s capacity to leverage and negotiate;• increase educational opportunities for women who wish to study in the field of agriculture;• midcareer women to improve their skills and competencies. Extension organizations must encourageand recruit more female extension agents, who were found to be more effective than male extensionagents in reaching female farmers.• evolve strategies that will help male agents to work better with women farmers. Because women havedisproportionately fewer advantages than men, programs that specifically target female householdmembers will be important.• Some initiatives that would help include creating policies to increase assets for the resource-poor,strengthening group-based approaches, and piloting voucher programs or grants to ensure women small
It is evident from the preceding cases in this section that problems and priorities vary from country to countryand thus analysis and program design should cater to variability and context specificity.E.g in India, the issue islow government extension capacity; in Ghana, the issue is the lack of focus on outcomes and low access toextension services in rural areas, particularly among women, and in Ethiopia, the overreliance on fixed technologypackages that give less discretion to extension agents and are irresponsive to farmers’ demands, especiallywomen’s needs, is the main issue. From the policy perspective, raising more awareness and advocacy to correctthe perception bias that “women do not farm. From the program or project perspective, there is a need forincreased earmarked funding for women farmers. From the research perspective, more gender-disaggregated datacollection and rigorous impact assessments are needed. These play a crucial role in identifying sources of biasand inequality and bottlenecks in furthering food security and agricultural development to inform policy andproject design. Topics that need further research include• analysis and studies to understand constraints, bottlenecks, and opportunities for scaling up and rolling out succ• rigorous methodologies for assessing quality or satisfaction from extension services as current methods and stu• studies exploring the demand side, including motivations, incentive, and constraints of women to become extensi• Gender-disaggregated impact assessment of reforms in extension systems.
edo
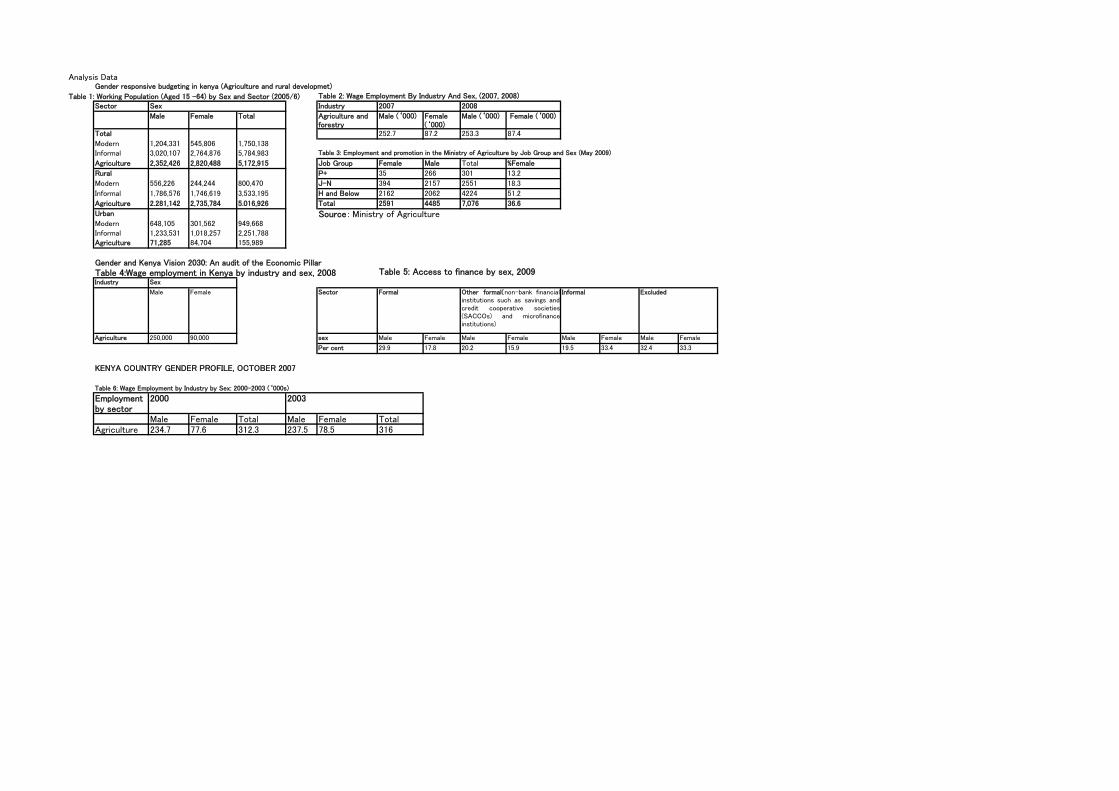
Analysis Data
Table 1: Working Population (Aged 15 -64) by Sex and Sector (2005/6)Sector Sex Industry
Male Female Total Agriculture andforestry
Male (‘000) Female(‘000)
Male (‘000) Female (‘000)
Total 252.7 87.2 253.3 87.4
Modern 1,204,331 545,806 1,750,138Informal 3,020,107 2,764,876 5,784,983 Table 3: Employment and promotion in the Ministry of Agriculture by Job Group and Sex (May 2009)
Agriculture 2,352,426 2,820,488 5,172,915 Job Group Female Male Total %Female
Rural P+ 35 266 301 13.2
Modern 556,226 244,244 800,470 J-N 394 2157 2551 18.3
Informal 1,786,576 1,746,619 3,533,195 H and Below 2162 2062 4224 51.2
Agriculture 2.281,142 2,735,784 5.016,926 Total 2591 4485 7,076 36.6
Urban Source : Ministry of AgricultureModern 648,105 301,562 949,668Informal 1,233,531 1,018,257 2,251,788Agriculture 71,285 84,704 155,989
Industry
Male Female Sector
Agriculture 250,000 90,000 sex Male Female Male Female Male Female Male Female
Per cent 29.9 17.8 20.2 15.9 19.5 33.4 32.4 33.3
Employmentby sector
Male Female Total Male Female TotalAgriculture 234.7 77.6 312.3 237.5 78.5 316
Excluded
Table 4:Wage employment in Kenya by industry and sex, 2008Sex
Gender and Kenya Vision 2030: An audit of the Economic PillarTable 5: Access to finance by sex, 2009
Informal
Table 2: Wage Employment By Industry And Sex, (2007, 2008)
2007 2008
Gender responsive budgeting in kenya (Agriculture and rural developmet)
2000 2003
Other formal(non-bank financialinstitutions such as savings andcredit cooperative societies(SACCOs) and microfinanceinstitutions)
Formal
KENYA COUNTRY GENDER PROFILE, OCTOBER 2007
Table 6: Wage Employment by Industry by Sex: 2000-2003 (‘000s)
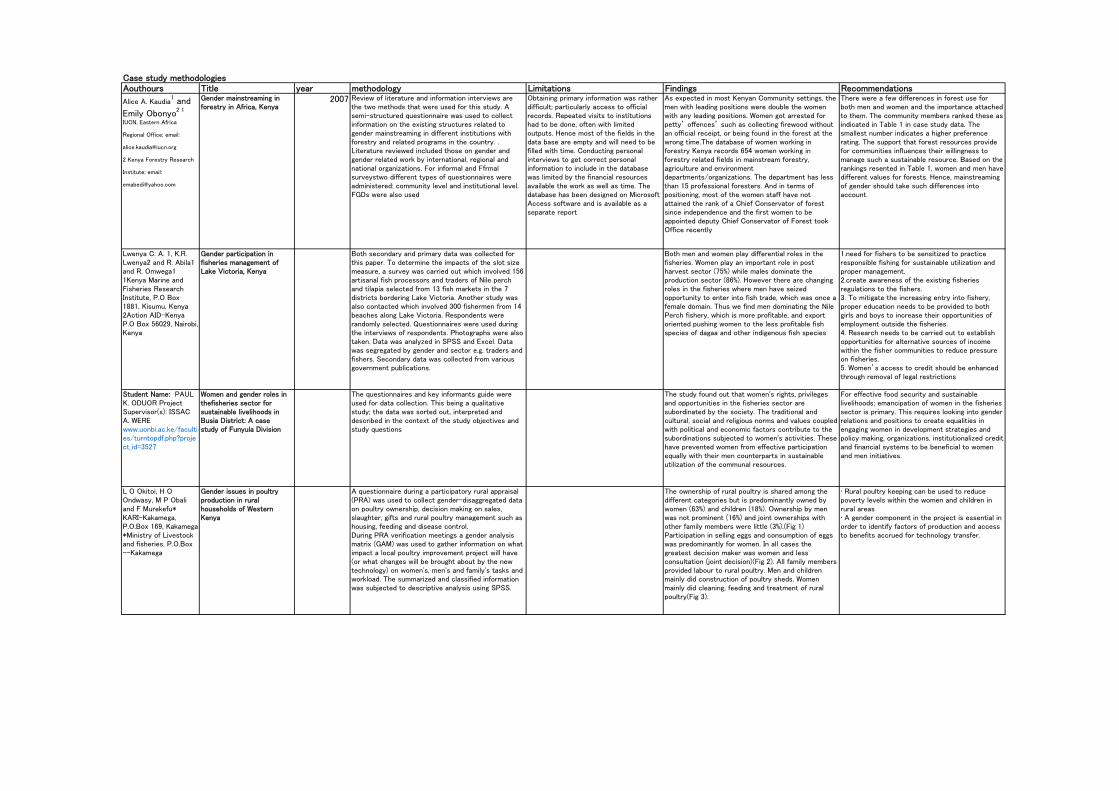
Aouthours Title year methodology Limitations Findings Recommendations
Alice A. Kaudia1 and
Emily Obonyo2 1
IUCN, Eastern Africa
Regional Office; email:
2 Kenya Forestry Research
Institute; email:
Gender mainstreaming inforestry in Africa, Kenya
2007 Review of literature and information interviews arethe two methods that were used for this study. Asemi-structured questionnaire was used to collectinformation on the existing structures related togender mainstreaming in different institutions withforestry and related programs in the country. .Literature reviewed included those on gender andgender related work by international, regional andnational organizations. For informal and Ffrmalsurveystwo different types of questionnaires wereadministered: community level and institutional level.FGDs were also used
Obtaining primary information was ratherdifficult; particularly access to officialrecords. Repeated visits to institutionshad to be done, often with limitedoutputs. Hence most of the fields in thedata base are empty and will need to befilled with time. Conducting personalinterviews to get correct personalinformation to include in the databasewas limited by the financial resourcesavailable the work as well as time. Thedatabase has been designed on MicrosoftAccess software and is available as aseparate report
As expected in most Kenyan Community settings, themen with leading positions were double the womenwith any leading positions. Women got arrested forpetty’ offences’ such as collecting firewood withoutan official receipt, or being found in the forest at thewrong time.The database of women working inforestry Kenya records 654 women working inforestry related fields in mainstream forestry,agriculture and environmentdepartments/organizations. The department has lessthan 15 professional foresters. And in terms ofpositioning, most of the women staff have notattained the rank of a Chief Conservator of forestsince independence and the first women to beappointed deputy Chief Conservator of Forest tookOffice recently
There were a few differences in forest use forboth men and women and the importance attachedto them. The community members ranked these asindicated in Table 1 in case study data. Thesmallest number indicates a higher preferencerating. The support that forest resources providefor communities influences their willingness tomanage such a sustainable resource. Based on therankings resented in Table 1, women and men havedifferent values for forests. Hence, mainstreamingof gender should take such differences intoaccount.
Lwenya C. A. 1, K.R.Lwenya2 and R. Abila1and R. Omwega11Kenya Marine andFisheries ResearchInstitute, P.O Box1881, Kisumu, Kenya2Action AID-KenyaP.O Box 56029, Nairobi,Kenya
Gender participation infisheries management ofLake Victoria, Kenya
Both secondary and primary data was collected forthis paper. To determine the impacts of the slot sizemeasure, a survey was carried out which involved 156artisanal fish processors and traders of Nile perchand tilapia selected from 13 fish markets in the 7districts bordering Lake Victoria. Another study wasalso contacted which involved 300 fishermen from 14beaches along Lake Victoria. Respondents wererandomly selected. Questionnaires were used duringthe interviews of respondents. Photographs were alsotaken. Data was analyzed in SPSS and Excel. Datawas segregated by gender and sector e.g. traders andfishers. Secondary data was collected from variousgovernment publications.
Both men and women play differential roles in thefisheries. Women play an important role in postharvest sector (75%) while males dominate theproduction sector (86%). However there are changingroles in the fisheries where men have seizedopportunity to enter into fish trade, which was once afemale domain. Thus we find men dominating the NilePerch fishery, which is more profitable, and exportoriented pushing women to the less profitable fishspecies of dagaa and other indigenous fish species
1.need for fishers to be sensitized to practiceresponsible fishing for sustainable utilization andproper management.2.create awareness of the existing fisheriesregulations to the fishers.3. To mitigate the increasing entry into fishery,proper education needs to be provided to bothgirls and boys to increase their opportunities ofemployment outside the fisheries.4. Research needs to be carried out to establishopportunities for alternative sources of incomewithin the fisher communities to reduce pressureon fisheries.5. Women’s access to credit should be enhancedthrough removal of legal restrictions
Student Name: PAULK. ODUOR ProjectSupervisor(s): ISSACA. WEREwww.uonbi.ac.ke/faculties/turntopdf.php?project_id=3527
Women and gender roles inthefisheries sector forsustainable livelihoods inBusia District: A casestudy of Funyula Division
The questionnaires and key informants guide wereused for data collection. This being a qualitativestudy; the data was sorted out, interpreted anddescribed in the context of the study objectives andstudy questions
The study found out that women's rights, privilegesand opportunities in the fisheries sector aresubordinated by the society. The traditional andcultural, social and religious norms and values coupledwith political and economic factors contribute to thesubordinations subjected to women's activities. Thesehave prevented women from effective participationequally with their men counterparts in sustainableutilization of the communal resources.
For effective food security and sustainablelivelihoods; emancipation of women in the fisheriessector is primary. This requires looking into genderrelations and positions to create equalities inengaging women in development strategies andpolicy making, organizations, institutionalized creditand financial systems to be beneficial to womenand men initiatives.
L O Okitoi, H OOndwasy, M P Obaliand F Murekefu*KARI-Kakamega,P.O.Box 169, Kakamega*Ministry of Livestockand fisheries, P.O.Box--Kakamega
Gender issues in poultryproduction in ruralhouseholds of WesternKenya
A questionnaire during a participatory rural appraisal(PRA) was used to collect gender-disaggregated dataon poultry ownership, decision making on sales,slaughter, gifts and rural poultry management such ashousing, feeding and disease control.During PRA verification meetings a gender analysismatrix (GAM) was used to gather information on whatimpact a local poultry improvement project will have(or what changes will be brought about by the newtechnology) on women's, men's and family's tasks andworkload. The summarized and classified informationwas subjected to descriptive analysis using SPSS.
The ownership of rural poultry is shared among thedifferent categories but is predominantly owned bywomen (63%) and children (18%). Ownership by menwas not prominent (16%) and joint ownerships withother family members were little (3%).(Fig 1)Participation in selling eggs and consumption of eggswas predominantly for women. In all cases thegreatest decision maker was women and lessconsultation (joint decision)(Fig 2). All family membersprovided labour to rural poultry. Men and childrenmainly did construction of poultry sheds. Womenmainly did cleaning, feeding and treatment of ruralpoultry(Fig 3).
• Rural poultry keeping can be used to reducepoverty levels within the women and children inrural areas• A gender component in the project is essential inorder to identify factors of production and accessto benefits accrued for technology transfer.
Case study methodologies
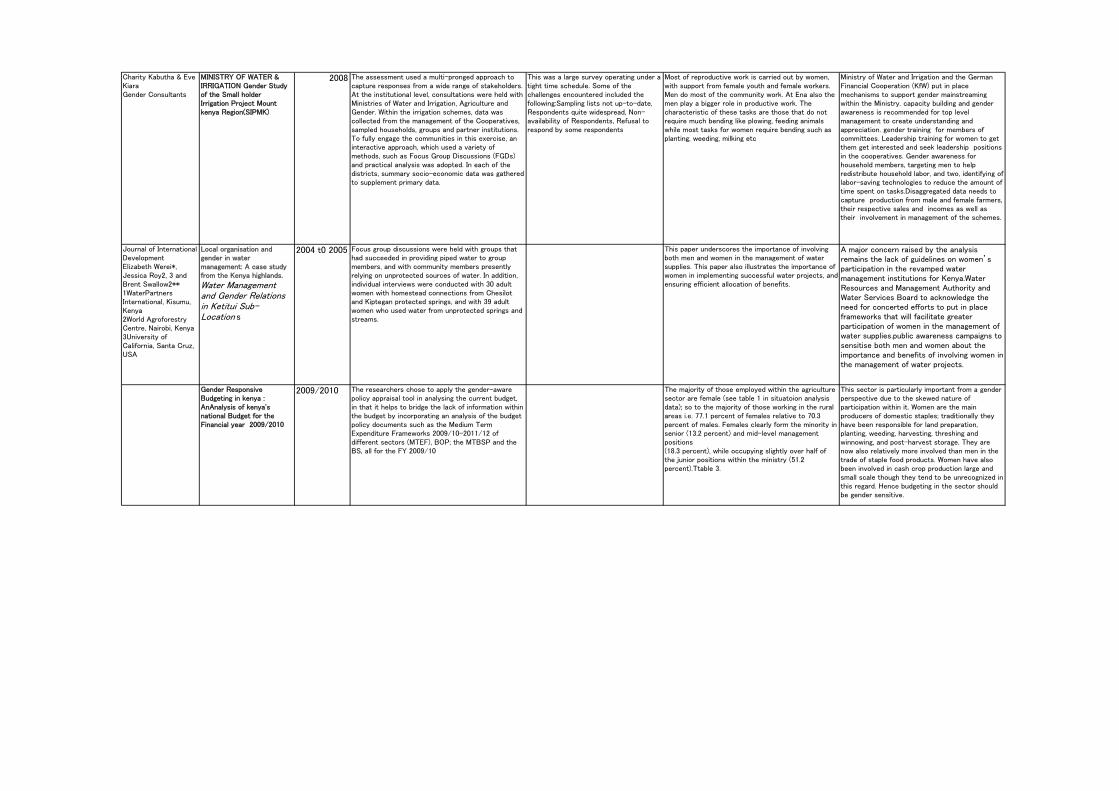
Charity Kabutha & EveKiaraGender Consultants
MINISTRY OF WATER &IRRIGATION Gender Studyof the Small holderIrrigation Project Mountkenya Region(SIPMK)
2008 The assessment used a multi-pronged approach tocapture responses from a wide range of stakeholders.At the institutional level, consultations were held withMinistries of Water and Irrigation, Agriculture andGender. Within the irrigation schemes, data wascollected from the management of the Cooperatives,sampled households, groups and partner institutions.To fully engage the communities in this exercise, aninteractive approach, which used a variety ofmethods, such as Focus Group Discussions (FGDs)and practical analysis was adopted. In each of thedistricts, summary socio-economic data was gatheredto supplement primary data.
This was a large survey operating under atight time schedule. Some of thechallenges encountered included thefollowing:Sampling lists not up-to-date,Respondents quite widespread, Non-availability of Respondents, Refusal torespond by some respondents
Most of reproductive work is carried out by women,with support from female youth and female workers.Men do most of the community work. At Ena also themen play a bigger role in productive work. Thecharacteristic of these tasks are those that do notrequire much bending like plowing, feeding animalswhile most tasks for women require bending such asplanting, weeding, milking etc
Ministry of Water and Irrigation and the GermanFinancial Cooperation (KfW) put in placemechanisms to support gender mainstreamingwithin the Ministry. capacity building and genderawareness is recommended for top levelmanagement to create understanding andappreciation. gender training for members ofcommittees. Leadership training for women to getthem get interested and seek leadership positionsin the cooperatives. Gender awareness forhousehold members, targeting men to helpredistribute household labor, and two, identifying oflabor-saving technologies to reduce the amount oftime spent on tasks.Disaggregated data needs tocapture production from male and female farmers,their respective sales and incomes as well astheir involvement in management of the schemes.
Journal of InternationalDevelopmentElizabeth Werei*,Jessica Roy2, 3 andBrent Swallow2**1WaterPartnersInternational, Kisumu,Kenya2World AgroforestryCentre, Nairobi, Kenya3University ofCalifornia, Santa Cruz,USA
Local organisation andgender in watermanagement: A case studyfrom the Kenya highlands.
Water Managementand Gender Relationsin Ketitui Sub-Location s
2004 t0 2005 Focus group discussions were held with groups thathad succeeded in providing piped water to groupmembers, and with community members presentlyrelying on unprotected sources of water. In addition,individual interviews were conducted with 30 adultwomen with homestead connections from Chesilotand Kiptegan protected springs, and with 39 adultwomen who used water from unprotected springs andstreams.
This paper underscores the importance of involvingboth men and women in the management of watersupplies. This paper also illustrates the importance ofwomen in implementing successful water projects, andensuring efficient allocation of benefits.
A major concern raised by the analysisremains the lack of guidelines on women’sparticipation in the revamped watermanagement institutions for Kenya.WaterResources and Management Authority andWater Services Board to acknowledge theneed for concerted efforts to put in placeframeworks that will facilitate greaterparticipation of women in the management ofwater supplies.public awareness campaigns tosensitise both men and women about theimportance and benefits of involving women inthe management of water projects.
Gender ResponsiveBudgeting in kenya :AnAnalysis of kenya'snational Budget for theFinancial year 2009/2010
2009/2010 The researchers chose to apply the gender-awarepolicy appraisal tool in analysing the current budget,in that it helps to bridge the lack of information withinthe budget by incorporating an analysis of the budgetpolicy documents such as the Medium TermExpenditure Frameworks 2009/10-2011/12 ofdifferent sectors (MTEF), BOP; the MTBSP and theBS, all for the FY 2009/10
The majority of those employed within the agriculturesector are female (see table 1 in situatoion analysisdata); so to the majority of those working in the ruralareas i.e. 77.1 percent of females relative to 70.3percent of males. Females clearly form the minority insenior (13.2 percent) and mid-level managementpositions(18.3 percent), while occupying slightly over half ofthe junior positions within the ministry (51.2percent).Ttable 3.
This sector is particularly important from a genderperspective due to the skewed nature ofparticipation within it. Women are the mainproducers of domestic staples; traditionally theyhave been responsible for land preparation,planting, weeding, harvesting, threshing andwinnowing, and post-harvest storage. They arenow also relatively more involved than men in thetrade of staple food products. Women have alsobeen involved in cash crop production large andsmall scale though they tend to be unrecognized inthis regard. Hence budgeting in the sector shouldbe gender sensitive.

Ruth Meinzen-DickAgnes QuisumbingJulia BehrmanPatricia Biermayr-JenzanoVicki WildeMarco NoordeloosCatherine RagasaNienke Beintema
2010 Agricultural Technology Management Agency (ATMA)Model in India. Severalgender-specific provisions are included, namely;• mandating 30 percent of the resources onbeneficiary-oriented programs and activities to beallocated for women farmers and women extensionfunctionaries across;• introducing gender-sensitization aspects in thetrainings of trainers; and• mandating representation of women in allcommittees and groups at the district level
Some reports indicate gaps inimplementation where the actualallocation and spending is lower than thestipulated. While ATMA guidelinesstipulating the participation of women didinduce agricultural extension workers toseek women’s participation in ATMA-sponsored programs, such efforts orprograms were not always geared towardimproving agricultural production or themarketing practices of women
NAADS in Uganda focuseson farmers’ groups as the lead players in extensionservice delivery, and where government providesservices through private service providers in linewith farmers’ needs. The strategy of NAADSfeatures gender issues; it stipulates sensitizingdistricts in gender issues and concerns, andidentifying indicators to address gender issues atthe district and sub county levels.
Some of the factors found to underminewomen’s control and influence overNAADS processes include; low literacyrates for women; time burden due towomen’ triple roles (productive,reproductive, and community service);aWeak ownership and control overresources, especially land
Sectoral Policies in Ethiopia To ensurethat gender is taken into account in the agriculturalplanning process, many districts have established asystem of gender desks or focal points withinsectoral policies and are supposed to guaranteethat the office reviews budgets, plans, andoperations through a gender lens
In some districts, neither a women’saffairs officer nor a focal point system ispresent.
Farmer Field Schools (FFS) in Kenya, Tanzania andUganda Because women all over the world are inthe field—planting, weeding, harvesting—FFSs suitwomen at least as much as men in many countries.Although the perspective does not specifically focuson gender equity, the FFSs meet in the fields wherewomen work, and with the women’s central role, theynaturally become members and leaders of the FFSgroups
Bernadette M. Wanjalaaand Maureen T.Odongob
Gender and Kenya Vision2030: An audit of theEconomic Pillar Societyfor InternationalDevelopment .
2010 This paper sought to analyse the extent to whichgender equality is addressed within the economicpillar of Vision 2030.
Kenya’s statistics are based on theSystem of National Accounts (SNA) 1993which is a comprehensive and consistenteconomic database designed foreconomic analysis, decision making andpolicy analysis. The SNA does not includesex-disaggregated data, however, adrawback to its utility in genderprogramming
The major gender issues arising within the agriculturesector that were identified in the analysis wereconcerned with access to and control of productiveassets (land, capital, inputs) by women; access toextension services; limited membership in producerorganizations; and division of labour within theagricultural sector
To deal with these gender issues in the sector,there is need to:• Improve women’s access toinputs, extension services and training• Improveparticipation of women in cooperative societies: •Improve the participation of women in all activitiesalong the agricultural value chain: • Review landpolicies to ensure that women can have access toand control of the resource:
Hulda Oumaa andBetty N. Mainab
A Gender Analysis of theSocial Pillar of Kenya’sVision 2030 – Environment,water and sanitation, housingand population
2010 Harvard analytical framework using activityprofile,Access and control profile tool and Influencingfactors Also Moser framework was used
Overall, the strategies proposed for environment,water and sanitation interventions appear to begender blind, as opposed to gender neutral. They donot directly address the gender dimensions of thechallenges of these subsectors, or the differences inthe burdens and responsibilities of the different sexesand the roles that each can play in the success of thesubsector goals, or the vision as a whole
Make a gender analysis of issues a prerequisite toany situation analysis, Collect sex-disaggregatedand gender-sensitive data, Engender performancemonitoring and evaluation frameworks, Institutegender responsive budgeting, Build awareness,capacity and ownership and Strategically locatethe Ministry of Gender and gender focal points
IFPRI Discussion Paper00973 EngenderingAgricultural Research.Environment andProduction TechnologyDivision. Approaches andStrategies That Workedand Did Not Work
It is evident from the preceding cases in this sectionthat problems and priorities vary from country tocountry and thus analysis and program design shouldcater to variability and context specificity.E.g in India,the issue is low government extension capacity; inGhana, the issue is the lack of focus on outcomesand low access to extension services in rural areas,particularly among women, and in Ethiopia, theoverreliance on fixed technology packages that giveless discretion to extension agents and areirresponsive to farmers’ demands, especially women’s needs, is the main issue. From the policyperspective, raising more awareness and advocacy tocorrect the perception bias that “women do not farm.From the program or project perspective, there is aneed for increased earmarked funding for womenfarmers. From the research perspective, moregender-disaggregated data collection and rigorousimpact assessments are needed. These play a crucialrole in identifying sources of bias and inequality andbottlenecks in furthering food security and agriculturaldevelopment to inform policy and project design. • analysis and studies to understand constraints, bottle• rigorous methodologies for assessing quality or satis• studies exploring the demand side, including motivatio• Gender-disaggregated impact assessment of reforms
f
The above-mentioned studies highlight severalneeds:• affirmative action and policy shift to enableresearch and extension to focus more on women;• role models within the agricultural extensionservice systems to make the contribution ofwomen visible at every opportunity, in multipleways, and in as many venues as possible;• provide leadership training to increase women’scapacity to leverage and negotiate;• increase educational opportunities for womenwho wish to study in the field of agriculture;• midcareer women to improve their skills andcompetencies. Extension organizations mustencourage and recruit more female extensionagents, who were found to be more effective thanmale extension agents in reaching female farmers.• evolve strategies that will help male agents towork better with women farmers. Because womenhave disproportionately fewer advantages thanmen, programs that specifically target femalehousehold members will be important.• Some initiatives that would help include creatingpolicies to increase assets for the resource-poor, s• scale up pockets of success from gender-respons
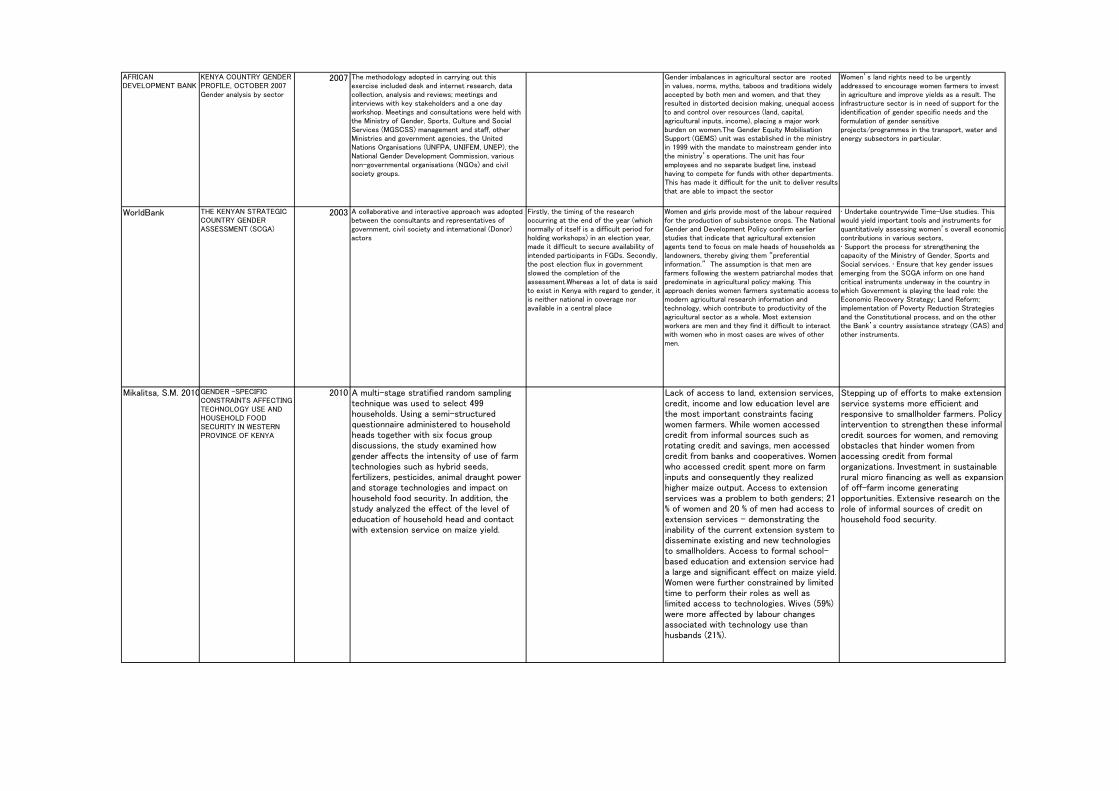
AFRICANDEVELOPMENT BANK
KENYA COUNTRY GENDERPROFILE, OCTOBER 2007Gender analysis by sector
2007 The methodology adopted in carrying out thisexercise included desk and internet research, datacollection, analysis and reviews; meetings andinterviews with key stakeholders and a one dayworkshop. Meetings and consultations were held withthe Ministry of Gender, Sports, Culture and SocialServices (MGSCSS) management and staff, otherMinistries and government agencies, the UnitedNations Organisations (UNFPA, UNIFEM, UNEP), theNational Gender Development Commission, variousnon-governmental organisations (NGOs) and civilsociety groups.
Gender imbalances in agricultural sector are rootedin values, norms, myths, taboos and traditions widelyaccepted by both men and women, and that theyresulted in distorted decision making, unequal accessto and control over resources (land, capital,agricultural inputs, income), placing a major workburden on women.The Gender Equity MobilisationSupport (GEMS) unit was established in the ministryin 1999 with the mandate to mainstream gender intothe ministry’s operations. The unit has fouremployees and no separate budget line, insteadhaving to compete for funds with other departments.This has made it difficult for the unit to deliver resultsthat are able to impact the sector
Women’s land rights need to be urgentlyaddressed to encourage women farmers to investin agriculture and improve yields as a result. Theinfrastructure sector is in need of support for theidentification of gender specific needs and theformulation of gender sensitiveprojects/programmes in the transport, water andenergy subsectors in particular.
WorldBank THE KENYAN STRATEGICCOUNTRY GENDERASSESSMENT (SCGA)
2003 A collaborative and interactive approach was adoptedbetween the consultants and representatives ofgovernment, civil society and international (Donor)actors
Firstly, the timing of the researchoccurring at the end of the year (whichnormally of itself is a difficult period forholding workshops) in an election year,made it difficult to secure availability ofintended participants in FGDs. Secondly,the post election flux in governmentslowed the completion of theassessment.Whereas a lot of data is saidto exist in Kenya with regard to gender, itis neither national in coverage noravailable in a central place
Women and girls provide most of the labour requiredfor the production of subsistence crops. The NationalGender and Development Policy confirm earlierstudies that indicate that agricultural extensionagents tend to focus on male heads of households aslandowners, thereby giving them “preferentialinformation.” The assumption is that men arefarmers following the western patriarchal modes thatpredominate in agricultural policy making. Thisapproach denies women farmers systematic access tomodern agricultural research information andtechnology, which contribute to productivity of theagricultural sector as a whole. Most extensionworkers are men and they find it difficult to interactwith women who in most cases are wives of othermen.
• Undertake countrywide Time-Use studies. Thiswould yield important tools and instruments forquantitatively assessing women’s overall economiccontributions in various sectors,• Support the process for strengthening thecapacity of the Ministry of Gender, Sports andSocial services. • Ensure that key gender issuesemerging from the SCGA inform on one handcritical instruments underway in the country inwhich Government is playing the lead role: theEconomic Recovery Strategy; Land Reform;implementation of Poverty Reduction Strategiesand the Constitutional process, and on the otherthe Bank’s country assistance strategy (CAS) andother instruments.
Mikalitsa, S.M. 2010GENDER -SPECIFICCONSTRAINTS AFFECTINGTECHNOLOGY USE ANDHOUSEHOLD FOODSECURITY IN WESTERNPROVINCE OF KENYA
2010 A multi-stage stratified random samplingtechnique was used to select 499households. Using a semi-structuredquestionnaire administered to householdheads together with six focus groupdiscussions, the study examined howgender affects the intensity of use of farmtechnologies such as hybrid seeds,fertilizers, pesticides, animal draught powerand storage technologies and impact onhousehold food security. In addition, thestudy analyzed the effect of the level ofeducation of household head and contactwith extension service on maize yield.
Lack of access to land, extension services,credit, income and low education level arethe most important constraints facingwomen farmers. While women accessedcredit from informal sources such asrotating credit and savings, men accessedcredit from banks and cooperatives. Womenwho accessed credit spent more on farminputs and consequently they realizedhigher maize output. Access to extensionservices was a problem to both genders; 21% of women and 20 % of men had access toextension services - demonstrating theinability of the current extension system todisseminate existing and new technologiesto smallholders. Access to formal school-based education and extension service hada large and significant effect on maize yield.Women were further constrained by limitedtime to perform their roles as well aslimited access to technologies. Wives (59%)were more affected by labour changesassociated with technology use thanhusbands (21%).
Stepping up of efforts to make extensionservice systems more efficient andresponsive to smallholder farmers. Policyintervention to strengthen these informalcredit sources for women, and removingobstacles that hinder women fromaccessing credit from formalorganizations. Investment in sustainablerural micro financing as well as expansionof off-farm income generatingopportunities. Extensive research on therole of informal sources of credit onhousehold food security.
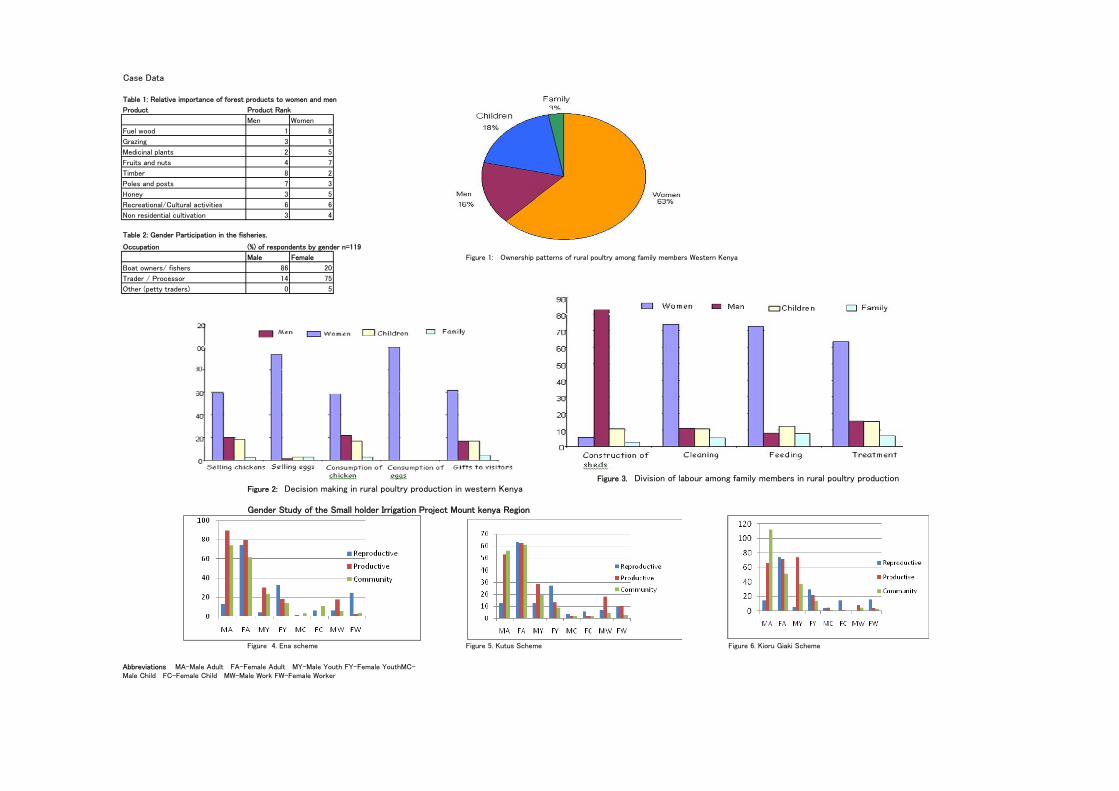
Case Data
Table 1: Relative importance of forest products to women and men
Product Product Rank
Men Women
Fuel wood 1 8
Grazing 3 1
Medicinal plants 2 5
Fruits and nuts 4 7
Timber 8 2
Poles and posts 7 3
Honey 3 5
Recreational/Cultural activities 6 6
Non residential cultivation 3 4
Occupation (%) of respondents by gender n=119
Male Female Figure 1: Ownership patterns of rural poultry among family members Western Kenya
Boat owners/ fishers 86 20
Trader / Processor 14 75
Other (petty traders) 0 5
Abbreviations MA-Male Adult FA-Female Adult MY-Male Youth FY-Female YouthMC-Male Child FC-Female Child MW-Male Work FW-Female Worker
Table 2: Gender Participation in the fisheries.
Figure 2: Decision making in rural poultry production in western KenyaFigure 3. Division of labour among family members in rural poultry production
Figure 4. Ena scheme
Gender Study of the Small holder Irrigation Project Mount kenya Region
Figure 5. Kutus Scheme Figure 6. Kioru Giaki Scheme