mapping local economic development: a case study from the ... · the wild coast spatial development...
TRANSCRIPT

Thesis TH-ZA-sm-02
South Africa
Mapping local economic development:
a case study from the Wild Coast, South Africa
Steven Mitchell

UNIVERSIDAD AUTONOMA DE GUERRERO
CENTRO DE INVESTIGACION DE ENFERMEDADESTROPICALES
Mapping local economic development:a case study from the Wild Coast, South Africa
STEVEN PAUL MITCHELL
THESIS
Submitted in partial fulfilment of theMasters of Medical Science Degree
in Applied Epidemiology

2
Masters of Medical Science Degree
in Applied Epidemiology
JURY
PRESIDENT _________________________________________________
SECRETARY _________________________________________________
FIRST VOCAL _______________________________________________

3
Acknowledgements
The Wild Coast Spatial Development Initiative (SDI) evaluation project was
designed in 1997 by CIET in collaboration with the Canadian International
Development Research Centre (IDRC), the Eastern Cape Socio-economic
Consultative Council (Ecsecc) and other SDI stakeholders. The 1997 baseline
survey was implemented under the supervision of Kate Galt and Dr Neil
Andersson. Fieldwork for the 1999 school-based survey and 2000 impact
assessment survey was coordinated by Serge Merhi and Marietjie Myburg, with
supervision by Dr Neil Andersson.
The most valuable contributors to this thesis are the grade 12 students who
participated in the mapping exercise and the 2475 households who provided
information about their daily lives. The author also gratefully acknowledges the
teachers, principals, and community leaders who provided information about their
communities and suggested possible solutions to their problems; the owners of
small businesses who shared details of their enterprises; and the participants of
the gender stratified focus groups who provided insights the household survey
could not address.
Extra recognition is due to field supervisors Thamie Mokoena and Ncumisa

4
Ngxowa for their relentless facilitation and quality control during the fieldwork.
Special thanks is also due to Dr Neil Andersson of CIET for the design and
oversight of the fieldwork, and his guidance and input during the writing of this
thesis.
The author was not directly involved in the fieldwork or analysis of the 1997
baseline survey but contributed maps from this cycle. During the 1999 school-
based survey, the author contributed to the design and administration of the
interactive mapping exercise, a task which included symbol design and generation
of the basemaps. He collated the maps into a geographic information system
(GIS) and produced a set of maps for each community for further discussion and
feedback. In collaboration with other CIET colleagues he prepared the final maps
for the Year 2000 calendars and took a lead role in the final analysis and reporting
for this cycle.
During the 2000 impact assessment, the author contributed to the design and
modification of the instruments, supervision of the field team, and data quality
assurance. As with the 1999 survey, he took a lead role in the analysis of the data,
writing of the final report, and production of maps.
The Wild Coast Spatial Development Initiative evaluation project was funded by
the IDRC – The Wild Coast SDI: a community-based planning support platform for

5
SMEs. File no: 97-8906-01. It was designed as a three-year initiative to document
and evaluate the impact of the SDI and the proposed investment focus on local
economic development “anchor projects.”

6
Table of Contents
Acknowledgements . . . . . . . . . . . . . . . . . . . . . . . . . . . . . . . . . . . . . . . . . . . . . . . . . . . . . . . . . . . . . . . 3Abstract . . . . . . . . . . . . . . . . . . . . . . . . . . . . . . . . . . . . . . . . . . . . . . . . . . . . . . . . . . . . . . . . . . . . . . . . . . . 9Summary . . . . . . . . . . . . . . . . . . . . . . . . . . . . . . . . . . . . . . . . . . . . . . . . . . . . . . . . . . . . . . . . . . . . . . . . . 10List of figures . . . . . . . . . . . . . . . . . . . . . . . . . . . . . . . . . . . . . . . . . . . . . . . . . . . . . . . . . . . . . . . . . . . . . 17List of tables . . . . . . . . . . . . . . . . . . . . . . . . . . . . . . . . . . . . . . . . . . . . . . . . . . . . . . . . . . . . . . . . . . . . . . 18Terms used . . . . . . . . . . . . . . . . . . . . . . . . . . . . . . . . . . . . . . . . . . . . . . . . . . . . . . . . . . . . . . . . . . . . . . 19
1. Introduction . . . . . . . . . . . . . . . . . . . . . . . . . . . . . . . . . . . . . . . . . . . . . . . . . . . . . . . . . . . . . . . . . . . . 20
2. A review of existing literature . . . . . . . . . . . . . . . . . . . . . . . . . . . . . . . . . . . . . . . . . . . . . . . . . . 222.1 Local economic development . . . . . . . . . . . . . . . . . . . . . . . . . . . . . . . . . . . . . . . . . . . . . 22
2.1.1 Growth pole theory . . . . . . . . . . . . . . . . . . . . . . . . . . . . . . . . . . . . . . . . . . . . . . . 222.1.2 LED strategies and entrepreneurship . . . . . . . . . . . . . . . . . . . . . . . . . . . . . 242.1.3 Small and micro-enterprises . . . . . . . . . . . . . . . . . . . . . . . . . . . . . . . . . . . . . . 262.1.4 Spatial development initiatives . . . . . . . . . . . . . . . . . . . . . . . . . . . . . . . . . . . 30
2.2 The use of geomatics in planning . . . . . . . . . . . . . . . . . . . . . . . . . . . . . . . . . . . . . . . . . 33
3. The CIET methods . . . . . . . . . . . . . . . . . . . . . . . . . . . . . . . . . . . . . . . . . . . . . . . . . . . . . . . . . . . . 353.1 Training and piloting . . . . . . . . . . . . . . . . . . . . . . . . . . . . . . . . . . . . . . . . . . . . . . . . . . . . . . 363.2 Informed consent and confidentiality . . . . . . . . . . . . . . . . . . . . . . . . . . . . . . . . . . . . . 373.3 Data entry and analysis . . . . . . . . . . . . . . . . . . . . . . . . . . . . . . . . . . . . . . . . . . . . . . . . . . . 383.4 Mapping . . . . . . . . . . . . . . . . . . . . . . . . . . . . . . . . . . . . . . . . . . . . . . . . . . . . . . . . . . . . . . . . . . 393.5 Feedback and communication . . . . . . . . . . . . . . . . . . . . . . . . . . . . . . . . . . . . . . . . . . . . 40
4. Background on the Wild Coast SDI . . . . . . . . . . . . . . . . . . . . . . . . . . . . . . . . . . . . . . . . . . . . 414.1 The Wild Coast region . . . . . . . . . . . . . . . . . . . . . . . . . . . . . . . . . . . . . . . . . . . . . . . . . . . . 414.2 The Wild Coast SDI . . . . . . . . . . . . . . . . . . . . . . . . . . . . . . . . . . . . . . . . . . . . . . . . . . . . . . . 424.3 The baseline survey (1997/98) . . . . . . . . . . . . . . . . . . . . . . . . . . . . . . . . . . . . . . . . . . . 44
5. Impact assessment of the Wild Coast SDI (2000) . . . . . . . . . . . . . . . . . . . . . . . . . . . . . 465.1 The 2000 sample . . . . . . . . . . . . . . . . . . . . . . . . . . . . . . . . . . . . . . . . . . . . . . . . . . . . . . . . . 465.2 Data collection instruments . . . . . . . . . . . . . . . . . . . . . . . . . . . . . . . . . . . . . . . . . . . . . . . 47
5.2.1 Household questionnaire . . . . . . . . . . . . . . . . . . . . . . . . . . . . . . . . . . . . . . . . . 475.2.2 SME questionnaire . . . . . . . . . . . . . . . . . . . . . . . . . . . . . . . . . . . . . . . . . . . . . . . 475.2.3 Community review and focus groups . . . . . . . . . . . . . . . . . . . . . . . . . . . . . 48
5.3 Key findings . . . . . . . . . . . . . . . . . . . . . . . . . . . . . . . . . . . . . . . . . . . . . . . . . . . . . . . . . . . . . . . 495.3.1 Demographic structure of the sample . . . . . . . . . . . . . . . . . . . . . . . . . . . . 495.3.2 Lack of knowledge of the SDI . . . . . . . . . . . . . . . . . . . . . . . . . . . . . . . . . . . . 495.3.3 Households’ main problems . . . . . . . . . . . . . . . . . . . . . . . . . . . . . . . . . . . . . . 505.3.4 Positive views of education . . . . . . . . . . . . . . . . . . . . . . . . . . . . . . . . . . . . . . . 51

7
5.3.5 Use and costs of health care services . . . . . . . . . . . . . . . . . . . . . . . . . . . . 525.3.6 Use and costs of administration services . . . . . . . . . . . . . . . . . . . . . . . . . 535.3.7 Increased cost of public transport . . . . . . . . . . . . . . . . . . . . . . . . . . . . . . . . 545.3.8 Increased use and cost of telephones . . . . . . . . . . . . . . . . . . . . . . . . . . . . 545.3.9 Decreased levels of food security . . . . . . . . . . . . . . . . . . . . . . . . . . . . . . . . 555.3.10 Employment and income . . . . . . . . . . . . . . . . . . . . . . . . . . . . . . . . . . . . . . . . 565.3.11 Small business ownership . . . . . . . . . . . . . . . . . . . . . . . . . . . . . . . . . . . . . . . 575.3.12 Increased credits and loans . . . . . . . . . . . . . . . . . . . . . . . . . . . . . . . . . . . . . 58
5.4 Discussion of key findings . . . . . . . . . . . . . . . . . . . . . . . . . . . . . . . . . . . . . . . . . . . . . . . . 595.4.1 Lack of impact from the SDI . . . . . . . . . . . . . . . . . . . . . . . . . . . . . . . . . . . . . . 595.4.2 Decreased trust in government services . . . . . . . . . . . . . . . . . . . . . . . . . 605.4.3 Unemployment and lack of ownership . . . . . . . . . . . . . . . . . . . . . . . . . . . . 605.4.4 Increased credits and loans . . . . . . . . . . . . . . . . . . . . . . . . . . . . . . . . . . . . . . 61
5.5 Recommendations . . . . . . . . . . . . . . . . . . . . . . . . . . . . . . . . . . . . . . . . . . . . . . . . . . . . . . . . 62
6. Mapping local economic activity (1999) . . . . . . . . . . . . . . . . . . . . . . . . . . . . . . . . . . . . . . . 636.1 The school sample . . . . . . . . . . . . . . . . . . . . . . . . . . . . . . . . . . . . . . . . . . . . . . . . . . . . . . . 646.2 Data collection instruments . . . . . . . . . . . . . . . . . . . . . . . . . . . . . . . . . . . . . . . . . . . . . . . 64
6.2.1 Student mapping exercise . . . . . . . . . . . . . . . . . . . . . . . . . . . . . . . . . . . . . . . . 646.2.2 Self-administered student questionnaire . . . . . . . . . . . . . . . . . . . . . . . . . 666.2.3 Student focus group discussions . . . . . . . . . . . . . . . . . . . . . . . . . . . . . . . . . 66
6.3 Key findings . . . . . . . . . . . . . . . . . . . . . . . . . . . . . . . . . . . . . . . . . . . . . . . . . . . . . . . . . . . . . . . 676.3.1 Service and production-related businesses . . . . . . . . . . . . . . . . . . . . . . 676.3.2 Male and female-owned businesses . . . . . . . . . . . . . . . . . . . . . . . . . . . . . 686.3.3 Spatial patterns of small businesses . . . . . . . . . . . . . . . . . . . . . . . . . . . . . 686.3.4 Consideration of small business ownership . . . . . . . . . . . . . . . . . . . . . . 696.3.5 Attitudes towards businesses . . . . . . . . . . . . . . . . . . . . . . . . . . . . . . . . . . . . . 696.3.6 Knowledge of the Wild Coast SDI . . . . . . . . . . . . . . . . . . . . . . . . . . . . . . . . 706.3.7 The role of education . . . . . . . . . . . . . . . . . . . . . . . . . . . . . . . . . . . . . . . . . . . . . 706.3.8 Attitudes towards women . . . . . . . . . . . . . . . . . . . . . . . . . . . . . . . . . . . . . . . . . 71
6.4 Discussion of key findings . . . . . . . . . . . . . . . . . . . . . . . . . . . . . . . . . . . . . . . . . . . . . . . . 716.4.1 Distribution of small and micro-enterprises . . . . . . . . . . . . . . . . . . . . . . . 716.4.2 Constraints to small business development . . . . . . . . . . . . . . . . . . . . . . 736.4.3 The role of women . . . . . . . . . . . . . . . . . . . . . . . . . . . . . . . . . . . . . . . . . . . . . . . . 75
6.5 Recommendations . . . . . . . . . . . . . . . . . . . . . . . . . . . . . . . . . . . . . . . . . . . . . . . . . . . . . . . . 766.5.1 Curricular reform . . . . . . . . . . . . . . . . . . . . . . . . . . . . . . . . . . . . . . . . . . . . . . . . . . 766.5.2 Provincial roll-out of the mapping exercise . . . . . . . . . . . . . . . . . . . . . . . 776.5.3 Increased women’s participation . . . . . . . . . . . . . . . . . . . . . . . . . . . . . . . . . 77
7. Conclusion . . . . . . . . . . . . . . . . . . . . . . . . . . . . . . . . . . . . . . . . . . . . . . . . . . . . . . . . . . . . . . . . . . . . . 787.1 Failure of the Wild Coast SDI . . . . . . . . . . . . . . . . . . . . . . . . . . . . . . . . . . . . . . . . . . . . . 78
7.1.1 Knowledge of the SDI . . . . . . . . . . . . . . . . . . . . . . . . . . . . . . . . . . . . . . . . . . . . 787.1.2 Basic services . . . . . . . . . . . . . . . . . . . . . . . . . . . . . . . . . . . . . . . . . . . . . . . . . . . . 79

8
7.1.3 Food security . . . . . . . . . . . . . . . . . . . . . . . . . . . . . . . . . . . . . . . . . . . . . . . . . . . . . 797.1.4 Employment . . . . . . . . . . . . . . . . . . . . . . . . . . . . . . . . . . . . . . . . . . . . . . . . . . . . . . 807.1.5 The culture of SMEs . . . . . . . . . . . . . . . . . . . . . . . . . . . . . . . . . . . . . . . . . . . . . . 80
7.2 The role of geomatics . . . . . . . . . . . . . . . . . . . . . . . . . . . . . . . . . . . . . . . . . . . . . . . . . . . . . 817.2.1 Data collection . . . . . . . . . . . . . . . . . . . . . . . . . . . . . . . . . . . . . . . . . . . . . . . . . . . . 817.2.2 Representation of key findings . . . . . . . . . . . . . . . . . . . . . . . . . . . . . . . . . . . 837.2.3 Feedback and communication . . . . . . . . . . . . . . . . . . . . . . . . . . . . . . . . . . . . 84
8. Figures . . . . . . . . . . . . . . . . . . . . . . . . . . . . . . . . . . . . . . . . . . . . . . . . . . . . . . . . . . . . . . . . . . . . . . . . 86
9. Tables . . . . . . . . . . . . . . . . . . . . . . . . . . . . . . . . . . . . . . . . . . . . . . . . . . . . . . . . . . . . . . . . . . . . . . . . . 98
10. References . . . . . . . . . . . . . . . . . . . . . . . . . . . . . . . . . . . . . . . . . . . . . . . . . . . . . . . . . . . . . . . . . . 111
Annexes
A1 Wild Coast SDI cycle 2 main indicators (1999) . . . . . . . . . . . . . . . . . . . . . . . . . . . . A1-1A2 Atlas of Wild Coast SDI cycle 2 (1999) . . . . . . . . . . . . . . . . . . . . . . . . . . . . . . . . . . . . A2-1
B1 Wild Coast SDI cycle 3 main indicators (2000) . . . . . . . . . . . . . . . . . . . . . . . . . . . . B1-1B2 Atlas of Wild Coast SDI cycle 3 (2000) . . . . . . . . . . . . . . . . . . . . . . . . . . . . . . . . . . . . B2-1

9
Abstract
Over the course of three research cycles CIET evaluated local economic
development in the Wild Coast, South Africa, and the impact of the Spatial
Development Initiative (SDI). As a follow-up to the baseline study, a school-based
student survey and mapping exercise was conducted in 1999 to begin an informed
dialogue on small and micro-enterprises (SMEs) in the SDI. An impact
assessment survey was also conducted in 2000, providing a follow-up to the 1997
survey. The Wild Coast SDI showed little sign of improving local economic
development in the region. There was a lack of knowledge of the project in the
communities, no improvement in basic needs, decreasing levels of food security,
higher levels of unemployment, and a weak culture of small business
development. Geomatics tools were used extensively during the evaluation and
provided an important contribution to the evidence-based planning process.

10
Summary
1. Introduction
The primary objective of this thesis was to evaluate the impact of the Wild Coast
Spatial Development Initiative. This was measured through several key indicators
including local knowledge of the project; coverage of basic services; food security;
increased employment and an emerging “culture” of small and micro-enterprises
(SMEs). A second objective focussed on demonstrating the possible use of
geomatics as an important tool for local economic development planning.
This thesis was based upon the three cycle research project on local economic
development in the Wild Coast SDI. The first cycle (1997) established baseline
levels of socio-economic indicators such as employment, income, health and
education. The second cycle (1999) involved a school-based mapping exercise
and questionnaire. The impact assessment survey (2000) provided a follow-up to
the baseline.
2. A review of existing literature
The existing literature concerning economic development is widespread. The

11
growth pole theory recognized that development did not happen the same
everywhere, and based its strategies upon key propulsive firms that grow through
innovation and create linkages with other enterprises. However, criticism of this
“top down approach” led to the adoption of local economic development strategies
that stressed the need for local entrepreneurship and other endogenous solutions
to economic problems. A key component of this are SMEs, which are key to local
development but face many challenges and obstacles. The Spatial Development
Initiative programmes were started by the South African government to generate
economic activity and growth, and encourage the development of SMEs. While
theories and intentions about the SDIs were well documented, there was a lack of
literature reporting on the real progress or failure of the SDIs based on empirical
evidence.
Literature on the use of geomatics in planning primarily focussed on the technical
advantages that it provides. Geographic information systems can be used to store
and organise large amounts of geographically referenced data, and provide many
modelling and spatial analysis capabilities.
3. The CIET methods
Data were collected and analysed using the CIET methods. As part of these

12
methods, epidemiological data were collected through modern research
techniques and analysed to provide a platform for evidence-based planning.
Research was conducted in sample communities which were weighted during
analysis to bring them into proportion with the population being studied.
Instruments were piloted extensively before being implemented and consent was
granted before the research took place. Confidentiality was maintained to protect
both the individuals and the communities. Once data were analysed, findings were
shared with the communities and planners through maps, focus groups, and
reports.
4. Background on the Wild Coast SDI
The Wild Coast region is located in the northeast corner of the Eastern Cape
province in the area known as the former Transkei. Due to years of neglect and
out-migration of labour to the mines, the population is predominantly female, poor,
and unemployed. It is a largely rural area with little access to clean water or
infrastructure. The South African Government started the Wild Coast SDI in 1997
in an attempt to provoke economic growth through public and private investment of
small and micro-enterprises. Its primary objectives included increased
employment, increased entrepreneurship in SMEs and community empowerment.
Four coastal anchor areas were identified which were intended to be the focus for
investment. A baseline survey in 1997 showed that people in the Wild Coast SDI

13
were unaware of what they could do to improve their socio-economic conditions.
There were high levels of unemployment, a low proportion of households getting
their water from protected sources, a lack of food security, a significant level of
corruption in the public services, and little knowledge of the SDI project itself.
5. Impact assessment of the Wild Coast SDI (2000)
A survey conducted in 2000 evaluated the impact of the SDI project since it began
in 1997. The sample was selected and weighted for analysis based upon existing
census documentation and other relevant materials. Sites were selected to
represent the population from both anchor and non-anchor areas. Typical data
collection instruments included household questionnaires, key informant
interviews, community reviews, and focus groups. After preliminary analysis, data
were returned to the communities for discussion and feedback.
During the fieldwork, CIETafrica revisited the same 20 communities that were
selected for the baseline and conducted a follow-up survey with households and
small businesses. Overall knowledge of the SDI project had not changed and
there had been no measurable improvement in basic services (such as water)
since 1997. There was increased unemployment among adults, wages were lower
among those who were working, and there was no evidence of an increase in
small business development. Existing small businesses complained of a

14
decreasing customer base, more people buying on credit, and inflated interest
rates on business loans. The main conclusion from the impact assessment was
that the SDI was not meeting its basic objectives. Recommendations were made
calling for a shift to change the SDI perspective from an investment driven initiative
to one with a focus on local skills building and incentives.
6. Mapping local economic activity (1999)
In August 1999 CIETafrica and the Eastern Cape Socio-economic Consultative
Council (Ecsecc) conducted a school-based research cycle and mapping exercise
with grade 12 students in the SDI region in an attempt to begin an informed
dialogue on SMEs. The main objective of this exercise was to document all
income generating activity in the area and to understand some of the factors that
impact on small business development, in order to identify the “culture of SMEs”.
Students took part in a mapping exercise, a self-administered questionnaire, and
student focus groups. There was a dominance of service-related businesses and
no less than two businesses owned by a male for every business owned by a
female. There was a low proportion of students who had considered starting their
own businesses, claiming a lack of finances and knowledge as the main reasons
why. Information from the mapping exercise, questionnaire and focus groups were
presented back to the students in the form of a Year 2000 calendar. As a result,
the students suggested there was a need for a change in the curriculum to

15
address these issues and provide hands-on business skills. Other
recommendations included a provincial roll-out of the mapping exercise and
increased women’s participation in local development.
7. Conclusion
Three research cycles in the Wild Coast provided evidence of the failure of the
SDI. This was measured through five main findings: first, local awareness of the
SDI was low implying that little had been done to promote the project in the
communities. Secondly, there was a lack of improvement in basic needs such as
access to clean water and increasing distrust of government services. Thirdly,
there has been a decrease in the levels of food security with many communities
struggling to produce food for survival. Fourthly, increasing levels of
unemployment indicated that the SDI had failed to address its key objectives.
Lastly, there was a lack of a culture of SMEs with little consideration or attempt of
starting one’s own business.
Geomatics tools were used extensively during the evaluation of the SDI. Maps
were used as an important data collection instrument for the school-based survey.
Students used maps to locate all income generating enterprises in their
communities, and then commented on the trends and patterns they saw emerging.
Raster maps were also used to visually represent the key findings from the

16
research cycles. The visual representation of data was also helpful while
communicating the results back to the communities and other stakeholders.
Results from the school-based exercise were collated into a Year 2000 calendar
for the students, and time-series maps were included in the impact assessment
report. Together, the maps and calendars provided further visual evidence that the
SDI was not meeting its objectives.

17
List of figures
Figure Page
1. Map of the Wild Coast region showing roads and towns . . . . . . . . . . . . . . . . . 86
2. Map showing the location of the four anchor areas in the Wild Coast . . . . . . . . . . . . . . . . . . . . . . . . . . . . . . . . . . . . . . . . . . . . . . . . . . . . . . . . . . . 87
3. The demographic structure of the sample - 2000(number of people) . . . . . . . . . . . . . . . . . . . . . . . . . . . . . . . . . . . . . . . . . . . . . . . . . . . . . . . 88
4. Percent of respondents who felt they had a say in the SDI(among those who had heard of it) . . . . . . . . . . . . . . . . . . . . . . . . . . . . . . . . . . . . . . . 89
5. Map showing household access to protected sources of water (2000) . . . . . . . . . . . . . . . . . . . . . . . . . . . . . . . . . . . . . . . . . . . . . . . . . . . . . . . . . . . 90
6. Percent of the adult population who worked for income in the month prior to the survey . . . . . . . . . . . . . . . . . . . . . . . . . . . . . . . . . . 91
7. Percent of the adult population who are currently looking for work - by employment status (2000) . . . . . . . . . . . . . . . . . . . . . . . . . 92
8. Percent of households who currently have loans or credit . . . . . . . . . . . . . . . 93
9. Sample page from the Wild Coast Year 2000 calendar . . . . . . . . . . . . . . . . . . 94
10. Gender and ownership of small businesses in theWild Coast SDI - 1999 . . . . . . . . . . . . . . . . . . . . . . . . . . . . . . . . . . . . . . . . . . . . . . . . . . . 95
11. A 3D portrayal of business density in the Wild Coast SDI - 1999
(number of businesses per 10,000 people) . . . . . . . . . . . . . . . . . . . . . . . . . . . . . . 96
12. Students who had heard of the Wild Coast SDI - 1999 (percent in each district) . . . . . . . . . . . . . . . . . . . . . . . . . . . . . . . . . . . . . . . . . . . . 97

18
List of tables
Table Page
1. Information about the SDI: % (number) of households whofound out about the SDI from each source . . . . . . . . . . . . . . . . . . . . . . . . . . . . . . . 98
2. Satisfaction with the education system - 2000 . . . . . . . . . . . . . . . . . . . . . . . . . . . . 99
3. Average yearly costs of education per student including school fees, books, and uniforms (anchor and non-anchor areas) - 2000 . . . . . . 100
4. Use and cost of health services (among those whose last visit was within the month prior to the survey - 2000 . . . . . . . . . . . . . . . . . . . . . . . . . 101
5. Satisfaction with health services (anchor and non-anchor
areas) - 2000 . . . . . . . . . . . . . . . . . . . . . . . . . . . . . . . . . . . . . . . . . . . . . . . . . . . . . . . . . . . . 102
6. Use and cost of government administration services (among those who had used them within the last year) - 2000 . . . . . . . . . . . . . . . . . . . 103
7. Use and cost of public transport services (among those who had used them within the last month) - 2000 . . . . . . . . . . . . . . . . . . . . . . . . . . . . 104
8. Household food security: average value of food produced and sold/traded among those who produced/sold food and percent (number) of households who sold surplus food . . . . . . . . . . . . . . . . . . . . . . . . . . 105
9. Level of education and employment – 2000 . . . . . . . . . . . . . . . . . . . . . . . . . . . . . 106
10. Household access to credits and loans (anchor and non-anchor areas) – 2000 . . . . . . . . . . . . . . . . . . . . . . . . . . . . . . . . . . . . . . . . . . . . . . . 107
11. Service and production-related businesses - 1999 . . . . . . . . . . . . . . . . . . . . . . 108
12. Reasons for students not starting their own businesses - 1999 . . . . . . . . . 109
13. Students’ attitudes towards businesses - 1999 . . . . . . . . . . . . . . . . . . . . . . . . . . 110

19
Terms used
ABET . . . . . . . . . . . . . . . . . . . . . . . . . . . . . . . . . . Adult basic education and training program
CI . . . . . . . . . . . . . . . . . . . . . . . . . . . . . . . . . . . . . . . . . . . . . . . . . . . . . . . . . . . . . . . Confidence interval
CIET . . . . . . . . . . . . . . . . . . . Community Information, Empowerment and Transparency
DBSA . . . . . . . . . . . . . . . . . . . . . . . . . . . . . . . . . . . . . . . . Development Bank of Southern Africa
ECSECC . . . . . . . . . . . . . . . . . . . . . Eastern Cape Socio-economic Consultative Council
GIS . . . . . . . . . . . . . . . . . . . . . . . . . . . . . . . . . . . . . . . . . . . . . . . . . Geographic information system
IDRC . . . . . . . . . . . . . . . . . . Canadian International Development and Research Centre
LED . . . . . . . . . . . . . . . . . . . . . . . . . . . . . . . . . . . . . . . . . . . . . . . . . . Local economic development
M-H . . . . . . . . . . . . . . . . . . . . . . . . . . . . . . . . . . . . . . . . . . . . . . . . . . . . Mantel-Haenszel chi-square
OR . . . . . . . . . . . . . . . . . . . . . . . . . . . . . . . . . . . . . . . . . . . . . . . . . . . . . . . . . . . . . . . . . . . . . . .Odds ratio
SDI . . . . . . . . . . . . . . . . . . . . . . . . . . . . . . . . . . . . . . . . . . . . . . . . . . . Spatial development initiative
SME . . . . . . . . . . . . . . . . . . . . . . . . . . . . . . . . . . . . . . . . . . . . . . . . . . . Small and micro-enterprises

20
1. Introduction
The primary objective of this thesis was to evaluate the impact of the Wild Coast
SDI. Its performance was measured through several key indicators. The first was
the overall community knowledge of the initiative itself. Levels of local knowledge
demonstrated what measures were taken to achieve local buy-in of the project and
what levels of local empowerment could be expected. Secondly, coverage levels
of basic services and food security indicated whether or not the initiative was
addressing its primary needs. Little development could be expected if the
population was unhealthy and struggling to survive. Levels of employment and
local attitudes towards small business development also determined whether or
not the current strategy of the SDI was having an impact or if a planning change
was needed.
The second objective of this thesis was to provide a demonstration of the use of
geomatics as an important tool for local economic development planning and
community-based research. This was achieved by highlighting its contribution to
the data collection process; the representation of key findings; and its role in
feedback and communication.

21
The methods and results described in this thesis were based upon the three cycle
evaluation project on local economic development (LED) in the Wild Coast Spatial
Development Initiative (SDI), 1997-2000.
The 1997 survey provided a baseline of household information about health,
education and other basic services; employment and income; and access to local
decision-making processes. In addition, existing small-business owners were
interviewed and provided information about the daily operations of their
enterprises and their struggles for survival.
The 1999 school-based survey interviewed grade 12 students about their
perceptions of small business development and their plans for employment in the
future. This consisted of a self-administered questionnaire and a mapping exercise
designed to identify income-generating businesses and to provoke discussion.
The 2000 impact assessment evaluated local economic development in the Wild
Coast since the SDI project began in 1997. The data collection instruments were
designed based upon the tools used in the baseline survey and the same
communities were revisited.

22
2. A review of existing literature
2.1 Local economic development
There has been extensive literature written relating to economic growth in
developing countries. This review discusses three themes relating to economic
development strategies: growth pole theory; LED strategies and the role of
entrepreneurship; and small and micro-enterprises. This leads to an overview of
the spatial development initiatives in South Africa.
2.1.1 Growth pole theory
The basis for the growth pole theory was first established by French economist
Francois Perroux in his description of "economic spaces.” Perroux (1950)1 lays the
groundwork for the theory by claiming that "economic space consists of centres (or
poles or foci) from which centrifugal forces emanate and to which centripetal
forces are attracted."
But as Thomas (1972)2 explains, Perroux solidified his theory of growth poles in a
1955 article titled "Note sur la notion de pole de croissance.” In this article, Perroux
claims that economic growth is unbalanced, developing initially in lead "poles" and

23
then disseminating to other parts of the region or country. At the center of these
poles (often located in urban settings) are propulsive and key firms, which provide
the basis for development and growth through innovations and linkages with other
enterprises. Thomas is clear to point out, though, that "Perroux does not confine
the notion of growth induced to a highly localized geographical area" but instead
claims it can extend throughout an abstract space (such as the national economy).
Over time, many development theorists argued that growth poles and geography
were naturally linked. Parr (1999)3 claims this led to the notion of "planned" growth
poles, which involved purposely directing investment into potentially propulsive
firms and infrastructure. This was done with the hope of emulating some of the
advantages of the natural growth poles that were emerging in some cases (such
as shared infrastructure and a build up of skilled labour). The author describes four
main characteristics of growth pole strategy: encouraging growth of employment
and population in a concentrated area; a limitation on the number of poles;
identification of areas with the inherent potential for sustaining various enterprises;
and the modification of the spatial structure (employment and population) within a
region.
Parr admits, however, that these initiatives have not always been successful,
stating that "the world is littered with examples of growth pole strategies having
failed or having been prematurely abandoned.” The reasons for these failures are

24
widespread but Parr offers some insight. First, a concentration of infrastructure is
not enough - infrastructure must be varied and the region in question must also
possess other advantages such as access to raw materials. Secondly, the desired
effect of the poles on the surrounding regions is often unclear. In some cases,
there is an intent for growth to expand outward from the center to the less
concentrated areas. In others, there is the expectation of a redistribution of
economic space involving a movement towards the centres and an abandonment
of the periphery.
2.1.2 LED strategies and entrepreneurship
In response to declining support for theories based on "top down approaches"
(such as the growth pole concept), development policy in the mid 1980's shifted
towards local economic development (LED) strategies designed to empower local
communities to find solutions to their economic problems. Coffey and Polese
(1984)4 place emphasis on the "local" determinants of development, referring to
the "socio-cultural and behavioural attributes of the local population" and not
necessarily the geographic factors. The authors highlight the integral role of local
entrepreneurship and knowledge in stimulating economic growth. They suggest a
four-stage model of the local development process to include the emergence of
local entrepreneurship; the expansion of local enterprises beyond the region; the
maintenance of local enterprises under local control; and establishing a strong

25
locally controlled economic sector.
In a subsequent article, the same authors (Coffey and Polese - 1985)5 claim that
local development depends upon more investment in "human capital" (including
skills development and education); policies which seek to reduce out-migration (in
order to keep skills and emerging entrepreneurs in the region); and decentralised
control. An important step in this process is the stimulation of indigenous talents.
However, the authors highlight two main constraints to this: limited access to
information, and a lack of capital. They also argue that there are many other social
factors involved in the process stating "even if it were possible to make access to
capital and information equal everywhere, this in itself would still not ensure the
emergence of local entrepreneurship." The authors argue that LED strategies
need to implement “social animation” policies designed to alter people's
behaviours, abilities, and perceptions towards local entrepreneurship. Coffey and
Polese also outline and give suggestions for two additional policy options for local
development - those that target increased funding and access to information. They
stress that each issue is not mutually exclusive and that initial emphasis should be
placed upon social animation.
Cook and Hulme (1988)6 build on these concepts while assessing the compatibility
of LED strategies and market liberalization. As part of this assessment, the
26
authors outline the fundamental components of LED claiming it "emphasizes
investment in developing the commercial skills and abilities of the local population
and changing attitudes, rather than investment in physical capital." Cook and
Hulme reinforce the ideas expressed by Coffey and Polese by identifying access
to information, increased funding, and social animation as key LED strategies. An
additional strategy, related to social animation, is encouraging the use of local
goods and services by the local population. However, the authors acknowledge
that each of these issues is complex. Financial assistance should only be directed
towards small scale enterprises that have the opportunity to succeed. Increasing
access to information is an important component but "the range of information that
might be required is almost infinite." The authors also acknowledge that there has
been a wide range of literature on entrepreneurship since the pioneering work of
J.A. Schumpeter in 1935, but argue that there is little known about the factors
involved in the actual emergence of entrepreneurship - specifically whether
entrepreneurs are "born or made."
2.1.3 Small and micro-enterprises
Entrepreneurship strategies in developing countries largely focus on the
emergence of small and micro-enterprises. The Canadian International
Development Research Centre (IDRC) states on their SME program initiative
27
website that SMEs are a key source of new jobs; are an essential source of
income for the poor, including women and other marginalised groups; and play an
important role in local and regional development initiatives7. However, IDRC also
recognizes that there are many challenges for SME sustainability and success.
These mirror the constraints to emerging entrepreneurship and include low levels
of productivity, outdated technology, limited access to credit, limited access to
information, and limited training opportunities.
McCormick (1999)8 discusses the theory that many SMEs can overcome
development restraints by operating in clusters of small businesses within close
geographic proximity. She states that there are three main advantages to
clustering: the first is “collective efficiency.” Collective efficiency, in theory,
provides an advantage for small businesses through an increase of market access
(due to external economies becoming attracted to the cluster), shared
infrastructure and joint action (such as sharing a piece of expensive equipment),
and labour pooling (higher concentration of specialized skills). Secondly, clustering
facilitates growth of enterprises in small and manageable steps. Thirdly, it makes it
easier for businesses to respond to opportunities and crises.
There are limitations to the success of clustering, however, when applied to the
realities of Africa. To discuss this McCormick reviews six case studies of clusters

28
from Kenya, Ghana and South Africa: two manufacturing garments, two vehicle
repairs, one metalwork and one fish processing. These clusters fall into three
groups: those laying the groundwork for industrialization, those in the early stages
of industrialization, and those that are part of the industrial sector. Each showed
some improvement to market access but less success with labour market pooling,
especially among the groundwork clusters. McCormick states this is due to an
overabundance of labour: “Instead of drawing workers from a pool of specialized
labour, cluster firms have relied on unskilled labour and trainees. Since they are
poorly paid, these often set up their own firms as soon as they can.” She also
states that corruption among the government institutions weakens external
economies and impedes the potential for joint action benefits.
Further studies have been conducted to understand small business births,
closures, and expansions. Mead and Liedholm (1998)9 discuss studies undertaken
in the Dominican Republic, Botswana, Kenya, Malawi, Swaziland and Zimbabwe.
Their work showed that there was a considerable number of new SMEs that were
being established (mostly as one person operations) but that little was known
about the factors that contributed to this. They also found that it was difficult to
document factors involved in business failures (since many of these businesses no
longer existed), though it was possible. Findings showed that less than half of all
SME closures were due to the business not being financially viable. In many
29
cases, the SMEs had closed for other personal reasons. They also found that
SMEs were particularly vulnerable during the first two years when owners were
still learning how to run their business. Mead and Liedholm also identify trends in
expansion of small businesses, stating that younger SMEs were more likely to
show higher rates of growth; that SMEs located in rural villages were less likely to
grow than their urban counterparts; and that SMEs on the side of the road were
more likely to grow than those conducted from within the home.
Downing (1995)10 also discusses trends of SME sustainability and growth through
comparisons between male and female owned enterprises in Lesotho, Swaziland,
South Africa and Zimbabwe. Downing states that many development strategies in
the past have ignored women with the assumption that their businesses are
“small, marginally profitable, and offer little potential for contributing to the macro-
economy.” The authors’ findings show that women’s enterprises were just as
stable and long lasting as men’s. However, female-owned enterprises tended to
grow at much slower rates than male-owned enterprises, especially in South
Africa. One explanation for this was the trend that female-owned enterprises were
more often home-based than male-owned enterprises. This provided women with
the advantage of upholding their domestic responsibilities but limited their
interaction with customers. Downing offers other possible explanations, including
the increased likelihood of female generated profits being used for “household

30
consumption” such as paying for the education of the children, and that women
were more likely to undertake multiple smaller businesses as opposed to
expanding an existing business in order to minimize the risks of their investment.
2.1.4 Spatial development initiatives
The spatial development initiatives were started in 1995 by the South African
Government (Department of Trade and Industry) in an attempt to leverage
investment, create jobs, develop infrastructure and improve socio-economic
conditions.
Lefakane (1998)11 describes the SDI as a short-term initiative that “does not seek
to replace the broader, long term planning process.” The main investment
emphasis is placed on public-private partnerships. Primary financing of the
developments rest with the private sector while the government “determines
bilateral arrangements, incentives, policies, and regulation that would support
economic development.” The first SDI in place was the Maputo Development
corridor, which was a joint initiative between South Africa and Mozambique. Since
that time, a series of other SDI's have been designated including the Fish River
SDI, West Coast Investment Initiative, Richards Bay SDI, Lubombo Initiative, the
Platinum SDI and the Wild Coast SDI. Lefakane describes each initiative including

31
its location and focus, and highlights many of the investment opportunities that
have been “announced.” At the time of planning, the SDIs claimed to have
generated 400 investment projects and were expected to create more than 68,000
new jobs.
Arkwright, de Beer, and Mmatli (1998)12 describe the four main objectives of the
initiative: to generate sustainable economic and export-oriented growth by
exploiting the under-utilized potential of the regions; the generation and
sustainability of employment opportunities; the attraction of private sector
investment and lending into the regions; and the development of SMEs and
empowerment of local communities through public and private sector investments
with the hope of economic spin-offs from these investments. In an attempt to give
an update on the progress of the SDIs, emphasis is placed on the identification of
investment opportunities, the growth of interest in the SDIs (from other countries),
and the stimulation of other infrastructure projects. These types of achievements
have prompted investors and the government to consider (in the case of the
Maputo Development Corridor) the SDI “an outstanding success.” The SDI
approach is seen as a useful example of development within South Africa and
potentially between “borders” of other southern African countries.

32
Mahlati (1999)13 is still optimistic but outlines some of the bottlenecks to
investment apparent in the SDIs when put into practice. With particular reference
to the Wild Coast SDI, he believes investment has been complicated by factors
associated with a region with a history of neglect including “high unemployment
rates and unresolved social conflict.” Other problems include the lack of
complementary development programmes; poor infrastructure (roads, water,
electricity, telephones); and limited local government capacity. Mahlati states that
the government underestimated the difficulties involved with the transitions
involved in the SDI strategy. These transitions include community empowerment,
the transition from labourer to owner, and the transition to mixed and diversified
land use. Mahlati, however, feels the government is in the process of devising new
integrated strategies to address these problems. These strategies, he feels, need
to focus on issues involved with training and capacity building (for the SDI team
and management structures); coordinated approaches to implementation; and a
revitalization of the rural economy.
The existing literature shows that theories and intentions about the SDIs are well
documented. However, there is a lack of literature reporting on the progress of the
SDIs based on real empirical evidence.

33
2.2 The use of geomatics in planning
Much of the existing literature on geomatics and planning focuses on the technical
aspects of organising geographic data. Dangermond (1990)14 provides an
overview of these components by outlining trends in hardware, software, data
integration, modelling and user training that are important for development
planning. Important trends include a shift towards personal computers and
networks, specialized workstations, improved data access, improved analytical
tools (such as land suitability and allocation models) and 3-D capabilities leading
to an increasing user base. While optimistic about the impact GIS will continue to
have, Dangermond also warns that "the technology must be adapted to real needs
rather than our needs being adapted to what the technology can do."
Williams, Shalaby, and Whitehouse (1994)15 identify two broad tasks for GIS-
based planning in developing countries: land use suitability mapping, and
identifying areas for development and improvement. The authors review two case
studies where GIS was used for development planning. The first involved locating
tourist areas in Mauritius. Data overlays, buffering, and multiple criteria analyses
were performed to select the site that was most appropriate. The second case
study evaluated the use and efficiency of child immunization clinics in Kenya.
Proximity and flow analyses highlighted problems such as overcrowding, non-use

34
and accessibility. In both case studies, GIS managed to generate timely and
valuable information needed for planning decisions to be taken.
Kelley (1996)16 states that with the proper data GIS can also have valuable
benefits for business development, both from the perspective of economic
developers and from individual businesses themselves. For example, GIS allows
spatial aggregation of data regarding workforce availability, locations of
competitors, and the availability of other infrastructure such as water and health
care. In addition, the author states that GIS "can be used to forecast the economic
impact of various infrastructure projects, to respond to ‘what if' inquiries, and to
assess the relative economic benefits of projects in various geographic areas."
GIS modelling can also take into account various ecological factors, such as
predicting the effect of development on the environment. Individual businesses
can use GIS for a variety of applications, including the targeting of potential new
customers and minimizing shipping costs.
This thesis demonstrates the advantages of geomatics in evaluating local
economic development. However, less emphasis is placed on the technological
advantages it provided. Instead, emphasis is placed upon the role it played in
providing a visual tool that led to discussion and communication of the major
issues affecting the Wild Coast.

35
3. The CIET methods
The research and analysis methods used in the evaluation were based upon the
CIET methods, which have proven successful in generating high quality and
actionable data for planners during the past 15 years17. The CIET methods have
been implemented in more than 44 countries and have addressed a wide variety
of themes including land mines (Angola)18, sexual violence (South Africa)19, gender
gap in education (Pakistan)20 and health (Serbia)21.
Data were collected through modern research techniques and were analysed to
provide a platform for evidence-based planning. Research was conducted in
sample communities which were weighted to bring them into proportion with the
population being studied. The CIET methods were implemented through
successive cycles of research allowing for the thorough measurement of indicators
and an opportunity for the development of local partnership and capacity building.
During each of the research and communication steps, special attention was paid
to ensure that the communities were involved in order to build their voice into the
planning process.

36
3.1 Training and piloting
Data collection teams were recruited for the fieldwork in the Wild Coast, each
consisting of seven interviewers, a field supervisor and a CIET researcher. The
field supervisors and most of the interviewers had previous experience in CIET
surveys and were familiar with the methodology.
A training course covered the data collection process and instruments and
included both classroom and field testing. Training for the household
questionnaires focussed on reading the questions properly and recording the
answers exactly as they were given by the respondent, in order to ensure that
coding was not being done during data collection by the field workers.
Before piloting, the instruments were translated into the local language (Xhosa)
and then back-translated into English to ensure the questions remained true to
their intended meaning. The instruments were then piloted using the standard
CIET five-step pilot process. As part of this process, the instruments were first
piloted among the design team in order to ensure they were correct and capable of
meeting the objectives. Secondly, support staff was asked to pilot the instruments
in order to get a second opinion before they were taken out to the field for
additional piloting. The instruments were then implemented in pilot sites for a

37
minimum of three additional tests. These included testing sections of the
instrument which were presenting problems, testing the instrument for flow, and
finally testing the instrument as a whole in order to finalize the process. The pilot
exercises assisted in refining the instruments, testing for clarity and ensuring
proper translation.
3.2 Informed consent and confidentiality
Before research began in the field, community leaders were notified in advance of
the survey and if requested, were given an opportunity to review the questions
being asked. The survey only began in a community once the community leader
granted permission. In addition, prior to answering any questions, survey
respondents were informed that their participation was voluntary; that their
responses were confidential (ie: no names get recorded); and that they did not
need to answer any questions they were not comfortable with.
The data were stored without any identifying fields, ensuring confidentiality of the
respondents was maintained. In addition, the database was only distributed to the
researchers directly working on the analysis. During reporting, data were
aggregated to appropriate levels so that no individual or household could be
identified by their characteristics.
38
Confidentiality of the communities themselves was maintained as much as
possible, especially with regard to the non-anchor areas. Identity of the exact
sample sites was only revealed to the data collection team and were not included
in any of the reports. In cases where regional comparisons were necessary, the
data were aggregated by district or by anchor/non-anchor status. It should be
noted, however, that it was not possible to avoid identifying the anchor sites as the
nature of the survey required comparisons between the anchor and non-anchor
areas.
3.3 Data entry and analysis
Double data entry was performed using public domain software Epi-Info22 with
validation to identify and to correct all keystroke errors. Further cleaning excluded
logical errors.
The data were analysed using Epi-Info. In order to draw conclusions about the
strength of associations, represented by the odds ratio (OR), a large number of
other explanations had to be excluded. This was done by using the Mantel-
Haenszel procedure23, stratifying sequentially for each of the possible factors that
might explain the association. All reported findings were statistically significant at
the five percent level. It is conceivable, however, that some other explanation

39
exists that was not taken into account in the design. The test of significance used
to measure compatibility between proportional indicators (especially during this
project for comparisons between years) is the Mantel-Haenszel chi-square (M-H).
Averages are accompanied by a measurement of the standard error of the mean
(se).
3.4 Mapping
Key findings from the questionnaires were represented by a set of raster maps
called “CIETmaps”. Raster maps are represented by a grid of cells which create a
continuous surface of the study area. CIETmaps were first developed while
tracking the social costs of landmines and the impact of mine action in
Afghanistan24.
CIETmaps are derived from a set of sentinel communities selected and weighted
to represent the population. Darker colours on the map do not represent higher
concentrations of population, but higher proportions of the indicator being mapped
if the population were "spread out" on the geographic surface. Population
weighting thus transforms the geographic space into population space. If 30% of
the map falls into a given class range, then 30% of the population falls within that
range.
40
As a standard, darker areas on the map represent the need for attention or
investment. Due to the process of interpolation, CIETmaps are designed to be
interpreted much like a standard weather map, where trends are much more
accurate than the exact location of any contour gradient. Sufficient class ranges
are used to ensure that individual communities are not easily identified. Each
colour set represents the different CIET levels of indicators. For example, a green
palette represents coverages, and a brown palette represents impacts.
3.5 Feedback and communication
Preliminary findings were returned to the communities involved in the survey
through gender stratified discussion groups. In these focus groups, participants
were encouraged to give their opinions on several issues through a series of
prompts designed by the research team. The discussions hinged on how the
analysis and interpretation of results could lead to planning strategies for
communication and action. One member of the research team facilitated the group
while a second member recorded the main points and quotes from the discussion.
Once the data analysis was completed, a report was produced for each research
cycle outlining the objectives, methods, main findings, and recommendations.
These reports were then distributed to a variety of role players and planners.
Information about the research and findings was also supplied through various

41
media outlets, including local radio and newspapers.
4. Background on the Wild Coast SDI
4.1 The Wild Coast region
The Wild Coast region is located in the northeast corner of the Eastern Cape
province (Figure 1). It gets its name from its notoriously rough and beautiful
coastline and is made up of eight districts: Kentani, Willowvale, Eliotdale,
Mqanduli, Ngqeleni, Port St Johns, Lusikisiki and Bizana. The Wild Coast was part
of the former Transkei, one of the ten black homelands that existed during the
apartheid era. During that time the area was seen as a “dumping ground”, only
good for providing cheap male labour to the mines out of the region.
As a result of those years of neglect, the population of the Wild Coast
(approximately 1.3 million people25) is predominantly female, poor, and
unemployed. The economic base consists mainly of small and micro-enterprises,
some agriculture and livestock, and wage remittance by migrant workers25. It is a
largely rural area with most of its inhabitants living in huts made of mud walls and
grass roofs. There is inadequate access to clean water and very little
infrastructure.

42
The N2 national highway runs parallel to the Wild Coast region. The only main
road into the area is the R61 which runs from Umtata to Port St Johns, through
Flagstaff and Bizana, and then back towards Port Edward. Most of the other roads
run from the N2 to the coast, making cross-regional travel difficult.
4.2 The Wild Coast SDI
The South African Government started the Wild Coast Spatial Development
Initiative (SDI) through the Development Bank of Southern Africa (DBSA) in 1997
in an attempt to provoke economic growth through investment in the Wild Coast26.
The SDI was designed to recognise and to utilise unexploited local resources in
the Wild Coast region. The approach for development relied on collaboration from
the public sector, private sector, communities and civil society27. It was designed
as a short term investment strategy, using public resources to encourage private
sector investment.
The main goal of the programme was to create sustainable employment through
investment-led development and opportunities for SMEs. Four main performance
objectives were identified. These included achieving growth in local informal and
formal employment; increasing the stock of SMEs; creating opportunities for local
investment in LED initiatives; and establishing planning processes and skills

43
development leading to local empowerment28. Emphasis was also placed on
targeting women.
The SDI identified various sectors for potential growth and development including
tourism, manufacturing and agriculture29. Four coastal anchor projects in particular
were targeted for investment: Mbashe (Cwebe/Dwesa), Coffee Bay, Port St Johns,
and Mkambati (Figure 2). It identified these four “growth centres” as the focus for
investment with the hope that any economic growth in these areas would spill over
into the rest of the SDI. The main thrust behind these four nodes was to present
them as potential tourist areas for local and international investment.
Initial activities planned for the SDI included improvements to health infrastructure,
water installation, school construction and road work. In addition, SDI facilitators
were hired to work with the communities with the intent of ensuring community
involvement in the planning process.
It can be argued that many of the Wild Coast SDI activities were not implemented
as they were intended. The SDI facilitators were terminated shortly after the
project began; there was little, if any, evidence of interest by international
investors; and very few infrastructure projects that were originally implemented
were maintained. However, some “investments” were reported to have taken place

44
in the region. These included at least R80 million in road improvements and R11
million in water projects30.
4.3 The baseline survey (1997/98)
CIETafrica’s involvement in the Wild Coast SDI project began in 1997 with a
design workshop in Port St Johns. This included SDI stakeholders from the
government, community representatives, NGOs and investors who developed
objectives for a baseline survey. The objectives included establishing coverage
levels of basic services (health, education, transport, and communication); levels
of food security; providing baseline information on employment (skills, training
needs, SMEs and informal employment); determining household access to, and
participation in, local decision-making and information sharing processes (local
authorities, institutions, organisations); and to identify bottlenecks to local
economic development and investment.
Later in 1997, CIETafrica and its local counterpart, the Eastern Cape Socio-
Economic Consultative Council (Ecsecc), visited 2475 households from 20 sites in
the Wild Coast. Data were also collected from local authorities, community
leaders, and owners of small businesses. The baseline showed that people in the
Wild Coast SDI were unaware of what they could do to improve their socio-

45
economic conditions. There was little, if any, concept of income generating
activities as locally-motivated and locally-run production units. They seldom
regarded starting one’s own business as an option.
Other key findings from the baseline included: only 23% (554/2475) of households
reported getting their water from protected sources; there was a significant level of
corruption in the public services, with many people having to pay for administration
and health services that should be free; two thirds (1303/1959) of households
produced food but among these, only 14% (170/1301) sold any; some 77%
(1498/6512) of adults were unemployed; and overall knowledge of the SDI project
itself was very low. One positive indicator was the high level of school enrolment:
no less than 89% (4927/5549) of school-aged children attended school.
The 1997 baseline report identified four main action points. The first among these
was a wide-reaching communication strategy about the SDI. Second was the
provision of water to reduce household expenditures and water-related illnesses.
Third was to generate an increasingly informed dialogue on SMEs, in order for
people to understand what was possible and what was likely to succeed. Finally, it
recommended an immediate clean-up of unofficial charges in order to reduce
household costs and slow leakage of resources from the public service.

46
5. Impact assessment of the Wild Coast SDI (2000)
An impact assessment survey at the end of 2000 evaluated local economic
development since the SDI project began in 1997. The 2000 survey included
2,363 households and collected information about 11,171 individuals31.
5.1 The 2000 sample
Since the objective of the 2000 survey was to evaluate development since the SDI
project began officially in 1997, CIETafrica revisited the same 20 communities that
were selected to represent the SDI in 1997. During the 1997 sample selection
communities were stratified by anchor/non-anchor status. Additional stratification
was based upon geographic features (such as coastal/non-coastal), proximity to
infrastructure, and accessibility.
Where possible, the same number of households was visited in each community in
2000 as was visited in 1997 in order to provide a strong comparative basis to
assess impact. During analysis, sites were weighted to be proportional based on
district populations.

47
5.2 Data collection instruments
The data collection instruments for the 2000 survey included a household
questionnaire, a community review, a market survey, an existing SME
questionnaire, and community-based focus group discussions.
5.2.1 Household questionnaire
The household questionnaire used for the impact assessment focussed on
household knowledge of the SDI, access to water, use and satisfaction with
government services, food security, and credit and loans. The respondents were
also asked a series of questions about each member of their household regarding
use of health services, employment and income, and small business ownership.
Many of the same questions from the 1997 survey were used in order to allow
direct comparison of indicators. For these questions, the exact same wording of
the question was used. Open question format was used for the household
questionnaire with the responses being recorded in Bhopal books.
5.2.2 SME questionnaire
The SME questionnaire was designed to document the experience of owners

48
about the daily operations and struggles of their small businesses. The same
questions from the 1997 SME review were used in 2000. The intention was to visit
the same SMEs that were reviewed in 1997 however, in most cases, this was not
possible. To preserve confidentiality, only the types of businesses (but not their
names) had been recorded in the baseline survey. In some cases, owners were
asked if they had been interviewed in 1997 but many could not remember. In other
cases, there were no similar types of businesses left in the community implying
that the SME interviewed in 1997 no longer existed or had changed its operation.
Therefore, important information was collected from existing businesses in 2000,
but specific changes from the baseline could not be documented.
5.2.3 Community review and focus groups
In each site, the headman or community leader answered the community review
and provided information such as access to electricity, access to public transport,
distance to government offices, and distance to health care providers. Local
market surveys included prices of various products that were also reviewed in
1997 in order to assess price differentials.
Gender stratified focus groups were conducted in each of the communities which
took part in the surveys. Participants were asked to comment on some of the

49
preliminary findings and provide further insight into the data.
5.3 Key findings
5.3.1 Demographic structure of the sample
The demographic structure of the 2000 survey followed the same pattern as the
1997 survey (Figure 3). As in 1997, there were fewer working-age males than
females which was a result of the many years of migrant labour in this region. In
addition, no less than 38% (899/2363) of households reported no adult males over
the age of 18 years living in the household.
5.3.2 Lack of knowledge of the SDI
In 2000, 23% (530/2336) of respondents had heard of the Wild Coast SDI. This
was the same proportion of respondents who had heard of the SDI in 1997 – 23%
(578/2471); M-H chi-sq=0.33.
In the proposed anchor areas, where SDI planners intended the main focus of the
initiative, people were nearly three times more likely to have heard of the SDI than
people in non-anchor areas – OR 2.8, 95% CI 2.2-3.4 (281/806, 249/1530).

50
However, overall knowledge within the anchor areas had decreased since the
baseline – anchor areas: 1997 - 41% (355/862), 2000 - 35% (281/806); M-H=7.05.
Nearly half (50%, 261/525) of those who had heard of the SDI claimed they heard
about it from the headman/chief or community meetings (Table 1).
There was also a reduction of those who felt they have a say in the SDI. This
affected both anchor and non-anchor areas (Figure 4). Among those who had
heard of the SDI, in the 2000 survey only 33% (217/475) overall felt they had a say
in it (the effect of population weights reduces this coverage from 46% -
unweighted, to 33% - weighted). Some 78% (415/532) in 1997 felt they had a say
in the SDI; M-H=112.07.
5.3.3 Households' main problems
In 1997, 76% (371/490) of respondents who had heard of the SDI said they felt
they would benefit most from the initiative if it brought more jobs or business
opportunities. Asked in the 2000 survey what their household's main problem was,
66% (1551/2363) of respondents said it was money or unemployment. This was a
significant increase in that category since 1997 (58%, 1411/2427); M-H=28.53.
Both male and female focus groups complained of a lack of development, stating
that a lack of money and unemployment were clearly the biggest challenges their
51
households and communities faced (17/20 male focus groups, 15/20 female focus
groups).
In 2000, only 20% (477/2359) of households reported getting their water from a
protected source such as a tank and taps. The majority of households getting their
water from protected sources were located in the Port St Johns area (Figure 5).
5.3.4 Positive views of education
In 2000, 89% (3708/4177) of children aged 6-18 attended school and seventeen
out of 20 communities reviewed were located within one kilometer of the nearest
primary school.
Overall satisfaction with the education system was high. In 2000, some 75%
(1745/2329) of respondents claimed they were satisfied or very satisfied with the
education system. When asked what they would most like to see changed with the
education system, some 67% (1513/2265) of respondents claimed there was
nothing they would like to see changed (Table 2).
Respondents were also asked about costs of education including school fees,
books and uniforms. Costs increased as education level increased and were
52
higher in non-anchor areas (Table 3).
5.3.5 Use and costs of health care services
Some 29% (3062/10446) had last visited a health care service within the month
prior to the survey. Among these, 77% (2371/3062) had used government clinics
on their last visit. The most common reason for seeking medical help was the
treatment of respiratory illness (such as fever, flu, coughs, asthma) which
accounted for 23% (2257/9933) of all visits.
Costs varied by type of health provider. Among those who used government
clinics, 20% (466/2354) had to pay an average of R4.40 (n=466, se 0.7)(Table 4).
Overall satisfaction with the health services decreased significantly between 1997
and 2000. In 1997, 84% (1978/2352) of households reported being satisfied or
very satisfied with the health services as compared to 65% (1517/2349) in 2000;
M-H=234.69. There was also some variation among those who were satisfied in
2000: a lower educated household (where all its members have less than Grade 8
education) was 1.9 times more likely to be satisfied with the health services than a
higher educated household – OR 1.9, 95% CI 1.6-2.3 (568/767, 949/1582).
53
Asked what they would most like to see changed with the health services, 55%
(1263/2290) of respondents said there was nothing they would like to see
changed. However, among those who did want to see changes, the most common
response was more medicine (Table 5).
Respondents were asked how much they would be willing to pay each visit to see
changes with the health services. Overall, 21% (484/2263) of respondents were
willing to pay something to see changes with the health services. The most
common amount respondents were willing to pay each visit was R2.00.
5.3.6 Use and costs of administration services
Overall, households were using government administration services less than in
1997. In 1997, some 71% (1759/2475) had used them within the previous year
compared with 43% (990/2276) within the previous year in 2000; M-H=369.64.
However, including only those that had used government services within the
previous year, 71% (743/1044) claimed they were either satisfied or very satisfied
with the service they received. There was no significant change in satisfaction
since 1997 (69%, 1209/1749); M-H=1.30. Some 28% (280/985) of households
who used government administration services in the last year paid an average of

54
R57.00 (n=262, se 13.7) for the service (Table 6).
In 2000, the most common reason for contacting the government services in the
last year was to obtain identity documents or certificates (51%, 500/978). There
was a very low proportion of households who contacted the government offices to
seek employment, accounting for only 2% (21/978) of visits.
5.3.7 Increased cost of public transport
In 2000, 20% (457/2266) of households had not used public transport at all in the
previous month. Among those who had used it, the average monthly household
expenditure on public transport was R102 (n=1876, se 2.9) which was more than
twice the average in 1997 (R49, n=1396, se 2.3). In 2000, 66% (1246/1876) of
households who used public transport services in the last month claimed they
were either satisfied or very satisfied with them. Those who claimed they were
satisfied paid less overall than those who claimed they were dissatisfied (Table 7).
5.3.8 Increased use and cost of telephones
Eleven out of 20 communities reviewed in 2000 had access to telephones within
their community. Some 44% (1025/2318) in 2000 claimed they had not used a

55
telephone in the month prior to the survey. Among those who had used telephones
and paid, the average monthly household expenditure was R81 (n=1055, se 5.2).
Small business owners were also asked about their use of telephones with
regards to their business. Only 3/33 SMEs claimed they had never used a
telephone for their business (three general dealers) while twenty out of 33 claimed
they had last used a telephone that day.
5.3.9 Decreased levels of food security
Overall, the average household in 2000 spent R318 (n=2307, se 3.9) on food in
the month prior to the survey which was an increase of R19 since 1997 – R299
(n=2475, se 4.2). The main food items purchased by the average household in the
previous month were maize, samp (stamped maize), and flour which together are
considered basics (80%, 1884/2350).
Nearly 30% (688/2314) of households in 2000 reported having no land under
cultivation. This was nearly the same proportion who reported having no land
under cultivation in 1997 (29%, 722/2475); M-H=0.18. Among those who had land,
the average household cultivated 0.6 hectares (n=1565, se 0.1). However, only
55% (846/1532) of households produced any food in previous year which was a

56
significant decrease from 1997 (67%, 1303/1959); M-H=46.31. There were also
fewer households selling food in 2000 than in 1997 (Table 8).
5.3.10 Employment and income
Overall, 15% (790/5118) of the adult population worked for income in the month
prior to the survey. This was much lower than 23% (1498/6512) in 1997; M-
H=191.22. Unemployment was not evenly spread in the community. In both 1997
and 2000, more males were employed than females (Figure 6). In addition,
employment levels and incomes were higher among those with more education in
2000 (Table 9). More than one fourth (211/779) of the working population were
employed as labourers, with another 23% (179/779) employed as
gardeners/domestic workers.
Some 31% (724/2341) of households received monthly income from migrant
workers. Among these, the average amount reported was R390 per month
(n=724, se 8.9).
No less than 54% (2947/5423) of the adult population was looking for work at the
time of the survey as compared with 48% (3174/6580) in 1997; M-H=44.34.
However, only half (52%, 2442/4652) of those who were unemployed were looking

57
for work at the time of the survey (Figure 7).
5.3.11 Small business ownership
Overall, 29% (1569/5398) of adults had considered owning their own business.
However, only 27% (1261/4629) of those who were unemployed at the time of the
survey had considered starting their own business.
Only 6% (339/5454) of those surveyed in 2000 owned their own business. Among
these, spaza shops (small general dealers) were the most popular enterprise
accounting for 17% (57/334) of businesses overall. Alcohol-related
establishments, such as shebeens/taverns also made up a substantial proportion
of the businesses, accounting for 10% (34/334) of the businesses recorded in the
survey.
As with wages, there was some variation in the monthly earnings generated
through self-employment. The average earnings from businesses overall were
R448 (n=275, se 57.7). However, no less than 3% (11/339) of those who reported
owning their own business claimed they generated no income from the business in
the previous month.

58
In addition to the household questionnaire, the 2000 survey interviewed 33 existing
SMEs. The most common reason given by the 33 owners for starting their
business was a lack of money and jobs. The most common current challenges
reported by owners were competition by similar businesses and financial
difficulties. Others complained that there were fewer customers because people
had no money, and that there had been an increase of people buying on credit.
5.3.12 Increased credits and loans
Some 41% (951/2302) of households had loans at the time of the 2000 survey.
There was a higher proportion of households in 2000 in anchor areas with loans
than households in non-anchor areas, although the overall proportion had
increased in both areas since 1997 (Figure 8). Some 76% (694/911) of all loans
were for groceries/food. In 2000, average loan sizes were higher in anchor areas
than in non-anchor areas (Table 10).
Among SMEs, nearly one-half (13/33) felt they had access to credit either from the
bank or wholesaler. Among these, 11/13 had used credit for their business.

59
5.4 Discussion of key findings
5.4.1 Lack of impact from the SDI
Findings from the impact assessment indicated that the Wild Coast SDI, conceived
as an investment-led project to kick-start economic growth and tourism, showed
little signs of improving local economic development in the region up to the end of
2000.
First, overall knowledge of the project within the communities had not changed,
which was a sign that little had been done about either investment or tourism in
the area. Since 1997 communities seemed to be more marginalised from the SDI
process, relying solely on their community leaders for information. This could have
been due in part to the termination of employment of SDI facilitators in 1997.
Secondly, one of the main action points included in the 1997 baseline survey was
to increase provision of water to the communities. This would imply a reduction of
time spent fetching water to reduce labour time, particularly of women. Increased
access to water from protected sources would also reduce water-related illnesses.

60
5.4.2 Decreased trust in government services
During the focus group discussions, the communities concluded they no longer
had any trust in their government or government services. Some complained of
applying for identity documents or grants and never receiving them. Others felt the
government promised them things and then never delivered on those promises.
When attempting to explain the decrease in satisfaction with the health services
since 1997, nearly two-thirds of both the male and female focus groups felt there
had been a sense of hope with the new government but that more recently they
had become disillusioned with this notion. Others mentioned that while there used
to be more costs for health services, there also used to be more equipment and
medicines and, as a result, better treatment.
5.4.3 Unemployment and lack of ownership
Due to the high levels of unemployment in the Wild Coast area, it was surprising
that there was a very low proportion of adults who had considered starting their
own business. This reflected the weak culture of SMEs in the Wild Coast. Many
people did not feel they could make something happen for themselves and were
simply waiting for a job to be created or become available.

61
In addition, the proportion of adults who had considered starting their own
business was the same for anchor areas as it was for non-anchor areas. This
should be looked at against the background of the original intention of the SDI to
target the anchor areas with external investment for small business development
with the hope that this economic boost would spill over into the other parts of the
SDI. There is little chance of a spill over when little happens in the proposed target
areas.
5.4.4 Increased credits and loans
The increase in total loans over 1997-2000 could be seen as a positive indicator
for development if households were taking more loans to try and improve their
economic status by starting or improving businesses. However, this was not the
case as most of these loans were for food - a direct result of decreasing food
security (especially in the form of food production). This represents a large burden
on household resources considering the high levels of unemployment and low
income in the Wild Coast.
The loans from the local shops in 2000 were almost exclusively for food and given
in the form of credits that were supposed to be paid off at the end of each month.
During the SME reviews (2000) many of the enterprises felt that customers buying

62
on credit was one of their biggest struggles. They commented that their customers
could often not pay at the end of the month because of high levels of
unemployment and very little money for food.
With regards to their own loans, the most common complaint among SME owners
was that borrowing rates were much too high and this was one of the biggest
obstacles to the success of their businesses. Increasing access to credit and
reducing borrowing rates may provide more incentive for current businesses
owners to expand, and give more opportunities to potential would-be owners.
5.5 Recommendations
The findings from the impact assessment concluded that the SDI was not meeting
basic objectives and immediate action was needed to promote LED initiatives in
the Wild Coast. A shift is required to change the SDI perspective from an
investment driven initiative to one with a focus on local skills building and
incentives for development within the community. Communities must be urged to
use their local skills and resources to generate income. Primary initiatives should
focus on community development projects and the promotion of small local
markets based on agriculture related SMEs. These local markets could create
employment opportunities, build skills, generate local finances, and increase the
63
potential for small business development.
These suggestions are given based on the LED concept that communities need to
find local solutions to their economic problems. However, it is important to note
that there will be limitations to their impact due to various socio-economic factors
that may not have local solutions. These include an unfavourable macro-economic
environment due largely to years of apartheid rule and widespread poverty; sparse
infrastructure and support services for SMEs; and high levels of crime and
corruption. More research is needed to determine the extent of these effects on
local development and provide planning solutions that compliment LED strategies.
6. Mapping local economic activity (1999)
In August 1999, in an attempt to begin an informed dialogue on SMEs in the SDI,
CIETafrica and Ecsecc conducted a school-based questionnaire and mapping
exercise with 2056 grade 12 students in 28 schools across the Wild Coast SDI32. A
school-based exercise was chosen because of the positive baseline finding of high
school attendance. It was believed this would provide a wide reaching feedback
framework for dialogue about SMEs and development in the SDI communities.
The main objective of this exercise was to document income generating activity in
the area, to understand some of the factors that impact on economic activity, and

64
to initiate an informed dialogue about the issues. By doing so, the students
identified “the culture of SMEs.”
6.1 The school sample
Sample schools were chosen on the basis of average walking distances to schools
from the sample communities established in the baseline survey, with the 28
schools forming a grid that covered all main roads in the area. The spread of
schools ensured full coverage of the region while at the same time avoided excess
duplication of information. Population weights for the grade 12 students were
applied to bring the school sample into proportion at the district level.
6.2 Data collection instruments
Data collection instruments for the school-based research cycle included a
mapping exercise, a student questionnaire, and a school-based focus group
discussion.
6.2.1 Student mapping exercise
The mapping exercise was designed to produce an interactive data collection tool

65
that would allow the students to understand existing trends among small
businesses in their communities. A set of maps was produced on A3
(297x420mm) paper showing the schools and surrounding area. Grade 12 classes
were divided into four smaller groups of 6-10 students containing both males and
females. Each group received a map and a set of pictorial symbols representing
different types of small businesses. There were three colours for symbols: blue for
male-owned businesses, red for female-owned businesses and white for jointly-
owned businesses. A category “other” accommodated business categories not
represented by the symbols so the students were not limited to the businesses
listed. The students then identified all income generating activity known to them by
locating the appropriate symbols on the map.
Information regarding type of business, products sold, how many people were
employed, and the geographic area covered by the business was noted. The
maps were then processed using ArcView GIS33. Each SME was placed onto a
digital vector map in ArcView and linked to a database containing the collected
information about each business. The maps were then collated to represent the
eight different magisterial districts individually as well as the region as a whole.
The final maps represented gender specifics of ownership patterns and a
breakdown of service and production-related businesses.

66
6.2.2 Self-administered student questionnaire
The student questionnaire was designed to identify and understand some of the
factors that prevented small business development in the Wild Coast. The
questionnaire was self-administered by the students, who filled in response
bubbles that corresponded with their answers. The use of response bubbles
allowed the questionnaire to be scanned during data entry. Students answered
questions regarding their attitudes towards small businesses, their skills,
education, and knowledge of the SDI. The questionnaire was confidential (ie:
students were not asked to provide their names) and voluntary.
6.2.3 Student focus group discussions
The products of the student mapping exercise were returned to the schools that
participated in the collection of the data. The same students who were involved in
the initial mapping exercise were drawn into a discussion around the findings. At
each school, students were given a set of four maps for the district in which they
lived: a breakdown of businesses by sex of the owner; a breakdown of service and
production-related businesses; production businesses with pictorial symbols; and
service businesses with pictorial symbols.
67
Using the maps as a reference, a number of issues were discussed and the
comments of students were recorded in a standardised way. Some of the issues
discussed about the maps in particular were trends in business ownership, what
types of businesses existed, what types of businesses were missing, and where
the businesses were located. Other issues included what could be done to
promote small business development and who needed to be involved. These
discussions allowed the students to continue and build upon the conversations
they had started during the mapping exercise itself.
Results from the mapping exercise, student surveys, and focus group discussions
were collated into a Year 2000 calendar, with each page representing information
from different regions of the SDI (Figure 9). These calendars were distributed to
more than 9000 students in the Wild Coast and other stakeholders.
6.3 Key findings
6.3.1 Service and production-related businesses
The mapping exercise identified 1424 small businesses in the Wild Coast area. No
less than two-thirds (958/1424) of these were service related. There was also a
dominance of alcohol-related business in the Wild Coast (shebeens, taverns, and

68
bottle stores) accounting for almost 20% (189/958) of all service business. The
most common production businesses in the SDI were arts and crafts followed
closely by fruit and vegetable production (Table 11).
6.3.2 Male and female-owned businesses
There were no less than two businesses owned by a male for every business
owned by a female (Figure 10). There was also some variation in the kinds of
businesses that were owned by males and females. The most common types of
businesses owned by women were shebeens (56), vendors (50), arts and crafts
(43), and fruits and vegetables (41). The most common types of male-owned
businesses were taxis (107), general dealers (77), brickmaking (74), and livestock
(58).
6.3.3 Spatial patterns of small businesses
Several spatial patterns became obvious during the mapping and feedback with
the students. Almost all businesses followed the road network and businesses of
the same type were often clustered together. While the population of the Wild
Coast SDI region was fairly evenly distributed, there was variation in the density of
businesses from place to place. Business density (number of businesses per

69
10,000 people) was considerably higher close to two of the anchor areas, Port St
Johns and Coffee Bay (Figure 11).
6.3.4 Consideration of small business ownership
Overall, 31% (631/2046) of grade 12 students had considered starting their own
business: 35% (263/757) of males and 29% (356/1244) of females (M-H chi-
sq=8.26).
In many cases, the reason for not starting their own business was not attributed to
one single factor, but a combination of different factors. Not surprisingly however,
a lack of finances was identified as the main thing that stopped students from
considering starting their own business. The second most common reason among
students for not starting their own business was a lack of knowledge, followed by
not knowing what kind of business to do and a lack of customers (Table 12).
6.3.5 Attitudes toward businesses
In many cases, students said they had the hands-on skills and natural resources to
start a business (such as the production of crops, food, and arts and crafts) but did
not consider these as business opportunities. For example, one in four (27%,

70
539/2028) students in the Wild Coast considered the making and selling of crafts
as a business but many more (59%, 1203/2032) felt they could produce them
(Table 13).
6.3.6 Knowledge of Wild Coast SDI
Among the grade 12 students surveyed, only 23% (457/2013) had heard of the
Wild Coast SDI. Knowledge of the Wild Coast SDI was sparse. In Elliotdale, only
11% (10/88) of students had heard of the SDI. In Mqanduli, one of the anchor
areas, only one-third (111/327) had heard of it (Figure 12).
A student who had heard of the Wild Coast SDI was more likely to consider
starting a business than a student who had not heard of it – OR 1.8, 95% CI 1.4-
2.2 (181/446, 417/1506). In addition, a student who was a member of a stokvel (a
community saving scheme with social and economic functions) was twice as likely
to have heard of the Wild Coast SDI than a student who was not a member – OR
1.9, 95% CI 1.5-2.5 (154/379, 359/1377).
6.3.7 The role of education
Overall, 93% (1885/2032) of students felt further education improved their chances

71
of a future livelihood. However, this positive finding was overshadowed somewhat
by the dismal pass rates from the schools. As reported by the principals of the
schools visited, grade 12 repetition rates ranged from 6% (14/236) to 89%
(89/100). In addition, there was a large number of students who were repeating
grade 12 for a second time or more.
6.3.8 Attitudes towards women
Many women felt they had fewer opportunities than men and were intimidated by
the idea of starting their own business. On the other hand, some students believed
that women actually had more business opportunities than men. Overall, 29%
(591/2020) of students in the Wild Coast thought girls had a better chance of
making a livelihood in their community. However, in a predominantly female
population, women on their own only accounted for 28% (393/1424) of small
business ownership in the Wild Coast SDI.
6.4 Discussion of key findings
6.4.1 Distribution of small and micro-enterprises
The ratio of service to production-related businesses described an important
72
dimension of the local economy. The dominance of service-related businesses in
the Wild Coast SDI was likely due to the fact that they may require less skill and
lower start-up costs. However these sources of income are often limited to the
local economy, meaning they can only serve those in the area where they are
located. This limits expansion in a way that does not always affect production
businesses - these can serve local communities but they can also market goods
outside of the locality.
The students said that most people lacked the necessary skills to start and
maintain production businesses and the finances to buy the necessary equipment.
They felt service businesses were more profitable and offered more immediate
return. Students also recognised a poor infrastructure as part of the reason for the
lack of production businesses, claiming that if roads were better it would be easier
to get goods to other markets.
When discussing the large number of alcohol-related businesses, students
suggested that, because many people did not have jobs, morale was low and
people resorted to liquor. They said an improved economic situation in the Wild
Coast might result in fewer alcohol-related businesses due to increased morale
and less free time.
73
The students concluded, however, that creating new job opportunities was not the
only answer. New jobs and businesses must be created which complement, and
not simply copy, each other in order to build up the overall infrastructure of the
entire region. The clustering of many similar businesses in the SDI may be related
to a shared infrastructure but could also imply that many businesses were started
as “copycats” -- people see a successful business and simply copy it instead of
trying to think of something else to do. The students noticed this clustering trend
and felt that a lack of creativity and laziness were the main reasons for this
outcome. They suggested more information about the different kinds of businesses
that could be started might help reduce the amount of copycat businesses.
In addition, “sustainability” of these businesses is important. The creation of many
small businesses may provide some work for a short time, but will not provide
many long-term benefits if they do not survive.
6.4.2 Constraints to small business development
Many students felt that people did not even have enough money to pay their debts
or buy food, let alone start their own business. Students also felt that a lack of
financial management skills prevented many businesses from developing in their
communities. They suggested that, in the rare case that someone did have the

74
funds to begin a business, it was often misused without a proper marketing
strategy. This resulted in bad credit, high prices and wasted resources.
Lack of finances is a complex issue, as making more money available does not
solve the long term problems of management, marketing, and businesses
sustainability. On the positive side, the students were not simply asking for more
money, but for more information and training on financial management. SDI
planners need to look at different sources of funding and provide education about
financial management.
Lack of knowledge was another reason given for students’ not considering starting
their own businesses. However, they distinguished between two different types of
“knowledge.” The first was knowledge about a specific business. For example in
the case of crops, a student may claim that they do not know enough about how to
plant seeds, proper watering, fertilization, and exporting. The other type of
knowledge was knowledge about running a business in general - including getting
credit for start-up, how to turn an idea into a business, customer relations,
marketing, management, and finances.
Many students felt that the schools could change the curriculum to help reduce
their lack of both types of knowledge. Teachers should be trained to teach specific

75
business skills, financial management and customer relations, as well as provide
hands-on courses on topics such as gardening, and needlework. They also felt
that not only should this be taught in the schools from grade 8-12, but that the
Adult Basic Education and Training (ABET) program should also incorporate the
same themes into their courses. It is possible that curriculum reform geared to
increase business knowledge would also help students realize what their options
were, and give them ideas about what business to do.
6.4.3 The role of women
One of the primary objectives of the SDI when it was planned was to increase
women's economic participation. Several suggestions were made by students to
explain the dominance of the local economy by males. Many said high crime rates
discouraged women from starting small businesses. Others suggested that men
had an advantage, as many had left their communities to work in the mines and
had returned with money and a skill base which helped them get started.
Another often mentioned reason was the traditional view that women should be at
home with the kids and needed to raise their families instead of running a
business. Women often felt they were regarded as minors and did not have the
same chances that men had. This raises the challenge of how women might be
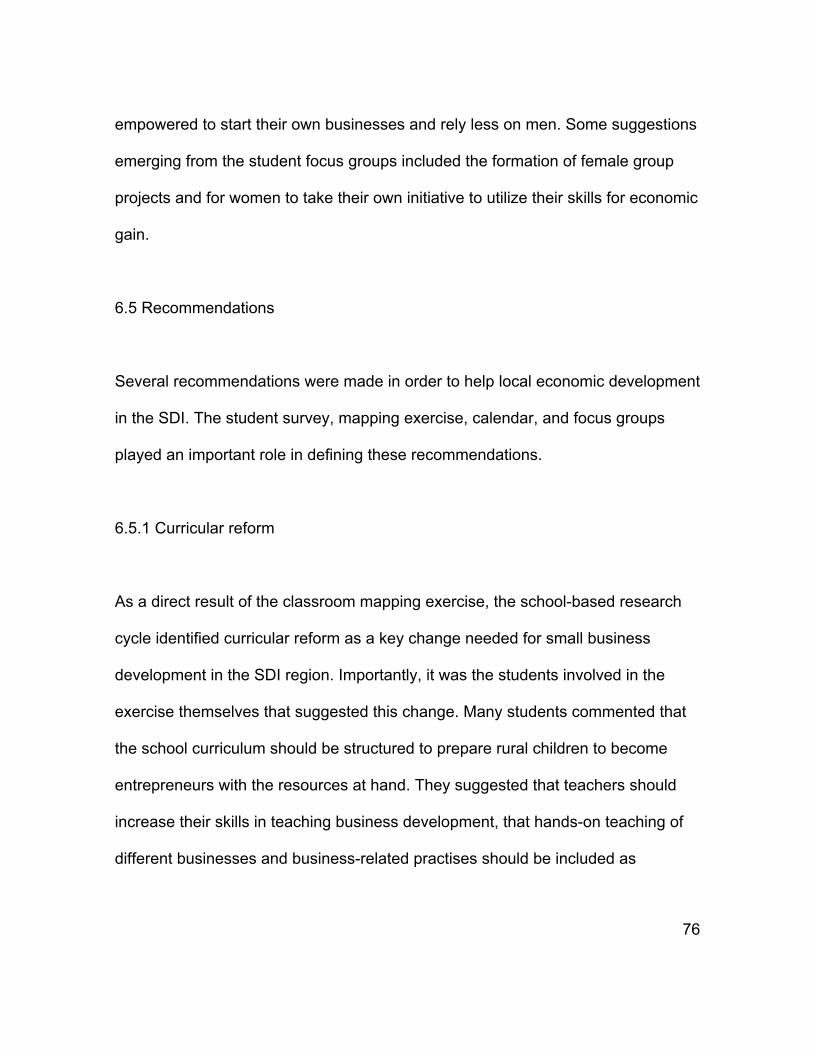
76
empowered to start their own businesses and rely less on men. Some suggestions
emerging from the student focus groups included the formation of female group
projects and for women to take their own initiative to utilize their skills for economic
gain.
6.5 Recommendations
Several recommendations were made in order to help local economic development
in the SDI. The student survey, mapping exercise, calendar, and focus groups
played an important role in defining these recommendations.
6.5.1 Curricular reform
As a direct result of the classroom mapping exercise, the school-based research
cycle identified curricular reform as a key change needed for small business
development in the SDI region. Importantly, it was the students involved in the
exercise themselves that suggested this change. Many students commented that
the school curriculum should be structured to prepare rural children to become
entrepreneurs with the resources at hand. They suggested that teachers should
increase their skills in teaching business development, that hands-on teaching of
different businesses and business-related practises should be included as

77
subjects, and that ABET should make small business development a part of its
curriculum. In response to the key findings from the student mapping exercise and
survey, the Department of Education (Eastern Cape) acknowledged the need for
an evidence-based curricular reform project. As stated by Eastern Cape Minister of
Education Stone Sizani, “the department is introducing measures that would
reorientate the present emphasis on theory to a focus on skills.”34
6.5.2 Provincial roll-out of the mapping exercise
The mapping exercise prompted a request to roll out the mapping of small
businesses by the students and calendar distribution to the provincial level, in
order to document the entire economic situation of the Eastern Cape as a whole.
The calendars proved to be a successful communication tool and were well
received by students and planners alike. There was a request for a second printing
in order to increase the circulation of the calendars in the schools. Yearly updating
of the calendars would enable students and planners to document which types of
businesses have been successful, and which have failed.
6.5.3 Increased women’s participation
The mapping exercise painted a clear picture to both the students and planners

78
that ownership of the existing enterprises was largely dominated by males. During
this exercise, many female students discussed this point and agreed that they as
women should be taking more initiative. One female student from Phambili Senior
Secondary school remarked that “women should come together and form a project
that can create a number of jobs and be of some use to the community”. Yearly
updates of the mapping exercise would be able to measure whether or not these
ideas are being acted upon. In addition, seeing that more women had begun taking
matters into their own hands might prompt other women to do the same.
7. Conclusion
7.1 Failure of the Wild Coast SDI
Empirical data collected through community-based research have shown that the
Wild Coast SDI has failed. This is demonstrated by little knowledge of the SDI in
the communities; little improvements in basic services; a lack of food security; no
increase in employment; and the lack of a culture of small business development.
7.1.1 Knowledge of the SDI
The 2000 follow-up survey showed that there had been no increase in local

79
knowledge of the SDI since 1997. In addition, the proportion who felt they had a
say in it decreased in both anchor and non-anchor areas. This implies that little
has been done to promote the project and less has been done to interact with the
communities. It is unlikely local communities will derive benefit from LED initiatives
if they are not even aware these initiatives exist.
7.1.2 Basic services
In 2000, there had been no measurable improvement in basic services. Access to
clean water had not improved which leaves the potential working population at risk
of illness. In addition, the decreasing level of use and trust with the government
services (especially health services) implies a growing sense of decentralisation in
the area. It is unlikely that any emphasis will be placed on using community
resources for economic development projects when basic needs are not being
met.
7.1.3 Food security
In addition to a lack of basic services, there is decreasing food security in the Wild
Coast region since 1997. The Wild Coast was targeted for investment due to its
“natural ecological resources,” therefore success of the SDI should result in an

80
increase in the production and sale of food. However, there has been a significant
decrease in both outcomes. Taking into account the fact that most loans in 2000
were being extended for purchasing food, it is evident that communities were
simply struggling to feed themselves, let alone produce food to sell.
7.1.4 Employment
One of the specific performance objectives of the Wild Coast SDI was to increase
employment in the area. However, employment levels decreased significantly
since 1997 and there was a high proportion of the unemployed who were not
looking for work. In addition, there was a significant number of households who are
receiving income from migrant workers. It is evident that Wild Coast communities
do not feel their region holds many employment opportunities. This would indicate
that investment projects in the SDI have either been unsuccessful, or non-existent.
7.1.5 The culture of SMEs
As with increased employment, the SDI was designed to provide a favourable
environment for SMEs, especially among female owners. However, there has been
no measurable increase of small business ownership in the area and only a low
proportion of the unemployed population (including youth who are finishing school)

81
had considered starting their own business. There was little concept of taking
one’s own initiative to make something happen.
It can be argued that economic development is a slow process and that not
enough time has passed to allow the SDI to have a significant impact. However, it
is reasonable to expect that the communities would at least have knowledge of the
project and some improvement in basic services. This would lead to favourable
local attitudes (if not action) towards small business development opportunities
and a sense of hope. However, it is evident that this has not happened and, in fact,
there are signs of regression in many of these aspects.
7.2 The role of geomatics
Geomatics played an important role during the second and third cycles of the SDI
project. Raster and vector maps were used extensively during the research
process for data collection, discussion, and feedback of the results.
7.2.1 Data collection
In the school-based survey, the mapping exercise was used as one of the main
data collection instruments to document all income-generating activity in the area.

82
The mapping exercise provided a lively and interesting interaction with the
students. While acting as an effective data collection tool, the exercise itself also
provided a forum for communication and learning. The students created the final
maps themselves, which maximised participation and ensured that they felt they
were important to the process.
As the maps were collated, the students also commented on many of the trends
that were emerging (such as the dominance of male-owned enterprises and the
clustering of similar businesses). Looking at the final maps, the students involved
themselves in discussions about what types of businesses were missing in their
areas, and among those that existed, what types were succeeding and which were
failing.
Overall, the businesses mapped by the students likely underestimated the actual
economic activity in the SDI since larger enterprises and the government sector
were not included. However, there were three main advantages in having the
students map the SMEs as opposed to a spatial survey: the students knew about
many businesses that were not visible (such as selling crafts from within the
home), the students did not identify businesses that they did not consider
employment or income-generating opportunities, and the mapping exercise itself
acted as a communication tool and provoked dialogue. Through these exercises

83
and discussions, the students identified the culture of SMEs in the Wild Coast.
7.2.2 Representation of key findings
Key findings from the mapping exercise were collated into a series of vector maps
showing a breakdown of businesses by sex of the owner and a breakdown of
service and production-related businesses.
In addition, key findings from the student and household questionnaires were
represented by a series of raster maps (Annex A2 and B2). These maps were
used to provide a visual perspective by showing the overall measure of an
indicator, as well as its spatial variation. For example, only 20% (477/2359) of
households surveyed in 2000 reported getting their water from protected sources.
However, this proportion was much higher in the areas closest to Port St Johns.
This type of spatial difference is important to planners who may need to target their
programs differently in various regions.
During the impact assessment survey (2000), a set of time-series maps was
created based on data collected in 1997 and 2000. These maps were presented
on the same page in the atlas and allowed direct comparison of key indicators. The
maps were useful to show both change and/or lack of change of the variables,

84
which provided visual evidence that the SDI was not meeting its objectives.
7.2.3 Feedback and communication
The products of the student mapping exercise and raster maps were returned to
the schools that participated in the collection of the data and provoked discussion
around the findings. These discussions allowed the students to continue and build
upon the conversations they had started during the mapping exercise itself.
A calendar generated from the mapping exercise was also produced for the Year
2000 and distributed to the schools. The calendar contained maps of every small
business mapped out by the students categorised by type and owner’s sex. Other
findings were included as were comments from the students in response to the
issues discussed during the feedback sessions. Some pages also contained raster
maps showing the results from the student questionnaires.
In addition to the monthly maps, a page illustrated the findings relating to male and
female owned businesses; another page depicted information about service and
production-related businesses; others showed information from the baseline
survey and results from the student survey. The back page of the calendar
contained contact information for the SME desks of the Eastern Cape Department

85
of Finance in the relevant districts. Each page of the calendar also included quotes
about students’ views on income generating activities as a livelihood option. In
January 2000, CIET distributed 9000 calendars to the schools that had been
involved in the survey.
The calendar was also distributed to a variety of other role players involved in
economic development in the Eastern Cape. For them it pointed out certain needs
regarding training, access to markets, and access to finances. It also indicated
investment opportunities and gaps in the employment market. The calendars
proved to be a successful communication tool and were well received by students
and planners alike. There was a request for a second printing in order to increase
the circulation of the calendars in the schools.

86
Figure 1Map of the Wild Coast region showing roads and towns
8. Figures
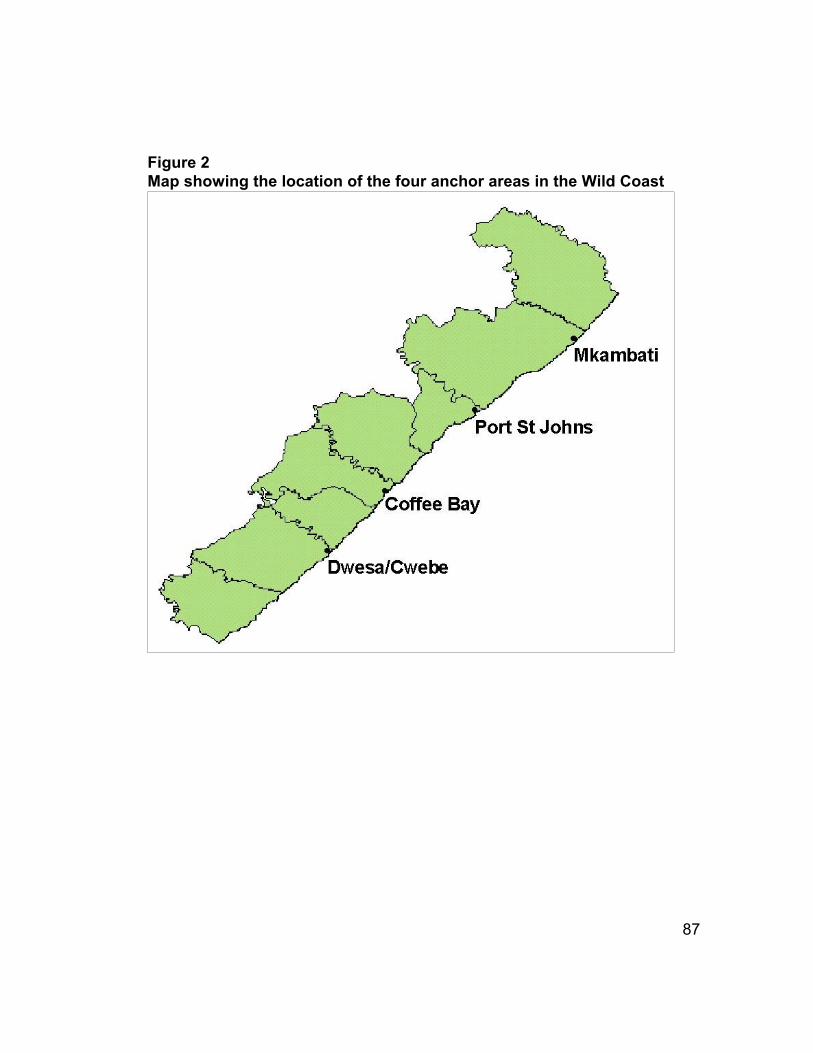
87
Figure 2Map showing the location of the four anchor areas in the Wild Coast

88
Figure 3The demographic structure of the sample -- 2000(number of people)

89
Figure 4Percent of respondents who felt they had a say in the SDI(among those who had heard of it)
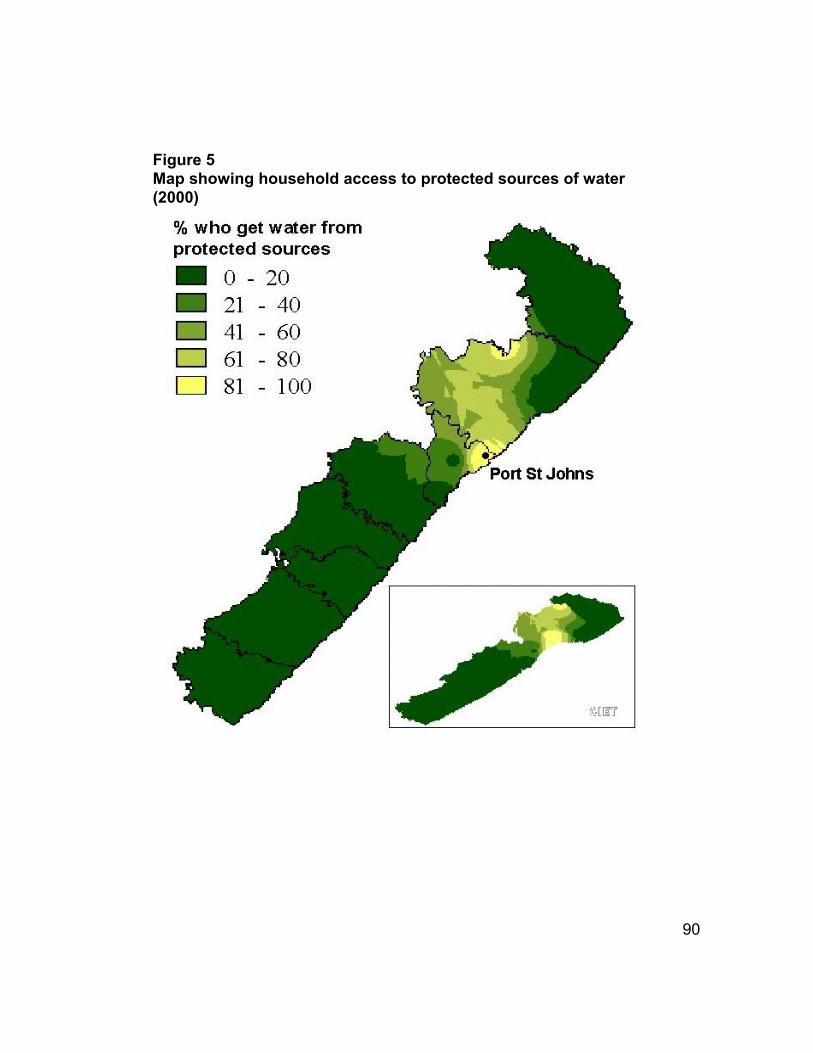
90
Figure 5Map showing household access to protected sources of water(2000)

91
Figure 6Percent of the adult population who worked for income in themonth prior to the survey

92
Figure 7Percent of the adult population who are currently looking forwork – by employment status (2000)
93
Figure 8Percent of households who currently have loans or credit

94
Figure 9Sample page from the Wild Coast Year 2000 calendar
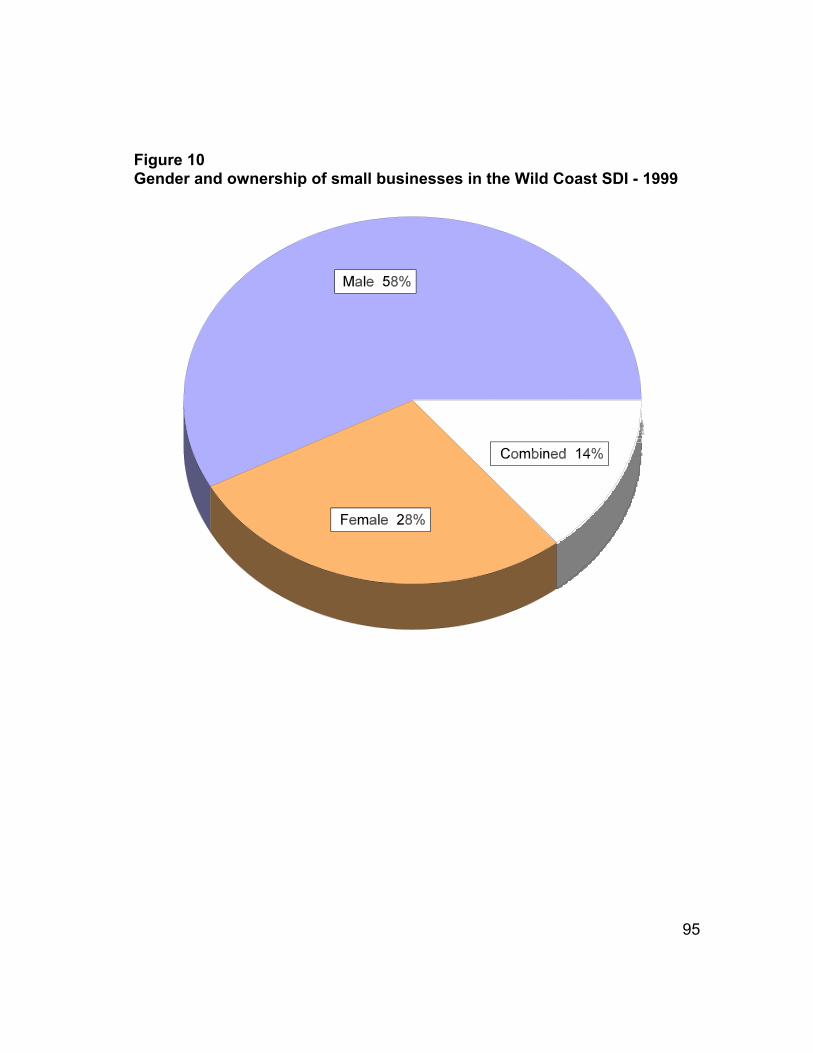
95
Figure 10Gender and ownership of small businesses in the Wild Coast SDI - 1999

96
Figure 11A 3D portrayal of business density in the Wild Coast SDI - 1999 (number of businesses per 10,000 people)

97
Figure 12Students who had heard of the Wild Coast SDI - 1999 (percent in each district)

98
Table 1 Information about the SDI: % (number) of households who found out about the SDI from each source
1997 (n=578) 2000 (n=525)
headman/community meetings 24% (136) 50% (261)
neighbours/friends/family 11% (66) 21% (108)
radio/media 37% (216) 19% (98)
SDI facilitator 17% (100) 1% (6)
other sources 10% (60) 10% (52)
9. Tables

99
Table 2 Satisfaction with the education system -- 2000
2000
% satisfied with the education system 75% (1745/2329)
% who did not want to see changes with theeducation system
67% (1513/2265)
changes with the education system (among those who want to see changes)
more/better schools 31% (234/752)
lower costs 22% (169/752)
more/better teachers 15% (113/752)
better materials 5% (39/752)
change discipline 3% (25/752)
other 23% (172/752)

100
Table 3 Average yearly costs of education per student including school fees, books, and uniforms (anchor and non-anchor areas) -- 2000
Pre-school Grade 1-2 Grade 3-8
Anchor R103(n=91, se 22.4)
R137(n=365, se 4.5)
R265(n=893, se 7.1)
Non-anchor R133(n=256, se 18.1)
R160(n=728, se 5.4)
R313(n=1992, se 7.1)

101
Table 4 Use and cost of health services (among those whose last visit was within the month prior to the survey) -- 2000
% of visits average waitingtime
% who paid average amountpaid*
government clinic 77%(2371/3062)
72 min(n=2092, se 1.9)
20%(466/2356)
R4.40 (n=466, se 0.7)
hospital 12%(357/3062)
102 min(n=294, se 7.7)
56%(189/340)
R14.00 (n=189, se 1.2)
private/traditional 11%(333/3062)
57 min(n=293, se 7.9)
98%(281/287)
R74.00 (n=270, se 1.7)
*among those who paid

102
Table 5 Satisfaction with health services (anchor and non-anchor areas -- 2000
total anchor non-anchor
% satisfied with health services 65% (1517/2349) 63% (511/809) 65% (1006/1540)
% who did not want to see changeswith the health services
55% (1263/2290) 54% (426/795) 56% (837/1495)
changes with the health services (among those who want to see changes)
more medicine 39% (402/1027) 25% (94/369) 47% (308/658)
better service 23% (232/1027) 27% (101/369) 20% (131/658)
less travel/more clinics 22% (223/1027) 27% (101/369) 19% (122/658)
more workers/less waiting 8% (83/1027) 11% (41/369) 6% (42/658)
lower costs 3% (28/1027) 2% (9/369) 3% (19/658)
open more hours 2% (16/1027) 3% (10/369) 1% (6/658)
other 4% (43/1027) 3% (13/369) 5% (30/658)

103
Table 6 Use and cost of government administration services (among those who had used them within the last year) -- 2000
2000
average waiting time for service 106 minutes (n=880, se 5.5)
% who had to pay for service 28% (280/985)
average amount paid R57.00 (n=262, se 13.7)
% satisfied with service 71% (743/1044)
reason for contact with government administration services
ID documents 51% (500/978)
apply/claim pensions 14% (132/978)
collect welfare grants 11% (109/978)
collect money/salary 4% (40/978)
settle court case 3% (31/978)
seek employment 2% (21/978)
other reason 15% (145/978)

104
Table 7 Use and cost of public transport services (among those who had used them within the last month) -- 2000
2000
% satisfied with public transport service 66% (1246/1876)
average monthly household use 6 times (n=1809, se 0.2)
average monthly household expenditure
among satisfied users R94 (n=1223, se 3.3)
among dissatisfied users R120 (n=627, se 6.1)

105
Table 8 Household food security: average value of food produced and sold/traded among those who produced/sold food and % (number) of households who sold surplus food
1997 2000
food produced – cash value
R367(n=1303, se 16.3)
R340(n=846, se 19.3)
food sold/traded -- cash value R314 (n=179, se 45.9)
R274(n=66, se 61.3)
sold surplus food 14%(179/1301)
5%(66/1282)

106
Table 9 Level of education and employment – 2000
% who worked for income inthe month prior to the survey
average monthly take home pay
no education 8% (90/1108) R420 (n=81, se 39.4)
grade 3 - 7 13% (220/1707) R554 (n=176, se 38.6)
grade 8 and above 18% (458/2538) R930 (n=370, se 54.0)

107
Table 10 Household access to credits and loans (anchor and non-anchor areas) -- 2000
total anchor non-anchor
% who had loans at the time of thesurvey
41% (951/2302) 45% (357/790) 39% (594/1512)
average loan size (among those withloans)
R1158(n=756, se 143.1)
R1194(n=263, se 317.4)
R1138(n=493, se 139.9)
average monthly payment on loans R279(n=951, se 7.8)
R281(n-257, se 14.5)
R277(n=594, se 8.95)
source of the loan
local shop 85% (783/917) 89% (300/339) 84% (483/578)
neighbour/relative 4% (34/917) 5% (18/339) 3% (16/578)
credit union/association 4% (37/917) 2% (5/339) 6% (32/578)
other 7% (63/917) 5% (16/339) 8% (47/578)
purpose of the loan
groceries 76% (694/911) 81% (276/339) 73% (418/572)
furniture 6% (57/911) 3% (9/339) 8% (48/572)
household improvements 4% (40/911) 3% (11/339) 5% (29/572)
school fees 2% (19/911) 1% (4/339) 3% (15/572)
other 11% (101/911) 12% (39/339) 11% (62/572)
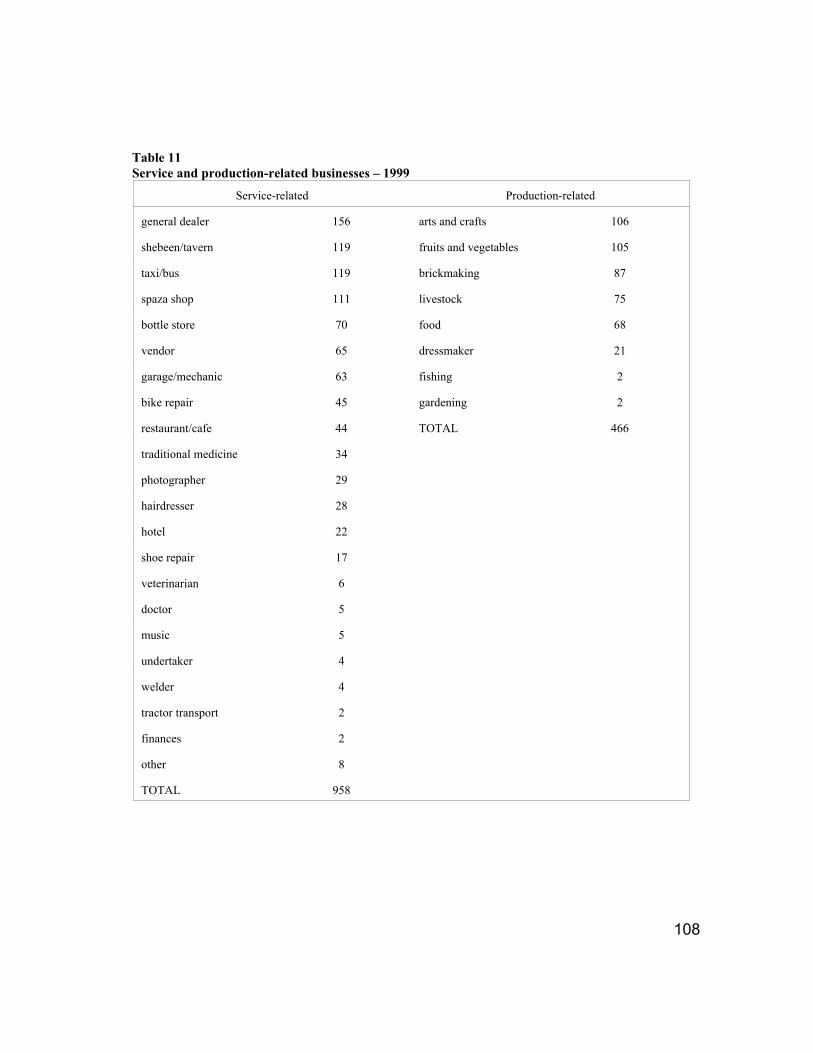
108
Table 11 Service and production-related businesses – 1999
Service-related Production-related
general dealer 156 arts and crafts 106
shebeen/tavern 119 fruits and vegetables 105
taxi/bus 119 brickmaking 87
spaza shop 111 livestock 75
bottle store 70 food 68
vendor 65 dressmaker 21
garage/mechanic 63 fishing 2
bike repair 45 gardening 2
restaurant/cafe 44 TOTAL 466
traditional medicine 34
photographer 29
hairdresser 28
hotel 22
shoe repair 17
veterinarian 6
doctor 5
music 5
undertaker 4
welder 4
tractor transport 2
finances 2
other 8
TOTAL 958

109
Table 12 Reasons for students not starting their own businesses -- 1999
Part of the reason The only reason
Lack of finances 90% (1243/1381) 18% (238/1315)
Lack of knowledge 63% (865/1374) 2% (30/1315)
Not knowing what kind ofbusiness to do
53% (721/1374) 1% (10/1315)
Lack of customers 32% (445/1373) 1% (2/1315)
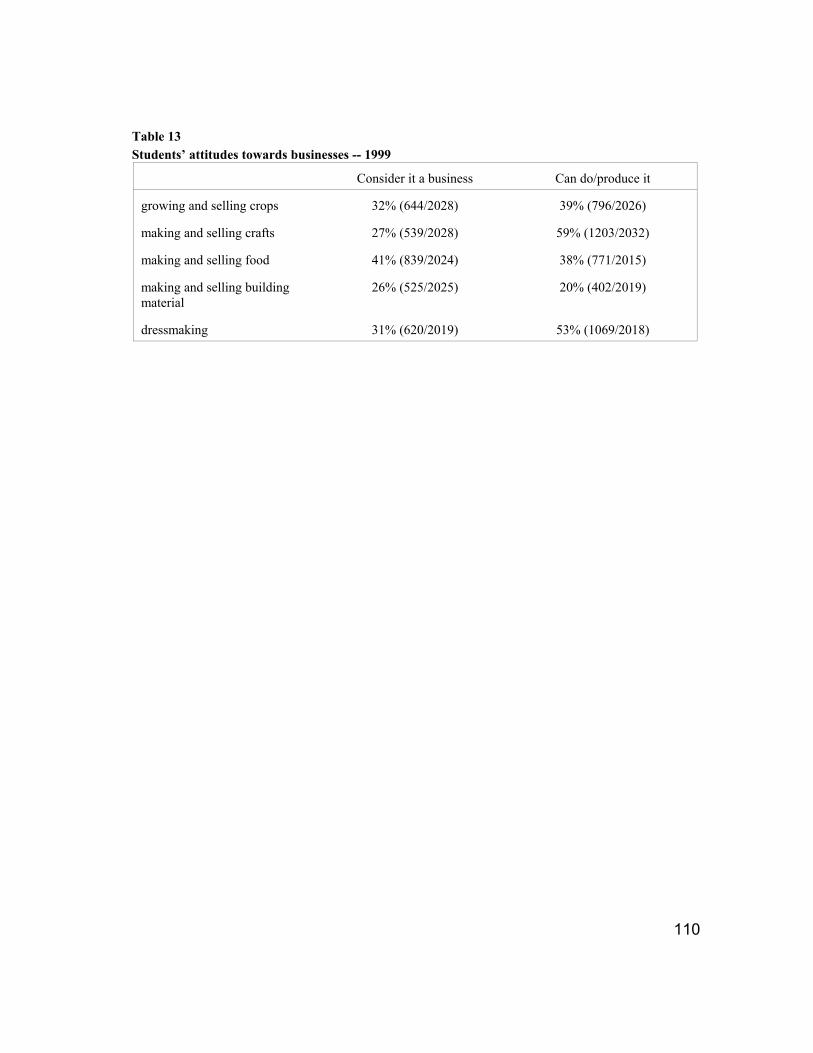
110
Table 13 Students’ attitudes towards businesses -- 1999
Consider it a business Can do/produce it
growing and selling crops 32% (644/2028) 39% (796/2026)
making and selling crafts 27% (539/2028) 59% (1203/2032)
making and selling food 41% (839/2024) 38% (771/2015)
making and selling buildingmaterial
26% (525/2025) 20% (402/2019)
dressmaking 31% (620/2019) 53% (1069/2018)

111
10. References
1. Perroux F. Economic Space: Theory and Applications. Quarterly Journal ofEconomics. 1950. Vol 34:1, 89-104.
2. Thomas MD. Growth Pole Theory: An Examination of Some of its BasicConcepts. In: Hansen, N, ed. Growth Centers in a Regional EconomicDevelopment. The Free Press, New York, 1972.
3. Parr JB. Growth-pole strategies in Regional Economic Planning: ARetrospective View. Part 1. Origins and Advocacy. Urban Studies. 1999. Vol 36:7,1195-1215.
4. Coffey WJ, Polese M. The concept of local development: a stages model ofendogenous regional growth. Papers of the Regional Science Association. 1984vol 55, 1-12.
5. Coffey WJ, Polese M. Local Development: Conceptual Bases and PolicyImplications. Regional Studies. 1985 vol 19:2, 85-93.
6. Cook P, Hulme D. The Compatibility of Market Liberalization and LocalEconomic Development Strategies. Regional Studies. 1988 vol 22:3, 221-231.
7. IDRC SME program Initiative Site http://www.idrc.ca/smmeit/research.html.
8. McCormick D. African Enterprise Clusters and Industrialization: Theory andReality. World Development. 1999 vol 27:9, 1515-1530.
9. Mead DC and Liedholm C. The Dynamics of Micro and Small Enterprises inDeveloping Countries. World Development. 1998 vol 26:1, 61-74.
10. Downing J. The Growth and Dynamics of Women Entrepreneurs in SouthernAfrica. In: Hase-Midamba, B. Ekechi F, eds. African Market Women and EconomicPower: The Role of Women in African Economic Development. Contributions inAfro-American and African Studies Number 174. Greenwood Press, London, 1995.
11. Lefakane, T. Spatial Development Initiatives (SDIs). South Africa IndustrySector Analysis Reports, 1998.
12. Arkwright D, de Beer G, Mmatli R. Spatial Development Initiatives in SouthAfrica - Progress Achieved and Future Objectives. SAPES Trust AnnualColloquium: Harare, September 1998.

112
13. Mahlati V. Integrated Planning and Implementation in Rural Areas:Experiences from Agri-Tourism Spatial Development Initiatives. Presented At theLand and Agrarian Reform Conference, Broederstroom, 28 July, 1999.
14. Dangermond J. Geographic Information System Technology and DevelopmentPlanning. Regional Development Dialogue. 1990. Vol 11:3, 1-14.
15. Williams KG, Shalaby TS, Whitehouse P. Spatial Analysis and GIS for planningin Developing Countries. Case Studies from Africa: Mauritius and Kenya.Proceedings of the Fifth European Conference and Exhibition on GeographicInformation Systems, EGIS `94. Utrecht: EGIS Foundation, 1994. 1:724-733.
16. Kelley K. GIS In Economic Development And Business Decision Support.Presented at the 1996 Americas Conference on Information Systems. Phoenix,Arizona, 1996.
17. Andersson N. Evidence based-planning. The Philosophy and Methods ofSentinel Community Surveillance. CIETinternational/World Bank. 1996.
18. Swaminathan A, Whitaker C, Andersson N, Barlevi H. Angola Mine AwarenessEvaluation: Summary. Luanda: UNICEF-DFAIT-CIET; 2000.
19. Andersson N, Mhatre S, Naidoo S, Mayet N, Mqotsi N, Penderis M, et al.Beyond victims and villains: the culture of sexual violence in South Johannesburg.Johannesburg: CIETafrica/SMLC; June 2000.
20. Andersson N, Paredes S, Omer K. Gender gap in primary education. Sindh:Government of Sindh, Pakistan/UNICEF; 1996.
21. Andersson N. The social conditions for health in Serbia. New York:CIETinternational; 1994.
22. Epi Info. A word-processing database and statistics system for epidemiologyon microcomputers. Epidemiology program office, Centres for Disease Control andPrevention, Atlanta, USA. Version 6.04c, 1997, http://www.cdc.gov/epiinfo.
23. Andersson N. The use of statistics in planning: the Mantel-Haenszelprocedure. Notes prepared for the 1999 Summer Course on evidence-basedplanning. CIETcanada-Health Canada-University of Ottawa. June 4, 1999.
24. Andersson N, Whitaker C, Swaminathan A. Afghanistan: The 1997 NationalMine Awareness Evaluation. CIETinternational, November 1998.

113
25. Andersson N and Galt K. The Wild Coast SDI. Community Needs and Views ofDevelopment 1997 Baseline. CIETinternational/Ecsecc. Bisho, May 1998, page 3.
26. Andersson N and Galt K. The Wild Coast SDI. Community Needs and Views ofDevelopment 1997 Baseline. CIETinternational/Ecsecc. Bisho, May 1998, page 1.
27. Mahlati V. Integrated Planning and Implementation in Rural Areas:Experiences from Agri-Tourism Spatial Development Initiatives. Presented At theLand and Agrarian Reform Conference, Broederstroom, 28 July, 1999, section 2.1.
28. Andersson N and Galt K. The Wild Coast SDI. Community Needs and Views ofDevelopment 1997 Baseline. CIETinternational/Ecsecc. Bisho, May 1998, page 4.
29. Mahlati V. Integrated Planning and Implementation in Rural Areas:Experiences from Agri-Tourism Spatial Development Initiatives. Presented At theLand and Agrarian Reform Conference, Broederstroom, 28 July, 1999, section 1.2.
30. Eastern Cape Provincial Government Speech by MEC Godongwana SpellingOut Plans for Wild Coast, 8 May 2001. Retrieved from the internethttp://www.ecprov.gov.za/speeches/finance/2001/plans.htm.
31. Mitchell S, Merhi S, Myburg M, and Andersson N. The limits of investment-leddevelopment. Impact assessment of the Wild Coast SDI 1997-2000. CIETafrica.East London, January 2001.
32. Mitchell S, Merhi S, Myburg M, Campbell N, Mqotsi N, and Andersson N.Mapping local economic activity in the Wild Coast SDI. CIETafrica. Bisho, May2000.
33. ArcView GIS. Environmental Systems Research Institute. Version 3.0a, 1998.
34. Daily Dispatch Online, October 27, 1999.http://www.dispatch.co.za/1999/10/27/business/buss.htm.

A2-1
Annex A2Atlas of Wild Coast SDI cycle 2 (1999)
Map
1. Percent of grade 12 students who had heard of the Wild Coast SDI . . . . . . . . . . . . . . . . . . . . . . . . . . . . . . . . . . . . . . . . . . . . . . . . . . . . . . . . . . . . . A2-3
2. Percent of grade 12 students who feel the kind of work they are looking for is available in their community . . . . . . . . . . A2-3
3. Percent of grade 12 students who say they will live in their community after leaving school . . . . . . . . . . . . . . . . . . . . . . . . . . . . . A2-4
4. Percent of grade 12 students who walk more than 30 minutes to get to school . . . . . . . . . . . . . . . . . . . . . . . . . . . . . . . . . . . . . . . . . . . A2-4
5. Percent of grade 12 students who feel returning migrants who were retrenched will affect their chances of a futurelivelihood . . . . . . . . . . . . . . . . . . . . . . . . . . . . . . . . . . . . . . . . . . . . . . . . . . . . . . . . . . . . A2-5
6. Percent of grade 12 students who think girls have a better chance of making a livelihood in their community . . . . . . A2-5
7. Percent of grade 12 students who think further education will affect their chances of a future livelihood . . . . . . . . . . . . . . A2-6
8. Percent of grade 12 students who have considered starting their own business . . . . . . . . . . . . . . . . . . . . . . . . . . . . . . . . . . . . . . . . A2-6
9. Percent of grade 12 students who have not considered starting their own business due to a lack of finances . . . . . . . . A2-7
10. Percent of grade 12 students who have not considered starting their own business due to a lack of knowledge . . . . . . . A2-7
11. Percent of grade 12 students who have not considered starting their own business because they do not know what kind of business to do . . . . . . . . . . . . . . . . . . . . . . . . . . . . . . . . . . . . . . . . . . . . . . A2-8
12. Percent of grade 12 students who have not considered starting their own business due to a lack of customers . . . . . . . A2-8
13. Percent of grade 12 students who feel they could produce crops . . . . . . . . . . . . . . . . . . . . . . . . . . . . . . . . . . . . . . . . . . . . . . . . . . . . . . . . A2-9
14. Percent of grade 12 students who see growing and selling crops as a small business . . . . . . . . . . . . . . . . . . . . . . . . . . . . . . . A2-9

A2-2
15. Percent of grade 12 students who feel they could produce crafts . . . . . . . . . . . . . . . . . . . . . . . . . . . . . . . . . . . . . . . . . . . . . . . . . . . . . A2-10
16. Percent of grade 12 students who see selling crafts as a small business . . . . . . . . . . . . . . . . . . . . . . . . . . . . . . . . . . . . . . . . . . . . . . . A2-10
17. Percent of grade 12 students who feel they could produce food to sell . . . . . . . . . . . . . . . . . . . . . . . . . . . . . . . . . . . . . . . . . . . . . . A2-11
18. Percent of grade 12 students who see selling food as a small business . . . . . . . . . . . . . . . . . . . . . . . . . . . . . . . . . . . . . . . . . . . . . . . . . . . A2-11
19. Percent of grade 12 students who feel they could produce building bricks . . . . . . . . . . . . . . . . . . . . . . . . . . . . . . . . . . . . . . . . . . A2-12
20. Percent of grade 12 students who see making and selling of building materials as a small business . . . . . . . . . . . A2-12
21. Percent of grade 12 students who feel they could produce clothes to sell . . . . . . . . . . . . . . . . . . . . . . . . . . . . . . . . . . . . . . . . . . A2-13
22. Percent of grade 12 students who see dressmaking as a small business . . . . . . . . . . . . . . . . . . . . . . . . . . . . . . . . . . . . . . . . . . . . . . . A2-13
23. Percent of grade 12 students who are members of a stokvel . . . . . . . . . . . . . . . . . . . . . . . . . . . . . . . . . . . . . . . . . . . . . . . . . . . . . . . . . . . . . . A2-14
24. Percent of grade 12 students who consider membership in a stokvel as a small business . . . . . . . . . . . . . . . . . . . . . . . . . . . . . . . . A2-14

A2-3
Percent of grade 12 students who had heard of the Wild Coast SDI
Source: WCSDI Cycle 2 (1999)
% who had heard of the SDI
Percent of grade 12 students who feel the kind of work they are looking for is available in their community
% work incommunity
Source: WCSDI Cycle 2 (1999)

A2-4
Percent of grade 12 students who say they will live in their community after leaving school
% who will live in community
Source: WCSDI Cycle 2 (1999)
Percent of grade 12 students who walk more than 30 minutes to get to school
% who walk morethan 30 minutes
Source: WCSDI Cycle 2 (1999)
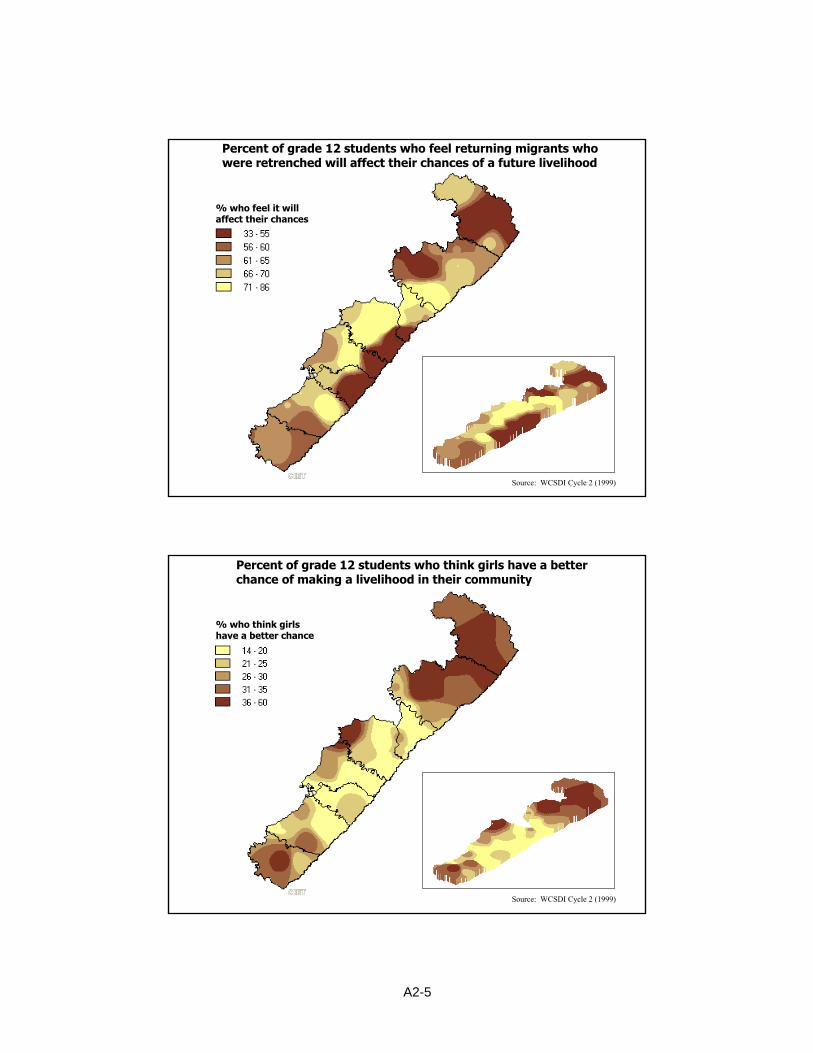
A2-5
Percent of grade 12 students who feel returning migrants who were retrenched will affect their chances of a future livelihood
% who feel it will affect their chances
Source: WCSDI Cycle 2 (1999)
Percent of grade 12 students who think girls have a better chance of making a livelihood in their community
% who think girlshave a better chance
Source: WCSDI Cycle 2 (1999)

A2-6
Percent of grade 12 students who think further education will affect their chances of a future livelihood
% who feel it willaffect their chances
Source: WCSDI Cycle 2 (1999)
Percent of grade 12 students who have considered starting their own business
% who have considered starting their own business
Source: WCSDI Cycle 2 (1999)

A2-7
Percent of grade 12 students who have not considered starting their own business due to a lack of finances
% due to a lack of finances
Source: WCSDI Cycle 2 (1999)
Percent of grade 12 students who have not considered starting their own business due to a lack of knowledge
% due to a lackof knowledge
Source: WCSDI Cycle 2 (1999)
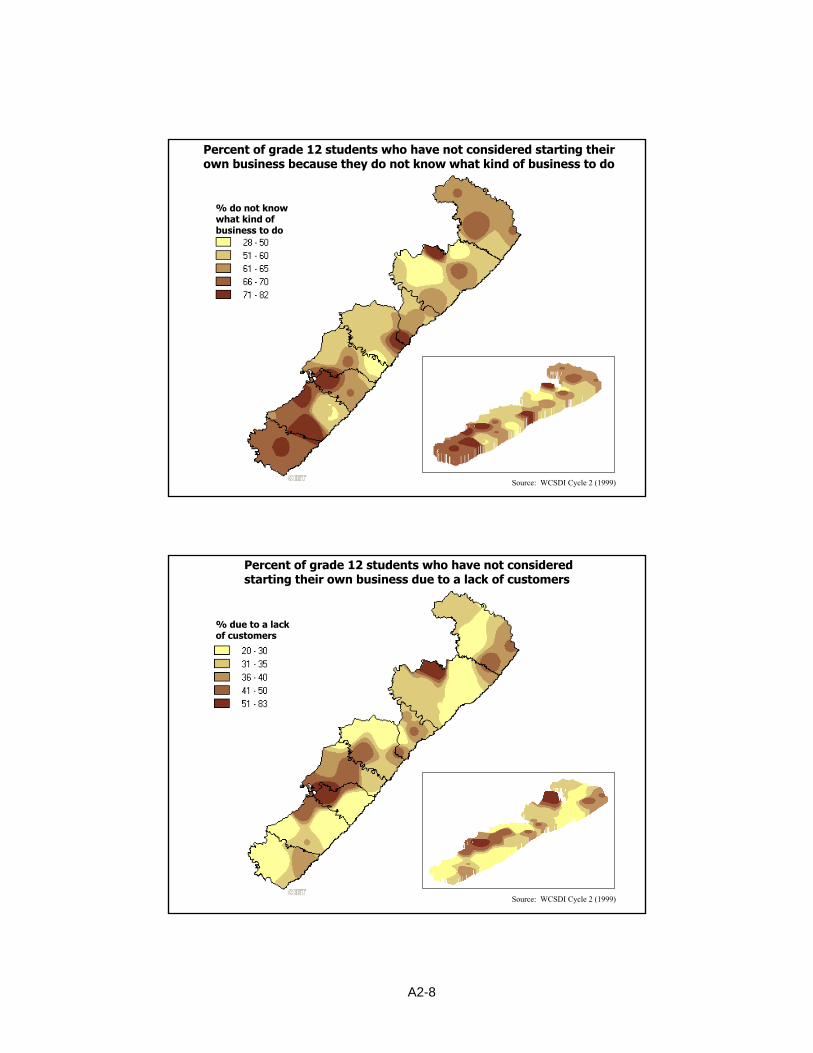
A2-8
Percent of grade 12 students who have not considered starting their own business because they do not know what kind of business to do
% do not know what kind of business to do
Source: WCSDI Cycle 2 (1999)
Percent of grade 12 students who have not considered starting their own business due to a lack of customers
% due to a lackof customers
Source: WCSDI Cycle 2 (1999)

A2-9
Percent of grade 12 students who feel they could produce crops
% who couldproduce crops
Source: WCSDI Cycle 2 (1999)
Percent of grade 12 students who see growing and selling crops as a small business
% who see cropsas a business
Source: WCSDI Cycle 2 (1999)

A2-10
Percent of grade 12 students who feel they could produce crafts
% who couldproduce crafts
Source: WCSDI Cycle 2 (1999)
Percent of grade 12 students who see selling crafts as a small business
% who see craftsas a business
Source: WCSDI Cycle 2 (1999)

A2-11
Percent of grade 12 students who feel they could produce food to sell
% who couldproduce food
Source: WCSDI Cycle 2 (1999)
Percent of grade 12 students who see selling food as a small business
% who see foodas a business
Source: WCSDI Cycle 2 (1999)
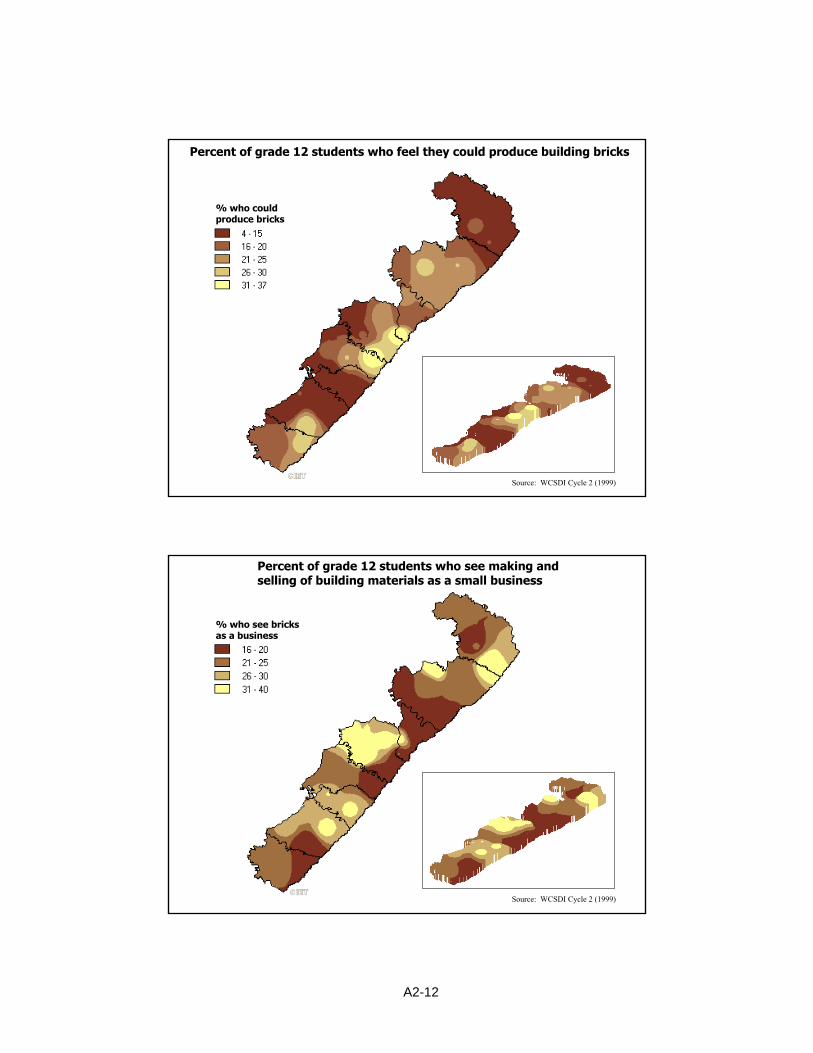
A2-12
Percent of grade 12 students who feel they could produce building bricks
% who couldproduce bricks
Source: WCSDI Cycle 2 (1999)
Percent of grade 12 students who see making and selling of building materials as a small business
% who see bricksas a business
Source: WCSDI Cycle 2 (1999)

A2-13
Percent of grade 12 students who feel they could produce clothes to sell
% who couldproduce clothes
Source: WCSDI Cycle 2 (1999)
Percent of grade 12 students who see dressmaking as a small business
% who see dressmakingas a business
Source: WCSDI Cycle 2 (1999)

A2-14
Percent of grade 12 students who are members of a stokvel
% members of a stokvel
Source: WCSDI Cycle 2 (1999)
Percent of grade 12 students who consider membership in a stokvel as a small business
% see a stokvelas a business
Source: WCSDI Cycle 2 (1999)

B2-1
Annex B2Atlas of Wild Coast SDI cycle 3 (2000)
Map
1. Percent of respondents who had heard of the Wild Coast SDI - 1997 . . . . . . . . . . . . . . . . . . . . . . . . . . . . . . . . . . . . . . . . . . . . . . . . . . . . . B2-2
2. Percent of respondents who had heard of the Wild Coast SDI - 2000 . . . . . . . . . . . . . . . . . . . . . . . . . . . . . . . . . . . . . . . . . . . . . . . . . . . . . B2-2
3. Percent of households who get their water from protected sources - 1997 . . . . . . . . . . . . . . . . . . . . . . . . . . . . . . . . . . . . . . . . . . . B2-3
4. Percent of households who get their water from protected sources - 2000 . . . . . . . . . . . . . . . . . . . . . . . . . . . . . . . . . . . . . . . . . . . B2-3
5. Percent of respondents who claim money/unemploymentis their households main problem - 1997 . . . . . . . . . . . . . . . . . . . . . . . . . B2-4
6. Percent of respondents who claim money/unemploymentis their households main problem - 2000 . . . . . . . . . . . . . . . . . . . . . . . . . B2-4
7. Percent of households who do not have any landunder cultivation - 1997 . . . . . . . . . . . . . . . . . . . . . . . . . . . . . . . . . . . . . . . . . . . B2-5
8. Percent of households who do not have any landunder cultivation - 2000 . . . . . . . . . . . . . . . . . . . . . . . . . . . . . . . . . . . . . . . . . . . B2-5
9. Percent of households who did not produce any food in the last year - 1997 . . . . . . . . . . . . . . . . . . . . . . . . . . . . . . . . . . . . . . B2-6
10. Percent of households who did not produce any food in the last year - 2000 . . . . . . . . . . . . . . . . . . . . . . . . . . . . . . . . . . . . . . B2-6
11. Percent of households who sold/traded surplus food - 1997 . . . . . . . . . . . . . . . . . . . . . . . . . . . . . . . . . . . . . . . . . . . . . . . . . . . . . . . . . . . B2-7
12. Percent of households who sold/traded surplus food - 2000 . . . . . . . . . . . . . . . . . . . . . . . . . . . . . . . . . . . . . . . . . . . . . . . . . . . . . . . . . . . B2-7

B2-2
Source: Wild Coast SDI cycle 1 1997
Percent of respondents who had heard of the Wild Coast SDI - 1997
% who had heard of the SDI
Source: Wild Coast SDI cycle 3 2000
% who had heardof the SDI
Percent of respondents who had heard of the Wild Coast SDI - 2000

B2-3
Percent of households who get their water from protected sources - 1997
Source: Wild Coast SDI cycle 1 1997
% who get their waterfrom protected sources
Source: Wild Coast SDI cycle 3 2000
% who get their waterfrom protected sources
Percent of households who get their water from protected sources - 2000

B2-4
Percent of respondents who claim money/unemployment is their households main problem - 1997
Source: Wild Coast SDI cycle 1 1997
% who claim money/unemployment is their main problem
Source: Wild Coast SDI cycle 3 2000
% who claim money/unemployment is their main problem
Percent of respondents who claim money/unemployment is their households main problem - 2000
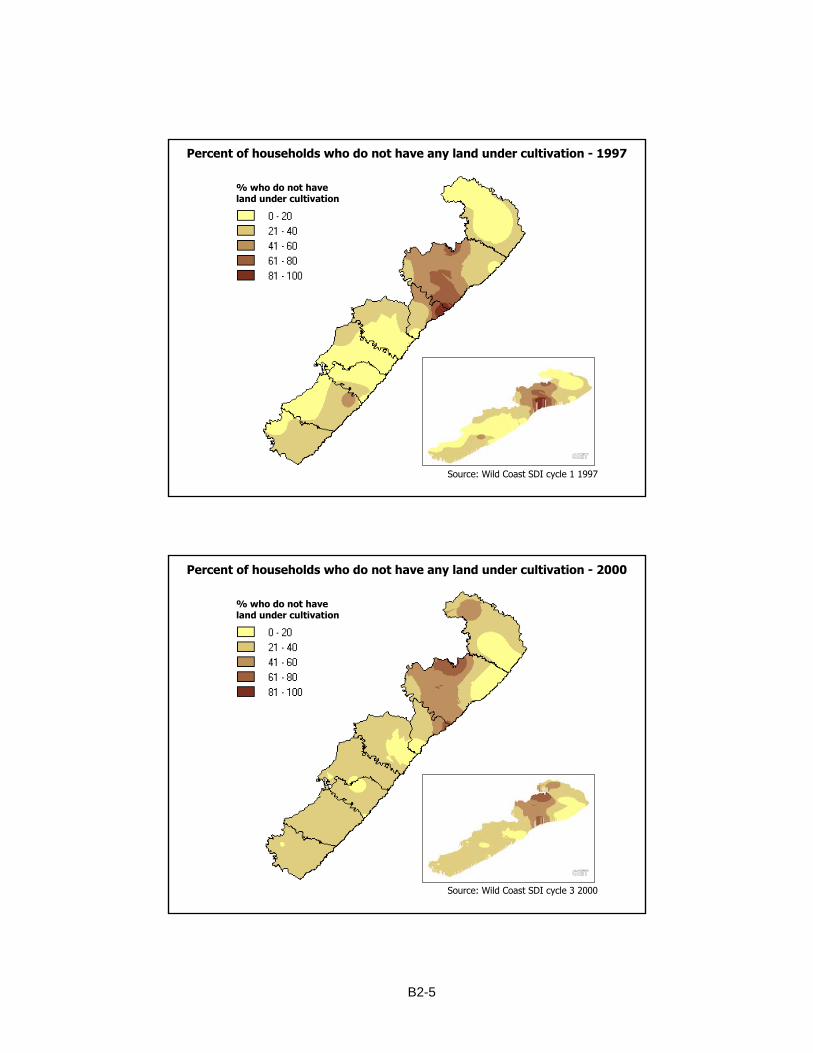
B2-5
Percent of households who do not have any land under cultivation - 1997
% who do not have land under cultivation
Source: Wild Coast SDI cycle 1 1997
Source: Wild Coast SDI cycle 3 2000
% who do not have land under cultivation
Percent of households who do not have any land under cultivation - 2000

B2-6
Percent of households who did not produce any food in the last year - 1997
% who did not produce any food
Source: Wild Coast SDI cycle 1 1997
Source: Wild Coast SDI cycle 3 2000
% who did not produce any food
Percent of households who did not produce any food in the last year - 2000

B2-7
Percent of households who sold/traded surplus food - 1997
Source: Wild Coast SDI cycle 1 1997
% who sold/tradedsurplus food
Source: Wild Coast SDI cycle 3 2000
% who sold/tradedsurplus food
Percent of households who sold/traded surplus food - 2000