mapping global gold doré flows · mapping global gold doré flows . 11th india international gold...
TRANSCRIPT
Mapping Global Gold Doré Flows
11th India International Gold Convention 13th September, 2014

About Metals Focus • Truly independent precious metals consultancy
• Experienced team of precious metals specialists, 16-strong, based in 7 countries
• Not just desk-based research – extensive travel programme, with regular visits to key market participants in major markets

Presentation Outline
• General Background - What is doré? - The market for gold doré - How is gold doré produced? - Where is gold doré produced?
• Breakdown of gold doré supply - Analysis of captive markets
• The outlook for gold doré supply - Key growth regions
• Conclusions

The Gold and Silver Doré Flows Service offers a detail insight into the global flow of gold and silver doré from mine site to refiner. Designed to aid the industry as it plan ahead, identify opportunities and achieve economies all against the backdrop of falling feed from secondary sources and growing focus on sourcing compliance and risk management.
The service includes: - Over 725 mine and projects, with mine-by-mine production outlook to 2030. - Wide range of project details, including development status, mine site costs, ownership and current information on doré metal content & refining location (where known). - Monthly database updates (delivered in excel) with a bi-annual report. For more information, please contact; [email protected]
Metals Focus – Doré Flows Service

• Typically a gold-silver alloy, with less than 5% impurities.
• Impurities: non-precious metals, eg copper, lead, bismuth.
• Above certain limits these impurities can be damaging, can incur a refining penalty charge.
What is doré?

• The market for gold doré is relatively stable compared with base metals.
• Refining a relatively minor part of a gold mine’s operating costs.
• Global gold refining capacity ~2.5 times greater than annual gold mine production.
• Miners offered better rates, due to the regular consistent source.
• Gold’s high unit value opens up an array of refining options.
The market for gold doré

How is gold doré produced? • ~85% of global gold production
is recovered to doré (or a gold rich concentrate); ~2,550t/yr of gold.
• Gold is mined from ore, from rock containing: - Open pit 0.5-2.5 g/t - Underground 4-7 g/t
• Processing methods vary depending on the mineralogy of the deposit, typically involves the extraction of gold using cyanide.
Cortez, Nevada

How is gold doré produced?

Global gold production in 2013
Source: Metals Focus
1-China (438t)
2-Australia (265t)
3-Russia (248t)
4-USA (230t)
6-Peru (179t)
5-South Africa (182t)
7-Canada (125t)
8-Mexico (104t)
9-Ghana (102t)
10-Indonesia (96t)

Breakdown of global gold production How much doré is “readily” available?
Global Gold Mine Supply; +3,000 t/yr

Less informal gold production; ~350t/yr
Breakdown of global gold production How much doré is “readily” available?

Less by-product gold from base metal mining; ~300t/yr
Breakdown of global gold production How much doré is “readily” available?

Less gold recovered to concentrate (Au+Ag mines); ~200t/yr
Breakdown of global gold production How much doré is “readily” available?

Analysis of captive markets
1-China (438t)
2-Australia (265t)
3-Russia (248t)
5-South Africa (182t)
7-Canada (125t) Ontario (61t)
Source: Metals Focus
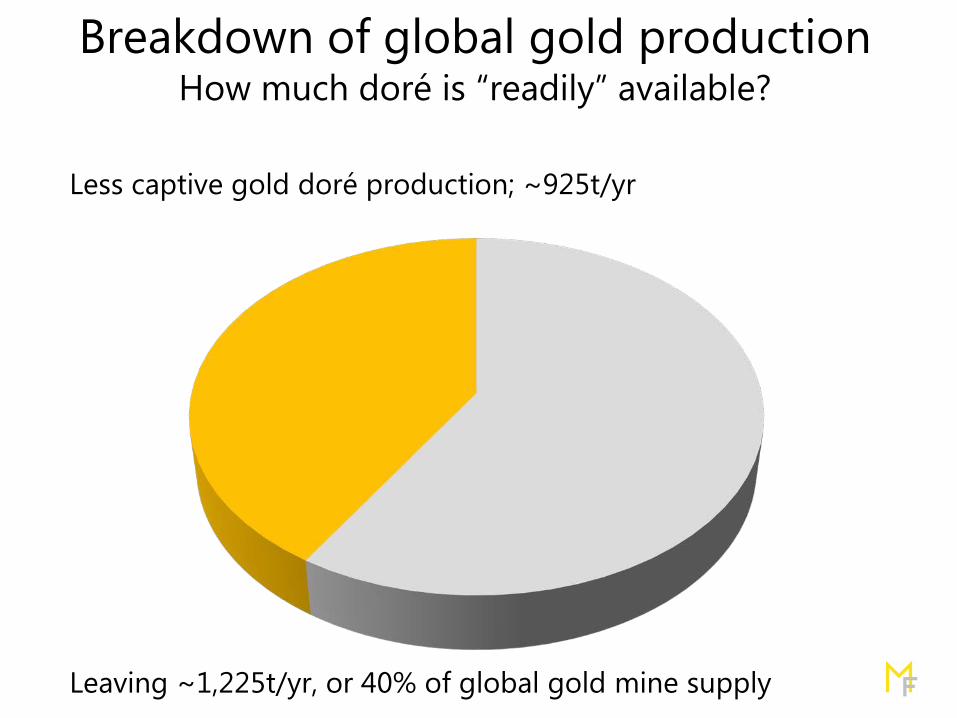
Less captive gold doré production; ~925t/yr
Leaving ~1,225t/yr, or 40% of global gold mine supply
Breakdown of global gold production How much doré is “readily” available?

Outlook for gold doré supply
800
1,000
1,200
1,400
1,600
1,800
2012 2013 2014 2015 2016 2017 2018
Operating Construction Feasibility Pre Feasibility Scoping
Source: Metals Focus Doré Flows Service, September 2014
Tonnes
Global gold in doré production capacity

Source: Metals Focus Doré Flows Service, September 2014
Tonnes
600
700
800
900
1,000
1,100
1,200
2012 2013 2014 2015 2016 2017 2018
Operating Construction Feasibility Pre Feasibility Scoping
Global gold in doré production capacity, less captive supply
Outlook for gold doré supply

Outlook for gold doré supply
* Includes the Caribbean Source: Metals Focus Doré Flows Service, September 2014
Tonnes
Global gold in doré production capacity, winners & losers, 2013 vs 2018
-20
-10
0
10
20
30
40
50
60
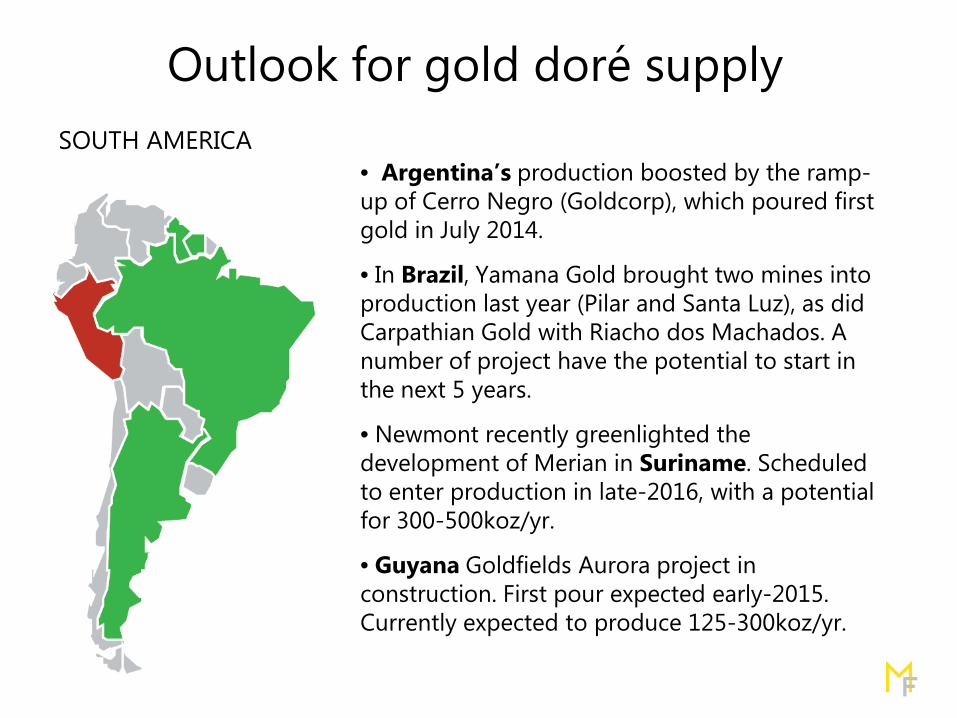
Outlook for gold doré supply SOUTH AMERICA
• Argentina’s production boosted by the ramp-up of Cerro Negro (Goldcorp), which poured first gold in July 2014.
• In Brazil, Yamana Gold brought two mines into production last year (Pilar and Santa Luz), as did Carpathian Gold with Riacho dos Machados. A number of project have the potential to start in the next 5 years.
• Newmont recently greenlighted the development of Merian in Suriname. Scheduled to enter production in late-2016, with a potential for 300-500koz/yr.
• Guyana Goldfields Aurora project in construction. First pour expected early-2015. Currently expected to produce 125-300koz/yr.

Outlook for gold doré supply AFRICA
• Democratic Republic of the Congo has seen three mines enter production in under two years. Twangiza and Namoya (Banro Corporation) and Kibali (JV: Randgold-AngloGold Ashanti). At full capacity, +600/yr of consolidated production.
• West Africa has seen a swathe of new projects over the past five years. And the region remains highly prospective.
• In August 2014, True Gold secures US$120 million to fully fund construction of its Karma project in Burkina Faso.
• The are currently a handful of other greenfield projects in West Africa with the potential to enter production in the next 5 years.
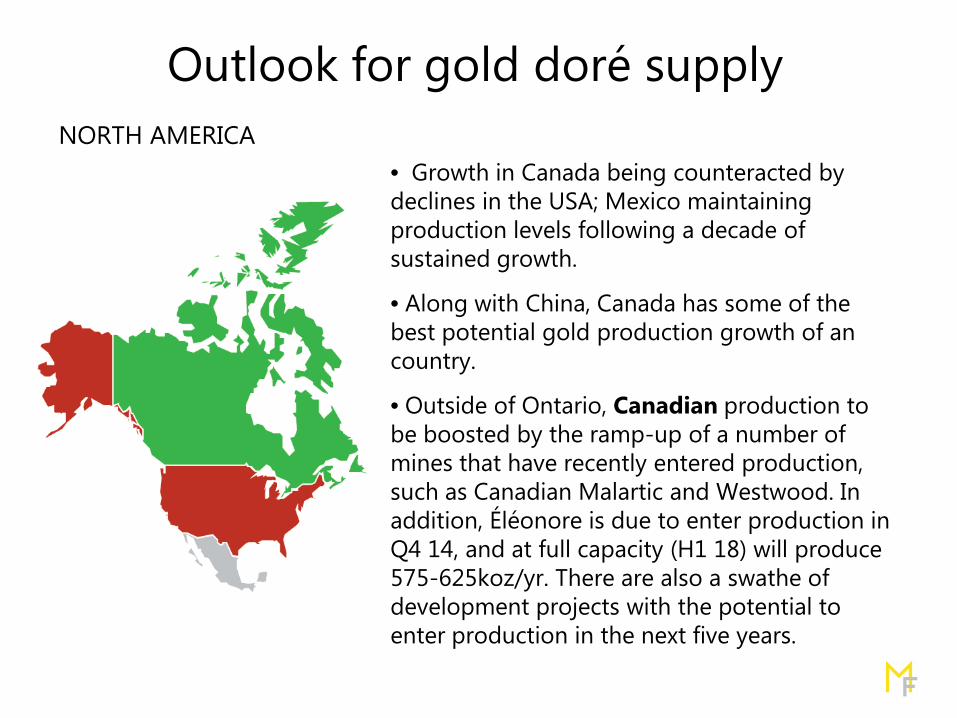
Outlook for gold doré supply NORTH AMERICA
• Growth in Canada being counteracted by declines in the USA; Mexico maintaining production levels following a decade of sustained growth.
• Along with China, Canada has some of the best potential gold production growth of an country.
• Outside of Ontario, Canadian production to be boosted by the ramp-up of a number of mines that have recently entered production, such as Canadian Malartic and Westwood. In addition, Éléonore is due to enter production in Q4 14, and at full capacity (H1 18) will produce 575-625koz/yr. There are also a swathe of development projects with the potential to enter production in the next five years.

Outlook for gold doré supply
• There exist the capacity to lift global gold doré higher, however there are a number of hurdles facing the industry:
– Current market has led to a very sharp drop in project spending across the gold sector, from majors, to developers and most strongly at the grass roots level.
– Our outlook for gold prices and significant company debt mean this is unlikely to reverse anytime soon.
– Many companies have shift there mindset from growing production to just focusing on returns to shareholders.
– Mining projects getting harder to develop; permit requirements, higher royalties and government free carry shares all cutting into investor returns.

Disclaimer & Copyright
Although every effort has been made to undertake this work with care and diligence, Metals Focus Data Ltd cannot guarantee the accuracy of any forecasts or assumptions. Nothing contained in this presentation constitutes an offer to buy or sell securities or commodities and nor does it constitute advice in relation to the buying or selling of investments. It is published only for informational purposes. Metals Focus Data Ltd does not accept responsibility for any losses or damages arising directly or indirectly from the use of this presentation.