mapping daily evapotranspiration and dryness index
TRANSCRIPT

HESSD7, 6285–6303, 2010
Mapping dailyevapotranspirationand dryness index
Z. Sun et al.
Title Page
Abstract Introduction
Conclusions References
Tables Figures
J I
J I
Back Close
Full Screen / Esc
Printer-friendly Version
Interactive Discussion
Discussion
Paper
|D
iscussionP
aper|
Discussion
Paper
|D
iscussionP
aper|
Hydrol. Earth Syst. Sci. Discuss., 7, 6285–6303, 2010www.hydrol-earth-syst-sci-discuss.net/7/6285/2010/doi:10.5194/hessd-7-6285-2010© Author(s) 2010. CC Attribution 3.0 License.
Hydrology andEarth System
SciencesDiscussions
This discussion paper is/has been under review for the journal Hydrology and EarthSystem Sciences (HESS). Please refer to the corresponding final paper in HESSif available.
Mapping daily evapotranspiration anddryness index in the East Africanhighlands using MODIS and SEVIRI data
Z. Sun1, M. Gebremichael1, and H. A. R. de Bruin2
1Civil & Environmental Engineering, University of Connecticut, 261 Glenbrook Road, Storrs,CT 06269-2037, USA2Associated Professor Emeritus, Wageningen University, freelance researcher, Bilthoven,The Netherlands
Received: 10 August 2010 – Accepted: 17 August 2010 – Published: 26 August 2010
Correspondence to: M. Gebremichael ([email protected])
Published by Copernicus Publications on behalf of the European Geosciences Union.
6285

HESSD7, 6285–6303, 2010
Mapping dailyevapotranspirationand dryness index
Z. Sun et al.
Title Page
Abstract Introduction
Conclusions References
Tables Figures
J I
J I
Back Close
Full Screen / Esc
Printer-friendly Version
Interactive Discussion
Discussion
Paper
|D
iscussionP
aper|
Discussion
Paper
|D
iscussionP
aper|
Abstract
Routine information on regional evapotranspiration (ET) and dryness index is essen-tial for agricultural water management, drought monitoring, and studies of water cycleand climate. However, this information is not currently available for the East Africahighlands. The main purpose of this study is to develop (1) a new methodology that5
produces spatially gridded daily ET estimates on a (near) real-time basis exclusivelyfrom satellite data, and (2) a new dryness index that depends only on satellite dataand weather forecast data. The methodology that calculates daily actual ET involvescombining data from two sensors (MODIS and SEVIRI) onboard two kinds of plat-forms (Terra/Aqua – polar orbit satellite and MSG – geostationary orbit satellite). The10
methodology is applied to the East African highlands, and results are compared to eddycovariance measurements at one site. Results show that the methodology producesET estimates that have high skills in reproducing the daily fluctuation in ET but tendsto underestimate ET on the average. It is concluded that the synergistic use of thepolar-orbiting MODIS data and the geostationary-orbiting SEVIRI data has potential to15
produce reliable daily ET, but further research is needed to improve the accuracy ofthe results. This study also proposes an operational new dryness index that can becalculated from the satellite-based actual daily ET estimates and reference daily ETestimates based on SEVIRI data and weather forecast air temperature. Comparisonof this index against ground measurements of actual daily ET at one site indicates that20
the new dryness index is operational for drought monitoring.
1 Introduction
Routine information on regional evapotranspiration (ET) and dryness index is essen-tial for agricultural water management, drought monitoring, and studies of water cycleand climate dynamics (Potter et al., 1993; Churkina et al., 1999; Nemani et al., 2002).25
The MODerate resolution Imaging Spectroradiometer (MODIS) sensor on board Terra
6286

HESSD7, 6285–6303, 2010
Mapping dailyevapotranspirationand dryness index
Z. Sun et al.
Title Page
Abstract Introduction
Conclusions References
Tables Figures
J I
J I
Back Close
Full Screen / Esc
Printer-friendly Version
Interactive Discussion
Discussion
Paper
|D
iscussionP
aper|
Discussion
Paper
|D
iscussionP
aper|
and Aqua satellites has long been recognized for its potential to produce frequent ETmaps across the globe. Few researchers have used MODIS data to produce ET mapsin different regions for some periods (Nagler et al., 2005; Patel et al., 2006; Mu etal., 2007; Wang et al., 2007; Cleugh et al., 2007; Mallick et al., 2007; Leuning et al.,2008; Venturim et al., 2008). However, despite these limited successes, we still do5
not have daily ET maps across the East African highlands available to the community.This is because current MODIS-based ET algorithms represent only “instantaneous orsnapshot” values (while daily aggregated ET maps are more meaningful and useful),and methods of scaling up the instantaneous value to daily require ground-based mea-surements of radiation, which are not readily available in the East African highlands.10
The first objective of this study is to develop a methodology for estimating daily ETexclusively from satellite data through the use of geostationary satellite data.
Dryness indices of land surface provide useful information for agricultural and waterresources managements. Among various dryness indices, two meteorological drynessindices are widely accepted and used, the Palmer’s Drought Severity Index (PSDI)15
(Palmer, 1965; Guttman et al., 1992) and the Standardized Precipitation Index (SPI)(Tsakiris and Vangelis, 2004). The PDSI is a “meteorological” drought index that re-sponds to weather conditions that have been abnormally dry or abnormally wet. ThePDSI is calculated based on precipitation, temperature and available water content ofthe soil. The major problem with the PDSI index is that only point measurements with20
over 15–20 years of record can be used in the calculation of the index and that the spa-tial coverage of the point meteorological measurement in the East African highlands isscarce. The SPI is another meteorological index that suffers from the same problemsas the PSDI index except that it overcomes the time lag problem associated with thePSDI index.25
In addition, the major pitfall of both indices is that they contain no economic com-ponent which is important to declare drought and seek help from the Government anddonors. Yield (economic analysis) is linearly related to accumulative evapotranspirationthrough the evapotranspiration production functions (Doorenbos and Kassam, 1979).
6287

HESSD7, 6285–6303, 2010
Mapping dailyevapotranspirationand dryness index
Z. Sun et al.
Title Page
Abstract Introduction
Conclusions References
Tables Figures
J I
J I
Back Close
Full Screen / Esc
Printer-friendly Version
Interactive Discussion
Discussion
Paper
|D
iscussionP
aper|
Discussion
Paper
|D
iscussionP
aper|
Therefore, evapotranspiration-based indices of drought or dryness are much more use-ful for real-world applications. Jackson et al. (1981) developed the Crop Water StressIndex (CWSI) that is determined by actual and potential ETs that require intensiveground-based measurements. The second objective of this study is to develop a dry-ness index that is based on satellite data and weather forecast data. In this study, we5
develop and apply a new methodology to calculate daily ET and dryness index overthe East African highlands, and assess the accuracy of the results by comparing themagainst flux tower measurements at one site in Sudan.
2 Data
The proposed methodology (in Sect. 3) requires inputs of MODIS and geostationary-10
orbiting satellite data to calculate daily actual ET. In addition to these inputs, weatherforecast air temperature data are also required to calculate the dryness index. Theresults of this methodology are validated using ground measurements from an eddycovariance flux site. Here, we discuss these data sources.
MODIS Data – MODIS sensor onboard the Terra and Aqua polar-orbiting satellites15
has 36 spectral bands over a wide range at moderate resolutions (250, 500, and1000 m) with almost daily coverage of the Earth (http://modis.gsfc.nasa.gov/). Weused three MODIS/Terra land data products: 8-day land surface temperature, yearlyInternational Geosphere-Biosphere Programme (IGBP) land cover map, and 16-dayNormalized Difference Vegetation Index (NDVI).20
SEVIRI Data – the Spinning Enhanced Visible InfraRed Imager (SEVIRI) sensoronboard the Meteorological Second Generation (MSG) geostationary-orbiting satelliteprovides 30/15-min observations of land surface and the atmosphere in 12 spectralbands for Europe, South America, and Africa at 3.1 km spatial resolution at nadir (http://www.esa.int/SPECIALS/MSG/). We used five SEVIRI/MSG data products: 30-min25
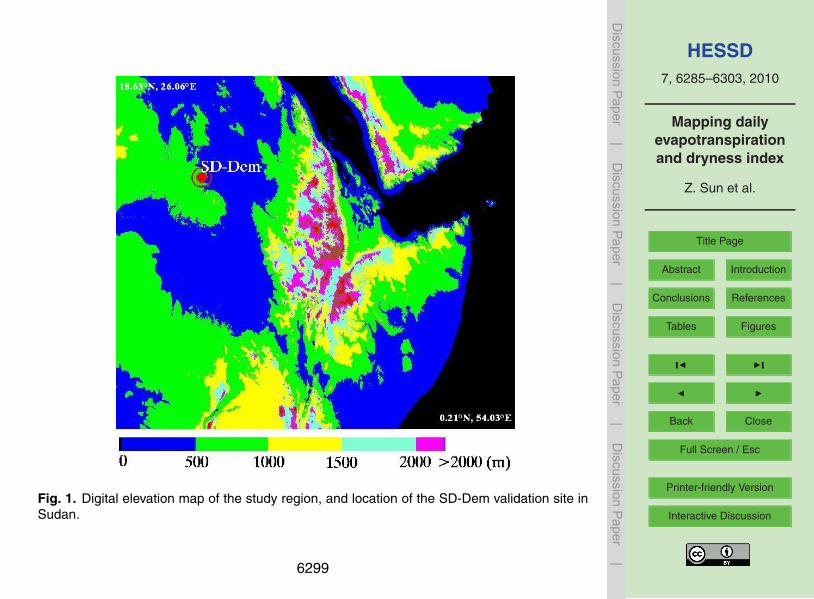
downwelling shortwave radiation flux (DSSF), 30-min downwelling long-wave radiationflux (DSLF), 15-min land surface temperature (LST), daily vegetation cover fraction(FVC), and static auxiliary digital elevation (DEM, see Fig. 1) data.
6288
HESSD7, 6285–6303, 2010
Mapping dailyevapotranspirationand dryness index
Z. Sun et al.
Title Page
Abstract Introduction
Conclusions References
Tables Figures
J I
J I
Back Close
Full Screen / Esc
Printer-friendly Version
Interactive Discussion
Discussion
Paper
|D
iscussionP
aper|
Discussion
Paper
|D
iscussionP
aper|
Weather forecast air temperature data – we obtained air temperature at 2 m height(T2 m) from forecasts provided by the European Centre for Medium-range WeatherForecasts (ECMWF) model. The initial 3-hourly T2 m forecasts at a resolution of about25 km are linearly interpolated in time to hourly, and bi-linearly interpolated in spaceto the SEVIRI/MSG resolution. The T2 m values undergo a further adjustment to cor-5
rect differences between ECMWF mode surface topography and SEVIRI pixel altitudeusing a constant lapse rate of 0.67 ◦C/100 m. See Trigo et al. (2010) for details aboutECMWF data.
Ground measurements – we obtained ground measurements of quality-controlled30-min net radiation, soil heat flux, sensible and latent heat fluxes from the SD-Dem10
CarboAfrica flux tower site in Sudan (see Fig. 1 for the location map). The SD-Demsite is located at 13.2829◦ N, 30.4783◦ E, 610 m above sea level, and is characterizedby a sparse acacia savanna land cover, mean annual mean air temperature of 28 ◦C,and mean annual precipitation of about 320 mm with the majority falling during June toOctober (Papale et al., 2006; Sjostrom et al., 2009). The measurements were available15
for the period 1 July–29 December 2007.
3 Methodology
The proposed methodology for the estimation of daily actual ET and dryness index isillustrated with a flow chart in Fig. 2. Here, we discuss in detail the algorithms involved.
3.1 Daily actual ET (ETd)20
ETd (mm/day) is estimated using inputs of daily net radiation (Rnd) and daily soil heatflux (Gd) derived from SEVIRI and “instantaneous” evaporative fraction (EF) during thedaytime derived from MODIS, and making the commonly used assumption that the EFis constant during the daytime (e.g., Brutsaert and Sugita, 1992):
6289

HESSD7, 6285–6303, 2010
Mapping dailyevapotranspirationand dryness index
Z. Sun et al.
Title Page
Abstract Introduction
Conclusions References
Tables Figures
J I
J I
Back Close
Full Screen / Esc
Printer-friendly Version
Interactive Discussion
Discussion
Paper
|D
iscussionP
aper|
Discussion
Paper
|D
iscussionP
aper|
ETd =EFd× (Rnd−Gd)=1λ
EFMODIS×∑
(RnSEVIRI−GSEVIRI) (1)
Where λ is the latent heat of vaporization, the subscript SEVIRI indicates that the datacomes from the 30-min SEVIRI product, the subscript MODIS indicates that the datacomes from the MODIS product which is typically available as “instantaneous” 8-daycomposite product, and the summation sign represents the summation of the 30-min5
data during a given day. Each of the terms involved in Eq. (1) are described below.EFMODIS is derived exclusively from MODIS data using the following equation:
EFMODIS =ETMODIS
QMODIS(2)
where Q(= Rn−G) is the available energy. We obtained ETMODIS and QMODIS usingour recently developed algorithm known as Sim-ReSET (Sun et al., 2009) that requires10
three MODIS products as input: land surface temperature, NDVI and land cover type.RnSEVIRI is derived exclusively from SEVIRI data using the following equation:
RnSEVIRI = (1−αSEVIRI)R↓S−SEVIRI
+R↓L−SEVIRI
−εSEVIRIσT4s−SEVIRI
(3)
where α is albedo, ε is emissivity, R↓S
is downwelling shortwave radiation, R↓L is down-
welling long-wave radiation, and Ts is surface temperature. R↓S, R↓
L, and Ts are directly15
from SEVIRI product. Both α and ε are estimated by means of SEVIRI FVC data (Sunet al., 2009).GSEVIRI is also derived exclusively from SEVIRI using the following equation:
GSEVIRI =RnSEVIRI[fveg−SEVIRIΓveg+ (1− fveg−SEVIRI)Γsoil] (4)
where fveg is the fractional vegetation cover (FVC), Γveg and Γsoil are the ratios of soil20
heat flux to net radiation for vegetation and bare soil. Both of them can be approxi-mately considered as constants, 0.1 and 0.4, respectively (Sun et al., 2009).
6290

HESSD7, 6285–6303, 2010
Mapping dailyevapotranspirationand dryness index
Z. Sun et al.
Title Page
Abstract Introduction
Conclusions References
Tables Figures
J I
J I
Back Close
Full Screen / Esc
Printer-friendly Version
Interactive Discussion
Discussion
Paper
|D
iscussionP
aper|
Discussion
Paper
|D
iscussionP
aper|
Matching MODIS and SEVIRI pixels – MODIS data are available at 1 km spatialresolution in sinusoidal projection while SEVIRI data are available at 3.1 km spatialresolution at nadir in geostationary satellite view (GEOS) projection. We reprojectedand resampled MODIS data to match the SEVIRI data.
3.2 Dryness Index (DI)5
Jackson et al. (1981) developed the CWSI which is determined from actual and poten-tial ET. The potential ET is typically calculated by multiplying the reference evapotran-spiration (ET0) by the crop coefficient (Kc) (Allen et al., 1998). However, it is difficult toestimate Kc from SEVIRI data due to the crop type heterogeneity in the large SEVIRIpixel. We propose a new dryness index (DI) that avoids Kc as follows:10
DI=
{1− ETd
ET0, for ET0 ≥ETd
0, for ET0 <ETd
(5)
We estimated ET0 using the modified Makkink equation. The modified Makkink equa-tion is a suitable alternative for Penman’s equation for the determination of ET0 (deBruin and Lablans, 1998) as follows:
ET0 =c1λ
∆∆+γ
∑R↓
S−SEVIRI(6)15
where c is a constant (0.65 suggested by de Bruin, 1998), γ is the psychrometricconstant (kPa/◦C), and ∆ is the slope of the saturation vapor pressure curve at airtemperature (kPa/◦C). We obtained T2 m from forecasts provided by the ECMWF model.Then ∆ is determined by means of T2 m, and γ is determined by means of the DEMdata:20
∆=4098[0.6108exp( 17.27T2 m
237.3+T2 m)]
(237.3+T2 m)2
6291

HESSD7, 6285–6303, 2010
Mapping dailyevapotranspirationand dryness index
Z. Sun et al.
Title Page
Abstract Introduction
Conclusions References
Tables Figures
J I
J I
Back Close
Full Screen / Esc
Printer-friendly Version
Interactive Discussion
Discussion
Paper
|D
iscussionP
aper|
Discussion
Paper
|D
iscussionP
aper|
Pa =101.3(1−0.0065z
293)5.26
γ =0.665×10⁻³Pa (7)
where Pa is the atmospheric pressure (kPa), z is the elevation above sea level (m). Adetailed description of the ET0 algorithm is available in de Bruin et al. (2010).
4 Results5
We applied our methodology to obtain satellite-based estimates of dryness index anddaily actual and references ETs for the Northeast Africa for the year 2007. Figure 3shows sample maps for different seasons. Since ET0 is controlled by solar radiation, airtemperature, and air pressure, its values are comparatively low in mountainous regionswith high altitudes (shown in brown and blue colors in Fig. 3). During the rainy season10
in Ethiopia, daily actual ET values are high (shown in blue) and dryness index valuesare low (shown in green), as expected.
The accuracy of our results was assessed through comparison with ground-basedmeasurements. In Fig. 4, the satellite-based daily actual ET estimates are comparedwith ground-based measurements at the SD-Dem site in Sudan. There is a good15
correlation (R2=0.87) between our satellite-based estimates and ground measure-ments, however, the satellite estimates tend to underestimate the daily actual ET byabout 30%. The mean absolute error (MAE) is 0.88 mm/day, which is better than the1∼1.5 mm/day range reported in other validation studies of satellite ET estimation (e.g.,Carlson et al., 1995; Gomez et al., 2005, Sanchez et al., 2008). In Fig. 5, the daily20
satellite-based dryness index estimates are compared against ground-based daily ac-tual ET measurements at the SD-Dem site. There is a good correlation (R2=0.86)between the two, indicating that the satellite-based dryness index estimates are rea-sonable. Ideally, the dryness index should be 100% when daily actual ET is 0, andshould decrease with increasing ET. Our results are consistent with this expectation:25
6292

HESSD7, 6285–6303, 2010
Mapping dailyevapotranspirationand dryness index
Z. Sun et al.
Title Page
Abstract Introduction
Conclusions References
Tables Figures
J I
J I
Back Close
Full Screen / Esc
Printer-friendly Version
Interactive Discussion
Discussion
Paper
|D
iscussionP
aper|
Discussion
Paper
|D
iscussionP
aper|
the dryness index estimate is 114% when ET is 0, and decreases with increasing ETwith a good correlation (R2=0.86). Validation of the satellite-based daily referenceET estimates in the Ethiopian highlands is addressed by de Bruin et al. (2010) whoreported satisfactory results on the accuracy of the satellite-based estimates.
5 Discussion5
Our results reveal that the synergistic use of MODIS and SEVIRI data has the potentialto provide realistic values of daily actual ET, daily reference CT, and daily drynessindex. However, the resulting daily ET values, calculated using our algorithm, tendto underestimate as compared to the eddy covariance measurements at the SD-Demsite. The discrepancy between the two values could be caused by factors, such as,10
algorithm limitation and the mismatch between the SEVIRI pixel and flux tower footprint,among others. In the following, we discuss these issues in further detail.
Error in net radiation – the daily net radiation is estimated by summing up the 30-minnet radiation obtained from the SEVIRI data during the day. In cloudy sky conditions,the useful radiation and surface temperature data are not available, and this leads to15
underestimation of the daily net radiation on cloudy days. Validation results reportedby LSA-SAF (2008) indicate that the SEVIRI LST values tend to overestimate surfacetemperature, and this leads to underestimation of the daily net radiation. LSA-SAF(2009) also reported underestimation of the SEVIRI downwelling shortwave radiation,which again leads to underestimation of the daily net radiation. Underestimation of20
daily net radiation leads to underestimation of actual daily ET, and this is consistentwith our finding that our algorithm tends to underestimate the daily actual ET.
Errors in Evaporative Fraction – EF is estimated by means of the VI-Ts diagram in theSim-ReSET model (Sun et al., 2009). It is difficult to establish a correct VI-Ts diagramin dry seasons or regions due to the lack of pixels with full ranges of VI and surface25
moisture (Sun et al., 2008). Misclassifying a moderately dry pixel as a wet pixel resultsin overestimating EF, and thus overestimating ET.
6293

HESSD7, 6285–6303, 2010
Mapping dailyevapotranspirationand dryness index
Z. Sun et al.
Title Page
Abstract Introduction
Conclusions References
Tables Figures
J I
J I
Back Close
Full Screen / Esc
Printer-friendly Version
Interactive Discussion
Discussion
Paper
|D
iscussionP
aper|
Discussion
Paper
|D
iscussionP
aper|
Mismatch between satellite and flux tower footprints – there is a large discrepancybetween the satellite-based ET resolution (3.1 km at nadir) and the footprint of fluxtower (ten or hundred meters). In semi-arid areas of Africa, such as the savannaregions where vegetation is sparse, the footprint of eddy covariance flux tower can betoo smaller than the mean distance of individual trees or bushes (Hoedjes et al., 2007).5
In addition, flux towers are often set up close to vegetation areas, thus they tend to givehigher ET measurements than spatially averaged values.
6 Conclusions
We proposed a methodology to estimate actual ET, reference ET and dryness indexon a daily time scale. The method combines information from the once-daily polar-10
orbiting satellite data of MODIS/Terra and the 15/30-min geostationary-orbiting satellitedata of SEVIRI/MSG. Daily actual ET is estimated from “instantaneous” EF (MODIS-based), and daily net radiation and soil heat flux (SEVIRI-based). Daily reference ET isestimated from downwelling shortwave radiation (SEVIRI-based) and air temperature(ECMWF weather forecast product). We also proposed a new measure of drought, the15
dryness index which is calculated from the ratio between actual and reference daily ET.We applied the methodology over the East African highlands, and calculated the
daily actual ET, reference daily ET and dryness index for the year 2007. We com-pared the results against eddy covariance measurements of ET at the SD-Dem fluxtower site in Sudan. Results show that there is a good agreement (R2=0.87 and20
MAE=0.88 mm/day) between our satellite-based daily ET values and the eddy covari-ance measurements, however, our estimates tend to underestimate the actual daily ETvalues by about 30%. We have discussed possible sources of this underestimation.
Based on the findings of this study, we conclude that the synergistic use of thepolar-orbiting MODIS data and the geostationary-orbiting SEVIRI data has potential25
to produce reliable daily ET (actual or reference) and a measure of drought exclusivelyfrom satellite data and weather forecast data. We have presented a methodology of
6294

HESSD7, 6285–6303, 2010
Mapping dailyevapotranspirationand dryness index
Z. Sun et al.
Title Page
Abstract Introduction
Conclusions References
Tables Figures
J I
J I
Back Close
Full Screen / Esc
Printer-friendly Version
Interactive Discussion
Discussion
Paper
|D
iscussionP
aper|
Discussion
Paper
|D
iscussionP
aper|
combining these datasets. Our methodology has a good skill in reproducing the dailytemporal fluctuations of ET, but tends to underestimate actual daily ET. Further re-search is needed to improve the accuracy of the methodology, especially in cloudy skyconditions.
Acknowledgements. This study is funded by the NASA NIP Grant NNX08AR31G. The authors5
would like to thank the CarboAfrica Team and its PI Jonas Ardo for providing flux data, andIsabel Trigo of the LANDSAF team for providing gridded data for mapping ET0.
References
Allen, R. G., Pereira, L. S., Raes, D., and Smith, M.: Crop Evapotranspiration–Guidelines forComputing Crop Water Requirements, FAO Irrigation and drainage paper 56, Rome, Italy:10
Food and Agriculture Organization of the United Nations, ISBN 92-5-104219-5, 1998.Brutsaert, W. and Sugita, M.: Application of self-preservation in the diurnal evolution of the
surface energy budget to determine daily evaporation, J. Geophys. Res., 97(D17) 18, 377–382, 1992.
Carlson, T., Capehart, W., and Gillies, R.: A new look at the simplified method for remote-15
sensing of daily evapotranspiration, Remote Sens. Environ., 54, 161–167, 1995.Churkina, G., Running, S. W., Schloss, A. L., and The Participants of the Potsdam NPP Model
Intercomparison: Comparing global models of terrestrial net primary productivity (NPP): Theimportance of water availability, Glob. Change Biol., 5(suppl.1), 46–55, 1999.
Cleugh, H. A., Leuning, R., Mu, Q., and Running, S. W.: Regional evaporation estimates from20
flux tow and MODIS satellite data, Remote Sens. Environ., 106, 285–304, 2007.de Bruin, H. A. R. and Lablans, W. N.: Reference crop evapotranspiration determined with a
modified Makkink equation, Hydrol. Process., 12, 1053–1062, 1998.de Bruin, H. A. R., Trigo, I. F., Jitan, M. A., Temesgen Enku, N., van der Tol, C., and Gieske,
A. S. M.: Reference crop evapotranspiration derived from geo-stationary satellite imagery –25
a case study for the Fogera flood plain, NW-Ethiopia and the Jordan Valley, Jordan, Hydrol.Earth Syst. Sci. Discuss., 7, 4925–4956, doi:10.5194/hessd-7-4925-2010, 2010.
Doorenbos, J. and Kassam, A. H.: Yield response to water, Irrigation and Drainage Paper 33,FAO, United Nations, Rome, 1979.
6295

HESSD7, 6285–6303, 2010
Mapping dailyevapotranspirationand dryness index
Z. Sun et al.
Title Page
Abstract Introduction
Conclusions References
Tables Figures
J I
J I
Back Close
Full Screen / Esc
Printer-friendly Version
Interactive Discussion
Discussion
Paper
|D
iscussionP
aper|
Discussion
Paper
|D
iscussionP
aper|
Gomez, M., Olioso, A., Sobrino, J. A., and Jacob, F.: Retrieval of evapotranspiration over theAlpilles/ReSeDA experimental site using airborne POLDER sensor and a thermal camera,Remote Sens. Environ., 96, 399–408, 2005.
Guttman, N., Wallis, J., and Hosking, J.: Spatial comparability of the Palmer Drought SeverityIndex, Water Resour. Bull., 28(6), 1111–1119, 1992.5
Hoedjes, J. C. B., Chehbouni, A., Ezzahar, J., Escadafal, R., and De Bruin, H. A. R.: Com-parison of large aperture scintillometer and eddy covariance measurements: Can thermalinfrared data be used to capture footprint-induced differences?, J. Hydrometeorol., 13, 144–159, 2007.
Jackson, R. D., Idso, S. B., Reginato, R. J., and Pinter Jr., P. J.: Canopy temperature as a crop10
water stress indicator, Water Resour. Res., 17, 1133–1138, 1981.Leuning, R., Zhang, Y. Q., Rajaud, A., Cleugh, H., and Tu, K.: A simple sur-
face conductance model to estimate regional evaporation using MODIS leaf area in-dex and the Penman-Monteith equation, Water Resources Research, 44(10), W10419,doi:10.1029/2007WR006562, 2008.15
LSA-SAF: Validation Report: Land Surface Temperature (LST), available at: http://landsaf.meteo.pt/, 2008.
LSA-SAF: Validation Report: Down-welling long wave flux (DSLF), available at: http://landsaf.meteo.pt/, 2009.
Mallick, K., Bhattacharya, B. K., Chaurasia, S., Dutta, S., Nigam, R., Mukherjee, J., Banerjee,20
S., Kar, G., Rao, V. U. M., Gadgil, A. S., and Parihar, J. S.: Evapotranspiration using MODISdata and limited ground observations over selected agroecosystems in India, Int. J. RemoteSens., 28(10), 2091–2110, 2007.
Mu, Q., Heinsch, F. A., Zhao, M., and Running, S. W.: Development of a global evapotranspira-tion algorithm based on MODIS and global meteorology data, Remote Sens. Environ., 111,25
519–536, 2007.Nagler, P. L., Cleverly, J., Glenn, E., Lampkin, D., Huete, A., and Wan, Z. M.: Predicting riparian
evapotranspiration from MODIS vegetation indices and meteorological data, Remote Sens.Environ., 94(1), 17–30, 2005.
Nemani, R. R., White, M. A., Thornton, P., Nishida, K., Reddy, S., Jenkins, J., and Running, S.30
W.: Recent trends in hydrologic balance have enhanced the carbon sink in the United States,Geophys. Res. Lett., 29(10), 1468, doi:10.1029/2002GL014867, 2002.
Palmer, W.: Meteorological drought, Research Paper 45, US Weather Bureau, Washington DC,
6296

HESSD7, 6285–6303, 2010
Mapping dailyevapotranspirationand dryness index
Z. Sun et al.
Title Page
Abstract Introduction
Conclusions References
Tables Figures
J I
J I
Back Close
Full Screen / Esc
Printer-friendly Version
Interactive Discussion
Discussion
Paper
|D
iscussionP
aper|
Discussion
Paper
|D
iscussionP
aper|
1965.Papale, D., Reichstein, M., Aubinet, M., Canfora, E., Bernhofer, C., Kutsch, W., Longdoz, B.,
Rambal, S., Valentini, R., Vesala, T., and Yakir, D.: Towards a standardized processing of NetEcosystem Exchange measured with eddy covariance technique: algorithms and uncertaintyestimation, Biogeosciences, 3, 571–583, doi:10.5194/bg-3-571-2006, 2006.5
Patel, N. R., Rakhesh, D., and Mohammed, A. J.: Mapping of regional evapotranspiration inwheat using Terra/MODIS satellite data, Hydrol. Sci. J., 51(2), 325–335, 2006.
Potter, C. S., Randerson, J. T., Field, C. B., Matson, P. A., Vitousek, P. M., Mooney, H. A., andKlooster, S. A.: Terrestrial ecosystem production: a process model based on global satelliteand surface data, Global Biogeochem. Cy., 7, 811–841, 1993.10
Sanchez, J. M., Scavone, G., Caselles, V., Valor, E., Copertino, V. A., and Telesca, V.: Monitor-ing daily evapotranspiration at a regional scale from Landsat-TM and ETM+ data: Applicationto the Basilicata region, J. Hydrol., 351, 58–70, 2008.
Sjostrom, M., Ardo, J., Eklundh, L., El-Tahir, B. A., El-Khidir, H. A. M., Hellstrom, M., Pilesjo, P.,and Seaquist, J.: Evaluation of satellite based indices for gross primary production estimates15
in a sparse savanna in the Sudan, Biogeosciences, 6, 129–138, doi:10.5194/bg-6-129-2009,2009.
Sun, Z., Wang, Q., Matsushita, B., Fukushima, T., Ouyang Z., and Watanabe, M.: A newmethod to define the VI-Ts diagram using subpixel vegetation and soil information: a casestudy over a semiarid agricultural region in the North China Plain, Sensors, 8, 6260–6279,20
2008.Sun, Z., Wang, Q., Matsushita, B., Fukushima, T., Ouyang, Z., and Waternabe, M.: Devel-
opment of a simple remote sensing evapotranspiration model (Sim-ReSET): algorithm andmodel test, J. Hydrol., 376(3–4), 476–485, 2009.
Trigo, I. F., DaCamara, C. C., Viterbo, P., Roujean, J.-L., Olesen, F., Barroso, C., Camacho-de25
Coca, F., Carrer, D., Freitas, S. C., Garcıa-Haro, J., Geiger, B., Gellens-Meulenberghs, F.,Ghilain, N., Melia, J., Pessanha, L., Siljamo, N., and Arboleda, A.: The satellite applicationfacility on land surface analysis, Int. J. Remote Sens., in press, 2010.
Tsakiris, G. and Vangelis, H.: Towards a drought water system based on spatial SPI, WaterResour. Manage., 18(1), 1–12, 2004.30
Venturim, V., Islam, S., and Rodriguez, L.: Estimation of evaporative fraction and evapotran-spiration from MODIS products using a complementary based model, Remote Sens. Envi-ron., 112(1), 132–141, 2008.
6297

HESSD7, 6285–6303, 2010
Mapping dailyevapotranspirationand dryness index
Z. Sun et al.
Title Page
Abstract Introduction
Conclusions References
Tables Figures
J I
J I
Back Close
Full Screen / Esc
Printer-friendly Version
Interactive Discussion
Discussion
Paper
|D
iscussionP
aper|
Discussion
Paper
|D
iscussionP
aper|
Wang, K. C., Wang, P., Li, Z. Q., Cribb, M., and Sparrow, M.: A simple method to estimate actualevapotranspiration from a combination of net radiation, vegetation index and temperature, J.Geophys. Res.-Atmos., 112(D15), D15107, doi:10.1029/2006JD008351, 2007.
6298
HESSD7, 6285–6303, 2010
Mapping dailyevapotranspirationand dryness index
Z. Sun et al.
Title Page
Abstract Introduction
Conclusions References
Tables Figures
J I
J I
Back Close
Full Screen / Esc
Printer-friendly Version
Interactive Discussion
Discussion
Paper
|D
iscussionP
aper|
Discussion
Paper
|D
iscussionP
aper|
Figure 1
Figure 1. Digital elevation map of the study region, and location of the SD-Dem
validation site in Sudan.
15
Fig. 1. Digital elevation map of the study region, and location of the SD-Dem validation site inSudan.
6299

HESSD7, 6285–6303, 2010
Mapping dailyevapotranspirationand dryness index
Z. Sun et al.
Title Page
Abstract Introduction
Conclusions References
Tables Figures
J I
J I
Back Close
Full Screen / Esc
Printer-friendly Version
Interactive Discussion
Discussion
Paper
|D
iscussionP
aper|
Discussion
Paper
|D
iscussionP
aper|
2
Figure 2
MODIS-based EF (8-day, 1 km,
sinusoidal projection)
MOD11A2Ts
MODISLand-cover
(IGBP)
MOD13A2NDVI
Sim-ReSETModel
SEVIRI/MSG LST
SEVIRI/MSG fveg
RnSEVIRI and QSEVIRI (30-min and daily,
3km, GEOS projection)
Actual daily ET(3 km, GEOS projection)
Rep
roje
ctio
nR
esam
ple
ECMWFTa
Reference daily ET0 (3 km, GEOS
projection)
Dryness Index (3 km
, GE
OS projection)
Makkink’s equation
SEVIRI/MSG ↓LR
SEVIRI/MSG ↓SR
SEVIRI/MSG ↓SR
Fig. 2. Flowchart of the proposed methodology to estimate daily actual ET, daily reference ET,and daily dryness index.
6300

HESSD7, 6285–6303, 2010
Mapping dailyevapotranspirationand dryness index
Z. Sun et al.
Title Page
Abstract Introduction
Conclusions References
Tables Figures
J I
J I
Back Close
Full Screen / Esc
Printer-friendly Version
Interactive Discussion
Discussion
Paper
|D
iscussionP
aper|
Discussion
Paper
|D
iscussionP
aper|
Figure 3
Actual daily ET Reference daily ET Dryness index
2007/01/21 2007/01/21 2007/01/21
2007/04/23 2007/04/23 2007/04/23
2007/07/11 2007/07/11 2007/07/11
2007/10/12 2007/10/12 2007/10/12
Figure 3. Sample maps of (left panel) actual daily ET, (middle panel) daily reference ET, and (right panel) daily dryness index in different seasons in the study region.
17
Fig. 3. Sample maps of (left panel) actual daily ET, (middle panel) daily reference ET, and (rightpanel) daily dryness index in different seasons in the study region.
6301

HESSD7, 6285–6303, 2010
Mapping dailyevapotranspirationand dryness index
Z. Sun et al.
Title Page
Abstract Introduction
Conclusions References
Tables Figures
J I
J I
Back Close
Full Screen / Esc
Printer-friendly Version
Interactive Discussion
Discussion
Paper
|D
iscussionP
aper|
Discussion
Paper
|D
iscussionP
aper|
3
Figure 4
y = 0.95x - 0.75R² = 0.87
MAE=0.88 mm/day
0
1
2
3
4
5
0 1 2 3 4 5
Rem
ote s
ensi
ng-b
ased
estim
ates
of d
aily
E
T (m
m/d
ay)
Ground measurements of daily ET (mm/day)
1:1 line
Fig. 4. Comparison of satellite-based daily actual ET estimates and eddy covariance measure-ments of daily actual ET at the SD-Dem site.
6302

HESSD7, 6285–6303, 2010
Mapping dailyevapotranspirationand dryness index
Z. Sun et al.
Title Page
Abstract Introduction
Conclusions References
Tables Figures
J I
J I
Back Close
Full Screen / Esc
Printer-friendly Version
Interactive Discussion
Discussion
Paper
|D
iscussionP
aper|
Discussion
Paper
|D
iscussionP
aper|4
Figure 5
y = -18.42x + 114.42R² = 0.86
0
20
40
60
80
100
120
0 1 2 3 4 5
Rem
ote s
ensi
ng-b
ased
estim
ates
of
dryn
ess i
ndex
(%)
Ground measurements of daily ET (mm/day)
Fig. 5. Satellite-based daily dryness index estimates versus eddy covariance measurementsof daily actual ET at the SD-Dem site.
6303