mapping corruption risk in indonesia’s upstream oil and gas industry · 2020-04-06 · mapping...
TRANSCRIPT

Working Paper 021
April 2020
Correspondence to Budi Ibrahim ([email protected])
Tony Robey ([email protected])
Mapping corruption risk in Indonesia’s upstream oil and gas industry
Budi Ibrahim and Tony Robey
Mapping corruption risk in Indonesia’s upstream oil and gas industry
2
Contents Acronyms and abbreviations 5
Acknowledgments 6
Executive summary 7
1. Introduction 9
2. Existing tools to assess risk 12
2.1. Enterprise Risk Management (ERM) 12
2.2. Corruption Risk Management (CRM) 13
2.3. Geospatial mapping 15
2.4. Value chain mapping and analysis 16
2.5. Corruption risk mapping (spatial metaphor) 16
3. Methodology: development of an upstream value chain risk map 18
3.1. Financial value chain analysis (VCA) 18
3.2. Value chain private-sector analysis 21
3.3. Value chain corruption risk analysis 22
4. Results and discussion 25
4.1. Upstream value chain risk map 25
4.2. Value chain risk analysis 26
5. Conclusions and recommendations 38
6. References 41
Appendix A: Methods of analysis 47
Financial value chain analysis 47
Data Envelopment Analysis (DEA) 49
Benford’s Law 50
House of Risk (HoR) 52
Appendix B: Detailed value chain analysis results 57
Upstream value chain risk map 57
Value chain risk analysis 59

Mapping corruption risk in Indonesia’s upstream oil and gas industry
3
Figures Figure 1: An Enterprise Risk Management (ERM) heat map 13
Figure 2: The Corruption Risk Management framework 14
Figure 3: The seven-step Corruption Risk Assessment (CRA) process 14
Figure 4: Corruption Risk Assessment (CRA) exercise 15
Figure 5: An example of a spatial metaphor map of a crime scene 17
Figure 6: Number of Working Areas (WAs) (2018) 19
Figure 7: Value chain map for upstream oil and gas in Indonesia 26
Figure 8: HoR1 aggregate (gross) risk 31
Figure 9: Aggregate inherent (gross) risk in primary level 3 activities 32
Figure 10: Aggregate inherent (gross) risk in level 3 supporting activities 32
Figure 11: Proposed collaboration and operating model 35
Figure 12: Tracking progress by boundary partners 39
Figure A 1: Financial value chain analysis 47
Figure A 2: Hypothetical VCM heatmap 48
Figure A 3: Hypothetical Contractor efficiency 49
Figure B 1: VCRM – four-year average financial analysis 59
Figure B 2: WA efficiency, 2014–2018 60
Figure B 3: Distribution of vendors 61
Figure B 4: WP&B Benford analysis 62
Figure B 5: RTA compliance audit analysis 63
Figure B 6: RTA compliance audit analysis – LIV for primary activities 63
Figure B 7: RTA compliance audit analysis – LIV for supporting activities 64
Figure B 8: BPK financial impact – compliance audit analysis 65
Figure B 9: BPK financial impact – FIV for primary activities 66
Figure B 10: BPK financial impact – FIV for supporting activities 66
Figure B 11: BPK legal impact – compliance audit analysis 66
Figure B 12: BPK legal impact – compliance audit analysis of primary areas 67
Figure B 13: BPK legal impact – compliance audit analysis of supporting areas 67
Figure B 14: Legal impact of criminal justice cases 68
Figure B 15: Legal impact of criminal justice cases in primary areas 69
Figure B 16: Legal impact of criminal justice cases in supporting areas 69
Figure B 17: Financial impact of criminal justice cases 69
Figure B 18: Financial impact of criminal justice cases in primary areas 70
Figure B 19: Financial impact of criminal justice cases in supporting areas 70
Figure B 20: Suspicious transactions analysis 70

Mapping corruption risk in Indonesia’s upstream oil and gas industry
4
Tables Table 1: WP&B proposals shared by SKK Migas for analysis 20
Table 2: Legal (compliance) impact assessment score based on Indonesian anti-corruption law 23
Table 3: HoR2 rank of preventive/mitigating actions (PAk) 33
Table A 1: Hypothetical WP&B 48
Table A 2: Benford’s Law distribution 50
Table A 3: Hypothetical example 51
Table A 4: Hypothetical Benford’s Law test 51
Table A 5: Hypothetical HoR1 for primary activities 54
Table A 6: Hypothetical HoR1 for supporting activities 54
Table A 7: Hypothetical HoR2 analysis – primary activity 55
Table A 8: Hypothetical HoR2 analysis – supporting activity 56
Table A 9: Hypothetical HoR2 rank of preventive/mitigating actions (PAk) 56
Table B 1: VC primary activities 57
Table B 2: VC support activities 58
Table B 3: Output-oriented DEA score 60
Table B 4: Value chain area of significance for DEA efficiency score 60
Table B 5: Most common level-2 findings in RTA audit of supporting areas 64
Table B 6: Most common level-2 LIV findings in RTA audit of supporting areas 64
Table B 7: Most common level-2 findings in RTA audit of primary areas 64
Table B 8: Most common level-2 LIV findings in RTA audit of primary areas 65
Table B 9: RTA audit – no finding 65
Table B 10: Calculation of BPK's financial impact 67
Table B 11: Most common BPK level-2 findings in supporting areas 68
Table B 12: Most common BPK level-2 findings in primary areas 68
Table B 13: Most common level-2 offences in primary areas 68
Table B 14: Top-five risk areas from PPATK analysis 71

Mapping corruption risk in Indonesia’s upstream oil and gas industry
5
Acronyms and abbreviations ABMS Anti-Bribery Management System
ARP Aggregate Risk Priority
ASR Abandonment and Site Restoration
BPK Badan Pemeriksa Keuangan (Supreme Audit Board)
BO Beneficial Owner
CIVD Centralized Integrated Vendor Database
CRA Corruption Risk Assessment
CRM Corruption Risk Management
DEA Data Envelopment Analysis
EITI Extractive Industries Transparency Initiative
EPCI Engineering, Procurement, Construction and Installation
EPIM Exploration and Production Information Management Association
ERM Enterprise Risk Management
FEED Front End Engineering Design
FEV Frequency of Evidence
FIS Financial Impact Score
FIV Financial Impact Value
GGR Geology, Geophysics and Reservoir
GGS Geological and Geophysical Study
HoR House of Risk analysis
HSE Health, Safety and Environment
KKKS Kontraktor Kontrak Kerjasama (contractor)
KPK Komisi Pemberantasan Korupsi (Corruption Eradication Commission)
LIS Legal Impact Score
LIV Legal Impact Value
NCA Norwegian Coastal Administration
NOFO Norwegian Clean Seas Association for Operating Companies
OECD Organisation for Economic Co-operation and Development
PAk Preventive/mitigating action
PPATK Pusat Pelaporan dan Analisis Transaksi Keuangan (Financial Intelligence Unit)
PSC Production-Sharing Contract
RTA Right to Audit
SKK Migas Satuan Kerja Khusus Pelaksana Kegiatan Usaha Hulu Minyak dan Gas Bumi (Special Task Force for Upstream Oil and Gas Business Activities)
VC Value Chain
VCM Value Chain Map
VCRM Value Chain Risk Map
VRS Variable Return to Scale model
WA Working Area
WP&B Work Program & Budget
Mapping corruption risk in Indonesia’s upstream oil and gas industry
6
Acknowledgments The authors are grateful to SKK Migas (the Special Task Force for Upstream Oil and Gas
Business Activities), KPK (the Corruption Eradication Commission) and PPATK (the Financial Transaction Reports and Analysis Centre) for sharing relevant data and information relating to the upstream oil and gas industry in Indonesia. Thanks also go to Febrian Kwarto, Nur Indah, Haris Wahyudi and Erna Setiany from Mercu Buana University for their research assistance.
Mapping corruption risk in Indonesia’s upstream oil and gas industry
7
Executive summary In 2018 the International Energy Agency (IEA, 2018) reported that global capital spending on
upstream oil and gas was worth more than US$4 trillion globally in 2012–2018. Indonesia has been active in the oil and gas industry since 1885, and at the end of 2018 the country held proven oil reserves of 3.2 billion barrels and was ranked 11th in terms of global gas production (PwC Indonesia, 2019).
While oil and gas resources present huge opportunities for the economic development of most countries, poor management of these resources can have dire consequences. Furthermore, the large investment necessary in gas and oil limits business players in the sector, which heightens the risk of corruption.
This research focuses on the private sector in Indonesia’s upstream oil and gas industry –
which in 2016 involved 324 contractors, 6,947 suppliers/vendors and 29 traders, and is seen as having the greatest risk to corruption and subsequent loss to the state. We analyse relevant published policy in Indonesia that has been designed to mitigate the risk of corruption but which has not yet been reviewed comprehensively using scientific methods.
Risk management is perceived as an indivisible part of good management and governance. But
risk is extremely difficult to describe and visualise. At present, traditional frameworks use a perception-based and traditional heat map approach to identify and visualise risk with the primary input being focus group discussions with business owners. This often leads to subjective, incomplete and inaccurate risk identification, and it also fails to produce a risk overview that is easy to understand and to communicate.
This research proposes a novel and innovative four-step methodology to overcome these challenges:
1 Analyse upstream oil and gas value chains using various methods.
2 Analyse the risk of financial inefficiencies and corruption in the value chain using various methods.
3 Generate a geo-spatial map of the industry’s upstream activities.
4 Combine the above three steps to produce a single value chain risk map (VCRM) that uses heat mapping to identify the risks and possibilities of corruption at discrete positions in the value chain to be prioritised for mitigating action.
The proposed model is an innovation for managing both corruption risk and business risk. It
has significant potential benefits not only for anti-corruption efforts in the oil and gas industry but also to the wider business environment and law enforcement efforts in Indonesia and elsewhere. The VCRM could be used collectively as a risk map by stakeholders but it could also be used as a multi-dimensional database to store and analyse evidence-based data/information that enables collaboration and synergy in risk mitigation within the sector.

Mapping corruption risk in Indonesia’s upstream oil and gas industry
8
To further enhance the potential of this novel approach, the tool was developed in
collaboration with Indonesia’s Special Task Force for Upstream Oil and Gas Business Activities (SKK Migas), the Corruption Eradication Commission (KPK) and the Financial Transaction Reports and Analysis Centre (PPATK), along with other relevant stakeholders.
While the findings of the research are based on practices and procedures in Indonesia, they
could equally apply to other oil and gas-producing nations where corruption has been a disabling factor for many years. The introduction of such an approach could assist other countries to reduce or prevent opportunities for corruption in their oil and gas sector, thereby reducing exploration and operating costs and increasing state income.
Evidence- based risk identification
‘Probability can better be assessed if data can be found on the frequency of fraud in the
past.’ (Johnsøn, 2015)
Mapping corruption risk in Indonesia’s upstream oil and gas industry
9
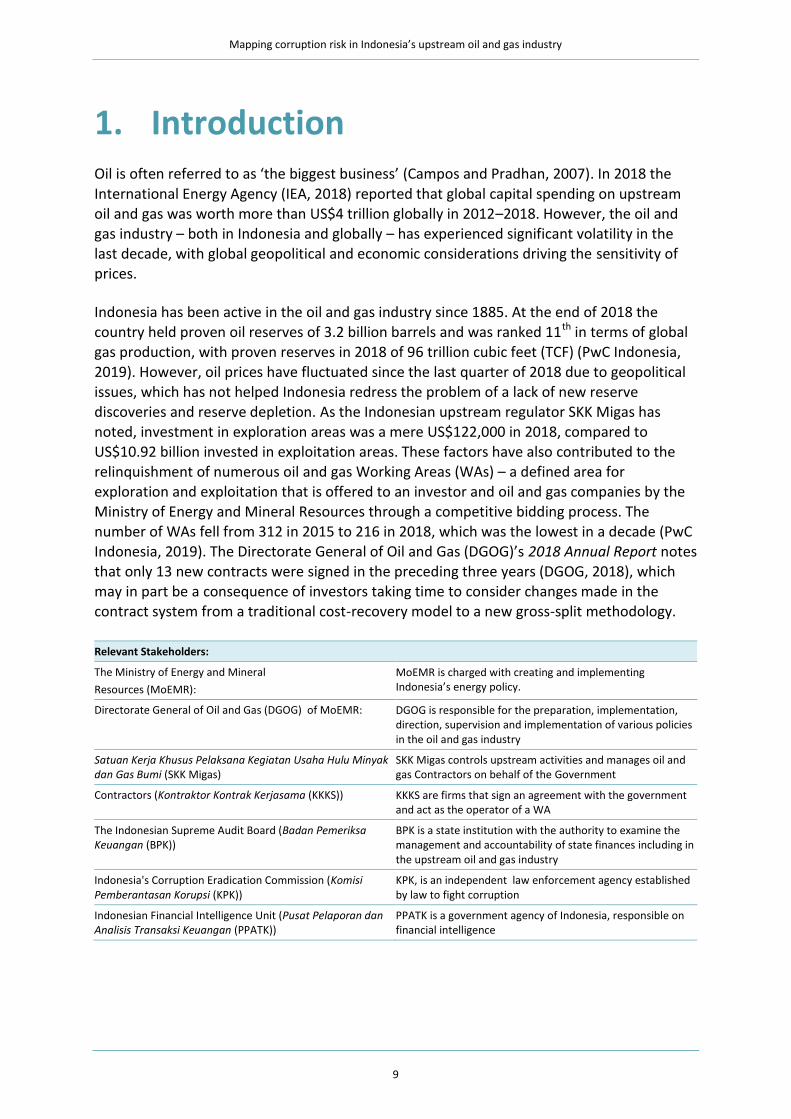
1. Introduction Oil is often referred to as ‘the biggest business’ (Campos and Pradhan, 2007). In 2018 the
International Energy Agency (IEA, 2018) reported that global capital spending on upstream oil and gas was worth more than US$4 trillion globally in 2012–2018. However, the oil and gas industry – both in Indonesia and globally – has experienced significant volatility in the last decade, with global geopolitical and economic considerations driving the sensitivity of prices.
Indonesia has been active in the oil and gas industry since 1885. At the end of 2018 the country held proven oil reserves of 3.2 billion barrels and was ranked 11th in terms of global gas production, with proven reserves in 2018 of 96 trillion cubic feet (TCF) (PwC Indonesia,
2019). However, oil prices have fluctuated since the last quarter of 2018 due to geopolitical issues, which has not helped Indonesia redress the problem of a lack of new reserve discoveries and reserve depletion. As the Indonesian upstream regulator SKK Migas has noted, investment in exploration areas was a mere US$122,000 in 2018, compared to US$10.92 billion invested in exploitation areas. These factors have also contributed to the relinquishment of numerous oil and gas Working Areas (WAs) – a defined area for exploration and exploitation that is offered to an investor and oil and gas companies by the Ministry of Energy and Mineral Resources through a competitive bidding process. The number of WAs fell from 312 in 2015 to 216 in 2018, which was the lowest in a decade (PwC Indonesia, 2019). The Directorate General of Oil and Gas (DGOG)’s 2018 Annual Report notes that only 13 new contracts were signed in the preceding three years (DGOG, 2018), which may in part be a consequence of investors taking time to consider changes made in the contract system from a traditional cost-recovery model to a new gross-split methodology.
Relevant Stakeholders:
The Ministry of Energy and Mineral
Resources (MoEMR):
MoEMR is charged with creating and implementing Indonesia’s energy policy.
Directorate General of Oil and Gas (DGOG) of MoEMR: DGOG is responsible for the preparation, implementation, direction, supervision and implementation of various policies in the oil and gas industry
Satuan Kerja Khusus Pelaksana Kegiatan Usaha Hulu Minyak dan Gas Bumi (SKK Migas)
SKK Migas controls upstream activities and manages oil and gas Contractors on behalf of the Government
Contractors (Kontraktor Kontrak Kerjasama (KKKS)) KKKS are firms that sign an agreement with the government and act as the operator of a WA
The Indonesian Supreme Audit Board (Badan Pemeriksa Keuangan (BPK))
BPK is a state institution with the authority to examine the management and accountability of state finances including in the upstream oil and gas industry
Indonesia's Corruption Eradication Commission (Komisi Pemberantasan Korupsi (KPK))
KPK, is an independent law enforcement agency established by law to fight corruption
Indonesian Financial Intelligence Unit (Pusat Pelaporan dan Analisis Transaksi Keuangan (PPATK))
PPATK is a government agency of Indonesia, responsible on financial intelligence

Mapping corruption risk in Indonesia’s upstream oil and gas industry
10
While oil and gas resources present huge opportunities for the economic development of
most countries, poor management of these resources can have dire consequences. Furthermore, the large investment necessary in gas and oil limits business players in the sector, which heightens the risk of corruption. According to Transparency International (2019), corruption costs across sectors in developing countries an estimated US$1.26 trillion per year, and several studies have shown that it is prevalent in the oil and gas sector in particular (Fenton Villar and Papyrakis, 2017; Lima-de-Oliveira 2019Ojeka, et al. 2019). Indeed, the Organisation for Economic Co-operation and Development (OECD, 2014) reported that the highest proportion (19%) of foreign bribery1 cases concluded between 1999 and 2014 occurred in the extractive industries sector.
Under Indonesia’s model of production-sharing contracts (PSCs), a contractor is entitled to a
share of total oil and gas produced to cover exploration and development costs, while the remaining oil and gas produced is split between the contractor and the government. The
profit made by the contractor is subject to tax, which is a significant source of national revenue. Despite there being greater risks of corruption in these type of production-sharing agreements (PSAs) than other systems used in oil and gas production, the PSA/PSC approach has been replicated in several oil- and gas-producing countries in Europe (e.g. Malta, Croatia, Poland) (Gjokutaj, 2019) and is most common in Asia and Africa, including in Nigeria.
With a 5.3% contribution to the country’s gross domestic product (GDP), and 7.4% to
government revenue, the oil and gas sector is central to Indonesia’s economy and is of strategic importance in promoting viable growth (SKK Migas, 2019). Alongside other sectors, however, oil and gas has received a great deal of attention with regards to risk management, because risk exists in all upstream (tender and concession, exploration, installation, production, field abandoning), midstream (processing, storage, transportation) and
downstream (sales, distribution) activities. High profile cases have also increased perceptions of risk and corruption in the sector – including the conviction of the head of SKK Migas for accepting bribes totalling US$700,000 from a foreign company in 2018 (Jong, 2013) and the conviction of judges at all levels of the judicial system.
This research concentrates on the upstream part of the oil and gas sector because this is seen as having the greatest risk to corruption and subsequent loss to the state. PSCs provide opportunities for (large) corrupt payments to be included or disguised within production costs, which thereby reduces what is available for profit-sharing with the state. Focusing on the private sector of upstream oil and gas – which in 2016 involved 324 PSC contractors, 6,947 suppliers/vendors and 29 traders – this research analyses relevant published policy that has been designed to mitigate the risk of corruption but which has not yet been reviewed comprehensively using scientific methods.
1 ‘Foreign bribery’ is one of many forms of corruption, and is defined in the OECD Anti-bribery Convention as ‘to offer,
promise or give any undue pecuniary or other advantage … to a foreign public official … in order to obtain or retain business or other improper advantage in the conduct of international business’ (OECD, 2014).

Mapping corruption risk in Indonesia’s upstream oil and gas industry
11
Mitigating risk – including of corruption – commences with effective communication. But
risk is extremely difficult to describe and visualise. This research proposes a novel and innovative four-step methodology to overcome these challenges:
1 Analyse upstream oil and gas value chains using various methods. A value chain shows the activities that a firm operating in a specific industry can introduce to deliver a valuable product or service, thus helping the company to achieve a competitive advantage.
2 Analyse the risk of financial inefficiencies and corruption using various methods.
3 Generate a “spatial metaphor map” of the industry’s upstream activities. Spatial analysis is an approach to applying statistical analysis and other analytical techniques to data which has a geographical or spatial aspect.
4 Combine the above three steps to produce a single value chain risk map (VCRM) that
uses heat mapping to identify priority areas for mitigating action. The heat map is a visual business analytics tool that takes numeric data and plots it on an accurate graphical map to identify the risks and possibilities of corruption at discrete positions in the value chain.
The proposed model is an innovation for both corruption risk and business risk. It has
significant potential benefits not only for anti-corruption efforts in the oil and gas industry but also to the wider business environment and law enforcement efforts in Indonesia and elsewhere.
The remainder of this paper is structured as follows. Section 2 briefly describes relevant
analytical tools used in business and risk management before we outline in section 3 our methodology to design a combined model – an upstream value chain risk map (VCRM) – to
effectively identify and analyse corruption risk in Indonesia. Section 4 presents the results of our analysis using the proposed model and section 5 sets out our conclusions and recommendations for application of the model. For ease of reference, the main analytical methods used in the research are described in Appendix A and a number of Figures and Tables appear in Appendix B.

Mapping corruption risk in Indonesia’s upstream oil and gas industry
12
2. Existing tools to assess risk This section briefly describes relevant models that are already being used across various sectors to analyse and assess risk.
2.1. Enterprise Risk Management (ERM)
Enterprise Risk Management (ERM) is a popular approach employed by businesses to recognise future occurrences that may influence an enterprise, to handle related hazards and risks, and to provide reasonable assurances that goals will be met (COSO, 2004).
ERM has gained organisational attention due to globalisation in business environments, technological advancements and innovation in business operations, as well as pressure from regulatory bodies to manage risk in a holistic manner (COSO, 2017; ISO, 2018). However, some studies have criticised the ERM model (Pagach and Warr, 2011; Quon et al., 2012; Agustina and Baroroh, 2016). In our view, several methods used in ERM need improvement, including risk identification that is based on perception, and traditional heat mapping that is not easy to visualise, understand and share. In this research we have based risk identification on evidence, not perception, and propose an alternative innovative method of risk mapping.
Figure 1 provides an example of a traditional two-axis ERM heat map, which is used to plot the likelihood of a risk occurring against the impact of that same risk for the organisation or entity. This illustrative heatmap uses financial impact with various levels of monetary value (<$25,000 up to >$75 million) and financial measure in the form of earnings per share (EPS). It also identifies eight hypothetical risks including environmental health and safety (EH&S) risks, which are listed in the risk legend (10–16) and mapped on the heatmap as numbered circles. The heatmap does not map the business process and there is no information on the relationship between the process steps, therefore it is not very easy to understand or to communicate the context and the relationship between the identified risks.

Mapping corruption risk in Indonesia’s upstream oil and gas industry
13
Figure 1: An Enterprise Risk Management (ERM) heat map
Source: CGMA (2012).
2.2. Corruption Risk Management (CRM)
Several attempts have been made to develop a framework for managing corruption risk
specifically, using ERM as a basis. The Malaysian Anti-Corruption Commission (MACC, 2015)
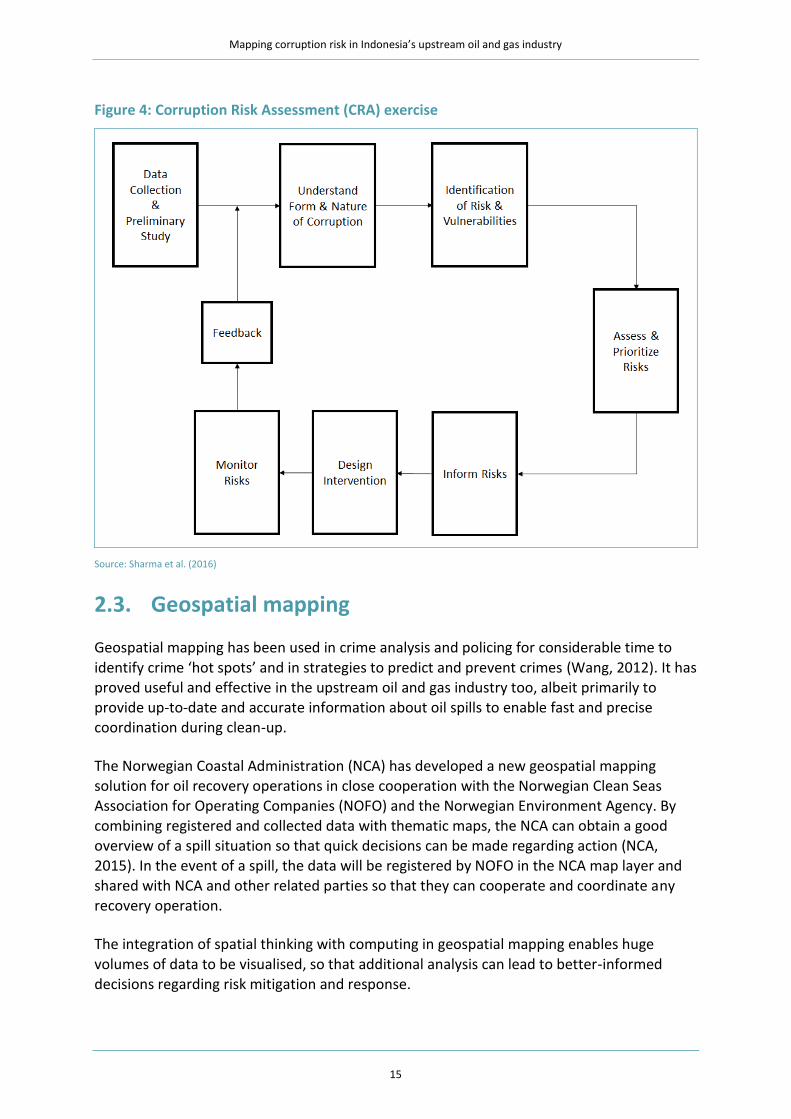
introduced the Corruption Risk Management (CRM) approach using the ISO 31000:2010 Enterprise Risk Management Framework (Figure 2), which includes a seven-step corruption risk assessment process (Figure 3). Later, Sharma et al. (2016) introduced the Corruption Risk Assessment (CRA) framework (Figure 4), based on a model developed by the Committee of Sponsoring Organizations of the Treadway Commission (COSO, 2004).
MACC adapted the ISO 31000:2010 risk management framework – which is usually applied
to different types of business risk (financial, safety, project risks) – to include communication and consultation with all stakeholders and to establish the context, risk identification, risk analysis, risk evaluation and regular monitoring and review. MACC uses this framework for managing corruption risk.

Mapping corruption risk in Indonesia’s upstream oil and gas industry
14
Figure 2: The Corruption Risk Management framework
Source: MACC (2015).
The seven-step corruption risk assessment process describes the methods for risk
identification, risk analysis and risk evaluation. Common practice for risk identification currently relies heavily on a perception-based qualitative process (e.g. focus group
discussions) which is prone to subjective results.
Figure 3: The seven-step Corruption Risk Assessment (CRA) process
Source: SPRM CRM 2.0, MACC (2015).
Mapping corruption risk in Indonesia’s upstream oil and gas industry
15
Figure 4: Corruption Risk Assessment (CRA) exercise
Source: Sharma et al. (2016)
2.3. Geospatial mapping
Geospatial mapping has been used in crime analysis and policing for considerable time to
identify crime ‘hot spots’ and in strategies to predict and prevent crimes (Wang, 2012). It has proved useful and effective in the upstream oil and gas industry too, albeit primarily to provide up-to-date and accurate information about oil spills to enable fast and precise coordination during clean-up.
The Norwegian Coastal Administration (NCA) has developed a new geospatial mapping solution for oil recovery operations in close cooperation with the Norwegian Clean Seas Association for Operating Companies (NOFO) and the Norwegian Environment Agency. By combining registered and collected data with thematic maps, the NCA can obtain a good overview of a spill situation so that quick decisions can be made regarding action (NCA, 2015). In the event of a spill, the data will be registered by NOFO in the NCA map layer and
shared with NCA and other related parties so that they can cooperate and coordinate any recovery operation.
The integration of spatial thinking with computing in geospatial mapping enables huge
volumes of data to be visualised, so that additional analysis can lead to better-informed decisions regarding risk mitigation and response.

Mapping corruption risk in Indonesia’s upstream oil and gas industry
16
2.4. Value chain mapping and analysis
The concept of a ‘value chain’ (VC) was introduced by Porter in 1985. It is based on the
process view of organisations as a system, made up of sub-systems that each have inputs, transformation processes and outputs. The processes and activities are classified generally as either primary (inbound logistics, operations, outbound logistics, marketing and sales and service) or support (firm infrastructures, human resource, technology development and procurement) that most businesses must undertake in some form.
VCs in the oil and gas industry have been developed to describe business processes in
upstream, midstream and downstream activities (UNCTAD, 2012; IBEF, 2014; OECD, 2016; Elsaghier, 2017; MOGA, 2018; Shqairat and Sundarakani, 2018). The OECD (2006) describes the process of VCs in extractive industries from the decision to extract to revenue spending
and social investment projects. Such VCs are likely to have a great impact on businesses that operate in this sector because technology is high-cost and sophisticated; exploration is uncertain; and there are legal and social challenges together with transportation and storage needs to be considered.
A value chain map (VCM) can be beneficial in that it a) provides stakeholders with a tangible description of activities, b) reveals missing information including needs, impacts and gaps for each entity in the value chain, c) expands the perspective of an organisation's external environment; d) helps organisations prioritise activities and e) provides a platform for communication and discussion with stakeholders (Mooney, 2014).
Value chain analysis (VCA) is a method by which a company defines its main and support
activities that contribute value to its final product, before evaluating these activities. There
are two distinct approaches to VCA, depending on the sort of competitive benefit a business wishes to achieve: cost advantage2 or differentiation advantage3 (Jurevicius, 2013). Analysis of a VC allows organisations to assess business processes in order to maximise opportunities to decrease operating costs, optimise efforts, eliminate waste, enhance health and safety and boost profitability (Reese et al., 2016).
2.5. Corruption risk mapping (spatial metaphor)
The use of analytical data in geospatial mapping is becoming more important in the identification of common crimes (Dean, 2018). The method is being developed continuously, but the question is whether it can be applied to white-collar crime, including corruption or bribery. We believe so, and propose that a spatial metaphor that uses an industry-specific
2 Where a company offers the lowest costs compared to competitors within that industry.
3 Where a company selects one or more criteria used by buyers in a market segment and then positions itself uniquely to
meet those criteria.
Mapping corruption risk in Indonesia’s upstream oil and gas industry
17
business process base map4 combined with spatial analysis and risk management can
capture and analyse corruption risks in Indonesia’s upstream oil and gas industry.
Using a conventional risk heat map in risk mitigation can cause difficulties in visualisation
and analysis of risks, as well as interpretation of results. However, we suggest that these challenges can be overcome by using a VCRM. The proposed VCRM focuses on private-sector corruption/bribery in Indonesia's upstream oil and gas industry, but it is an innovation for both corruption risk and business risk and has significant potential benefits not only for oil and gas but also to the wider business environment and law enforcement.
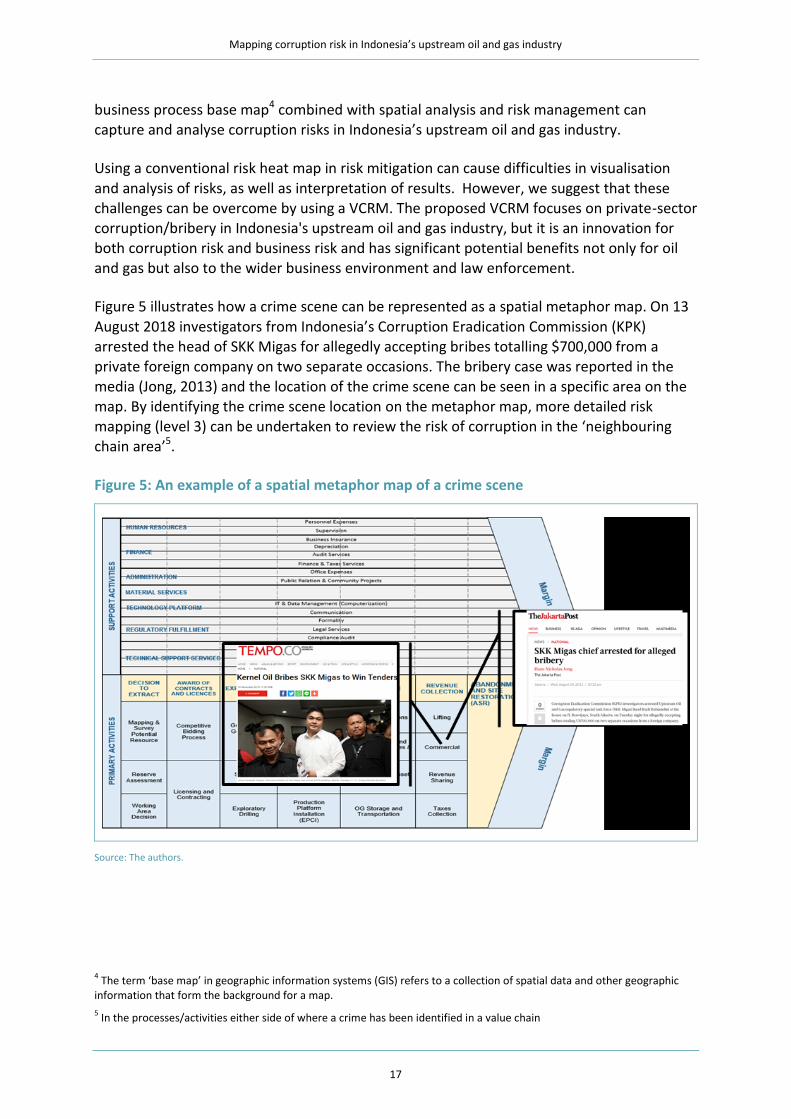
Figure 5 illustrates how a crime scene can be represented as a spatial metaphor map. On 13
August 2018 investigators from Indonesia’s Corruption Eradication Commission (KPK) arrested the head of SKK Migas for allegedly accepting bribes totalling $700,000 from a private foreign company on two separate occasions. The bribery case was reported in the
media (Jong, 2013) and the location of the crime scene can be seen in a specific area on the map. By identifying the crime scene location on the metaphor map, more detailed risk mapping (level 3) can be undertaken to review the risk of corruption in the ‘neighbouring
chain area’5.
Figure 5: An example of a spatial metaphor map of a crime scene
Source: The authors.
4 The term ‘base map’ in geographic information systems (GIS) refers to a collection of spatial data and other geographic
information that form the background for a map.
5 In the processes/activities either side of where a crime has been identified in a value chain

Mapping corruption risk in Indonesia’s upstream oil and gas industry
18
3. Methodology: development of an upstream value chain risk map This section briefly describes the various methods that we have combined to develop the
proposed value chain risk map (VCRM), including data envelopment analysis (DEA), Benford analysis, House of Risk (HoR) and a corruption risk map. These methods are explained in more detail in Appendix A and provide initial proof of concept for the proposed VCM.
3.1. Financial value chain analysis (VCA)
Financial VCA6 (Lind et al., 2012) reveals the financial performance of each stage of a VC and
how the performance of one stage can affect the rest of a chain. It consists of seven steps:
1 Choose the industry under study: Indonesia’s upstream private-sector oil and gas industry.
2 Define the VC including the stages and companies: upstream primary activities (tender and concession, exploration, installation, production, field abandoning) and supporting activities (human resources, finance, administration, procurement of material and service, technology platform, regulatory fulfilment and technical support services.
3 Define the key financial figures: in the context of this study the key figures were taken from the Work Program and Budget (WP&B) provided by SKK Migas (see section 3.1.1).
4 Collect data for the period under analysis: the WP&B data was collected for the period 2014–2018 (section 3.1.1).
5 Calculate the values of the key financial figures: in this study the calculation process used two methods, namely financial mapping and two-stage data envelopment analysis (two-stage DEA) (see section 4.2.1 for VC financial analysis).
6 Analyse the calculated key figures: analysis of the calculated key figures is presented in the VCRM in section 4. This study also uses heat maps (e.g. see Figure B 1) to show the magnitude of corruption risk.
7 Draw conclusions: see section 5 for the conclusions and recommendations from our study.
6 A method to analyse the value chain from financial perspective

Mapping corruption risk in Indonesia’s upstream oil and gas industry
19
3.1.1. Work Program and Budget (WP&B) analysis
This study uses financial data in the form of WP&B papers provided by SKK Migas. A WP&B
shows two things: first, the cost that is borne by Indonesia to obtain oil and gas; and second, how much the industry is worth in Indonesia to the private sector.
A Working Area (WA) is a defined area that the Ministry of Energy and Mineral Resources
offers to investors and oil and gas companies through a competitive bidding process where exploration and exploitation is carried out. Where SKK Migas approves a WP&B proposal from a contractor they are eligible for cost recovery. As most contrators are from the private sector, with the budget mostly consumed by vendors who are also mainly from the private sector, the budget could therefore be seen as a business opportunity fo the private sector. Visualising the WP&B figures (aggregating it) in the proposed VCRM gives easy-to-understand information of the upstream oil and gas industry and also enables deeper
analysis of cost control to be applied to track possible financial leakages.
Figure 6 shows that in 2018 SKK Migas managed 216 WAs, consisting of 37 non-conventional WAs, 91 conventional exploration WAs and 88 exploitation WAs.
Figure 6: Number of Working Areas (WAs) (2018)
Source: SKK Migas WP&B reports (various years).
The total number of production WAs declined between 2013 and 2018 but the number of
exploitation WAs increased steadily between 2008 and 2018. Of the 88 exploitation WAs

Mapping corruption risk in Indonesia’s upstream oil and gas industry
20
managed by SKK Migas in 2018, 74 were production WAs and 14 were under development.
In 2018 around 85% of the production WAs were privately owned. Companies involved in exploitation WAs conduct not only activities in the production value chain but also carry out exploration and development activities in the context of finding new drilling points and constructing drilling facilities. As not all exploration WAs come into operation and production, a risk map based on exploration areas will not provide a comprehensive picture of the industry.
Table 1 shows the number of WP&B proposals that were made available for this research.
Table 1: WP&B proposals shared by SKK Migas for analysis
No. Year Number of WP&B available for analysis
1 2014 77
2 2015 80
3 2016 81
4 2017 85
5 2018 59
Total 382
Source: SKK Migas (2018).
3.1.2. Data Envelopment Analysis (DEA)
DEA is a linear programming-based technique that converts multiple input and output
measures into a single comprehensive measure of productivity efficiency (Epstein and Henderson, 1989). It provides a measure by which one firm or department can compare its
performance, in relative terms, to other homogeneous firms or departments.
This research used MAX DEA software to generate the DEA efficiency score of various units
within the upstream oil and gas VC, based on WP&B financial data obtained from SKK Migas. Initially it was used to measure the efficiency score of each WA using input and output data to obtain an output-oriented result. We assumed the inputs for each WA were managed to achieve maximum output (Golany and Roll, 1989), and used variable return to scale (VRS)-orientated outputs to calculate the efficiency score (i.e. we also assumed that a firm does
not operate at an optimal scale and that the ratio between the addition of input and output is not the same).
To deepen the financial analysis, we used two-stage DEA (see appendix A for more detailed
information). The first stage generated a relative efficiency score by determining the input in the form of the total number of wells managed by the contractor (Input 1), the number of wells producing (Input 2), the area of WA controlled by the contractor (Input 3), and the number of employees managing the contractor's WA (Input 4). These four inputs are associated with two outputs, namely the levels of lifting oil (Output 1) and lifting gas (Output 2). This first stage calculated efficiency scores for each contractor from the 45 WA’s that produce oil and gas (WAs that produce only oil were eliminated).
Mapping corruption risk in Indonesia’s upstream oil and gas industry
21
The second stage used regression analysis to measure the effect of the average cost
obtained from financial analysis. Scores obtained from the first stage of the DEA were used as the dependent variable. Activities in the value chain that were relevant to the input and output model derived from the VCRM were used as the independent variable, which was tested for its effect on the dependent variable (i.e. the DEA efficiency score). This should enable identification of which costs for relevant value chain activities/processes (independent variable), especially in the primary area of the VCRM, have a strong relationship with the efficiency scores (dependent variable) and if there is any significance then this information would be of use later to analyse if there were any indication of corruption in that area that could significantly affect the efficiency.
3.2. Value chain private-sector analysis
Serving as a pseudo spatial map, the VCRM was populated by the relevant private-sector
players in the upstream oil and gas industry. This includes vendors and contractors.
Vendors are firms that deliver services and goods to oil and gas contractors with the majority under private ownership. Vendors are important players in the supply chain with more than 55,000 business transactions in 2014 valued in excess of US$8.8 billion.
Contractors ((Kontraktor Kontrak Kerjasama (KKKS)) are firms that sign an agreement with
the government and act as the operator of a WA. KKKS bear all exploration risks and production and development costs in return for a stipulated share of production profits resulting from the WA. They are governed by PSCs under Indonesia’s conventional upstream oil and gas fiscal regime, and/or Gross Split PSCs under the new fiscal regime. Gross Split PSCs are defined by the Ministry of Energy and Mineral Resources in Regulation no. 8/2017
as a production-sharing contract based on the principle of gross production split without a cost-recovery mechanism. All KKKS (PSCs, Gross Split PSCs and also Joint Operating Bodies7 (JOBs)) working in the exploration phase are populated in the VCRM and are represented by their financial and compliance data. KKKS in the exploration phase are excluded from the research focus because:
1 in PSC terms, contractors in the exploration phase are not yet eligible for cost recovery (own risk8).
2 most of the control applied to these contractors focuses on the fulfilment of investment commitments.
3 WP&B information was only available in an unstructured format for exploitation KKKS.
7 JOBs are a form of PSC, with Pertamina (National Oil Company) as contractor assisted by another company in operating a
WA
8 If contractors in the exploration phase are unsuccessful in finding oil/gas reserves and do not therefore proceed to the
exploitation phase they cannot recover exploration costs.

Mapping corruption risk in Indonesia’s upstream oil and gas industry
22
3.3. Value chain corruption risk analysis
3.3.1. Benford analysis
The Benford method (see Appendix A for more detail) was used in this study to demonstrate
how business risk mapping can be utilised to identify the risk of fraud in the proposed VCRM.
Benford analysis was applied to the WP&B financial data used to populate the VCRM and for the financial analyses. When applied to value chain sets, Benford’s Law could be used by SKK Migas as a screening tool for fraud detection in the budgeting process. For example, SKK Migas could use this method to identify if the budget figures submitted by KKKS in the WP&B proposals are subject to possible manipulation.
3.3.2. Right to audit (RTA) – compliance audit analysis
The procurement regulations issued by SKK Migas require that contracts include a
willingness by a company to be audited for compliance with the Indonesian Corruption Act (TIPIKOR), the Foreign Corrupt Practices Acts (FCPA), the Anti-Bribery and Corruption Act (ABC) and the Implementation Guideline on Goods/Services Procurement (SKK Migas, 2017).
We were given access to compliance and investigative audit reports conducted by internationally recognised audit companies on 15 private companies operating in the upstream oil and gas sector. These audits were conducted in accordance with Right to Audit (RTA) provisions (Boles, 2019), which require the vendor, at the sole discretion of the KKKS or SKK Migas, to give unrestricted access to their records for audit by independent auditors to ensure they are complying with Indonesian anti-corruption laws, the United States’
Foreign Corrupt Practices Act and the United Kingdom’s Anti-Bribery Act.
Using the ERM and CRM methodology (see section 2), we constructed a risk register9 from
the audit reports and mapped the findings to the heat map on the VCRM. These findings were analysed based on the impact of maximum legal (compliance) sanctions in Indonesia and classified according to the primary activities/areas and support activities/areas by multiplying the number of findings for each VC with an assessment score of potential legal (compliance) risk impacts related to violations. Table 2 illustrates the legal (compliance) impact assessment method ordered from the lowest penalty impact to the highest in line with Indonesian anti-corruption legislation (Republic of Indonesia, 1999; 2001).
9 A risk register is a tool for documenting risks and the actions required to manage each risk.

Mapping corruption risk in Indonesia’s upstream oil and gas industry
23
Table 2: Legal (compliance) impact assessment score based on Indonesian anti-corruption
law
Legal impact score (LIS)
Type of violation Maximum impact of legal sanctions
1 Administrative issues Written warning; restrictions on business activities, temporary suspension of part or all means of production; freezing of business activities
2 Article 13 of Law 31/1999 Imprisonment for three years and a fine of Rp 150,000,000
3 Article 5 of Law 20/2001 Imprisonment for five years and/or a fine of Rp 250,000,000
4 Article 6 of Law 20/2001 Imprisonment for 15 years and/or a fine of Rp 750,000,000
5 Article 12 of Law 20/2001
Article 2 of Law 31/1999
Article 3 of Law 31/1999
Life imprisonment or 20 Years imprisonment and a fine of Rp 1,000,000,000
Source: Republic of Indonesia (1999 and 2001b); KPK (2006).
The legal impact scores (LIS) were then multiplied by the number of findings (FEV, frequency of evidence) in each VCM to calculate the legal impact value (LIV).
LIV = LIS X FEV
The LIV results were then applied to the VCRM to generate a risk heat map.
3.3.3. Supreme Audit Board (BPK) – compliance audit analysis
The Indonesian Supreme Audit Board (Badan Pemeriksa Keuangan (BPK)) is a state institution with the authority to examine the management and accountability of state finances in the upstream oil and gas industry in accordance with Law No. 15 2004 on
Inspection, Management and Accountability of State Finance (Republic of Indonesia 2004; 2006). KKKS are subject to BPK audit, therefore we used four BPK semester audit reports for 2017 and 2018 as part of our compliance audit analysis (BPK-RI, 2017a, 2017b, 2018a, 2018b). The findings from the BPK audits were mapped to the VCRM and the same impact metrics were applied as in the RTA analyses (albeit financial impact metrics not legal impact metrics).
BPK also calculates potential financial losses to the state as part of its audits, therefore we
were able to classify these losses according to five levels and calculate the impact. For this we multiplied the financial impact scores (FIS) by the FEV to calculate the financial impact value (FIV). The loss level is calculated by multiplying the FIS with the frequency of the findings for each area in the VCRM using the following formula:
FIV = FIS X FEV
The FIV results were then applied to the VCRM to generate a risk heat map.
Mapping corruption risk in Indonesia’s upstream oil and gas industry
24
3.3.4. Analysis of criminal justice cases
Indonesia’s Supreme Court (Mahkamah Agung) is an independent judicial arm of the state
that sits above other courts. It is the final court of appeal and can also re-examine cases if new evidence emerges.
We analysed criminal cases relating to allegations of corruption so we could map them to
the VCRM and make a comparison with potential corruption risks obtained from the RTA and BPK compliance audit analyses.
3.3.5. Suspicious transactions analysis
This research is supported by Indonesia’s Financial Intelligence Unit, Pusat Pelaporan dan
Analisis Transaksi Keuangan (PPATK). Using the same VCM, basic data and methods
developed for this research, PPATK analysts conducted their own analyses of their Suspicious Transaction Records database to produce their own risk map (VCRM) on Indonesia’s upstream oil and gas industry.
3.3.6. House of Risk (HoR) analysis
The House of Risk (HoR) is a proactive supply chain risk management model that identifies risk agents and risk events (Pujawan and Geraldin, 2009) (see Appendix A for a more detailed description). The HoR model was adapted to determine which area in the VCM of the Indonesian upstream oil and gas industry (risk agents) should be given priority for preventive measures.
Risk events were gathered from all analyses conducted (especially from the corruption risk
analyses). A rank was assigned to each risk agent based on the magnitude of the Aggregate Risk Priority (ARP) values for each risk agent that will be treated/controlled. ARP is calculated as a multiplication of the occurrence of a risk event and the severity/impact (legal or financial impact) of that event. In this research the top ten risk agents from each of the primary and supporting areas in the VCM were thought to have large potential to induce risk events.
We used two HoR models (HoR1 and HoR2):
1 HoR1 was used to determine which risk agents should be given priority for preventive actions.
2 HoR2 gave priority to those preventive actions considered effective and doable with
reasonable effort to mitigate the risks. Preventive actions were chosen from existing, modified or enhanced anti-corruption initiatives/policies.

Mapping corruption risk in Indonesia’s upstream oil and gas industry
25
4. Results and discussion
4.1. Upstream value chain risk map
Tables B1 and B2 in Appendix B list the primary and support activities present in the
upstream oil and gas value chain, in sequential order. Our decisions regarding inclusion are based on literature studies of business processes in accordance with the appropriate legislation on the Indonesian oil and gas industry (Republic of Indonesia, 2001b, 2007; Ministry of Energy and Mineral Resources, 2017, 2018; SKK Migas, 2017a, 2018a, 2019a). ‘Decision to extract’ and ‘Award of contracts and licences’, the first two activities, were included in the value chain to show complete sequences in upstream oil and gas in Indonesia. These activities have not been evaluated for the current VCM and VCA but will be
used for future purposes.
The value chain was then developed, as shown in Figure 7.
Activities under ‘Decision to extract’ involve assessing the potential for oil and gas resources
that have not yet been discovered and determining the feasibility of oil or gas production in each case. Evaluations are carried out using one or a combination of the following methods: volumetric, well-performance, mathematical modelling, and comparisons of reservoirs with similarities in geology and/or performance. ‘Award of contracts and licences’ includes activities aimed at identifying the right company to manage a WA containing oil and gas. ‘Exploration’ evaluates the suitability of oil and gas projects and includes geological and geotechnical research. ‘Development & installation’ covers activities to construct underground and surface equipment to securely and effectively produce oil and gas.
‘Production’ includes activities to extract, process, stores and transport oil and gas as per a contract agreement. ‘Revenue collection’ is the taxation on profit from oil or gas lifting and subsequent commercial opportunities. ‘Abandonment and site restoration’ are activities to permanently plug wells, remove surface equipment and restore the block according to initial contract conditions.

Mapping corruption risk in Indonesia’s upstream oil and gas industry
26
Figure 7: Value chain map for upstream oil and gas in Indonesia10
Source: The authors.
4.2. Value chain risk analysis
Visual analysis was performed using Tableau software (University of California, 2020) to
generate a heat map layer on the base map that shows the magnitude of risk for different stages in the VC. Here, colour gradation is used to categorise the risks, with green representing the lowest risk and red the highest. This method of analysis can be based on various things including financial data, activities of KKKS or vendors, and audit findings.
4.2.1. Financial value chain analysis (VCA)
WP&B analysis
Figure B1 in Appendix B shows the distribution of financial data for each activity in the VC.
The colour gradation represents the relative value of financial expenditure and therefore the
level of corruption risk, from largest value/highest risk (red) to smallest value/lowest risk
10
Yellow shading indicates level 1 primary activities and blue shading represent level 2 primary activities

Mapping corruption risk in Indonesia’s upstream oil and gas industry
27
(green). The results can also be displayed in the form of a bar chart, as shown beneath the
VCM in Figure B1.
Financial value is based on the costs in the WP&Bs approved by SKK Migas as well as the
value of private business sourced from these funds.11 The gradation is based on the argument that greater funding allows for greater risk, which relates to the magnitude of the potential for corruption and inefficiency.
Data Envelopment Analysis (DEA)
As previously described in section 3.1.2, two-stage DEA is was used to calculate levels of efficiency per year for 45 WAs (see Figure B2 in Appendix B).
A DEA score of less than one shows inefficiency. Only 17 of 45 WAs attained optimal
efficiency levels over this five-year period. This is far from ideal and means that 62.2% of WAs did not achieve efficiency. Further research is required to explain why the level of efficiency is so low.
Table B3 (Appendix B) reveals that only 13 WAs were managed efficiently in 2014. This
number declined over the following years with only seven WAs managed efficiently in 2018. Only one WA reaches an annual score of one and therefore can be considered as managed efficiently for the five consecutive years in the observation period. This result is similar to previous research on ten WAs in Indonesia for the period 2005–2014, which shows a downward trend in the efficiency score from 0.5882 in 2005 to 0.4723 in 2014 (Putra and Adinugraha, 2018). The authors reason that this may be the result of oil and gas fields getting old and having no significant new reserve to discover. Oil and gas lifting and
production is dependent on various aspects, one of which is the reliability of the production and custody point facility. Mature oil and gas field facilities are heavily dependent on maintenance to retain their efficiency and productivity; if corruption exists in the area of maintenance and asset integrity (as shown by the BPK-compliance analysis) this risk can contribute to inefficiency in production/lifting.
Improving business risk efficiency will only be possible if a company reduces its costs. But the business model of the oil and gas sector implies that limited savings are possible in terms of inputs (Saxena et al., 2016). Hence, a company needs to innovate and assess their cost structure carefully. In relation to corruption risk, the existence of a value chain-based corruption risk map can help to identify aspects of a value chain that require attention to improve the efficiency of WA management.
11
We do not give absolute values as per our non-disclosure agreement signed with SKK Migas. Instead, the colour gradation indicates relative values.

Mapping corruption risk in Indonesia’s upstream oil and gas industry
28
Second-stage DEA analysis of the VCRM primary areas relevant to the input and output
model show two areas (maintenance & assets integrity and oil & gas production and processing & sundries) that have a significant effect on efficiency (Table B4).
4.2.2. Value chain private-sector analysis
Distribution analysis of vendors
Since 2018 vendor data has been recorded in Indonesia through the Centralized Integrated Vendor Database (CIVD), which is accessible to all upstream stakeholders (SKK Migas, 2016). The CIVD was designed to align with the provisions of Supply Chain Regulation PTK-0007 (SKK Migas, 2017a), by standardising (1) the assessment of partner qualifications across contractors, (2) improving transparency and accountability in the registration and evaluation of partner qualifications, and (3) increasing efficiency in procurement processes in terms of
time and costs.
In August 2018 there were 13,201 vendors registered in the CIVD. Of these, 6,448 had filed
their data as required by SKK Migas, while the remainder were in the process of doing so. For the purpose of this research, data was required regarding vendor experience, shareholder data and performance history (e.g. contracts awarded and sanctions applied). Vendor experience has been included in the VCRM as the history of ‘presence’ in the map.
Based on data obtained from the CIVD, Figure B3 (Appendix B) reveals that support activities
are concentrated in the area of ‘(Procurement of) material services’ and that primary activities are concentrated in ‘oil and gas maintenance & asset integrity’. By comparing this with the financial analysis (i.e. the population of vendors who work on certain activities)
itemised on the map, SKK Migas can assess if competition between vendors has reached a level that makes it appropriate to introduce quality, cost and delivery (QCD) measures on the material or services provided to try to improve supply chain management in the industry.
Contractors
WP&B financial analysis, Benford analysis and Supreme Audit – compliance analysis are
examples of analysis that involves contractors. See section 4.2.1, 4.2.3 and appendix B for the analysis and result.
4.2.3. Value chain corruption risk analysis
Benford analysis
Analysis of the WP&B data using Benford’s Law (see Figure B4, Appendix B) indicates
anomalies in the data. Four activities show an absolute deviation farthest from the percentage predicted by Benford, which indicates these activities are likely to involve fraudulent behaviour. The activities are ‘IT data management (computerisation)’, ‘Communication’, ‘Compliance audit’ and ‘Legal services’.

Mapping corruption risk in Indonesia’s upstream oil and gas industry
29
It should be noted that deviation from Benford's predictions does not directly indicate
corruption, but rather a risk of corruption. For example, inaccurate information (i.e. inaccurate budget calculations) could lead to false figures in the VC activities, but it does not directly indicate fraudulent behaviour. Such analysis would be useful for SKK Migas in the WP&B budgeting process so that more attention could be focused on those areas that show the highest risk of corruption. Additional analyses such as DEA and audit findings would help SKK Migas to have a greater understanding of the possible risks.
Right to audit (RTA) – compliance audit analysis
Our RTA compliance audit focuses on private-sector upstream oil and gas vendors. From the
VCRM shown in Figure B5 and Figure B6 (Appendix B), the audit reveals that 90% (509) of findings on the RTA risk register relate to corruption in supporting activities compared to 10% (51) in the primary area of the VC.
From a total of 18 level-2 supporting areas, 13 (72.2%) are identified as relating to corruption, compared to 7 of 21 (33.3%) level-2 primary areas. The principal reason for only 7 of 21 primary areas being detected is because vendors only work on specific areas in the primary process. A deeper, technical audit with vertical knowledge would be needed to find anomalies in primary areas such as reservoir engineering, petrotechnical engineering and offshore structural engineering. This is beyond the scope of this study.
In relation to the type of corruption identified, the RTA audit reveals 381 (74.85%) bribery
and extortion-related findings and 128 (25.15%) non-bribery and non-extortion-related findings. The audit reveals that only 14 (2.75%) findings relate to Articles 2 and 3 of Indonesia’s Anti-Corruption Law, both of which criminalise certain conduct that causes loss
to the state (Republic of Indonesia, 2001a). See Tables B5 to B9 of Appendix B for more detailed information on this.
RTA findings for ‘Personal expenses’ show a higher LIV score (Table B5) compared to
‘(Procurement of) material services’ (Table B6). The government and law enforcement agencies currently regard procurement as the area most vulnerable to corruption (Arifin et al., 2018).
Supreme Audit Board (BPK) – compliance audit analysis
Our VCRM analysis of the BPK compliance audit is shown in Figure B7 (financial impact –
compliance audit analysis) and Figure B8 (legal impact – compliance audit analysis) in Appendix B.
At this stage of analysis, the financial losses identified through the BPK audit are ordered
from the greatest to the smallest value for each VCRM area. The impact of these financial losses is calculated by classifying the sums according to five value levels, based on multiplication of the FIS (Table B10) with the FEV (Tables B11, B12, and B13).
Mapping corruption risk in Indonesia’s upstream oil and gas industry
30
The BPK audit focuses on oil and gas contractors (KKKS). We observe that most of the
potential corruption-related findings are associated with the primary areas of the VCRM (52 for primary areas against 41 for the supporting areas). These findings relate to 6 out of 18 (33.3%) level 2 supporting process areas and 12 of 21 (57.14%) level 2 primary process areas. All 93 findings relate to state financial loss as opposed to bribery or other forms of corruption.
Compared to the RTA analysis, the BPK audit generates more positive results regarding risks
in the primary area (56% for BPK versus 10% for RTA). The inverse is also true for the supporting areas, where the BPK analysis finds only 42% of activities relate to corruption, compared to 90% of the RTA findings.
Analysis of criminal justice cases
We find that most of the corruption-related court cases relate to primary areas of the VC (37 offences), compared to supporting areas (22 offences) (see Figure B14 and Figure B17 in Appendix B). Some of the cases involve oil and gas traders, including the case of the former Head of SKK Migas mentioned previously in this report. The convictions concern 3 out of 18 (17%) level-2 supporting process areas and 6 out of 21 (29%) level-2 primary process areas.
The Supreme Court convicted individuals for 15 bribery and extortion-related offences
(24.6%) and 46 non-bribery offences (75.4%). The latter included 27 (44.3%) state financial loss-related offences, which were contrary to Articles 2(1) and 3 of Indonesia’s Anti-Corruption Law.
We found violations in only three level-2 supporting areas, which included ‘(Procurement of)
material services’ (12), ‘Health, safety & environment (HSE)’ (8) and ‘Business insurance’ (2).
Analysis of Supreme Court convictions generates a VCRM map that covers only 23% of the supporting areas covered by the RTA audit.
PPATK suspicious transactions analysis
The PPATK suspicious transactions analysis indicates which risk areas are of greatest concern
(see Figure B19 and Table B14 in Appendix B).
Other studies mention the close relationship between corruption cases and money laundering offences (Chaikin, 2008; Mendes and Oliveira, 2013). If combined with other analyses, our research could be useful for further exploration of particular areas of the VC.
For example, ‘Production platform installation (Engineering Procurement Construction and Installation (EPCI)’ is identified in the VCRM as one of the most common high-risk corruption areas in almost all of the analyses (see Tables B7, B8, B12 and B13 in Appendix B) and therefore warrants further research.

Mapping corruption risk in Indonesia’s upstream oil and gas industry
31
House of Risk (HoR) analysis
The results of the HoR1 analyses (Figures 8, 9 and 10) illustrate the current levels of
corruption risk aggregated from all of the risk analyses and mapped to the VCRM. The results are presented as heat maps and are ranked (red, highest risk; green, lowest risk) according to the priority for preventive action. The HoR1 model also considers the probability of risk detection of each analysis as derived from the Failure Mode and Effects Analysis (FMEA) method, which identifies the probability of occurrence, the severity of impacts and detection (Atlantis Engineering SA, 2019). We find that our financial and private-sector analyses have the ‘lowest’ risk detection level and our corruption risk analysis (which is based on events registered in the criminal justice system) has the ‘highest’ risk detection level.
Figure 8: HoR1 aggregate (gross) risk
Source: The authors.

Mapping corruption risk in Indonesia’s upstream oil and gas industry
32
Figure 9: Aggregate inherent (gross) risk in primary level 3 activities
Source: The authors.
Figure 10: Aggregate inherent (gross) risk in level 3 supporting activities
Source: The authors.
The HoR1 results are then used in the HoR2 analysis to identify and rank actions considered
relevant for preventing/mitigating risk. Some of the actions are already operational, some are improvements to the existing policy and some are relatively new to Indonesia’s upstream oil and gas industry. Table 3 summarises the result of the HoR2 analysis.

Mapping corruption risk in Indonesia’s upstream oil and gas industry
33
Table 3: HoR2 rank of preventive/mitigating actions (PAk)
Preventive/mitigating action (PAk) Difficulty of performing action k (Dk)
Rank of proactive action k (Rk)
Primary Supporting
Integrated operational, knowledge-based engineering and master data
High 1 8
Preventive collaborative work Medium 2 5
Implementation of SNI ISO 37001:2016 Anti-Bribery Management System (ABMS)
Low 3 3
Actions to improve supply chain including CIVD improvement and integration
Medium 4 4
Fiscal regime improvement High 5 6
Red-tape reduction policy Low 6 1
Focused KPK profit programme Low 7 2
Oil and gas transparency initiatives (including ‘beneficial owner’ (BO) initiative)
High 8 7
Source: The authors.
Integrated operational, knowledge-based engineering and master data
The HoR2 results indicate that integrating operational, engineering and other data is the
highest priority to reduce risk for primary areas of the VC. But this is a difficult task. The primary areas involve business processes that require multi-discipline, ‘technical’/engineering knowledge and skills. As a result, deep knowledge of related issues and best practices are needed to cope with business and corruption risk. For example, how would one detect and deal with fraudulent under- or over-engineering specifications, or be certain that a reservoir estimation offered in a participating interest scheme is accurate and
not fraudulent? How could red flags be detected in change orders that occur in an Engineering, Procurement, Construction (EPC) project, or fraud be detected in oil/gas lifting reports? These are all issues previously raised by the US Department of Justice in relation to allegations of false claims for royalties underpayment (US DoJ, 2009; 2010).
Norway introduced an Integrated Operation (IO) system to increase production, extend
reserves and reduce costs by integrating the use of technology, people and business processes. The system also includes an integrated and secure reporting system for production volumes. A review of this IO shows benefits including a 25% reduction in capital expenditures and 20% in operating expenses, and other benefits such as greater reliability of production facilities (Verhelst, 2012). Norway also introduced the Exploration and Production Information Management Association (EPIM) (Langeland, 2015), an initiative that offers solutions and
processes to achieve standardised, transparent, secure and effective interaction between the main actors in the Norwegian Continental Shelf oil and gas industry. EPIM includes EqHub, an integrated technical/engineering information library for standard equipment according to industry standards, which is available to operators, contractors and suppliers/vendors. EqHub is improving engineering knowledge and supply chain efficiency and effectiveness in the industry, and at the same time enabling transparency and good governance. Although difficult to implement, initiatives such as these introduced in Norway could reduce risks in the primary areas of Indonesia’s upstream oil and gas VC.

Mapping corruption risk in Indonesia’s upstream oil and gas industry
34
Red-tape reduction policy
The highest priority for supporting areas is a ‘red-tape reduction policy’.
Indonesian oil and gas contractors must deal with more than 280 permits from 14
institutions and 84 local governments. Each year more than 5,000 permits are issued to the upstream oil and gas industry (SKK Migas, 2015). There is no statistic for oil and gas vendors and traders, but the number could be higher.
‘Red tape’ and the associated corruption, bribery and fraud that may be used to navigate excessive regulation is a common problem in the Indonesian business environment. This behaviour can be classified as market restriction-driven corruption, which in many cases is the most feasible type of corruption to address (Khan et al., 2019). The problem is well recognised in Indonesia and is being prioritised by the current government (The Straits
Times, 2019).
This research provides clear evidence that it is important to reduce red tape to manage not
only business risk but also corruption risk, and such a policy should be relatively simple to implement. It could be especially effective in addressing the corruption risks in, for example, ‘Formalities12’, ‘Public relations & community projects’ and ‘Health, safety and environment’ in the VC.
Preventive collaborative work
Figure 11 presents a VC ‘base-map’ that shows the proposed integration and collaboration model/architecture for relevant organisations or ‘boundary partners’. For this research we
show a working model for SKK Migas, KPK and PPATK. With appropriate extensions this model could also be utilised by the Indonesian tax authority, BPK and/or law enforcement agencies like the police and the Attorney General’s Office. This working model, analysed using the HoR2 approach, shows the potential to improve detection and prevention of corruption risk in primary areas compared with current practice. Collaborating in the use of ‘one map’ would improve the contribution of each party involved.
12
Formalities is a term used by SKK Migas for activities that requires formal approval workflow in the government agencies

Mapping corruption risk in Indonesia’s upstream oil and gas industry
35
Figure 11: Proposed collaboration and operating model
Source: The authors.
The distribution of value or information is displayed in layered heat maps. Each layer
represents relevant contextual information that has resulted from data and analysis provided by each boundary partner. Information-sharing could be easily organised and administrated in the integration layer.
Depending on the context, the analysis methods used in this research could be used by different boundary partners to identify corruption risks. This may include spatiotemporal analysis. The HoR framework has been applied in this research to aggregate the various risk analyses to form a gross/inherent risk map for Indonesia’s upstream oil and gas industry. This enables stakeholders to understand the priority order of preventative actions.

Mapping corruption risk in Indonesia’s upstream oil and gas industry
36
Implementation of SNI ISO 37001:2016 Anti-Bribery Management System (ABMS)
The use of an ISO Management System Standard (MSS) such as ISO 900013, 1400014, etc. in
developing countries is increasing (Malik and YeZhua, 2006). Organisations that implement ISO standards may be seeking to improve product or service quality, operational efficiency, environmental performance, health and safety in the workplace and to better manage the risk of bribery (ISO, 2016). Some studies also indicate the benefit of using ISO standards to achieve organisational objectives, with encouraging results in developing countries including Indonesia (Singels et al., 2001; Hilman and Kristiningrum, 2008; Aprilia et al., 2017).
In this research, implementation of the ABMS is regarded as an all-round risk mitigation
measure for primary and supporting areas and can be considered easy to implement. Indeed, SKK Migas triggered implementation of ISO 3700115 at the beginning of 2019, and currently several private companies involved in upstream oil and gas are implementing SNI
ISO 37001:201616. Other companies, including state-owned enterprises operating in the oil and gas sector are also in the process of implementing the ISO.
The results and findings of this research (i.e. the VCRM, risk register, heat maps and analyses) may be useful as an industrial reference for those companies that wish to implement the ABMS.
Actions to improve the supply chain, including integration of the CIVD
SKK Migas’s existing policy to implement and enforce the RTA clause as part of an anti-
corruption/bribery compliance audit should be continued but with some adjustment, especially in terms of choosing the ‘right’ auditee. Using the risk map generated from this
research, SKK Migas and KKKS have a more systematic and targeted risk area to prioritise.
The quality and structure of data in the CIVD should be a focus area too. The procurement system could be integrated with the database, so that the CIVD could serve as a source of vendor evaluation, with data on vendor ABC classifications,17 for example.. Integration of an engineering catalogue, as implemented in Norway, could further enhance an early risk detection system.
13
ISO 9000 family quality management standards : https://www.iso.org/iso-9001-quality-management.html
14 ISO 14000 environmental management systems (EMS) standards: https://www.iso.org/iso-14001-environmental-
management.html
15 ISO 37001 anti-bribery management system standard: https://www.iso.org/iso-37001-anti-bribery-management.html
16 SNI ISO 37001:2016 Sistem manajemen anti penyuapan (Adopted by Indonesian Standard Agency):
http://sispk.bsn.go.id/SNI/DetailSNI/11196
17 A common method to rank vendors according to various criteria and due diligence.

Mapping corruption risk in Indonesia’s upstream oil and gas industry
37
Fiscal regime improvement
Introduced in 2017 by the Ministry of Energy and Mineral Resources, the Gross Split PSC
model has been implemented in 39 WAs, especially in the mature oil and gas fields. This type of contract was intended to improve efficiency in the sector and to lessen corruption risk. Although this new fiscal regime was first seen as unattractive by many oil and gas investors and observers, it was later modified to attract more interest from investors.
Our analysis indicates that fiscal regime improvement could be difficult to implement.
However, it would be easier if the National Oil Company implemented it for mature fields. Furthermore, Indonesia’s new Minister of Energy has issued a recent ministerial decree that permits investors to choose whether to use the old PSC or the Gross Split PSC.
Focused KPK profit programme
The current KPK profit programme is specifically intended to prevent corruption risk in the
private sector (KPK, 2019). The programme could be enhanced by targeting the priority risk areas identified by our HoR1 analysis, which would reduce the corruption risk in supporting areas of the VCRM. Using the same map to collaborate with other stakeholders (see Figure 11) could serve as a catalyst for implementation of the ABMS and CIVD, for example.
Oil and gas transparency initiatives
Since 2010 Indonesia has been a member of the Extractive Industries Transparency Initiative (EITI), supported by Presidential Regulation No.26/2010 (Republic of Indonesia, 2010). Under the EITI, all oil and gas contractors must report taxes, royalties and in-kind payments made
to their respective government, while governments must report revenues derived from extractive companies. These two reports are reconciled by an independent auditor, published and made accessible to all citizens of that country.
Another initiative currently being proposed to the Government of Indonesia is the ‘Beneficial
Owner’ (BO) initiative that requires all EITI member countries, by 2020, to publish the names of the real owners (not those acting as fronts for the real owners) of all companies in the extractive industry, including oil and gas. Implementation of the BO initiative could be difficult to enforce, however, as upstream oil and gas entities have high business risk layers with regards to ownership – according to an internal SKK Migas report, some BO data is hidden in tax havens and therefore the information is not transparent. The challenges here explain why transparency initiatives are ranked so low in Table 3 for both the primary and supporting areas.

Mapping corruption risk in Indonesia’s upstream oil and gas industry
38
5. Conclusions and recommendations Several methods of analysis have been used in this paper, the results of which can be
combined to derive particular conclusions.
The findings regarding the ‘Formalities’ VC in the supporting area consistently reveal clear evidence of corruption risk across several layers of the VCRM. According to the risk register, this relates directly to ‘red tape’ and the associated corrupt behaviour to navigate excessive regulations. We also find from the HoR1 analysis that ‘Production platform installation (EPCI)’ in the primary area of the VC and ‘(Procurement of) material services’ in the supporting area are ranked among the top-five highest risk areas by the RTA, BPK, Supreme Court, and PPATK analyses/audits and even the financial analysis.
Our RTA compliance audit analysis also reveals evidence of corruption risk in several other
areas in the VCRM. This includes risks in ‘Formalities’, but in ‘Public relations & community projects’ and ‘Security’ in the supporting areas as well, which are all susceptible to bribery. Many studies suggest that corporate social responsibility (CSR) spending has a positive impact on corruption risk in these sort of areas (Lu et al., 2019). However, there are corruption risks in CSR spending itself, so further research would be needed to identify the most effective risk mitigation measures here (Volkov, 2016).
It is also interesting to compare differences in the findings of the RTA, KPK, PPATK and BKP
audits. For example, the BPK audit was better in relation to identifying/revealing corruption risks in revenue collection while the RTA analysis was better on identifying/revealing non-revenue offences involving corruption. This difference suggests that the BPK audit was not
focused sufficiently on non-revenue collection areas. We also observe that the RTA results detected notably more bribery/corruption-related offences than any other analyses, which is likely because the RTA methods and objectives are focused on detecting these particular offences.
Based on the findings of our analyses, we recommend the following:
a) Deep vertical technical/engineering knowledge is needed to cope with the risks in the primary areas of the VC. Organisations that wish to prevent these risks should develop a strong and independent technical/engineering control system to enable early detection and to act as a check and balance for anomalies.
b) The Ministry of Energy and Mineral Resources should take the lead in ‘red-tape reduction’ policies/initiatives with backing from the President. SKK Migas, in
coordination with other ministries and governmental bodies, should work towards streamlining the laws and regulations relating to the oil and gas industry. The VCRM and risk register could be enriched further and used as a tool to identify, select and simplify the permits and regulations that need to be addressed.
c) SKK Migas – as the governing body of upstream oil and gas business activities in Indonesia – should be tasked with leading implementation of an integrated operational, knowledge-based engineering and master data initiative. SKK Migas has commenced
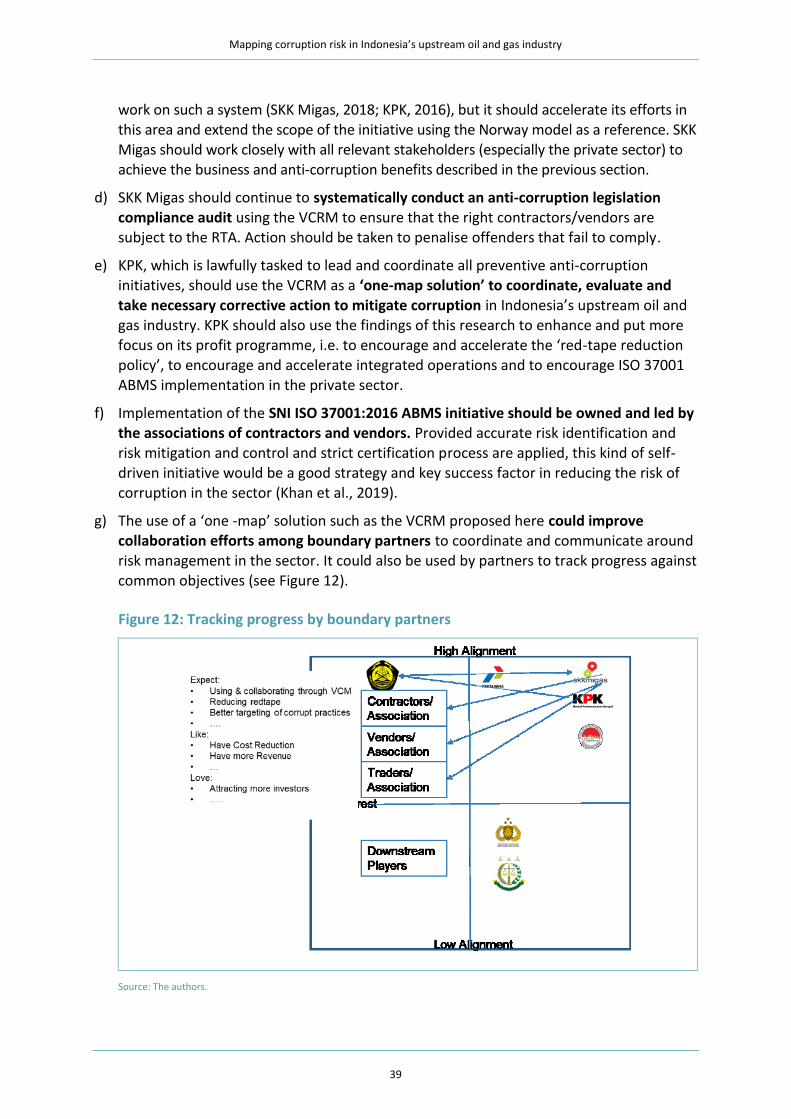
Mapping corruption risk in Indonesia’s upstream oil and gas industry
39
work on such a system (SKK Migas, 2018; KPK, 2016), but it should accelerate its efforts in
this area and extend the scope of the initiative using the Norway model as a reference. SKK Migas should work closely with all relevant stakeholders (especially the private sector) to achieve the business and anti-corruption benefits described in the previous section.
d) SKK Migas should continue to systematically conduct an anti-corruption legislation compliance audit using the VCRM to ensure that the right contractors/vendors are subject to the RTA. Action should be taken to penalise offenders that fail to comply.
e) KPK, which is lawfully tasked to lead and coordinate all preventive anti-corruption initiatives, should use the VCRM as a ‘one-map solution’ to coordinate, evaluate and take necessary corrective action to mitigate corruption in Indonesia’s upstream oil and gas industry. KPK should also use the findings of this research to enhance and put more focus on its profit programme, i.e. to encourage and accelerate the ‘red-tape reduction policy’, to encourage and accelerate integrated operations and to encourage ISO 37001
ABMS implementation in the private sector.
f) Implementation of the SNI ISO 37001:2016 ABMS initiative should be owned and led by the associations of contractors and vendors. Provided accurate risk identification and risk mitigation and control and strict certification process are applied, this kind of self-driven initiative would be a good strategy and key success factor in reducing the risk of corruption in the sector (Khan et al., 2019).
g) The use of a ‘one -map’ solution such as the VCRM proposed here could improve collaboration efforts among boundary partners to coordinate and communicate around risk management in the sector. It could also be used by partners to track progress against common objectives (see Figure 12).
Figure 12: Tracking progress by boundary partners
Source: The authors.
Mapping corruption risk in Indonesia’s upstream oil and gas industry
40
h) As time and resources are limited in this study, further work is needed to enhance the
accuracy and completeness of the basic map as well the data that could be used to populate it. For example, the financial data could be extended to include exploration WAs, further spatio- (metaphor) temporal analysis and spatial (metaphor) pattern analysis could be applied to the VCRM, and/or the research could be extended to include public-sector entities such as the Ministry of Energy and Mineral Resources.
i) The principal methods described in this research could be used with minor changes in other countries that have similar regulatory and fiscal regimes as Indonesia and seek to mitigate risks in their own upstream oil and gas industries. The VCRM could also be extended for use in other industries.
To conclude, the value chain risk map developed in this study reveals the vulnerability of
Indonesia’s upstream oil and gas industry to corruption. Corruption takes many forms,
however, therefore it is important to be able to effectively map key points of vulnerability (Kaufmann, 2015). Each point needs to be linked to specific institutional factors and actors and will require various integrated actions that are prioritised according to risk level. The ability to map this information – using the VCRM model proposed in this study – is an essential first step so that stakeholders in the upstream oil and gas industry and beyond can identify risks and take appropriate mitigating action.

Mapping corruption risk in Indonesia’s upstream oil and gas industry
41
6. References Agustina, L. and Baroroh, N. (2016) ‘The relationship between Enterprise Risk Management (ERM) and firm value mediated through the financial performance’, Review of Integrative Business and Economics Research 5(1): 128–138.
Ahn, T., Arnold, V., Charnes, A. and Cooper, W.W. (1989) ‘DEA and ratio efficiency analyses for public institutions of higher learning in Texas’, Research in Governmental and Nonprofit Accounting 5: 165–185.
Aprilia, S., Samsuri, E. and Andari, T.T. (2017) ‘Pengaruh Penerapan Sistem Manajemen Keamanan Pangan Iso 22000:2005 Terhadap Kualitas Produk Pangan Pada Departemen Produksi Noodle Pt. Jakarana Tama Food Industry (Factory) Bogor’, Jurnal Visionida 3 (1): 14–24.
Arifin, Z., Handayani, E. and Virdaus, S. (2018) ‘Combating corruption in the procurement by the press’, IOP Conference Series: Earth and Environmental Science 175 (012131). https://doi.org/10.1088/1755-1315/175/1/012131
Atlantis Engineering SA (2019) Strategies and predictive maintenance models wrapped around physical systems for zero-unexpected-breakdowns and increased operating life of factories; KRI models and tools for FMECA and criticality analysis. Z-BRE4K. https://www.z-bre4k.eu/wp-content/uploads/2019/09/Z-BRE4K_768869_Deliverable_D3.3.pdf
Benford, F. (1938) ‘The law of anomalous numbers’, Proceedings of the American Philosophical Society 551–572.
Boles, J.R. (2019) ‘The contract as anti-corruption platform for the global corporate sector’. Berkeley, CA: Berkeley School of Law. https://scholarship.law.upenn.edu/cgi/viewcontent.cgi?article=1588&context=jbl
BPK-RI (Badan Pemeriksa Keuangan, Supreme Audit Board of the Republic of Indonesia) : (2017a) Ikhtisar Hasil Pemeriksaan Semester I 2017. JakartaLBPK-RI. https://www.bpk.go.id/ihps/2017/I
BPK-RI (2017b) Ikhtisar Hasil Pemeriksaan Semester II 2017. Jakarta: BPK-RI. https://www.bpk.go.id/ihps/2017/II
BPK-RI (2018a) Ikhtisar Hasil Pemeriksaan Semester I 2018. Jakarta: BPK-RI. https://www.bpk.go.id/ihps/2018/I
BPK-RI (2018b) Ikhtisar Hasil Pemeriksaan Semester II 2018. Jakarta: BPK-RI. https://www.bpk.go.id/ihps/2018/II
Campos, J. E. and S. Pradhan (2007) The many faces of corruption: tracking vulnerabilities at the sector level. Washington, DC: World Bank. https://openknowledge.worldbank.org/handle/10986/6848
CGMA (Chartered Global Management Accountant) (2012) ‘How to communicate risks using a heat map’. CGMA Tools. New York and London: CGMA. https://web.actuaries.ie/sites/default/files/erm-resources/communicate-risks-using-heat-map.pdf
Chaikin, D. (2008) ‘Commercial corruption and money laundering: a preliminary analysis’, Journal of Financial Crime 15 (3): 269-281. https://doi.org/10.1108/13590790810882865
COSO (Committee of Sponsoring Organizations of the Treadway Commission) (2004) COSO Enterprise Risk Management — integrated framework. Washington, DC: COSO. https://www.coso.org/Documents/COSO-ERM-Executive-Summary.pdf
COSO (2017) Enterprise Risk Management: integrating with strategy and performance. April. Washington, DC: COSO. https://www.coso.org/Documents/2017-COSO-ERM-Integrating-with-Strategy-and-Performance-Executive-Summary.pdf
Dean, Mark. (2018) ‘Knife Crime in Nottinghamshire: Performance & Intelligence Analysis Insight .’ Intelligence Analysis, Nottinghamshire Police.
DGOG (Directorate General of Oil and Gas) (2018) ‘Laporan Tahunan CAPAIAN PEMBANGUNAN 2018’: Direktorat Jenderal Minyak dan Gas Bumi

Mapping corruption risk in Indonesia’s upstream oil and gas industry
42
Elsaghier, E.H. (2017) ‘Planning and optimising of petroleum industry supply chain and logistics under uncertainty’. Sheffield: Sheffield Hallam University. https://search.proquest.com/docview/2035748288?accountid=188395
Epstein, M.K. and Henderson, J.C. (1989) ‘Data envelopment analysis for managerial control and diagnosis’, Decision Science 20 (1): 90–119.
Fenton Villar, P. and Papyrakis, E. (2017) ‘Evaluating the impact of the Extractive Industries Transparency Initiative (EITI) on corruption in Zambia’, Extractive Industries and Society 4(4): 795–805. https://doi.org/10.1016/j.exis.2017.01.009
Gjokutaj, E. (2019) Albanian extractive industry and the role of production sharing agreements. Tirana: ALTAX Albanian Fiscal Studies.
Golany, B. and Roll, Y. (1989) ‘An application procedure for DEA’, Omega 17(3): 237–250. https://doi.org/10.1016/0305-0483(89)90029-7
Hilman, M.S. and Kristiningrum, E. (2008) “Kajian manfaat penerapan ISO 14001 pada 12 perusahaan’, Jurnal Standardisasi 10 (3): 136–140.
IBEF (India Brand Equity Foundation) (2014) Oil and gas.New Delhi: IBEF. https://www.ibef.org/download/Oil-and-Gas-August-2014.pdf
IEA (International Energy Agency) (2018) Global oil and gas upstream capital spending, 2012–2018. Paris: IEA. https://www.iea.org/data-and-statistics/charts/global-oil-and-gas-upstream-capital-spending-2012-2018
ISO (International Organization for Standardization) (2018) ISO 31000:2018 Risk management. Geneva: ISO.
ISO (2016) ‘ISO 37001:2016 Anti-bribery management systems’. Geneva: ISO.
Johnsøn, J. (2015) ‘Basics of corruption risk management: a framework for decision making and integration into the project cycle’. U4 Issue 2015:18. Bergen, Norway: CMI-U4.
Jong, H.N. (2013) ‘SKK Migas chief arrested for alleged bribery’, The Jakarta Post, 14 August. https://www.thejakartapost.com/news/2013/08/14/skk-migas-chief-arrested-alleged-bribery.html
Jurevicius, O. (2013) ‘Value chain analysis: strategic management insight’. Strategic Management Insights, 25 April. https://www.strategicmanagementinsight.com/tools/value-chain-analysis.html
Kaufmann, D. (2015) ‘Evidence-based reflections on natural resource governance and corruption in Africa’. In Zedillo, E., Cattaneo, O. and Wheeler, H. (eds) Africa at a Fork in the Road: Taking Off or Disappointment Once Again? New Haven, CT: Yale Center for the Study of Globalization (YCSG), pp. 239–259.
Khan, M., Andreoni, A. and Roy, P. (2019) Anti-corruption in adverse contexts: strategies for improving implementation. ACE Working Paper. London: SOAS University of London.
KPK (Komisi Pemberantasan Korupsi, Corruption Eradication Commission) (2006) Memahami Untuk Membasmi: Buku Panduan untuk Memahami Tindak Pidana Korupsi. Jakarta: KPK.
KPK (2016) ‘Pengelolaan Sumber Data Hulu Migas dengan Akuntabel dan Transparan‘. International Business Integrity Conference (IBIC), Jakarta, November.
KPK (2019) ‘OECD praises KPK’s move to prevent corruption in private sector’, news release, 25 June. https://www.kpk.go.id/en/news/highlights/1118-oecd-praises-kpk-s-move-to-prevent-corruption-in-private-sector
Langeland, T. (2015) EPIM cooperation between authorities and industry. Houston, TX: Standards Leadership Council.
Lima-de-Oliveira, R. (2019) ‘Corruption and local content development: assessing the impact of the Petrobras’ scandal on recent policy changes in Brazil’, The Extractive Industries and Society. https://doi.org/10.1016/j.exis.2019.08.004
Lind, L., Pirttilä, M., Viskari, S., Schupp, F. and Kärri, T. (2012) ‘Working capital management in the automotive industry: financial value chain analysis’, Journal of purchasing and supply management 18(2): 92–100.
Mapping corruption risk in Indonesia’s upstream oil and gas industry
43
Lu, J., Ren, L., Qiao, J., Yao, S., Strielkowski, W. and Streimikis, J. (2019) ‘Corporate social responsibility and corruption: implications for the sustainable energy sector’, Sustainability (MDPI) 11(15). https://www.doi.org/10.3390/su11154128
MACC (Malaysian Anti-Corruption Commission) (2015) ‘Corruption risk management (CRM)’. Kuala Lumpur. https://www.sprm.gov.my/index.php/en/maca/korporat/142-knowledge/769-anti-corruption-framework-guidelines-and-corruption-risk-management-crm
Malik, S.A. and YeZhua, T. (2006) ‘ISO certification: the trend and scope from Pakistani’. Proceedings of the IEEE International Conference on Management of Innovation and Technology (ICMIT2006), Singapore, pp. 766–771.
Mansoury, I., Mamizadeh-Chatghayeh, S., Abbasi, V., Barahimi, P. and Tahmouresi, A. R. (2013) ‘Assessment of industrial cluster with value-chain DEA model’, International Journal of Data Envelopment Analysis 1(1): 43–48.
Mendes, C. and Oliveira, J. (2013) ‘Money laundering and corrupt officials: a dynamic model’, Journal of Money Laundering Control 16(1): 55–61. https://doi.org/10.1108/13685201311286850
Ministry of Energy and Mineral Resources (2017) ‘Peraturan Menteri Energi Dan Sumber Daya Mineral Republik Indonesia, Nomor 17 Tahun2017 Tentang Organisasi dan Tata Kerja Satuan Kerja Khusus Pelaksana Kegiatan Usaha Hulu Minyak dan Gas Bumi’. Jakarta: Ministry of energy and Mineral Resources.
Ministry of Energy and Mineral Resources (2018) ‘Peraturan Menteri Energi Dan Sumber Daya Mineral Republik Indonesia, Nomor 52 Tahun 2018 Tentang Perubahan Atas Peraturan Menteri Energi Dan Sumber Daya Mineral No 29/2017 Tentang Perizinan Pada Kegiatan Usaha Minyak dan Gas Bumi’. Jakarta: Ministry of energy and Mineral Resources.
MOGA (Marine Oil and Gas Academy) (2018) ‘Oil & gas value chains’. Cape Town: MOGA. http://moga.saoga.org.za/resources/oil-gas-value-chains
Mooney, C.L. (2014) ‘5 reasons CR professionals need a value chain map’, GreenBiz, 9 January. https://www.greenbiz.com/blog/2014/01/09/5-reasons-cr-professionals-need-value-chain-map
NCA (Norwegian Coastal Adminstration) (2015) ‘New technology reduces environmental impact from oil spills’, news item, 17 September. Alesund: NCA. https://www.kystverket.no/en/News/New-technology-reduces-environmental-impact-from-oil-spills/
Nigrini, M.J. (2012) Benford's Law: applications for forensic accounting, auditing, and fraud detection. Oxford: John Wiley & Sons.
OECD (Organisation for Economic Cooperation and Development) (2006) World Energy Outlook 2005. Paris: OECD Publishing.
OECD (2014) OECD Foreign bribery report: an analysis of the crime of bribery of foreign public officials. Paris: OECD Publishing. https://dx.doi.org/10.1787/9789264226616-en
OECD (2016) Corruption in the extractive value chain - typology of risks, mitigation measures and incentives. OECD Development Policy Tools Series. Paris: OECD Publishing.
Ojeka, S., Adegboye, A., Adegboye, K., Umukoro, O., Dahunsi, O. and Ozordi, E. (2019) ‘Corruption perception, institutional quality and performance of listed companies in Nigeria’, Heliyon 5(10). https://doi.org/10.1016/j.heliyon.2019.e02569
Pagach, D. and Warr, R. (2011) ‘The effects of enterprise risk management on firm performance’, SSRN Electronic Journal. https://doi.org/10.2139/ssrn.1155218
Porter, M.E. (1985) Competitive strategy: creating and sustaining superior performance. in creating and sustaining competitive advantage. NY: Free Press.
Pujawan, I.N. and Geraldin, L.H. (2009) ‘House of risk: a model for proactive supply chain risk management’, Business Process Management 15 (6): 953–967. https://doi.org/10.1108/14637150911003801
Putra, I.S. and Adinugraha, D. (2018) ‘Factors affecting efficiency of oil and gas companies in indonesia two stage DEA analysis’. Proceedings of the DEA40: International Conference of Data Envelopment Analysis, Aston Business School, pp. 93–100.
PwC Indonesia. (2019). Oil and Gas in Indonesia: Investment and Taxation Guide 10th Edition. PwC Indonesia.

Mapping corruption risk in Indonesia’s upstream oil and gas industry
44
Quon, T.K., Zeghal, D. and Maingot, M. (2012) ‘Enterprise risk management and business performance during the financial and economic crises’, Problems and Perspectives in Management 10(3): 95-103.
Reese, J., Waage, M., Gerwin, K. and Koch, S. (2016) Value chain analysis: conceptual framework and simulation experiments. Baden-Baden: Nomos Verlagsgesellschaft.
Republic of Indonesia (1999) ‘Undang-undang (UU) No. 31 Tahun 1999. Pemberantasan Tindak Pidana Korupsi’. Jakarta: Republic of Indonesia.
Republic of Indonesia (2001a) ‘UU No. 20 Tahun 2001 tentang Perubahan Atas Undang-Undang Nomor 31 Tahun 1999 tentang Pemberantasan Tindak Pidana Korupsi’. Jakarta: Republic of Indonesia.
Republic of Indonesia (2001b) ‘Undang Undang No 22 Tahun 2001 Tentang Minyak dan Gas Bumi’. Jakarta: Republic of Indonesia.
Republic of Indonesia (2004) ‘Undang Undang No 1 Tahun 2004 tentang Perbendaharaan Negara’. Jakarta: Republic of Indonesia.
Republic of Indonesia (2006) ‘Undang Undang No 15 tahun 2006 Pasal 1 angka 15 tentang Badan Pemeriksa Keuangan’. Jakarta: Republic of Indonesia.
Republic of Indonesia (2007) ‘Peraturan Pemerintah Republik Indonesia, Nomor 59 Tahun 2007, Tentang Kegiatan Usaha Panas Bumi’. Jakarta: Republic of Indonesia.
Republic of Indonesia (2010) ‘Presidential Regulation RI No.26 2010 (National/Local Extractive Industry Revenue)’. Jakarta: EITI Indonesia. http://eiti.ekon.go.id/en/perpres-26-2010/
Saxena, P., Rajan Saxena, R. and Sehgal, D. (2016) ‘Efficiency evaluation of the energy companies in CNX 500 Index of the NSE, India using data envelopment analysis’, Benchmarking: An International Journal 23 (1): 113–126.
Sexton, T.R. (1986) ‘The methodology of data envelopment analysis’, New Directions for Program Evaluation 1986 (Winter): 7–29.
Sharma, S.K., Sengupta, A., Panja, S.C. and Nandi, T. (2016) ‘Corruption risk assessment methods: a review and future’, ELK Asia Pacific Journal of Finance and Risk Management 7 (4).
Shqairat, A. and Sundarakani, B. (2018) ‘An empirical study of oil and gas value chain agility in the UAE’, Benchmarking: An International Journal 25 (9): 3541–3569. https://doi.org/10.1108/BIJ-05-2017-0090
Singels, J., Ruël, G. and Van De Water, H. (2001) ‘ISO 9000 series-Certification and performance’, International Journal of Quality Reliability Management 18 (1): 62–75.
SKK Migas (2016) Dokumen Panduan Vendor CIVD. Jakarta: SKK Migas.
SKK Migas (2017a) Pedoman Tata Kerja, Nomor: PTK-007/SKKMA0000/2017/S0 Tentang Pedoman Tata Kerja Pengelolaan Rantai Suplai. Jakarta: SKK Migas.
SKK Migas (2018) Pedoman Tata Kerja, Nomor: PTK-054/SKKMA000/2018/S0, Tentang Sistem Operasi Terpadu. Jakarta: SKK Migas.
SKK Migas (2017) Pedoman Tata Kerja, Nomor: PTK-063/SKKMA0000/2017/S0, Tentang Financial Budget and Reporting Manual of Production Sharing Contract dan Chart of Account. Jakarta: SKK Migas.
SKK Migas (2019a). Pedoman Tata Kerja, Nomor: PTK-066/SKKMA0000/2019/S0, Tentang Penyusunan Dan Pelaporan Kegiatan Usaha Hulu Minyak Dan Gas Bumi Dengan Skema Gross Split.
SKK Migas (2019b) ‘Buletin SKK Migas’. Tingkatkan Investasi Migas Indonesia, May. Jakarta: SKK Migas.
SKK Migas (2015) Penyederhanaan Perizinan untuk Kegiatan Usaha Hulu Migas. Internal Report. Jakarta: SKK Migas.
The Straits Times (2019) ‘Jokowi planning to cut red tape to attract investments’, The Straits Times, September. https://www.straitstimes.com/asia/se-asia/jokowi-planning-to-cut-red-tape-to-attract-investments
Transparency International (2019) ‘Corruption statistics’. General corruption statistics. Berlin: Transparency International. https://www.transparency.org.uk/corruption/corruption-statistics/

Mapping corruption risk in Indonesia’s upstream oil and gas industry
45
UNCTAD (United Nations Conference on Trade and Development) (2012) ‘Extractive industries: optimizing value retention in host countries’. UNCTAD XIII, Qatar.
University of California (2020) Data visualization with Tableau specialization. Coursera. https://www.coursera.org/specializations/data-visualization
US DoJ (United States Department of Justice) (2009) ‘Chevron to pay U.S. more than $45 million to resolve allegations of false claims for royalties underpayment’. US Department of Justice press release, 23 December. https://www.justice.gov/opa/pr/chevron-pay-us-more-45-million-resolve-allegations-false-claims-royalties-underpayment
US DoJ (2010) ‘Mobil oil companies to pay U.S. $32.2 million to resolve allegations of underpayment of royalties from American Indian and Federal Lands’. US Department of Justice press release, 5 April. https://www.justice.gov/opa/pr/mobil-oil-companies-pay-us-322-million-resolve-allegations-underpayment-royalties-american
Verhelst, F. (2012) Integrated Operations in the High North, Joint Industry Project. Final Report. Bærum, Norway: IOHN.
Volkov, M. (2016) ‘Corruption risks and corporate social responsibility spending’, Corruption, Crime & Compliance, 22 May. https://blog.volkovlaw.com/2016/05/corruption-risks-corporate-social-responsibility-spending/
Wang, F. (2012) ‘Why police and policing need GIS: an overview’, Annals of GIS 18 (3): 159–171.
SKK Migas (2015) Penyederhanaan Perizinan untuk Kegiatan Usaha Hulu Migas. Internal Report. Jakarta: SKK Migas.
The Straits Times (2019) ‘Jokowi planning to cut red tape to attract investments’, The Straits Times, September. https://www.straitstimes.com/asia/se-asia/jokowi-planning-to-cut-red-tape-to-attract-investments
Transparency International (2019) ‘Corruption statistics’. General corruption statistics. Berlin: Transparency International. https://www.transparency.org.uk/corruption/corruption-statistics/
UNCTAD (United Nations Conference on Trade and Development) (2012) ‘Extractive industries: optimizing value retention in host countries’. UNCTAD XIII, Qatar.
University of California (2020) Data visualization with Tableau specialization. Coursera. https://www.coursera.org/specializations/data-visualization
US DoJ (United States Department of Justice) (2009) ‘Chevron to pay U.S. more than $45 million to resolve allegations of false claims for royalties underpayment’. US Department of Justice press release, 23 December. https://www.justice.gov/opa/pr/chevron-pay-us-more-45-million-resolve-allegations-false-claims-royalties-underpayment
US DoJ (2010) ‘Mobil oil companies to pay U.S. $32.2 million to resolve allegations of underpayment of royalties from American Indian and Federal Lands’. US Department of Justice press release, 5 April. https://www.justice.gov/opa/pr/mobil-oil-companies-pay-us-322-million-resolve-allegations-underpayment-royalties-american
Verhelst, F. (2012) Integrated Operations in the High North, Joint Industry Project. Final Report. Bærum, Norway: IOHN.
Volkov, M. (2016) ‘Corruption risks and corporate social responsibility spending’, Corruption, Crime & Compliance, 22 May. https://blog.volkovlaw.com/2016/05/corruption-risks-corporate-social-responsibility-spending/
Wang, F. (2012) ‘Why police and policing need GIS: an overview’, Annals of GIS 18 (3): 159–171.US DoJ (2010) ‘Mobil oil companies to pay U.S. $32.2 million to resolve allegations of underpayment of royalties from American Indian and Federal Lands’. US Department of Justice press release, 5 April. https://www.justice.gov/opa/pr/mobil-oil-companies-pay-us-322-million-resolve-allegations-underpayment-royalties-american
Verhelst, F. (2012) Integrated Operations in the High North, Joint Industry Project. Final Report. Bærum, Norway: IOHN.

Mapping corruption risk in Indonesia’s upstream oil and gas industry
46
Volkov, M. (2016) ‘Corruption risks and corporate social responsibility spending’, Corruption, Crime & Compliance, 22 May. https://blog.volkovlaw.com/2016/05/corruption-risks-corporate-social-responsibility-spending/
Wang, F. (2012) ‘Why police and policing need GIS: an overview’, Annals of GIS 18 (3): 159–171.

Mapping corruption risk in Indonesia’s upstream oil and gas industry
47
Appendix A: Methods of analysis
Financial value chain analysis
Financial value chain analysis shows the financial position of a VC and its stages, and
compares the stages during a selected observation period (Lind et al., 2012). It also reveals the effects of the financial performance of each stage on the rest of the value chain. This is a systematic method to analyse value chains. The financial value chain analysis consists of seven steps:
Figure A 1: Financial value chain analysis
Source: Lind et al. (2012).
A hypothetical simplified example can be used to demonstrate how this method is relevant
for the corruption risk analysis:
1 Choose industry: upstream private-sector oil and gas industry in an example country X which has eleven contractors.
2 Define value chain: two upstream primary activities (only production and lifting) and one
supporting activity (human resources).
3 Define key financial figures: the key figures were taken from a simplified WP&B.
4 Collect data: the simplified WP&B data was generated for only one year (Table A 1).
5 Calculate values of key financial figures: the calculation process in this example uses the same two methods, namely financial mapping and DEA (see next section on DEA).
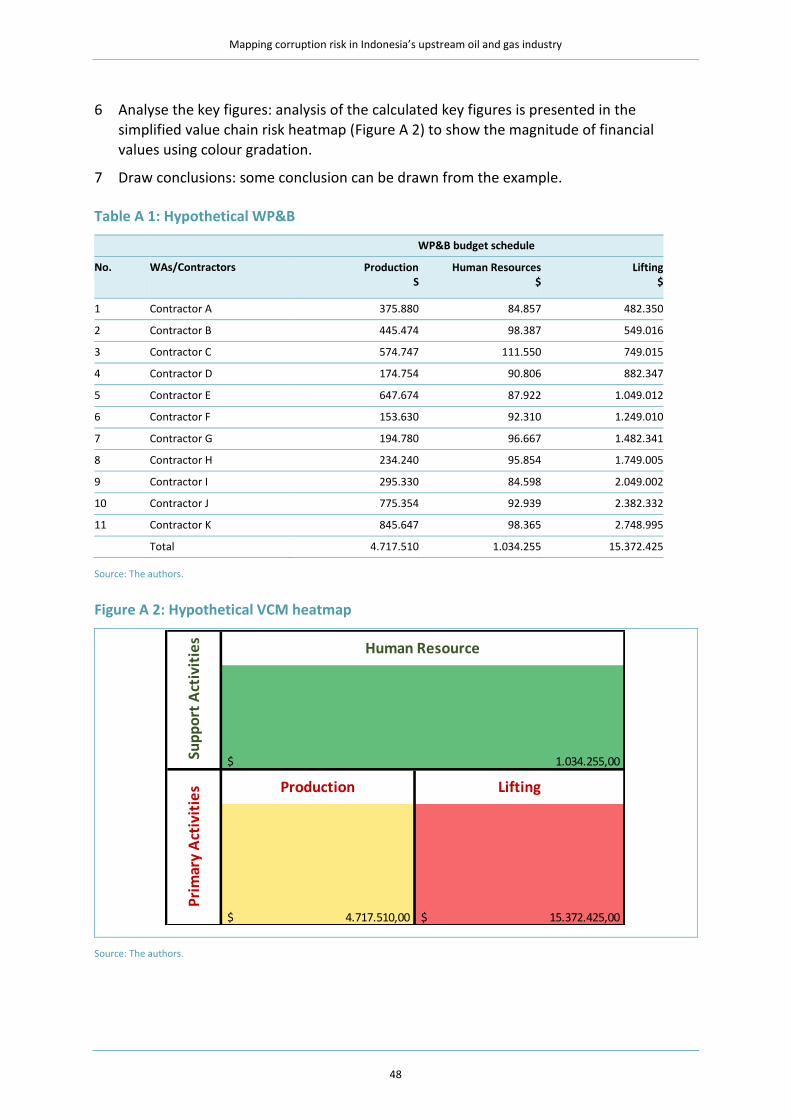
Mapping corruption risk in Indonesia’s upstream oil and gas industry
48
6 Analyse the key figures: analysis of the calculated key figures is presented in the
simplified value chain risk heatmap (Figure A 2) to show the magnitude of financial values using colour gradation.
7 Draw conclusions: some conclusion can be drawn from the example.
Table A 1: Hypothetical WP&B
WP&B budget schedule
No. WAs/Contractors Production S
Human Resources $
Lifting $
1 Contractor A 375.880 84.857 482.350
2 Contractor B 445.474 98.387 549.016
3 Contractor C 574.747 111.550 749.015
4 Contractor D 174.754 90.806 882.347
5 Contractor E 647.674 87.922 1.049.012
6 Contractor F 153.630 92.310 1.249.010
7 Contractor G 194.780 96.667 1.482.341
8 Contractor H 234.240 95.854 1.749.005
9 Contractor I 295.330 84.598 2.049.002
10 Contractor J 775.354 92.939 2.382.332
11 Contractor K 845.647 98.365 2.748.995
Total 4.717.510 1.034.255 15.372.425
Source: The authors.
Figure A 2: Hypothetical VCM heatmap
Source: The authors.
Lifting
4.717.510,00$ 15.372.425,00$
Human Resource
1.034.255,00$
Pri
mar
y A
ctiv
itie
sSu
pp
ort
Act
ivit
ies
Production

Mapping corruption risk in Indonesia’s upstream oil and gas industry
49
Data Envelopment Analysis (DEA)
DEA is a linear programming-based technique that converts multiple input and output
measures into a single comprehensive measure of productivity efficiency (Epstein and Henderson, 1989). DEA provides a measure by which one firm or department can compare its performance, in relative terms, to other homogeneous firms or departments. Originally, DEA was developed to evaluate efficiencies in non-profit institutions (Ahn et al., 1989).
DEA calculates a single efficiency measure of production and performance, relative to
‘decision making units’ (DMUs) (e.g. firms), when there are multiple inputs and outputs across different stages of the value chain (Mansoury et al., 2013). Each activity within a VC is given different weights for its inputs and outputs to calculate a composite efficiency score for each functional unit (Sexton, 1986). This allows each unit to take advantage of its own
unique area of specialisation.
A DEA score can be calculated using two models. The first model is the Constant Return to
Scale (CRS) approach developed by Charnes, Cooper and Rhodes (the ‘CCR model’) in 1978. This model assumes that the ratio between the addition of input and output is the same (a constant return to scale). The second model is the Variable Return to Scale (VRS) approach that was developed by Banker, Charnes and Cooper (the ‘BCC model’) in 1984 as an extension of the CCR model. The BCC model assumes that a firm (a DMU) does not or has not yet operated at an optimal scale and that the ratio between the addition of input and output is not the same (a variable return to scale).
Using the hypothetical simplified example from Table A 1, the DEA analysis indicates that 5
out of 11 contractors are efficient at managing their production and human resources costs
to achieve the lifting (Figure A 3) (i.e. they score 1).
Figure A 3: Hypothetical Contractor efficiency
Source: The authors.
0
0.2
0.4
0.6
0.8
1
1.2
DEA-efficiency

Mapping corruption risk in Indonesia’s upstream oil and gas industry
50
Benford’s Law
The Law of Anomalous Number (Benford, 1938) marks the emergence of an analysis method
known as Benford’s Law. Based on observations of logarithm tables, Benford noted that some numbers were more often used than others, and digit tests were applied to assess overall conformity, to detect obvious anomalies and to identify clear deviations that need to be investigated further (Nigrini, 2012). Since number 1 most frequently appears as the first digit in information progressions and subsequent numbers less frequently, powerful deviations from the anticipated frequencies or anomalies shows that the information may be suspect or manipulated (i.e. there is a risk of corruption). See Table A 2 for Benford’s Law distribution.
Table A 2: Benford’s Law distribution
Digit Benford’s Law distribution
1 30.10%
2 17.61%
3 12.49%
4 9.69%
5 7.92%
6 6.69%
7 5.8%
8 5.12%
9 4.58%
Source: Benford (1938).
The natural distribution of numbers shown in Table A 2 indicates that digit ‘1’ is likely to
appear much more often than digit ‘9’.
The five-digit tests developed by Nigrini (2012) are described in detail below. They are listed
in the order in which they would normally be performed.
1 The first-digit test
2 The second-digit test
3 The first-two-digits test
4 The first-three-digits test
5 The last-two-digits test
The first- and second-digit tests are high-level tests of reasonableness and are used to
determine whether the data set appears reasonable. If the first- and second-digit tests indicate that the data set is significantly different from Benford’s Law, the first-two-digits test and the first-three-digits test will be performed to select audit targets. The last-two-digits test is used to detect rounding. This research applies the first- and second-digit test to the WP&B data.
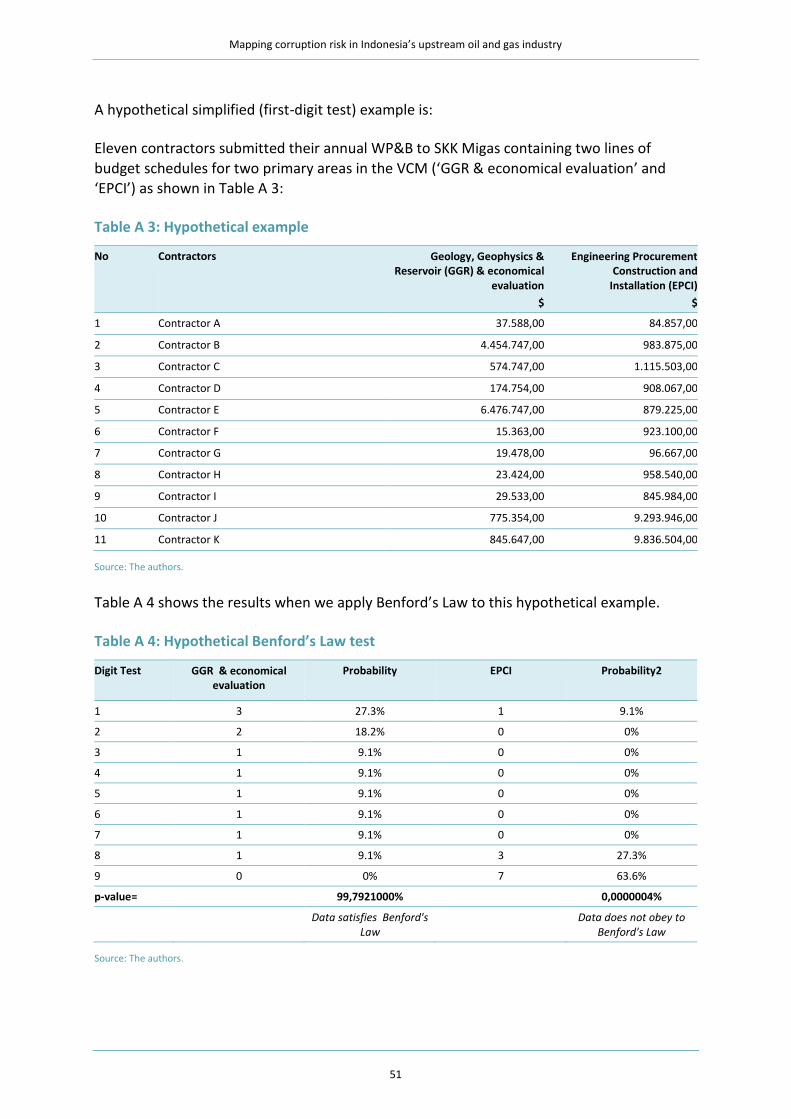
Mapping corruption risk in Indonesia’s upstream oil and gas industry
51
A hypothetical simplified (first-digit test) example is:
Eleven contractors submitted their annual WP&B to SKK Migas containing two lines of
budget schedules for two primary areas in the VCM (‘GGR & economical evaluation’ and ‘EPCI’) as shown in Table A 3:
Table A 3: Hypothetical example
No Contractors Geology, Geophysics & Reservoir (GGR) & economical
evaluation
$
Engineering Procurement Construction and
Installation (EPCI)
$
1 Contractor A 37.588,00 84.857,00
2 Contractor B 4.454.747,00 983.875,00
3 Contractor C 574.747,00 1.115.503,00
4 Contractor D 174.754,00 908.067,00
5 Contractor E 6.476.747,00 879.225,00
6 Contractor F 15.363,00 923.100,00
7 Contractor G 19.478,00 96.667,00
8 Contractor H 23.424,00 958.540,00
9 Contractor I 29.533,00 845.984,00
10 Contractor J 775.354,00 9.293.946,00
11 Contractor K 845.647,00 9.836.504,00
Source: The authors.
Table A 4 shows the results when we apply Benford’s Law to this hypothetical example.
Table A 4: Hypothetical Benford’s Law test
Digit Test GGR & economical evaluation
Probability EPCI Probability2
1 3 27.3% 1 9.1%
2 2 18.2% 0 0%
3 1 9.1% 0 0%
4 1 9.1% 0 0%
5 1 9.1% 0 0%
6 1 9.1% 0 0%
7 1 9.1% 0 0%
8 1 9.1% 3 27.3%
9 0 0% 7 63.6%
p-value= 99,7921000% 0,0000004%
Data satisfies Benford's Law
Data does not obey to Benford's Law
Source: The authors.

Mapping corruption risk in Indonesia’s upstream oil and gas industry
52
The above test indicates the submitted budget for the EPCI needs attention and further
investigation/testing. The deviation/conformance found can be mapped to the VCRM using a colour gradation to generate a heat map (.i.e. EPCI would be red and ‘GGR & economical evaluation’ would be green).
House of Risk (HoR)
The House of Risk (HoR) is a proactive supply chain risk management model that identifies
risk agents and risk events (Pujawan and Geraldin, 2009). Reducing the occurrence of a risk agent18 typically prevents some risk events. For example, problems in a supplier production system could result in a shortage of spare parts and an increase in unplanned shutdown time as a result of having to switch procurement to other, less capable, suppliers.
In the well-known Failure Mode and Effects Analysis (FMEA), a risk assessment is conducted through calculation of a Risk Priority Number (RPN) as a product of three factors, i.e. probability of occurrence, severity of impacts, and detection (Atlantis Engineering SA, 2019) .
Unlike in the FMEA model where both the probability of an occurrence and the degree of severity are associated with the risk events, in this study we assigned the probability to the risk agent and the severity to the risk event.
The adapted HoR model is implemented as follows:
House or Risk Phase 1:
1 Risk event identification (Ei) and risk agent (Aj) which are areas in VCRM that should be given priority.
2 Calculation of occurrence and severity of variables Ei and Aj
3 If Oj is the probability of the occurrence of the risk agent while Si is the severity of the impact of the risk event occurred and Rij is the correlation between risk agent j and risk event i (which is interpreted as the possibility of risk agent j being derived from several risk agents i)
4 Then the next potential risk value or ARP (aggregate risk potential of risk agent j) can be calculated as follows:
𝐴𝑅𝑃𝑗 = 𝑂𝑗 ∑ 𝑆𝑖𝑅𝑖𝑗𝑖
5 Prioritising the risk agents by sorting the ARP.
6 Because the HoR method is carried out for risk analysis on the value chain risk map for
the prevention of corruption, the risk event is taken from the risk classification based on the entire analysis in this research
18
Defined in HoR as the root cause that has triggered the risk event.

Mapping corruption risk in Indonesia’s upstream oil and gas industry
53
1. Value chain financial analysis: WP&B and DEA.
2. Value chain private-sector analysis: Value chain private-sector analysis.
3. Value chain corruption risk analysis: Benford analysis, RTA compliance audit analysis, BPK compliance analysis, analysis of criminal justice cases and PPATK suspicious transactions analysis.
A simplified hypothetical example of how HoR has been adapted and used in this research
would be:
1 Risk agents are areas in the VCRM that should be given priority to be treated, in this example three areas in the primary activity and two areas in the supporting activity were chosen:
1. Primary activity: EPCI, GGR & economical evaluation, Production and Lifting
2. Supporting activity: Human Resource and Formalities
2 Risk events are all risk events acquired/revealed by following hypothetical analyses:
1. Financial analysis: the risks were taken from the hypothetical example explained earlier.
2. DEA: the risks were taken from the hypothetical example explained earlier.
3. Benford analysis: the risks were taken from the hypothetical example explained earlier.
4. The results of the anti-corruption compliance audit reveal strong evidence that indicate corruption risk events occur in all supporting activities (Human Resources and Formalities) but weak evidence in primary activities and no evidence in the GGR
& economical evaluation which requires very deep specific technical knowledge.
5. The BKK audit shows strong evidence that corruption risks appear in the Human Resources area of the VC and some evidence in the Formalities area among supporting activities. In the primary activities strong evidence was found for Lifting, moderate risks were found for EPCI and again no evidence was found for GGR & economical evaluation.
6. The analysis of criminal justice cases assumed strong corruption-related evidence for EPCI and Formalities and some evidence in the Production area, weak evidence in Lifting and Human Resources and no evidence in the GGR & economical evaluation area.
3 The results of the HoR1 analysis enable the priority areas to be ranked and treated as
corruption risks (shown in Table A 5 and Table A 6). The ARP values can be mapped to the VCRM as a heat map with colour gradation.

Mapping corruption risk in Indonesia’s upstream oil and gas industry
54
Table A 5: Hypothetical HoR1 for primary activities
Source: The authors.
Table A 6: Hypothetical HoR1 for supporting activities
Source: The authors.
Severity
*Qualit
y o
f E
vid
ence
EPC
I
GG
R &
eco
no
mic
al e
valu
atio
n
Pro
du
ctio
n
Lift
ing
1 3 9
1
2 9 1
4 1 1 1
5 3 1 9
9 9 3 1
4 1 4 4
472 2 156 268
1 4 3 2Priority rank of agent j
occurrence of risk agent j ,
Aggregate risk potential of risk agent j (ARPj )
Law Enforcement/Judiciary
Risk Event(Ej) Risk Agent(Apj )
WP&B
Financial analysis
DEA
Benford analysis
Evidence
Anti Corruption Compliance Audit result
Supreme Audit result
Severity
*Qualit
y o
f
Evid
ence
Hum
an R
esourc
e
Form
alit
y
1 3
1
2
4 9 9
5 9 3
9 1 9
4 3
372 396
2 1
Aggregate risk potential of risk agent j (ARPj )
Priority rank of agent j
Financial analysis
DEA
Benford analysis
Anti Corruption Compliance Audit result
Supreme Audit result
Risk Event(Ej) Risk Agent(Apj )
WP&B
Evidence
occurrence of risk agent j ,
Law Enforcement/Judiciary

Mapping corruption risk in Indonesia’s upstream oil and gas industry
55
HoR2:
1 The HoR2 can be used by stakeholders in the industry to prioritise corruption mitigation actions against the activities that are regarded as having high aggregate risk. In this research, ten risk agents were selected that contribute to about 75% of the total ARP from each support and primary activity. Table 3 in the main report ranks eight preventive or mitigation actions based on the HoR2 analysis.
2 Ideally the proposed preventative or mitigating actions should also be discussed with all relevant stakeholders (industry players, regulators, auditors and law enforcement agencies). In this research we consider mostly existing actions that are currently in place or that are being considered by the government (regulators) and law enforcement agencies, and propose some enhancements and benchmarks.
3 All weighting, scaling and scoring used in the HoR1 and HoR2 analyses follow the original
HoR model. The difficulty of performing each action is classified into three categories: low with a score of 3, middle with a score of 4, and high with a score of 5. As mentioned above, the level of difficulty must also reflect available resources and the involvement of other stakeholders to take appropriate action. Therefore, the ratio shows the cost-effectiveness of each action. However, we must point out that the use of different scales in measuring difficulty levels can result in changes to ranking, which indicates the need to conduct a sensitivity analysis when applying this framework to any cases.
For illustrative purposes we provide a simplified hypothetical example of how HoR2 has
been adapted and used in this research:
1 Top-two ranked areas from primary activity (EPCI and Lifting) and two areas from supporting activity (Human Resources and Formalities) are used in this example.
2 Four preventive actions selected from this research are used, analysed and assumed as follows: Implementation of SNI ISO 37001:2016 Anti-Bribery Management System (ABMS); preventive collaborative work; red-tape reduction policy; and integrated operational, knowledge-based engineering and master data. The assumed results are shown in Table A 7 and Table A 8.
3 The ranked preventive/mitigation actions are summarised in Table A 9.
Table A 7: Hypothetical HoR2 analysis – primary activity
Source: The authors.
Implementation of SNI ISO
37001:2016 Anti-Bribery
Management System (ABMS)
Preventive collaborative
work
Red-tape
reduction policy
Integrated operational,
knowledge-based engineering
and master data
3 3 1 9 472
1 3 1 3 268
1684 2220 740 5052
3,0 4,0 3,0 5,0
561,3 555 246,7 1010,4
2 3 4 1
Total Effectiveness of Proactive Actions k (Tek )
Difficulty of Performing action k (Dk )
Effectiveness to difficulty ration of action k (ETDk )
Rank of Proactive action k (Rk)
To be treated risk agent (Aj)
Preventive/Mitigation Action (PAk)
ARP j
EPCI
Lifting
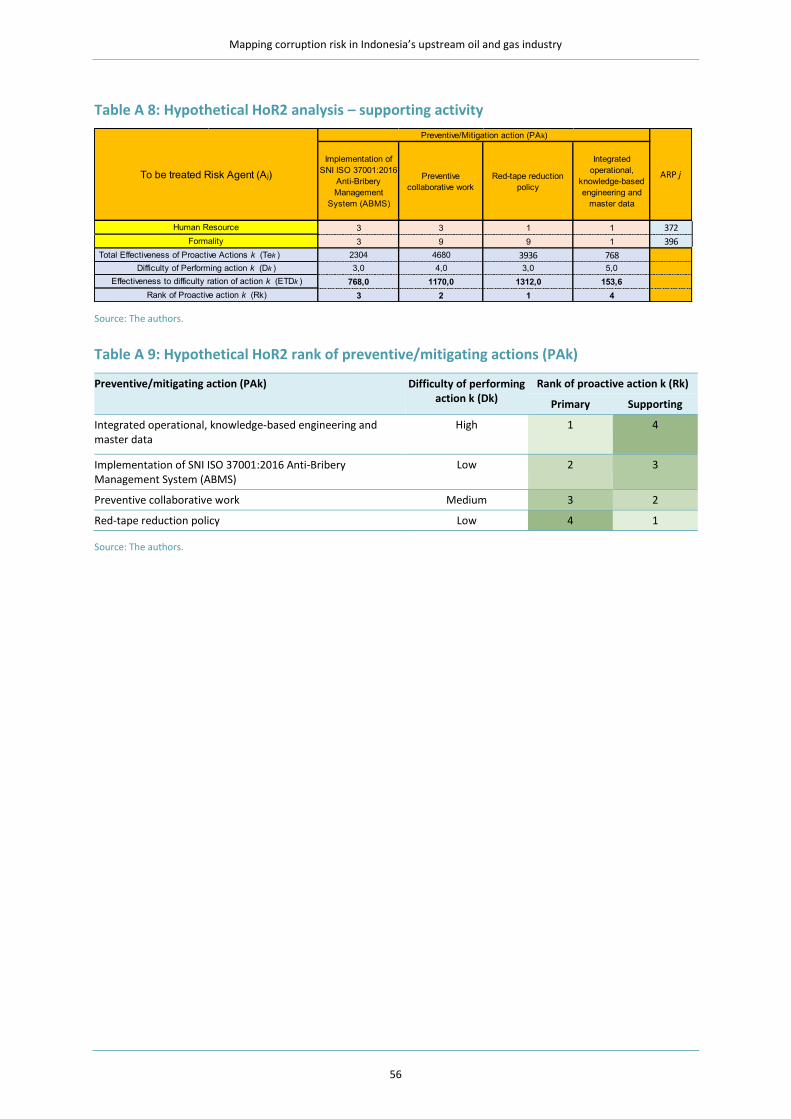
Mapping corruption risk in Indonesia’s upstream oil and gas industry
56
Table A 8: Hypothetical HoR2 analysis – supporting activity
Source: The authors.
Table A 9: Hypothetical HoR2 rank of preventive/mitigating actions (PAk)
Preventive/mitigating action (PAk) Difficulty of performing action k (Dk)
Rank of proactive action k (Rk)
Primary Supporting
Integrated operational, knowledge-based engineering and master data
High 1 4
Implementation of SNI ISO 37001:2016 Anti-Bribery Management System (ABMS)
Low 2 3
Preventive collaborative work Medium 3 2
Red-tape reduction policy Low 4 1
Source: The authors.
Implementation of
SNI ISO 37001:2016
Anti-Bribery
Management
System (ABMS)
Preventive
collaborative work
Red-tape reduction
policy
Integrated
operational,
knowledge-based
engineering and
master data
3 3 1 1 372
3 9 9 1 396
2304 4680 3936 768
3,0 4,0 3,0 5,0
768,0 1170,0 1312,0 153,6
3 2 1 4Rank of Proactive action k (Rk)
To be treated Risk Agent (Aj)
Human Resource
Formality
Difficulty of Performing action k (Dk )
Total Effectiveness of Proactive Actions k (Tek )
Preventive/Mitigation action (PAk)
ARP j
Effectiveness to difficulty ration of action k (ETDk )
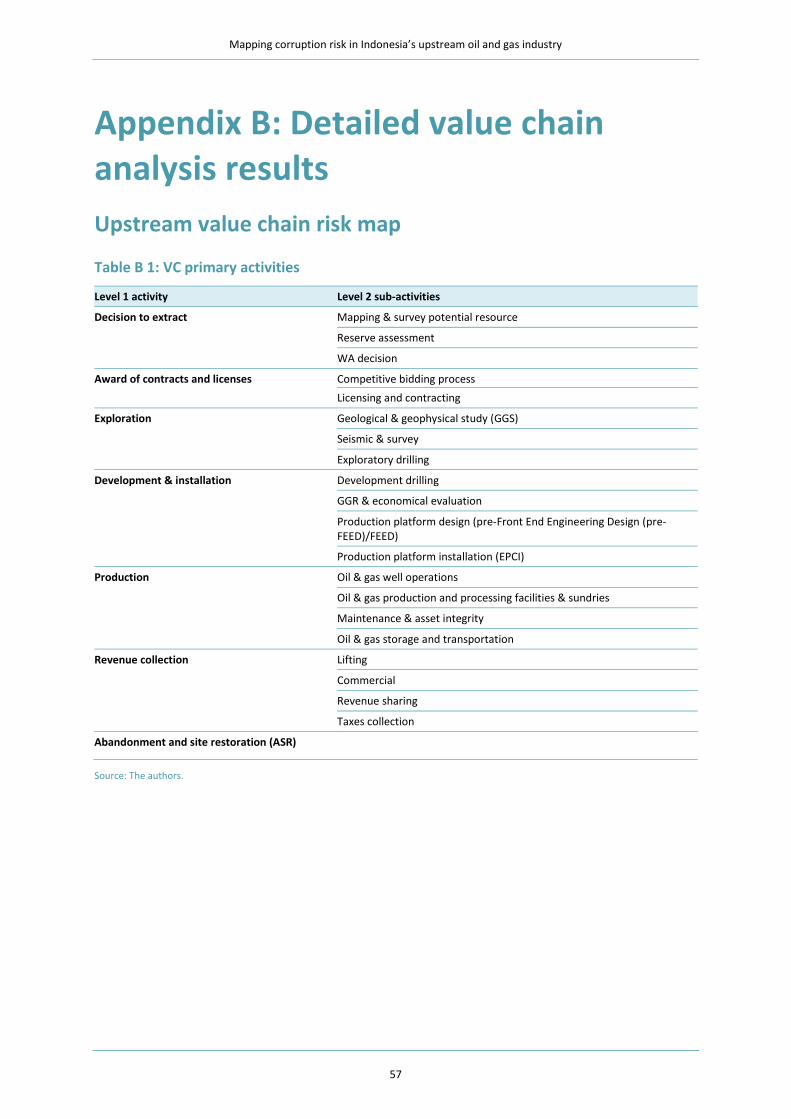
Mapping corruption risk in Indonesia’s upstream oil and gas industry
57
Appendix B: Detailed value chain analysis results
Upstream value chain risk map
Table B 1: VC primary activities
Level 1 activity Level 2 sub-activities
Decision to extract Mapping & survey potential resource
Reserve assessment
WA decision
Award of contracts and licenses Competitive bidding process
Licensing and contracting
Exploration Geological & geophysical study (GGS)
Seismic & survey
Exploratory drilling
Development & installation Development drilling
GGR & economical evaluation
Production platform design (pre-Front End Engineering Design (pre-FEED)/FEED)
Production platform installation (EPCI)
Production Oil & gas well operations
Oil & gas production and processing facilities & sundries
Maintenance & asset integrity
Oil & gas storage and transportation
Revenue collection Lifting
Commercial
Revenue sharing
Taxes collection
Abandonment and site restoration (ASR)
Source: The authors.

Mapping corruption risk in Indonesia’s upstream oil and gas industry
58
Table B 2: VC support activities
Level 1 activities Level 2 sub-activities
Human resources Personnel expenses
Supervision
Finance Business insurance
Depreciation
Audit services
Finance & tax services
Administration Office expenses
Public relations & community projects
(Procurement of) material services
Technology platform IT & data management (computerisation)
Communication
Regulatory fulfilment Formalities
Legal services
Compliance audit
Technical support services Engineering services
Security
Health safety & environment (HSE)
Transportation
Source: The authors.
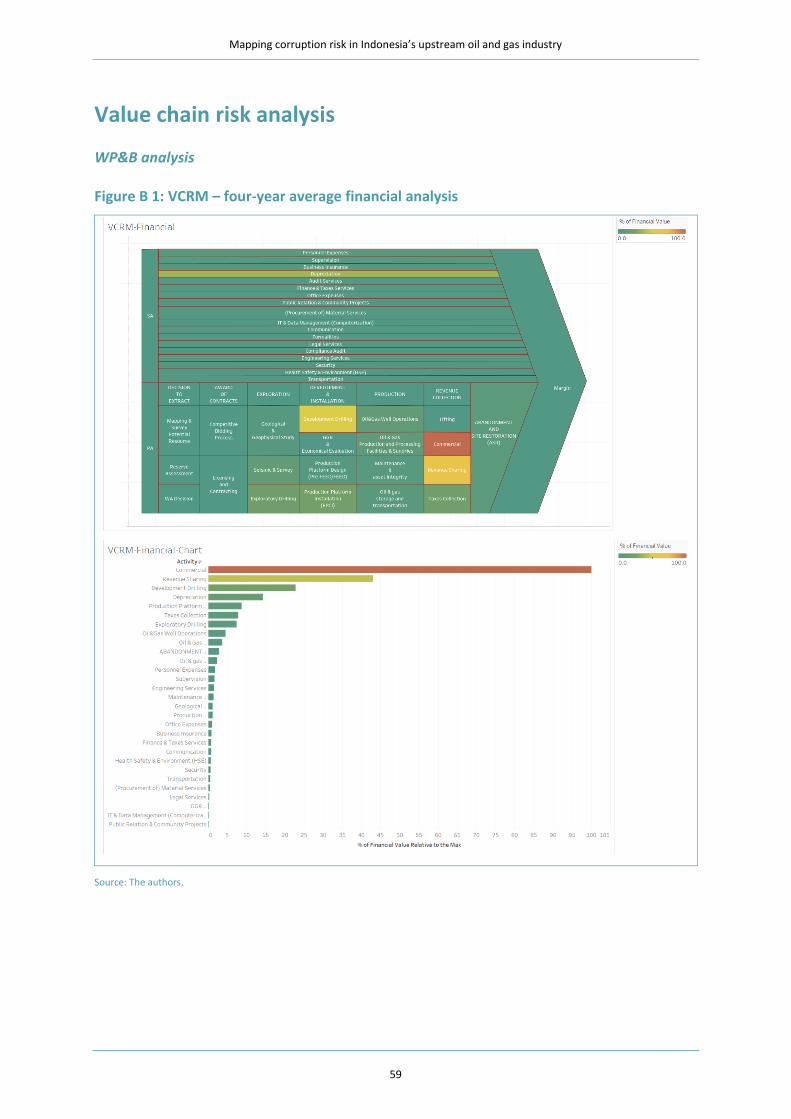
Mapping corruption risk in Indonesia’s upstream oil and gas industry
59
Value chain risk analysis
WP&B analysis
Figure B 1: VCRM – four-year average financial analysis
Source: The authors.
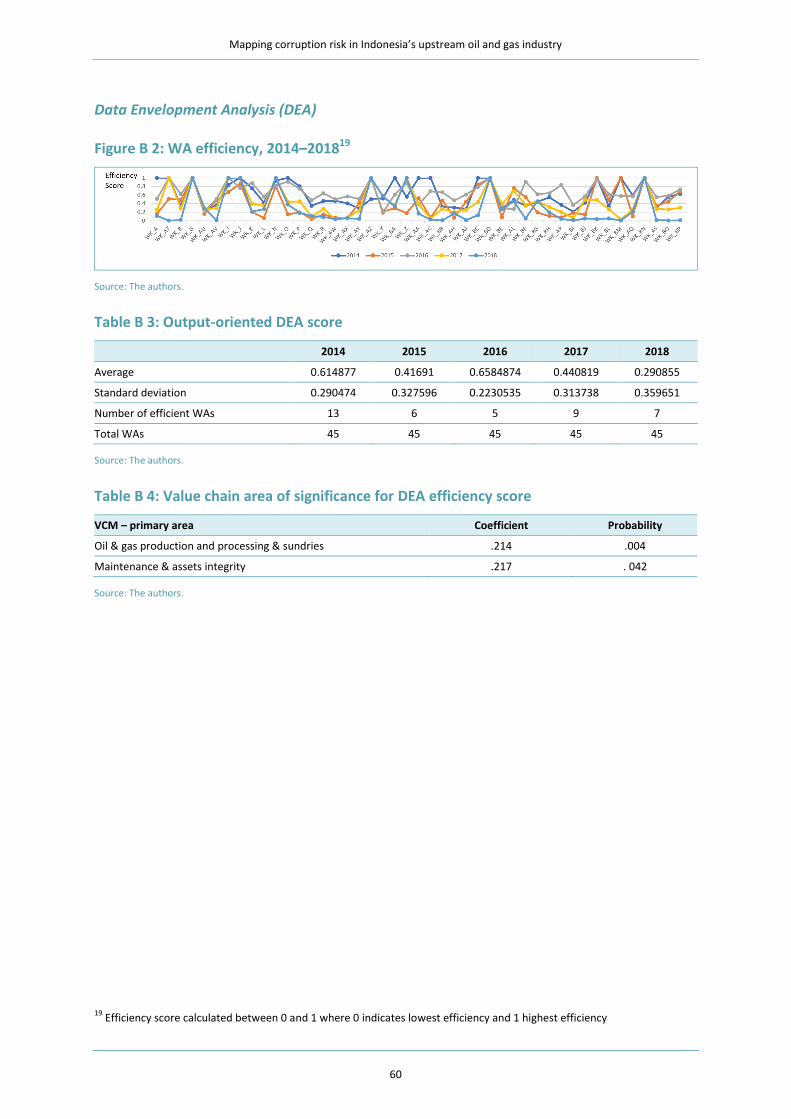
Mapping corruption risk in Indonesia’s upstream oil and gas industry
60
Data Envelopment Analysis (DEA)
Figure B 2: WA efficiency, 2014–201819
Source: The authors.
Table B 3: Output-oriented DEA score
2014 2015 2016 2017 2018
Average 0.614877 0.41691 0.6584874 0.440819 0.290855
Standard deviation 0.290474 0.327596 0.2230535 0.313738 0.359651
Number of efficient WAs 13 6 5 9 7
Total WAs 45 45 45 45 45
Source: The authors.
Table B 4: Value chain area of significance for DEA efficiency score
VCM – primary area Coefficient Probability
Oil & gas production and processing & sundries .214 .004
Maintenance & assets integrity .217 . 042
Source: The authors.
19
Efficiency score calculated between 0 and 1 where 0 indicates lowest efficiency and 1 highest efficiency

Mapping corruption risk in Indonesia’s upstream oil and gas industry
61
Distribution analysis of vendors
Figure B 3: Distribution of vendors20
Source: The authors.
20
More dense population of vendor could increase risk of corruption due to the lack of competition
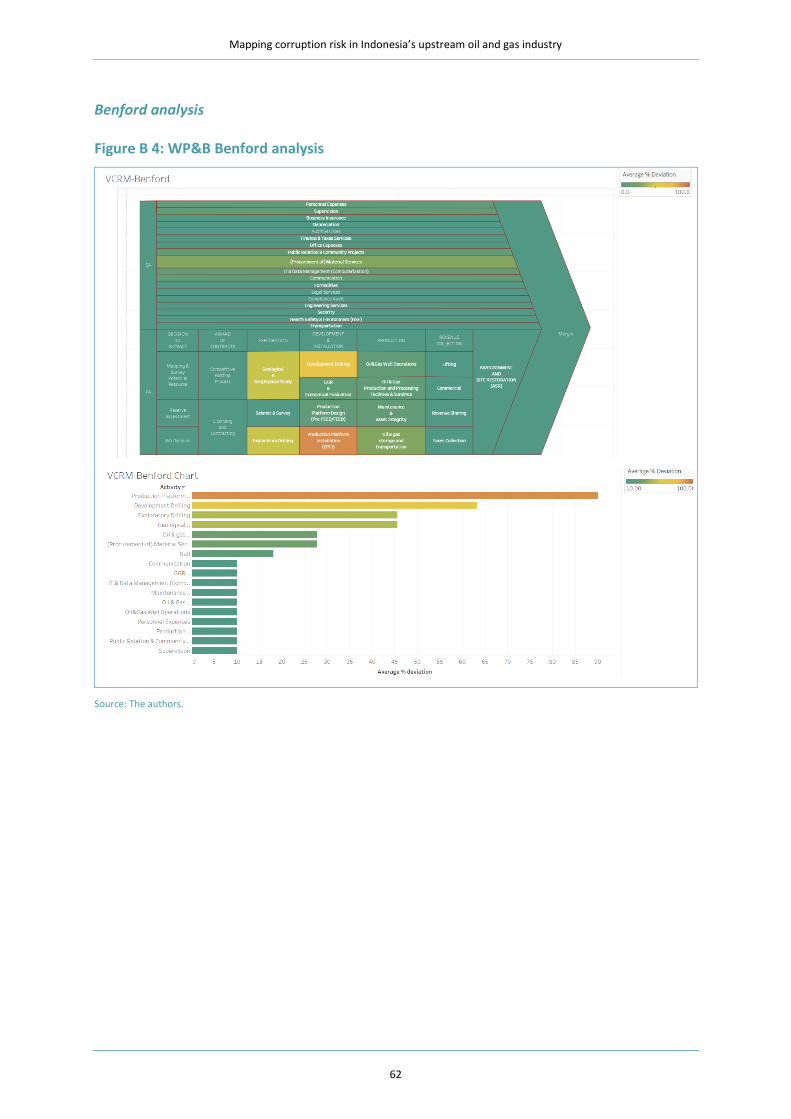
Mapping corruption risk in Indonesia’s upstream oil and gas industry
62
Benford analysis
Figure B 4: WP&B Benford analysis
Source: The authors.
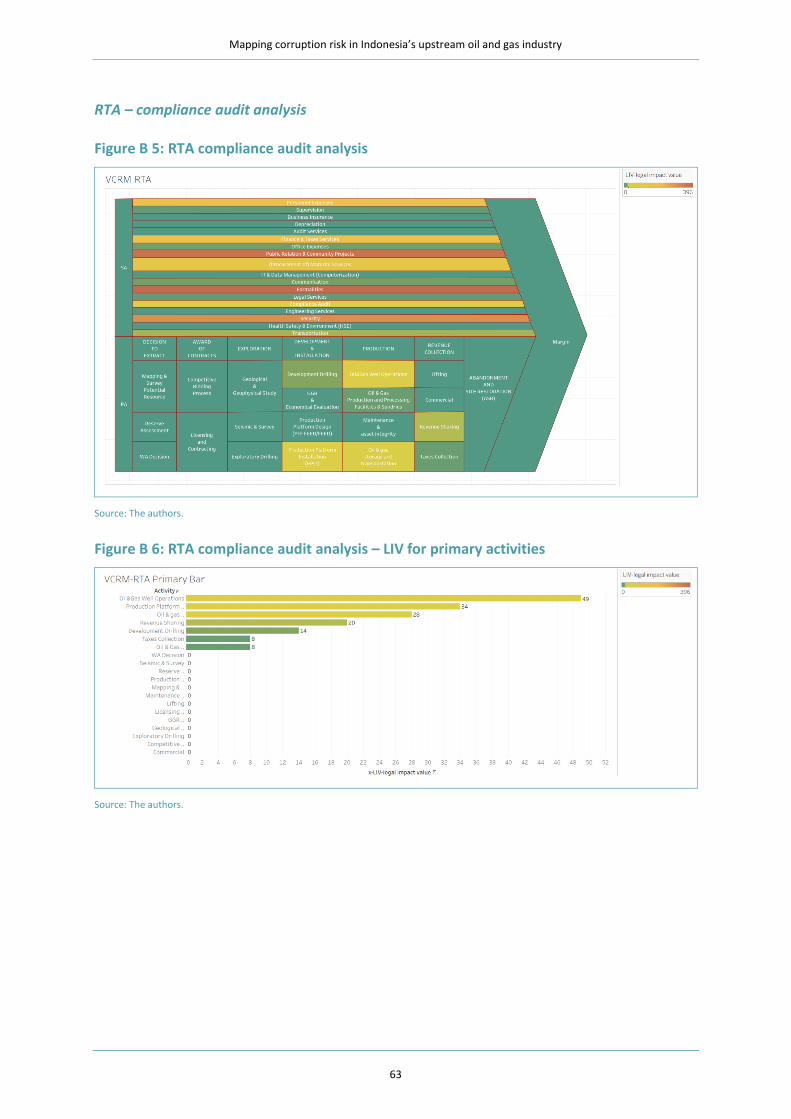
Mapping corruption risk in Indonesia’s upstream oil and gas industry
63
RTA – compliance audit analysis
Figure B 5: RTA compliance audit analysis
Source: The authors.
Figure B 6: RTA compliance audit analysis – LIV for primary activities
Source: The authors.

Mapping corruption risk in Indonesia’s upstream oil and gas industry
64
Figure B 7: RTA compliance audit analysis – LIV for supporting activities
Source: The authors.
Table B 5: Most common level-2 findings in RTA audit of supporting areas
No. Level-2 supporting area Freq.
1 Formalities 130
2 Public relations & community projects 100
3 Security 85
4 (Procurement of) material service 55
5 Finance and tax services 47
Source: The authors.
Table B 6: Most common level-2 LIV findings in RTA audit of supporting areas
No. Level-2 supporting area LIV
1 Formalities 396
2 Public relations & community projects 377
3 Security 313
4 Personal expenses 154
5 Finance and tax services 153
Source: The authors.
Table B 7: Most common level-2 findings in RTA audit of primary areas
No. Level-2 primary area Freq.
1 Oil & gas well operations 17
2 Production platform installation (EPCI) 13
3 Development drilling 6
4 Oil & gas storage and transportation 6
5 Revenue sharing 5
Source: The authors.

Mapping corruption risk in Indonesia’s upstream oil and gas industry
65
Table B 8: Most common level-2 LIV findings in RTA audit of primary areas
No. Level-2 primary area LIV
1 Oil & gas well operations 49
2 Production platform installation (EPCI) 34
3 Oil & gas storage and transportation 28
4 Revenue sharing 20
5 Development drilling 14
Source: The authors.
Table B 9: RTA audit – no finding
No. Level-2 supporting area Level-2 primary area
1 Business Insurance Mapping & survey potential resource
2 Depreciation Reserve assessment
3 Audit service WA decision
4 IT & data management (computerisation) Competitive bidding process
5 Engineering services Licensing & contracting
6 Geological & geophysical study
7 Seismic & survey
8 Exploratory drilling
9 GGR & economical evaluation
10 Production platform design (Pre-FEED/FEED)
11 Maintenance & asset integrity
12 Lifting
13 Commercial
14 Abandonment and site restoration (ASR)
Source: The authors.
6.1.1. BPK – compliance audit analysis
Figure B 8: BPK financial impact – compliance audit analysis
Source: The authors.

Mapping corruption risk in Indonesia’s upstream oil and gas industry
66
Figure B 9: BPK financial impact – FIV for primary activities
Figure B 10: BPK financial impact – FIV for supporting activities
Source: The authors.
Figure B 11: BPK legal impact – compliance audit analysis

Mapping corruption risk in Indonesia’s upstream oil and gas industry
67
Figure B 12: BPK legal impact – compliance audit analysis of primary areas
Figure B 13: BPK legal impact – compliance audit analysis of supporting areas
Source: The authors.
Table B 10: Calculation of BPK's financial impact
Calculation analysis
max value $ 592,933,880
5 score level $ 118,586,776
Level Range value Score
LEVEL 1 $ 1 - $ 118,586,776 1
LEVEL 2 $ 118,586,777 - $ 237,173,552 2
LEVEL 3 $ 237,173,553 - $ 355,760,328 3
LEVEL 4 $ 355,760,329 - $ 474,347,104 4
LEVEL 5 $ 474,347,105 - $ 592,933,880 5
Source: The authors.

Mapping corruption risk in Indonesia’s upstream oil and gas industry
68
Table B 11: Most common BPK level-2 findings in supporting areas
No. Level-2 supporting area Freq.
1 (Procurement of) material service 15
2 Personal expense 10
3 Finance and tax services 7
4 Health, safety & environment (HSE) 5
5 Transportation 3
Source: The authors.
Table B 12: Most common BPK level-2 findings in primary areas
No. Level-2 primary area Freq.
1 Revenue sharing 15
2 Taxes collection 9
3 Production platform installation (EPCI) 5
4 Maintenance & asset integrity 3
5 Abandonment and site restoration (ASR) 3
Source: The authors.
Table B 13: Most common level-2 offences in primary areas
No. Level-2 primary area Freq.
1 Commercial 18
2 Exploratory drilling 9
3 Production platform installation (EPCI) 4
4 Revenue sharing 4
5 Oil & gas storage and transportation 2
Source: The authors.
Analysis of criminal justice cases
Figure B 14: Legal impact of criminal justice cases
Source: The authors.
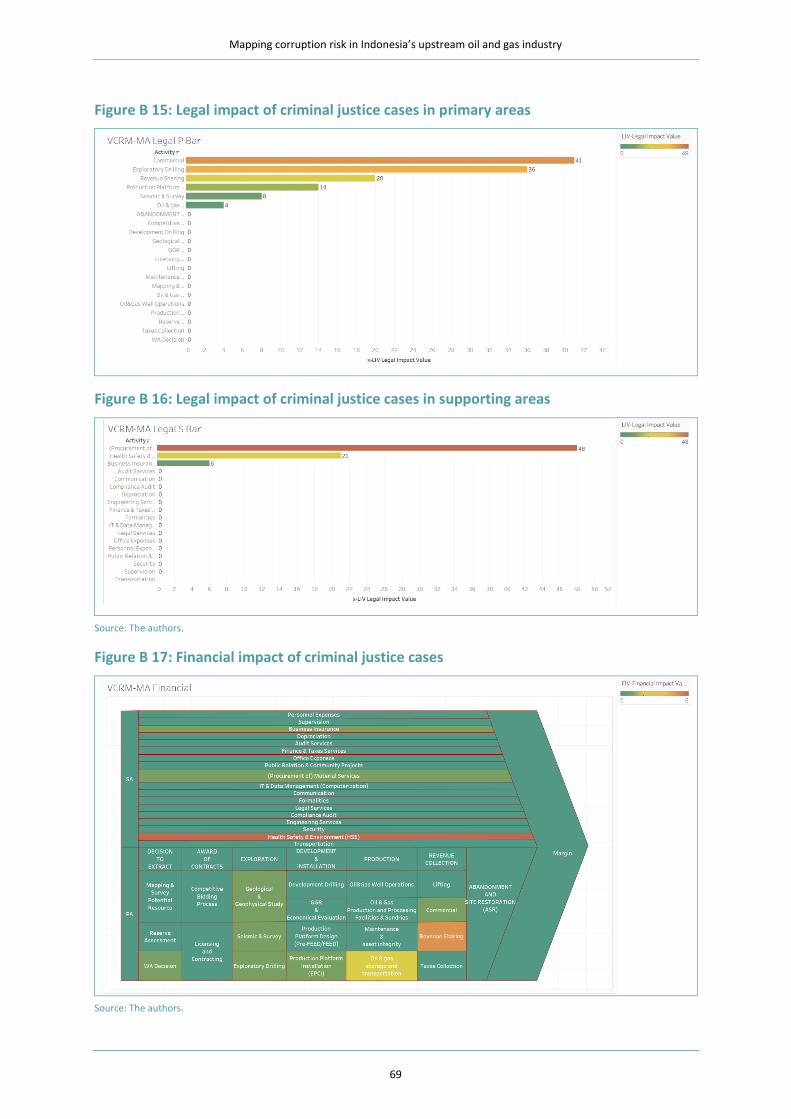
Mapping corruption risk in Indonesia’s upstream oil and gas industry
69
Figure B 15: Legal impact of criminal justice cases in primary areas
Figure B 16: Legal impact of criminal justice cases in supporting areas
Source: The authors.
Figure B 17: Financial impact of criminal justice cases
Source: The authors.

Mapping corruption risk in Indonesia’s upstream oil and gas industry
70
Figure B 18: Financial impact of criminal justice cases in primary areas
Source: The authors.
Figure B 19: Financial impact of criminal justice cases in supporting areas
Source: The authors.
PPATK suspicious transactions analysis
Figure B 20: Suspicious transactions analysis
Source: The authors.
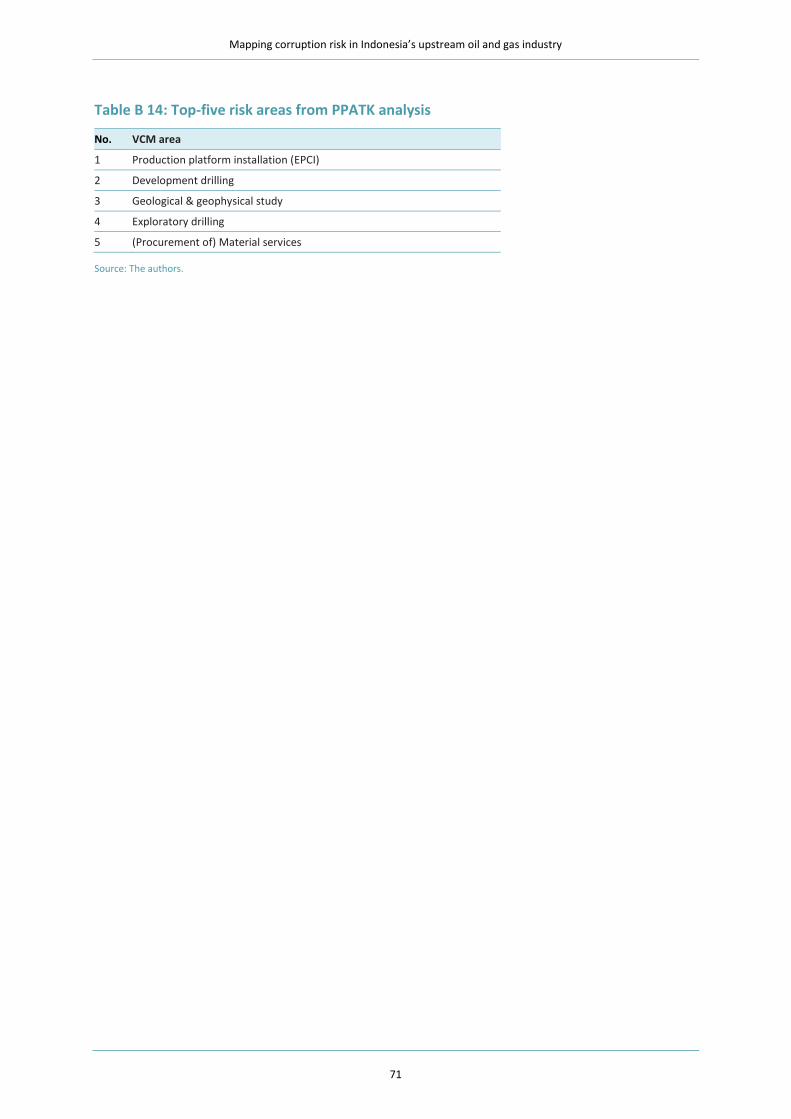
Mapping corruption risk in Indonesia’s upstream oil and gas industry
71
Table B 14: Top-five risk areas from PPATK analysis
No. VCM area
1 Production platform installation (EPCI)
2 Development drilling
3 Geological & geophysical study
4 Exploratory drilling
5 (Procurement of) Material services
Source: The authors.
Anti-Corruption Evidence (ACE) Research ConsortiumSOAS University of London, Thornhaugh Street, Russell Square, London WC1H OXGT +44 (0)20 7898 4447 • E [email protected] • W www.ace.soas.ac.uk
Disclaimer: This publication is an output of a research programme funded by UK aid from the UK Government. The views presented in this paper are those of the author(s) and do not necessarily represent the views of UK Government’s official policies.
Readers are encouraged to quote or reproduce material from ACE research for their own publications. As copyright holder ACE, requests due acknowledgement and a copy of the publication.
About the Anti-Corruption Evidence (ACE) Research Consortium:
ACE takes an innovative approach to anti-corruption policy and practice. Funded by UK aid, ACE is responding to the serious challenges facing people and economies affected by corruption by generating evidence that makes anti-corruption real, and using those findings to help policymakers, business and civil society adopt new, feasible, high-impact strategies to tackle corruption.
ACE is a partnership of highly experienced research and policy institutes based in Bangladesh, Nigeria, Tanzania, the United Kingdom and the USA. The lead institution is SOAS University of London. Other consortium partners are:
• BRAC Institute of Governance and Development (BIGD)
• BRAC James P. Grant School of Public Health (JPGSPH)
• Centre for Democracy and Development (CDD)
• Danish Institute for International Studies (DIIS)
• Economic and Social Research Foundation (ESRF)
• Health Policy Research Group (HPRG), University of Nigeria Nsukka (UNN)
• Ifakara Health Institute (IHI)
• London School of Hygiene and Tropical Medicine (LSHTM)
• Palladium
• REPOA
• Transparency International Bangladesh (TIB)
• University of Birmingham
ACE also has a well established network of leading research collaborators and policy/uptake experts.