mapping and assessment of the economic impact of small
TRANSCRIPT
Civil and Environmental Research www.iiste.org
ISSN 2224-5790 (Paper) ISSN 2225-0514 (Online)
Vol.7, No.9, 2015
21
Mapping and Assessment of the Economic Impact of Small-Scale
Surface Mining of Alluvial Gold Concentration in Talensi-
Nabdam District, Ghana
Momoh L. RILWANI
Department of Geography and Regional Planning,Ambrose Alli University, P.M.B. 14 Ekpoma, Edo State,
Nigeria
Ayila ADZANDEH Abubakari ABDUL-RAHIM
Regional Centre for Training in Aerospace Surveys (RECTAS), Off Road 1, Obafemi Awolowo University
Campus, Ile-Ife, Osun State, Nigeria
Abstract
Mapping and analysis of alluvial gold concentrations as well as assessment of the impact of mining activities on
the people of Talensi-Nabdam District, Ghana was undertaken. The mining concessions allocated to small-scale
miners were surveyed and mapped using Total Station and Electrometric distance measurement equipment.
Forty concessions were investigated: the largest covered 28.3ha. Analysis of ore bodies and slope percentage
shows that Manganiferous Rock has the highest percentage rate of occupancy (46.5 %) with a slope percentage
rate of 0-90%. Sandstone follows with 26.8% rate of occupancy and a slope rate of 0-100%. Sandstone and
Quartz field-Spar Porphyry have the highest slope rate within 0-100%. Predictive terrain analysis indicated that
the concentrations of the deposits are geographically located within the North-East and South East regions of the
study area. Gold production evaluation shows that maximum increament was experieced in the year 2001 with a
production unit of 85,596 (Oz). Employment criteria evaluation of socio-economic impact revealed that the
number of individuals engaged in the gold mining activity increases annually: from7.3% of the population in
2004 to 20.5% in 2010.
Keywords: Assessment, Socio-economic impact, Surface mining, Terrain analysis, Talensi-Nabdam district.
1. Introduction
The Ghanaian small-scale mining industry is well over 2,000 years old. Vestiges of alluvial gold extraction and
winning activities have been found as far back as the sixth century and there is a wealth of evidence indicating
that precious metals recovered from regional artisan activities were attracting Arab traders to certain areas of the
country as early as the 7th
and 8th
centuries A.D (Hilson, 2001). In fact, it was the rich gold deposits of the
Western Sahara that were largely responsible for the wealth and strength of large Ghanaian empires and cultures,
by the 15th
and 16th
centuries, and at the peak of European colonial exploration, Ghana was finally labeled the
‘Gold Coast’ (Hilson, 2001).
Small scale and (artisanal) mining has been defined differently around the world. United Nations,
(2013) and International Intermediate Group, (2010) definition describe small scale mining in terms of a given
production ceiling or the level of sophistication with which minerals are exploited. Small-scale mining is any
single unit mining operation having an annual production of unprocessed material of 50,000 tones, or less as
measured at the entrance of the mine (United Nations, 2013): small scale miners are “poor people; individuals or
small groups who depend upon mining for a living and who use rudimentary tools and techniques (e.g. picks,
chisels, Sluice and pans) to exploit their mineral deposits. World Bank (2009) documented that “small scale
mining is largely a poverty-driven activity, typically practiced in the poorest and most remote rural areas of a
country by a largely itinerant, poorly educated population with few employment alternatives. Aryee et al., (2003)
opined that small-scale mining is mining (Gold) by any method not involving substantial expenditure by an
individual or group of persons not exceeding nine in number or by a cooperative society made up of ten or more
persons.
Small-scale mining in Ghana, as in most developing countries, was for decades treated as an informal
industrial sector, employing thousands of people but featuring largely rudimental, unmonitored and uncontrolled
practices (Hilson, 2001). Since, the regularization of small-scale mining in 1989 over 1.5 million troy ounces of
Gold have been produced by the sector (Ghana Mineral Commission, 2004). The legal frame work for
registration of small-scale gold and diamond mines, minerals production and sales in the sector was established
in Ghana in May 1989. The small-scale mining law, PNDCL 218 (Anon, 1989a) led to the establishment of the
small-scale mining project within the Ghana minerals commission. The small-scale mining project (now small
mining department) has the responsibility for providing technical assistance to prospective and registered small-
scale miners in Ghana and promoting their activities. The Mercury Law, PNDCL 217 (Anon, 1989b) legalize the
purchasing of mercury for gold recovery purposes from authorized dealers and the precious minerals marketing
Civil and Environmental Research www.iiste.org
ISSN 2224-5790 (Paper) ISSN 2225-0514 (Online)
Vol.7, No.9, 2015
22
cooperation (PMMC) law, PNDCL 219 (Anon, 1989c), created an authority to buy, sell gold and diamonds.
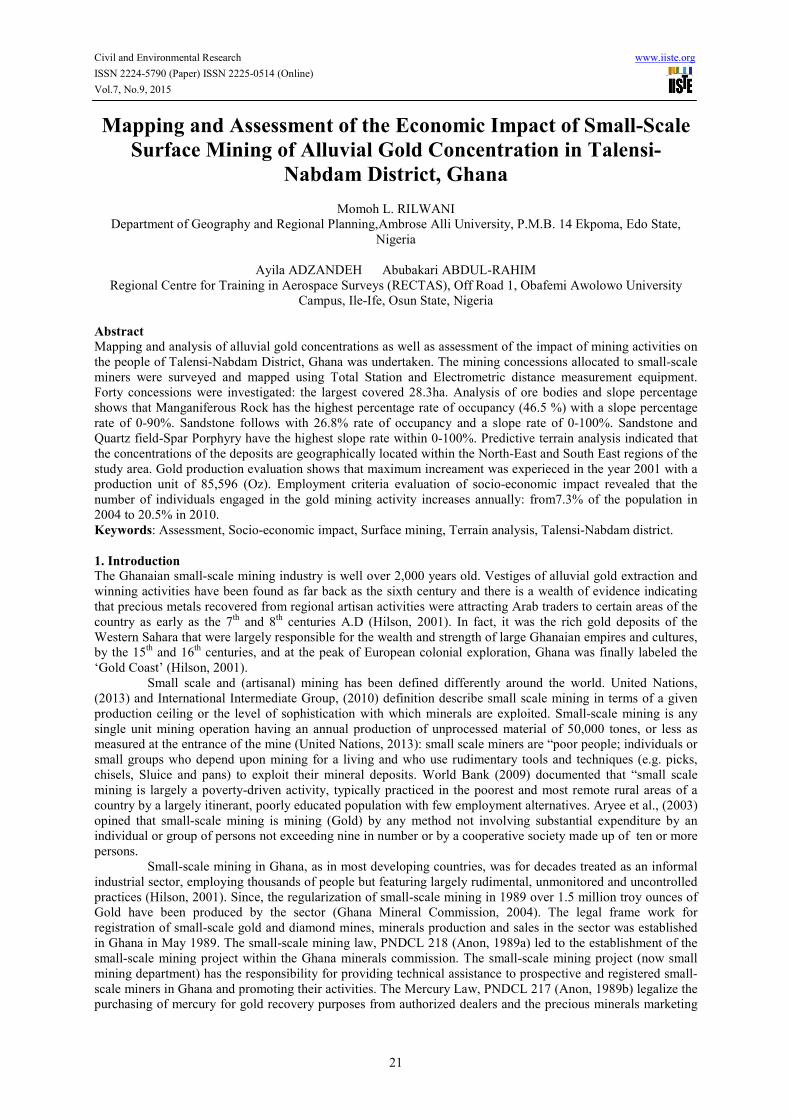
Figure 1: (a) Mine operator extracting gold through washing, (b) Remains of the Ore, which contains the Gold
after the washing process
Since the regularization exercises two types of small-scale miners have emerged –legal and illegal.
Legal small-scale miners comprise of those who have acquired miner’s license, while illegal small-scale miners
include those mining and processing ones without the requisite mining license and they usually operate on
concessions held by other companies. Illegal small-scale gold or diamond mining is popularly known in local
parlance as “Galam Sey” a corruption of the phrase gather them (The Gold and Sell). With assistance from the
Federal Institute for Geosciences and Natural Resources of Germany and the World Bank, the minerals
commission successfully tested and introduced hammer mills to the Ghanaian small-scale mining industry in
1999. The first plant was built at -Talensi Nabdam district in the upper East Region of Ghana (Anon-Sackey,
2001).
The small-scale mining of these precious minerals has had significant socio-economic impact on many
individuals and communities since it is the only source of income available to the people. In rural communities
where mining takes place, particularly in the Talensi Nabdam district, the activity has reduced rural exodus,
promoted local economic development and contributed towards poverty reduction. In addition, the mining
operations are useful in basic skill development and contribute to the transformation of unskilled labor into semi-
skilled and skilled to others. In the Talensi- Nabdam district, where other jobs are low paying or non-existent,
small-scale mining appears as a valuable source of employment. However, there are principal environmental
problems caused by these activities such as mercury pollution gold processing degradation. This study focuses
on the mapping and economic assessment of small scale mining activities in the Talensi Nabdam district. The
specific objectives are to: (i) coordinate and map the mining concessions in the area; (ii) examine the metric and
geometric properties of the mining concessions, using surveying techniques; (iii) analyze the relationship
between alluvial gold deposit and terrain descriptors and (iv) assess the socio economic impact of mining sites
on the populace in Talensi-Nabdam district.
2. The Study Area
The study location is Talensi-Nabdam District, Ghana (figure 2). It is one of the newly created districts carved
out from the then Bolgatanga Municipal Assembly. Talensi-Nabdam is in the upper East Region of Ghana and
has it capital at Tongo. It is bordered to the North by the Bolgatanga Municipality, South by the West and East
Manprusi district (both in the Northern Region), Kassena-Nankana district to the West and the Bawku West
district to the east. Talensi-Nabdam lies within latitude 0100 15’ N to 010
0 60’ N of the equator and longitude 00
0
31’ W to 010 05’W of the Greenwich Meridian.

Civil and Environmental Research www.iiste.org
ISSN 2224-5790 (Paper) ISSN 2225-0514 (Online)
Vol.7, No.9, 2015
23
Figure 2: Study Area
Geologically, the area is within the voltarian rocks of Ghana and with strong presence of GOLD. The
topography of the district is dominated relatively by undulating low lands gentle slopes. The climate is classified
as tropical and has two distinct seasons: a wet rainy season which is erratic and runs from May to October, and a
long dry season that stretches from October to April with hardly any rains. The mean rainfall ranges between
88mm-110mm, but with an annual rainfall of 950mm. The area experiences a maximum temperature of 450C in
March and April and a minimum of 120C December. The vegetation is guinea Savannah wood land consisting of
short widely spread deciduous trees and a ground flora of grass, which get burnt by fire or the scorching sun
during the long dry season. The district has a total population size of 115,020.
Generally, the economic significance of small scale mining can be evaluated using three criteria:
employment, production and earnings. The importance of small scale mining as a source of local employment is
evident. A large number of people are engaged in small scale mining activities within the mining communities
and their environs in Ghana. A report, presented by the Ghana Chamber of Mines, (2010) noted that 60% of the
country’s mining labor force was in fact employed at small-scale mines. Hilson, (2001) highlighted the socio-
economic impacts of small-scale mining in Ghana noting that majority of those involved directly in the
extraction of gold and diamond in the country are “galam Sey” (illegal miners). Ghana Mining Commission
(2004) estimated that in 2003, the registered small-scale gold and diamond mines employed 100,000 people with
almost an equal number working illegally, with 10% of women directly involved in the activity.
3. Materials and Methods
The methods used involved the interpretation and integration of spatial data with field observations for
geospatial assessment and mapping of small scale surface mining.
3.1 Data and Sources: The data used included: (i) topographic map (scale 1:50,000, sheet 1001A4) produced in
2004, which was obtained from Survey & Mapping Division of Ghana. The map was used in extracting the
drainage systems, road network settlements as well as place names and served as positional check and
demarcating study area; (ii) Field data: Scenes of the mining sites were captured using Samsung digital camera
16 megapixels; also a dual frequency GPS, Sokkia brand was also used in establishment of control points within
the study and in delineating each of the mining concessions; (iii) elevation data from Shuttle Radar Topographic
Mission (SRTM); (iv) statistical data: regarding the socio-economic impact of the activity which includes;
Civil and Environmental Research www.iiste.org
ISSN 2224-5790 (Paper) ISSN 2225-0514 (Online)
Vol.7, No.9, 2015
24
production of gold from the District (from 1989 to 2009) and employment data (from 2004 to 2010) which were
were obtained from the Regional office of the Mineral Commission of Ghana in the Upper East of Ghana; and
Average Annual Absolute Change (AAAC) of Population given as: AAAC = (Pl-Pb)/n eq. 1
Where Pl = population in the launch year, Pb = base population and n = number of years. This was used in
estimating the projected population of the District from 2001 to 2009 to aid in analyzing the economic impact of
the activity in the study area.
3.2 Data Processing and Analysis: Field observation data from the dual frequency GPS instrument was
downloaded with Survey spectrum software and processed with ArcGIS 9.3 and AUTOCAD 2007 software.
Linear tape measurement was used to determine the geometric (Depth) properties of the mining concessions.
Mining concessions maps were produced. These aided in analyzing metric and geometric properties of the
mining concessions. The documentary records and population data obtained from Mineral Commission of Ghana
were analyzed in the form of cumulative curve with Microsoft excel software for soci-economic impact of the
small scale mining activity on the people.
3.3 Alluvial Gold Deposit and Terrain Descriptors Modeling: The geological map shows the different categories
of rocks which contains the alluvial gold deposits, namely: Manganiferous rocks, Sandstone, Metabasalts with
local Metadacites, Granodiorite with local Tonalities, Volcaniclastic rocks, Cherts, Quartz field-spar Porphyry
and Fault which shows a discontinuity between the geological objects which occurs as a result of volcanic
eruption or tectonic processes. The various rocks are grouped under the Birimian and Tarkwanian group of the
sedimentary rocks which is believed to contain about 60% of gold deposits in Talensi-Nabdam District as well
the country at large (Hilson, 2001).
Two types of selection were performed in the processing and analysis in ArcGIS environment. They
are selection by attribute which is a standard query language and selection by location which is a spatial query to
ascertain the geological objects that dominate in the study area. Geological Map of the study area was overlaid
with the 3D Terrain model of the study area in Surfer 10.7 environment and was used as input for surface
roughness and mineral deposits modelling. This particular analysis depicted the relationship between the terrain
descriptors and the mineral deposits.
4. Results and Discussion
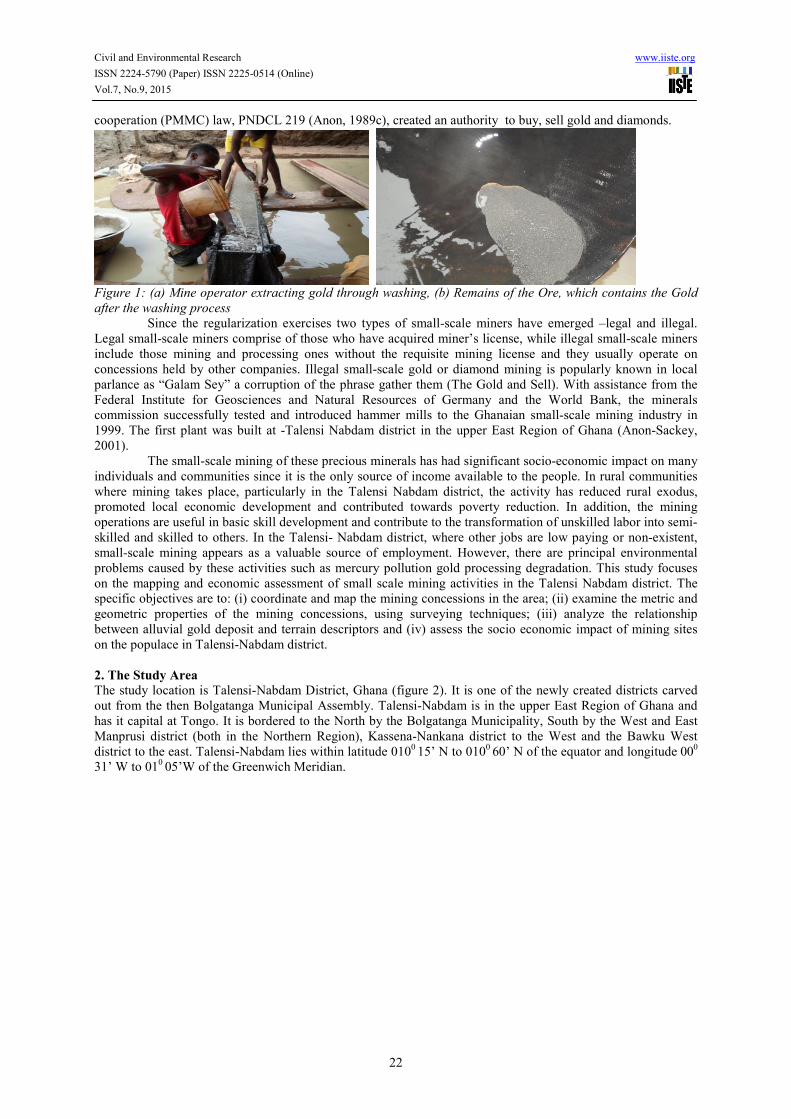
Forty mining concession sites were investigated in this work. Their metric and geometric properties, perimeter
and depth respectively are reported (Table 1). The locations of the sites were also coordinated. Scene of a
concession; the site illustrating depth measurement with linear tape from ground surface level is shown in figure
3.
Figure 3: Mining Concession with Gold Diggers Removing Placer Gold (Source: Field Work, 2013)

Civil and Environmental Research www.iiste.org
ISSN 2224-5790 (Paper) ISSN 2225-0514 (Online)
Vol.7, No.9, 2015
25
Table 1: Metric and Geometric properties of the Mining Concessions
S/N X (M) Y (M) AREA
(HA)
DEPTH (METERS)
Z
1 753234.74 1187983.36 10.0 -12
2 753725.35 11888012.22 3.6 -7
3 753826.35 1188041.08 1.2 -7.8
4 754618.4 1188083.26 1.2 -4.5
5 754645.82 1187088.72 1.2 -9.1
6 754538.34 1186821.99 1.2 -4.6
7 754846.45 1187138.08 1.2 -3.9
8 754585.03 1187432.55 1.2 -10.1
9 75186.7 1184067.89 1.2 -8.9
10 751200.15 1184577.96 2.0 -12.5
11 751915.43 1184951.35 1.2 -6.9
12 751647.47 1184664.53 1.2 -15.1
13 749238.97 1184528.99 1.2 -13.9
14 749890.49 11844450.98 3.6 -8.8
15 749483.02 1184318.22 3.6 -10.9
16 750680.68 1183120.56 3.6 -6.8
17 750868.27 1183221.57 1.2 -17.1
18 751070.28 1183337 2.0 -13.9
19 751156.86 1183452.44 3.6 -19.2
20 751184.8 1180240.97 10.0 -12.5
21 752088.8 1180410.47 10.0 -26.3
22 751788.14 1179841.81 1.2 -8.7
23 752060.32 1179841.81 1.2 -9.6
24 754369.07 1180431.82 3.6 -16.1
25 755891.15 1185690.34 3.6 -20.3
26 757062.62 1185357.16 10.0 -18.1
27 756934.35 1184972.37 3.6 -7.5
28 757267.84 1185228.9 1.2 -7.9
29 757036.96 1185664.99 28.3 -30
30 757986.11 1185947.17 1.2 -8.9
31 758653.09 1186485.88 10.0 -13.5
32 756908.7 1186485.88 3.6 -11.8
33 763480.09 1188133.36 10.0 -9.9
34 763708.11 1187722.92 10.0 -8.1
35 763662.51 1186674 1.2 -14.7
36 764620.21 1187677.31 1.2 -16.2
37 763252.06 1189775.14 1.2 -8.6
38 755453.61 1176732.12 1.2 -13.3
39 757825.07 1177598.62 1.2 -17.5
40 755864.06 1179924.47 1.2 -12.5
41 758856.88 117003.92 1.2 -16.3
42 758583.25 1172388.25 1.2 -10.6
43 757386.12 1171977.81 1.2 -8.9
44 763713.81 1177005.75 1.2 -10.9
(Source: Author’s fieldwork, 2013)
4.1Analysis of Concentration of Alluvial Gold and Terrain Descriptors Relationship
Statistical analysis of the percentage rate as well as the slope rate of the different categories of rocks in the area
shows that Manganiferous Rocks have the highest percentage rate of ore occupancy of 46.5 %; and a slope
percentage rate of 0-90%. Sandstone follows with 26.8% rate of occupancy with a slope rate of 0-100%.
Sandstone and Quartz field-Spar Porphyry has the highest slope rate within 0-100%. Cherts and Metabasalts
with Metadacites have the least slope rate within 0-50% (Table 2). Figure 4 shows slope percentage rate within
the study area, from the minimum slope rate of 0-5% to the maximum slope rate (from 29-100%).

Civil and Environmental Research www.iiste.org
ISSN 2224-5790 (Paper) ISSN 2225-0514 (Online)
Vol.7, No.9, 2015
26
Table 2: Results of the Analysis of Ore bodies and Slope Percentages
Rock Type Percentage / % Slope %
Manganiferous Rocks 46.5 0-90
Sandstone 26.8 0-100
Cherts 17.8 0-50
Granosiorite with local Tonalities 2.23 0-90
Volcaniclastic Rocks 2.23 0-90
Metabasalt with Metadacites 2.23 0-40
Quartzfield-Spar Porhyry 2.23 0-100
Figure 4: Slope Map
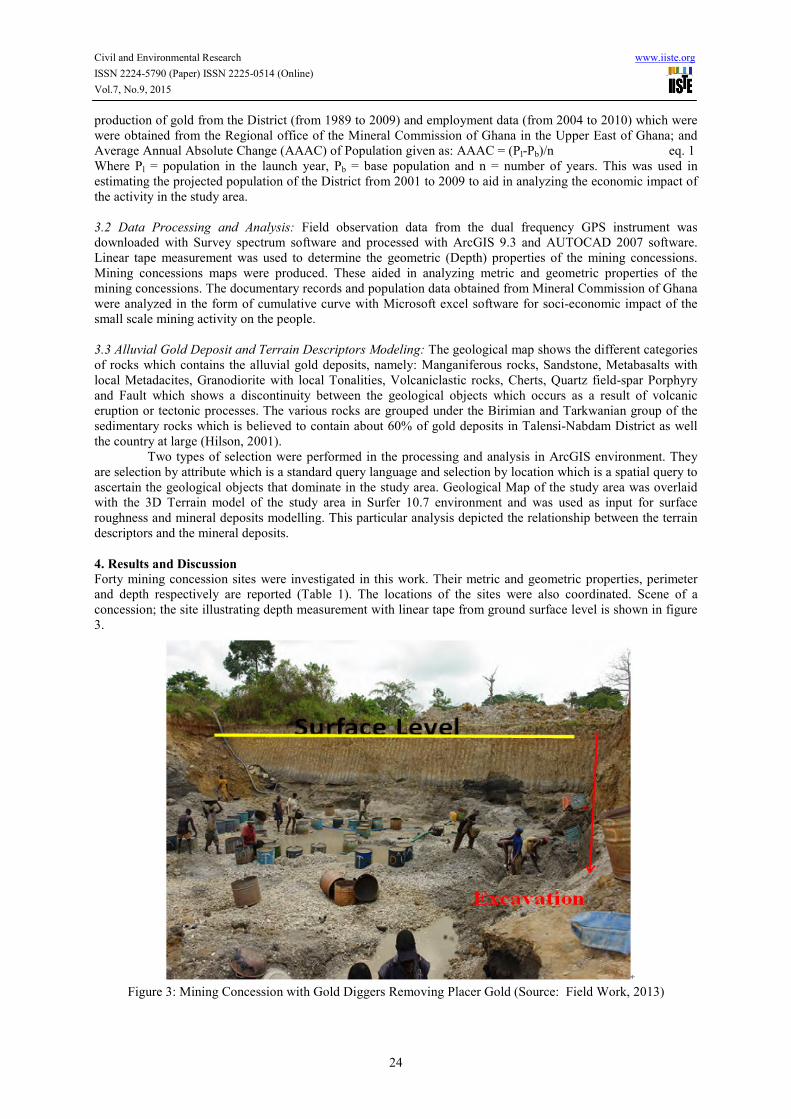
Overlay analysis of geological map, 3D terrain model revealed that most of the geological objects
within the study area were spatially located within flat and hilly regions (figure 5) and also presented a better
understanding and analysis of where to exactly explore the ore.
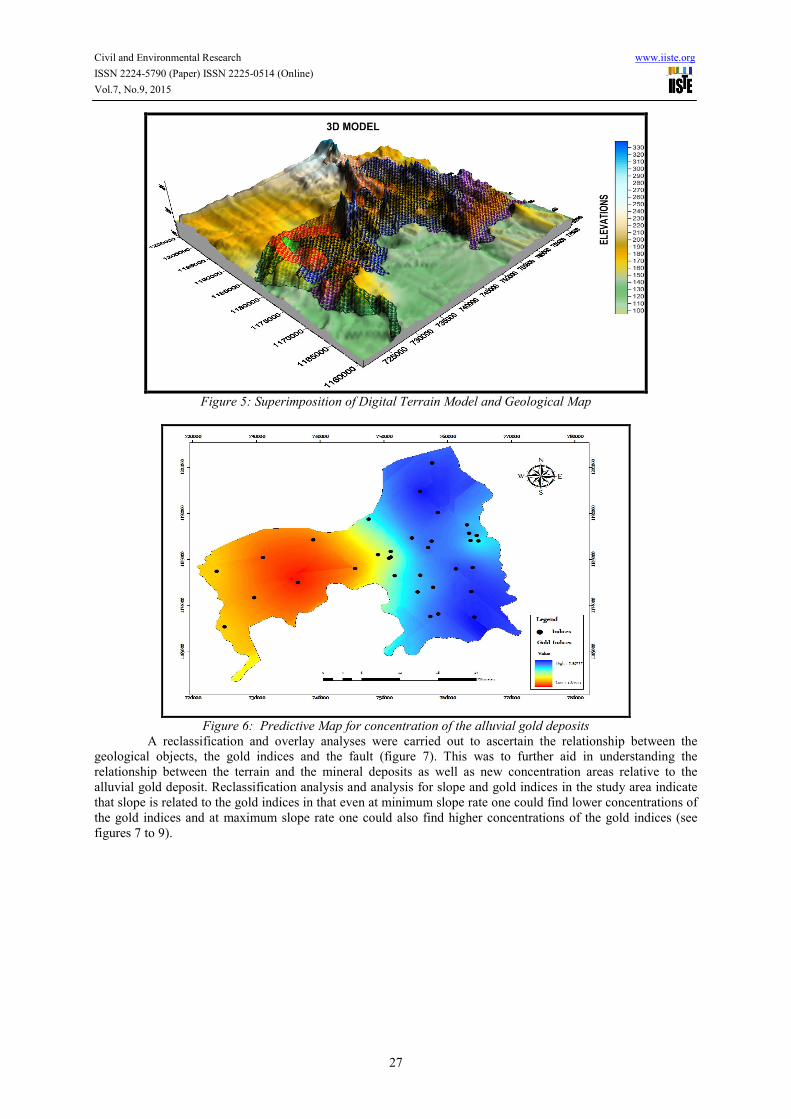
Geostatistical analysis using kriging tool in ArcGIS 9.3 was adopted in determining the concentration
of the mineral deposits in the study area. The gold indices as well as the geological map were reclassified
together and used as the input parameters for predicting precisely the concentration of the alluvial deposits. The
prediction analysis indicated that the concentration of the deposits were geographically located within the North-
East and South East regions within the study area. The mining concessions are located around these regions
however not precisely on the concentrated regions but close. The deeper blue shows higher concentration whilst
deeper red shows lower concentration; the North-West and South-West regions indicate lower or little
concentrations (figure 6).
Civil and Environmental Research www.iiste.org
ISSN 2224-5790 (Paper) ISSN 2225-0514 (Online)
Vol.7, No.9, 2015
27
Figure 5: Superimposition of Digital Terrain Model and Geological Map
Figure 6: Predictive Map for concentration of the alluvial gold deposits
A reclassification and overlay analyses were carried out to ascertain the relationship between the
geological objects, the gold indices and the fault (figure 7). This was to further aid in understanding the
relationship between the terrain and the mineral deposits as well as new concentration areas relative to the
alluvial gold deposit. Reclassification analysis and analysis for slope and gold indices in the study area indicate
that slope is related to the gold indices in that even at minimum slope rate one could find lower concentrations of
the gold indices and at maximum slope rate one could also find higher concentrations of the gold indices (see
figures 7 to 9).
Civil and Environmental Research www.iiste.org
ISSN 2224-5790 (Paper) ISSN 2225-0514 (Online)
Vol.7, No.9, 2015
28
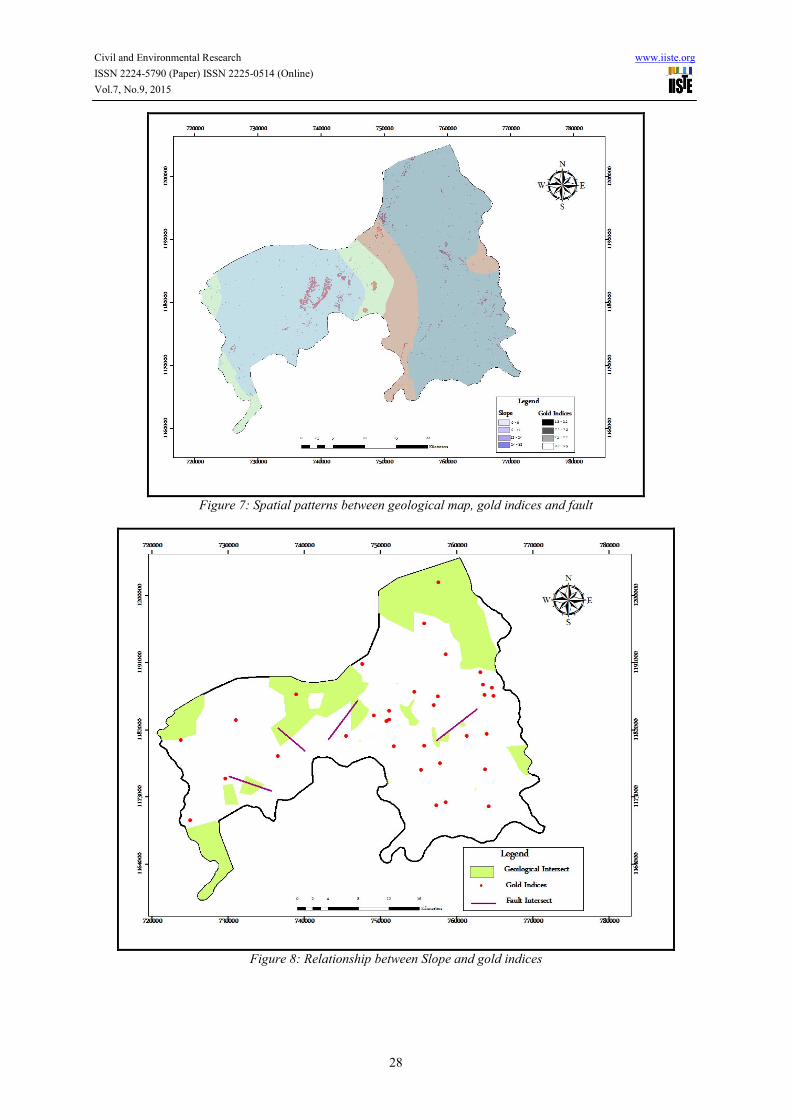
Figure 7: Spatial patterns between geological map, gold indices and fault
Figure 8: Relationship between Slope and gold indices
Civil and Environmental Research www.iiste.org
ISSN 2224-5790 (Paper) ISSN 2225-0514 (Online)
Vol.7, No.9, 2015
29
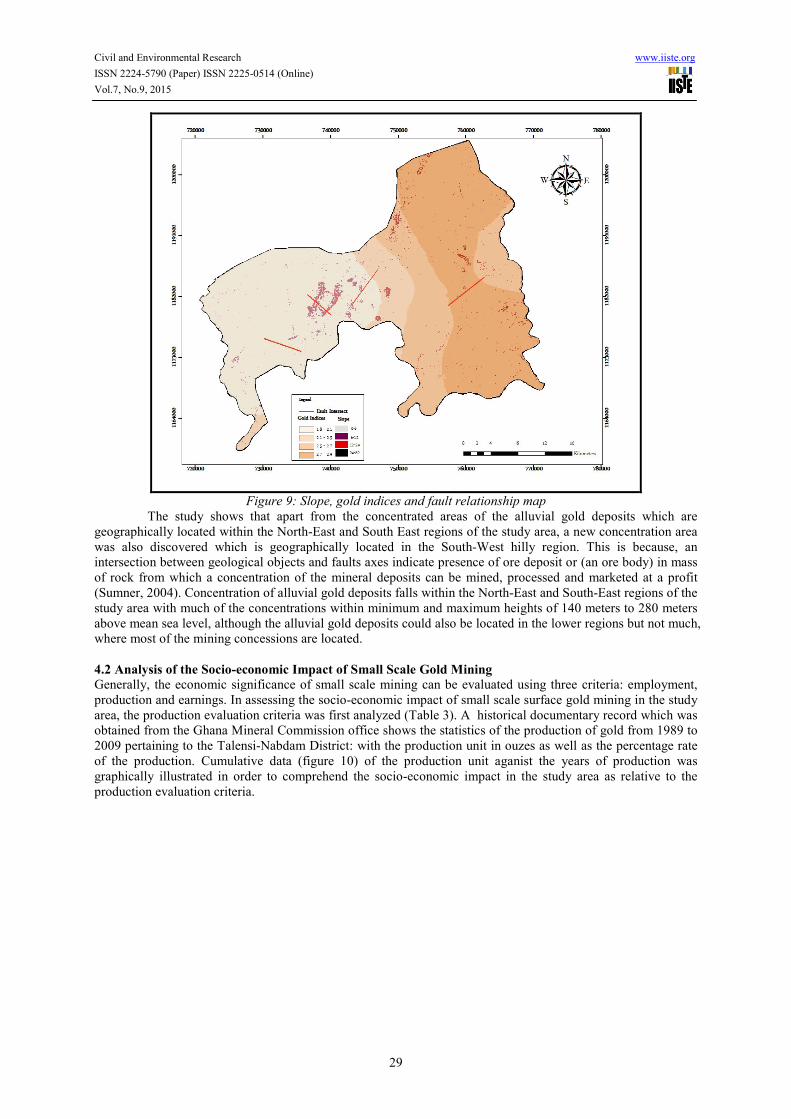
Figure 9: Slope, gold indices and fault relationship map
The study shows that apart from the concentrated areas of the alluvial gold deposits which are
geographically located within the North-East and South East regions of the study area, a new concentration area
was also discovered which is geographically located in the South-West hilly region. This is because, an
intersection between geological objects and faults axes indicate presence of ore deposit or (an ore body) in mass
of rock from which a concentration of the mineral deposits can be mined, processed and marketed at a profit
(Sumner, 2004). Concentration of alluvial gold deposits falls within the North-East and South-East regions of the
study area with much of the concentrations within minimum and maximum heights of 140 meters to 280 meters
above mean sea level, although the alluvial gold deposits could also be located in the lower regions but not much,
where most of the mining concessions are located.
4.2 Analysis of the Socio-economic Impact of Small Scale Gold Mining
Generally, the economic significance of small scale mining can be evaluated using three criteria: employment,
production and earnings. In assessing the socio-economic impact of small scale surface gold mining in the study
area, the production evaluation criteria was first analyzed (Table 3). A historical documentary record which was
obtained from the Ghana Mineral Commission office shows the statistics of the production of gold from 1989 to
2009 pertaining to the Talensi-Nabdam District: with the production unit in ouzes as well as the percentage rate
of the production. Cumulative data (figure 10) of the production unit aganist the years of production was
graphically illustrated in order to comprehend the socio-economic impact in the study area as relative to the
production evaluation criteria.
Civil and Environmental Research www.iiste.org
ISSN 2224-5790 (Paper) ISSN 2225-0514 (Online)
Vol.7, No.9, 2015
30
Table 3: Analysis of Gold Production in Talensi-Nabdam District
Year Gold Production (Oz) Total District Production (%)
1989 1,272 0.2
1990 3,234 0.4
1991 5,601 0.7
1992 7,297 0.9
1993 18,520 2.4
1994 27,025 3.5
1995 45,014 2.5
1996 19,349 3.9
1997 25,094 2.5
1998 30,334 3.9
1999 49,833 6.5
2000 55,663 7.2
2001 85,596 12.5
2002 60,879 7.9
2003 70,414 10.5
2004 66,253 8.6
2005 45,698 5.9
2006 23,999 3.1
2007 35,698 4.6
2008 58,952 7.6
2009 36,548 4.7
(Source: Minerals Commission of Ghana)
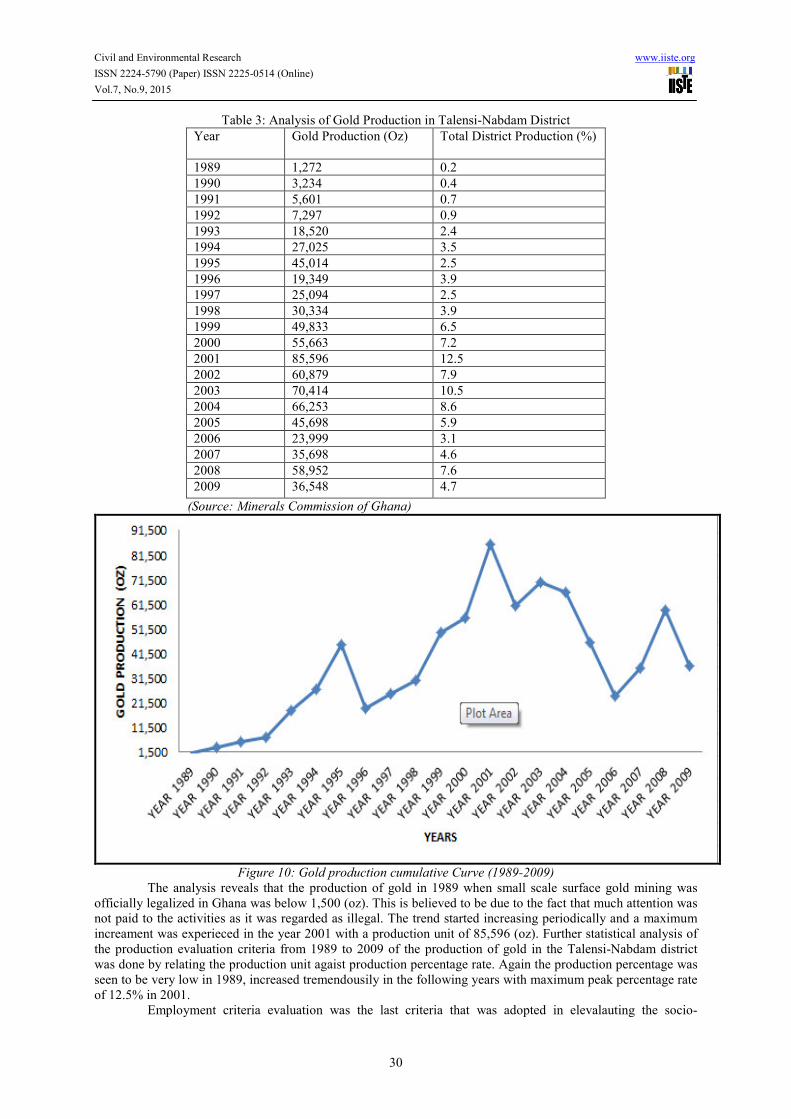
Figure 10: Gold production cumulative Curve (1989-2009)
The analysis reveals that the production of gold in 1989 when small scale surface gold mining was
officially legalized in Ghana was below 1,500 (oz). This is believed to be due to the fact that much attention was
not paid to the activities as it was regarded as illegal. The trend started increasing periodically and a maximum
increament was experieced in the year 2001 with a production unit of 85,596 (oz). Further statistical analysis of
the production evaluation criteria from 1989 to 2009 of the production of gold in the Talensi-Nabdam district
was done by relating the production unit agaist production percentage rate. Again the production percentage was
seen to be very low in 1989, increased tremendousily in the following years with maximum peak percentage rate
of 12.5% in 2001.
Employment criteria evaluation was the last criteria that was adopted in elevalauting the socio-
Civil and Environmental Research www.iiste.org
ISSN 2224-5790 (Paper) ISSN 2225-0514 (Online)
Vol.7, No.9, 2015
31
economic impact of the small scale surface gold mining activities on the people in the Talensi-Nabdam district.
Table 4 shows the statistical analysis of the number of inhabitants who are gainfully emlpoyed by this activity
from 2004 to 2010 as well as the employment percentage rate with respect to the various years. Employment
information regarding years preceding 2004 were not available. A total of 2,409 people were employed over the
last six years from 2004 to 2010 (available data from the Mineral Commission of Ghana).
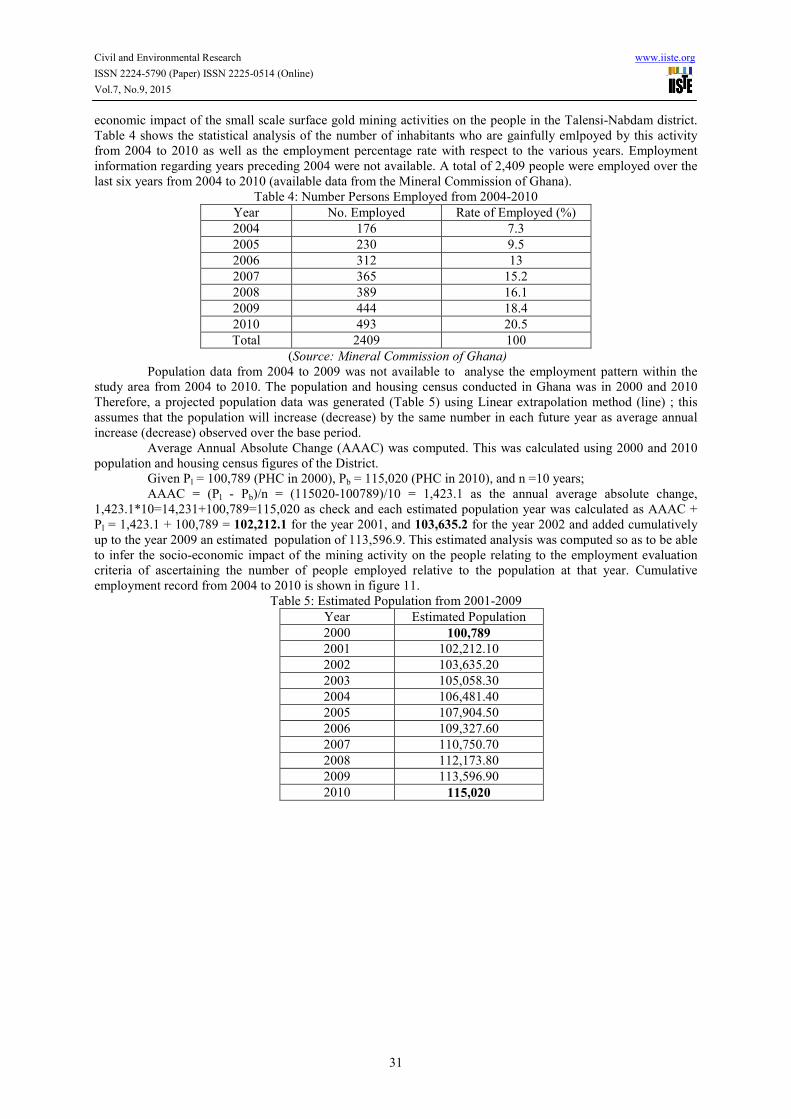
Table 4: Number Persons Employed from 2004-2010
Year No. Employed Rate of Employed (%)
2004 176 7.3
2005 230 9.5
2006 312 13
2007 365 15.2
2008 389 16.1
2009 444 18.4
2010 493 20.5
Total 2409 100
(Source: Mineral Commission of Ghana)
Population data from 2004 to 2009 was not available to analyse the employment pattern within the
study area from 2004 to 2010. The population and housing census conducted in Ghana was in 2000 and 2010
Therefore, a projected population data was generated (Table 5) using Linear extrapolation method (line) ; this
assumes that the population will increase (decrease) by the same number in each future year as average annual
increase (decrease) observed over the base period.
Average Annual Absolute Change (AAAC) was computed. This was calculated using 2000 and 2010
population and housing census figures of the District.
Given Pl = 100,789 (PHC in 2000), Pb = 115,020 (PHC in 2010), and n =10 years;
AAAC = (Pl - Pb)/n = (115020-100789)/10 = 1,423.1 as the annual average absolute change,
1,423.1*10=14,231+100,789=115,020 as check and each estimated population year was calculated as AAAC +
Pl = 1,423.1 + 100,789 = 102,212.1 for the year 2001, and 103,635.2 for the year 2002 and added cumulatively
up to the year 2009 an estimated population of 113,596.9. This estimated analysis was computed so as to be able
to infer the socio-economic impact of the mining activity on the people relating to the employment evaluation
criteria of ascertaining the number of people employed relative to the population at that year. Cumulative
employment record from 2004 to 2010 is shown in figure 11.
Table 5: Estimated Population from 2001-2009
Year Estimated Population
2000 100,789
2001 102,212.10
2002 103,635.20
2003 105,058.30
2004 106,481.40
2005 107,904.50
2006 109,327.60
2007 110,750.70
2008 112,173.80
2009 113,596.90
2010 115,020

Civil and Environmental Research www.iiste.org
ISSN 2224-5790 (Paper) ISSN 2225-0514 (Online)
Vol.7, No.9, 2015
32
Figure 11: cumulative graph of employment evaluation criteria from 2004-2010
From the cumulative frquency graph, it is obvious or evident that the mining activity indeed serves as
a source of employment for most people in the study area. The number of people employed from 2004 to 2010
increases tremendousily year by year. For instance in 2004 the number engaged in this activity were only 176
people representing 7.3% of the population at that year; in 2010 493 people were engaged in the activity
denoting 20.5% of the population at that year. This analysis is an emphatical evident of being able to quantify the
socio-economic impact of the mining activity in the lives of the people in the Talensi-Nabdam district. In the
same development, making a projected analysis of the economic trend, from 2010 to 2016 the number of people
employed by this activity will continues to increase annually.
More importantly, in evaluating the socio-economic impact of small scale mining activity in the study
area, using the employment evaluation criteria emphasises should be placed on the nature of labour and income
distribution associated with the activity. The labour division of the activity is made up of sponsors or buyers also
known as concession owners; people who wash the processed ore with white mercury known as extractors or
processors; those who crush the orebody with rudimentary tools like hammers,chesels,pans,shovels known as
crushers or panners; and those who dig the mining pits also known as miners or diggers. In the same vein, the
income distribution is associated with the same group of people from the concession owners down to the carriers.
From the statistical analysis above, about a total of 2,409 people are engaged in the activity from 2004 to 2010
representing 2.1% of the current population of 115,020.
5. Conclusion
Field observations, coupled with historical documentary records have been used in this study to map analyze and
assess the socio-economic impact of small-scale gold mining activities on the lives of the people in the Talensi-
Nabdam district of Ghana. Analysis of ore bodies and slope percentage shows that Manganiferous Rock has the
highest percentage rate of occupancy, followed by Sandstone. Similarly, Sandstone and Quartz field-Spar
Porphyry has the highest slope rate. Furthermore predictive terrain analysis indicated that the concentration of
ore deposits were geographically located within the North-East and South East regions in the study area.
References
Aryee Benjamin N.A., Amankwah, R.K., Anim-Sackey., (2003). Trends in the Small scale Mining of Precious
Minerals in Ghana: Its Environmental Impact. Journal of Cleaner Production11 (2003) pp. 131-140.
Anon., (1989a). Small-scale Gold Mining Law, PNDCL 218. Ghana Publishing Corporation, Ghana, pp. 1–5.
Anon., (1989b). Mercury Law, PNDCL 217. Ghana Publishing Corporation, Ghana, pp. 1-2
Anon., (1989c). Precious Minerals Marketing Corporation Law, PNDCL 219. Ghana Publishing Corporation,
Ghana, pp.1-3
Anim-Sackey, C., (2001). Mechanization of small-scale gold mining processing methods with the introduction of
hammers mills, in: Proceedings of New Trends in Mineral Processing IV Conference Ostrava, Czech

Civil and Environmental Research www.iiste.org
ISSN 2224-5790 (Paper) ISSN 2225-0514 (Online)
Vol.7, No.9, 2015
33
Republic (2001) pp. 447–450.
GMC-Ghana Mineral Commission, (2004). Annual Report for 2003
Ghana Chamber of Mines (2010). Report of the Ghana Chamber of Mines,
Hilson G., (2001). Contextual Review of the Ghanaian Small Scale Mining Industries.Resources policy 10 (10-
25).
Sumner, W., (2004). Textbook of Geological Structures. 13th
Edition. Thomas Nurby & Co, London. Vol: 1 (5-
9).
World Bank (2009). Retrieved from: www.worldbank.com. Accessed: 14-06, 2013.
International Intermediate Group (2010). Retrieved from: www.worldbank.com. Accessed: 20-06- 2013
United Nations (2013). Retrieved from: www.un.com. Accessed: 2-06, 2013

The IISTE is a pioneer in the Open-Access hosting service and academic event management.
The aim of the firm is Accelerating Global Knowledge Sharing.
More information about the firm can be found on the homepage:
http://www.iiste.org
CALL FOR JOURNAL PAPERS
There are more than 30 peer-reviewed academic journals hosted under the hosting platform.
Prospective authors of journals can find the submission instruction on the following
page: http://www.iiste.org/journals/ All the journals articles are available online to the
readers all over the world without financial, legal, or technical barriers other than those
inseparable from gaining access to the internet itself. Paper version of the journals is also
available upon request of readers and authors.
MORE RESOURCES
Book publication information: http://www.iiste.org/book/
Academic conference: http://www.iiste.org/conference/upcoming-conferences-call-for-paper/
IISTE Knowledge Sharing Partners
EBSCO, Index Copernicus, Ulrich's Periodicals Directory, JournalTOCS, PKP Open
Archives Harvester, Bielefeld Academic Search Engine, Elektronische Zeitschriftenbibliothek
EZB, Open J-Gate, OCLC WorldCat, Universe Digtial Library , NewJour, Google Scholar