mapping adhesive infiltration in wood cell walls with ... wood adhesives... · mapping adhesive...
TRANSCRIPT

Mapping adhesive infiltration in
wood cell walls with synchrotron x-
ray fluorescence microscopy
Joseph E. Jakes, Chris G. Hunt, Dan Yelle, Warren
Grigsbya, Chuck Friharta Bioproduct Development, Scion, Rotorua, New Zealand
X-ray Fluorescence Microscopy
Sophie-Charlotte Gleberb, Stefan Vogtb
bX-ray Science Division, Argonne National Laboratory, Argonne, IL, USA

Wood Bonding and Moisture-
Induced Swelling
Stabilized
wood
surface
Adhesive
flexibility
Wood
Adhesive
High interfacial strain during moisture-induced
swelling can lead to bond failure
Wood
C.R. Frihart, Journal of Adhesion Science and
Technology, 2009, 23, pp 611–27.
Wood cells
Adhesive
Need methods for
cell walls
characterization
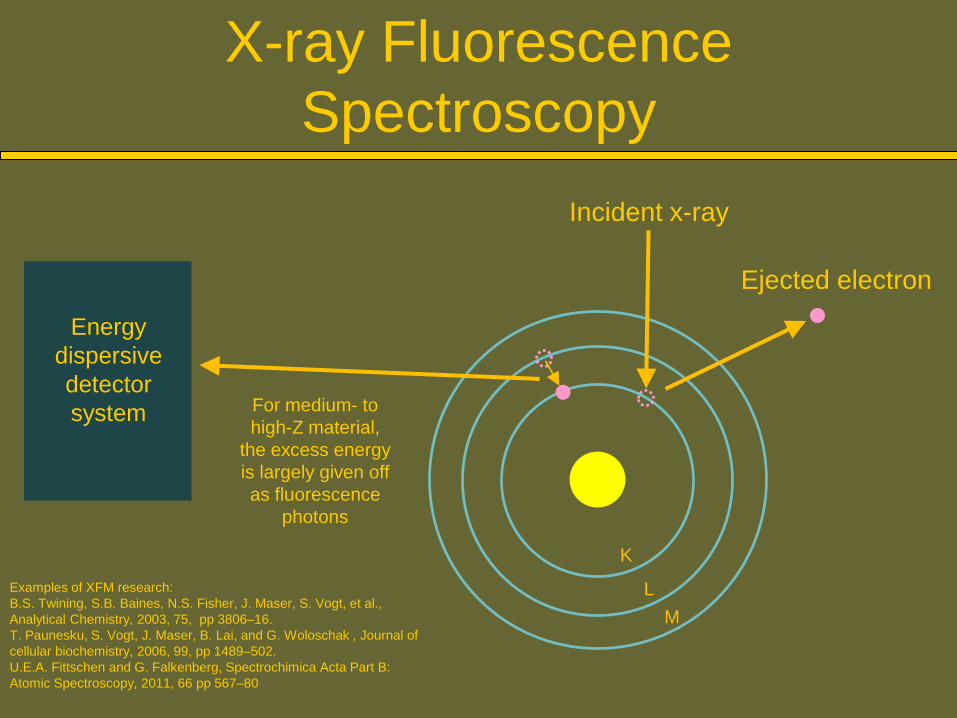
X-ray Fluorescence
Spectroscopy
Incident x-ray
L
M
K
Ejected electron
For medium- to
high-Z material,
the excess energy
is largely given off
as fluorescence
photons
Energy
dispersive
detector
system
Examples of XFM research:
B.S. Twining, S.B. Baines, N.S. Fisher, J. Maser, S. Vogt, et al.,
Analytical Chemistry, 2003, 75, pp 3806–16.
T. Paunesku, S. Vogt, J. Maser, B. Lai, and G. Woloschak , Journal of
cellular biochemistry, 2006, 99, pp 1489–502.
U.E.A. Fittschen and G. Falkenberg, Spectrochimica Acta Part B:
Atomic Spectroscopy, 2011, 66 pp 567–80

X-ray Fluorescence Microscopy
(XFM)Beamline 2-ID-E at the Advanced Photon Source at Argonne
National Laboratory

X-ray Fluorescence Microscopy
(XFM)Sample box at beamline 2-ID-E at the Advanced Photon Source at
Argonne National Laboratory

Wood cells
Adhesive
Tangential
Ra
dia
l
• Bromine-labeled phenol formaldehyde
(PF) adhesive
• 3-bromophenol instead of phenol
• Aliquots pulled at 5 times during
polymerization step
• Pristine tangential-longitudinal surfaces
bonded with Br-labeled PF
• Cured in 155°C for 45 min
• 2 µm-thick cross-sections cut with
diamond knife, floated in water, and
clamped inside foldable TEM grid
• XFM performed at 2-ID-E at the
Advanced Photon Source
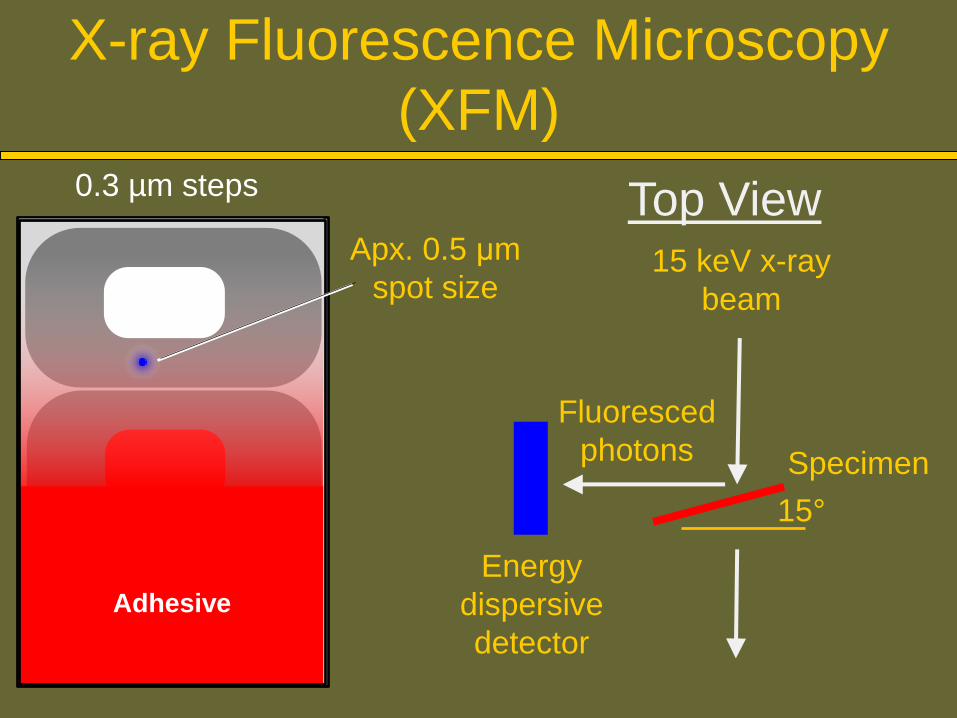
X-ray Fluorescence Microscopy
(XFM)

15 keV x-ray
beam
Specimen
15°
Energy
dispersive
detector
Fluoresced
photons
Adhesive
Apx. 0.5 μm
spot size
Top View
X-ray Fluorescence Microscopy
(XFM)

15 keV x-ray
beam
Specimen
15°
Energy
dispersive
detector
Fluoresced
photons
Adhesive
Apx. 0.5 μm
spot size Primary
Br signal
(k-line)
Counts
Data analysis was carried out using the MAPS
software package. Briefly, full spectra were fit to
modified Gaussian, background was iteratively
determined and subtracted, and the results compared
to standard reference material (NBS 1832 and 1833,
NIST). S. Vogt, Journal de physique. IV, 2003, 104 pp 635–8.
0 2 4 6 8 10 12 14
Energy (keV)
X-ray Fluorescence Microscopy
(XFM)

15 keV x-ray
beam
Specimen
15°
Energy
dispersive
detector
Fluoresced
photons
Adhesive
Apx. 0.5 μm
spot size
Top View0.3 µm steps
X-ray Fluorescence Microscopy
(XFM)
15 keV x-ray
beam
Specimen
15°
Energy
dispersive
detector
Fluoresced
photons
Adhesive
Apx. 0.5 μm
spot size
Top View0.3 µm steps
X-ray Fluorescence Microscopy
(XFM)

15 keV x-ray
beam
Specimen
15°
Energy
dispersive
detector
Fluoresced
photons
Adhesive
Apx. 0.5 μm
spot size
Top View0.3 µm steps
X-ray Fluorescence Microscopy
(XFM)

10-1
101
102
104
106
50 µm 50 µm
Br signal Zn signal
Using TEM-EDXA Saka and Goring (1983) found 400
ppm Zn in CCML, but none in secondary cell walls
SEM EDXA results
50 µm 50 µm
Br EDXABackscattering
image
- XFM 2-3 orders of magnitude
more sensitive than SEM EDXA- No bremsstrahlung
background
- Although electrons are easier
to focus, x-rays have effectively
no side scattering
(log scale)
(µg/cm2)
XFM results

10-1
101
102
104
106
50 µm 50 µm
Br signal Zn signal
Using TEM-EDXA Saka and Goring (1983) found 400
ppm Zn in CCML, but none in secondary cell walls
(log scale)
(µg/cm2)
XFM results Potential artifacts
X-ray beam not perfectly focused
0.5 µm
Spatial distribution of x-rays

10-1
101
102
104
106
(log scale)
XFM results
50 µm
Br signal
(µg/cm2)
Potential artifacts
Br separates from Br-PF
Tested for free Br by: 1. Curing adhesive on filter paper
2. Soaking filter paper in water overnight
3. Tested water for Br ions using ion selective electrode and
total Br using ICP-MS
Up to 1% Br atoms fell off Br-PF and
became Br ions

50 µm
10-1
101
102
104
106
(log scale)
XFM resultsBr signal (µg/cm2)
50 µm50 µm50 µm50 µm
45 min 85 min 115 min 135 min 155 min
Decreasing amount of low MW PF
Tangential
Ra
dia
l
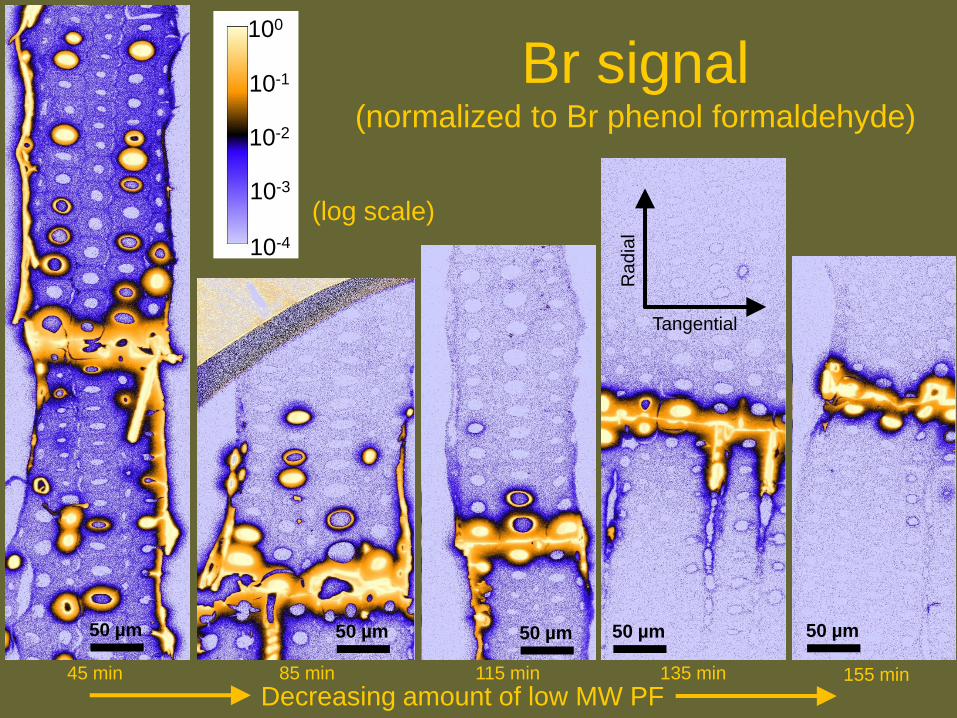
10-4
10-3
10-2
10-1
100
(log scale)
Br signal (normalized to Br phenol formaldehyde)
50 µm50 µm50 µm50 µm50 µm
45 min 85 min 115 min 135 min 155 min
Decreasing amount of low MW PF
Tangential
Ra
dia
l

10-4
10-3
10-2
10-1
100
(log scale)
Br signal (normalized to neat phenol formaldehyde)
50 µm50 µm50 µm50 µm50 µm
45 min 85 min 115 min 135 min 155 min
Decreasing amount of low MW PF
-1 0 1 2 3 4 5
Distance (m)
10-3
10-2
10-1
100
101
Br
sig
na
ln
orm
aliz
ed
ton
ea
tP
F

10-4
10-3
10-2
10-1
100
(log scale)
Br signal (normalized to neat phenol formaldehyde)
50 µm50 µm50 µm50 µm50 µm
45 min 85 min 115 min 135 min 155 min
Decreasing amount of low MW PF
-1 0 1 2 3 4 5
Distance (m)
10-3
10-2
10-1
100
101
Br
sig
na
ln
orm
aliz
ed
ton
ea
tP
F

10-4
10-3
10-2
10-1
100
(log scale)
Br signal (normalized to neat phenol formaldehyde)
50 µm50 µm50 µm50 µm50 µm
45 min 85 min 115 min 135 min 155 min
Decreasing amount of low MW PF
-1 0 1 2 3 4 5
Distance (m)
10-3
10-2
10-1
100
101
Br
sig
na
ln
orm
aliz
ed
ton
ea
tP
F

10-4
10-3
10-2
10-1
100
(log scale)
Br signal (normalized to Br phenol formaldehyde)
50 µm50 µm50 µm50 µm50 µm
45 min 85 min 115 min 135 min 155 min
Decreasing amount of low MW PF
Tangential
Ra
dia
l

10-4
10-3
10-2
10-1
100
(log scale)
Red lines indicate rows of cells
tested with nanoindentation
50 µm50 µm50 µm50 µm50 µm
45 min 85 min 115 min 135 min 155 min
Decreasing amount of low MW PF

Nanoindentation Experiment
0 50 100 150 200 250 300
Depth, h (nm)
0
200
400
600
800
1000
Lo
ad.
L(
N)
0 50 100 150 200 250 300
Depth, h (nm)
0
200
400
600
800
1000
Lo
ad.
L(
N)
0 50 100 150 200 250 300
Depth, h (nm)
0
200
400
600
800
1000
Lo
ad.
L(
N)
0 50 100 150 200 250 300
Depth, h (nm)
0
200
400
600
800
1000
Lo
ad.
L(
N)
Depth
Lo
adInfinite half-space
Assess hardness and
elastic modulus0
0
A
PH
0A
SEeff
d
d
s
s
eff EEE
22 1111
S
1
P0
A0

Nanoindentation Procedure for
Wood• Nanoindentation surface prepared on
surface remaining after 2 µm-thick XFM
section removed
• Nanoindentation
• Hysitron TriboIndenter equipped with a
Berkovich tip
• Relative humidity (RH) controlled with RH
generator
• RH = 78% and dry air (<1%)
• Room Temperature
• 20-23°C
• Multiload indents
• Structural compliance method utilized• Jakes et al. (2008) J. Mater. Res. 23(4) pp. 1113.• Jakes et al. (2009) J. Mater. Res. 24(3) pp. 1016.
C
A
C
B
A
5 µm
A: S2 cell wall laminae
(S2CWL)
B: Compound corner middle
lamella (CCML)
C: Empty lumina

PF-filled lumen
Empty lumen
Empty lumenEmpty lumen
2 µm2 µm
Atomic force
microscopy (AFM)
images of residual
indents

PF-filled lumen
Empty lumen
Empty lumenEmpty lumen
2 µm2 µm
78%
RH
Structural compliance method used
to correct load-depth trace for edge
effects and specimen-scale flexing
Hardness (H) and elastic modulus
(Es) assessed from last seven
unloading slopes and averaged

PF-filled lumen
Empty lumen
Empty lumenEmpty lumen
2 µm2 µm
Dry air
78%
RH
Structural compliance method used
to correct load-depth trace for edge
effects and specimen-scale flexing
Hardness (H) and elastic modulus
(Es) assessed from last seven
unloading slopes and averaged

PF-filled lumen
Empty lumen
2 µm
Br XFM
image(log scale)
Zn XFM image
used as aid to
locate cell walls
10-4
10-3
10-2
10-1
100

PF-filled lumen
Empty lumen
2 µm
Br XFM
image(log scale)
10-4
10-3
10-2
10-1
100
Define ROI’s with
multiple indents
equidistant from
lumen edge
Zn XFM image
used as aid to
locate cell walls

0.00 0.05 0.10 0.15 0.20 0.25
Br signal normalized to neat PF
200
300
400
500
600
700
800
H(M
Pa
)
10
15
20
25
30
Es
(GP
a)
45 min85 min115 min135 min155 min
0.00 0.05 0.10 0.15 0.20 0.25
Br signal normalized to neat PF
200
300
400
500
600
700
800
H(M
Pa
)
10
15
20
25
30
Es
(GP
a)
45 min85 min115 min135 min155 min
Dry air 78% RH
Each symbol type represents a different series
Each data point represents average properties within ROI

0.00 0.05 0.10 0.15 0.20 0.25
Br signal normalized to neat PF
200
300
400
500
600
700
800
H(M
Pa
)
10
15
20
25
30
Es
(GP
a)
45 min85 min115 min135 min155 min
0.00 0.05 0.10 0.15 0.20 0.25
Br signal normalized to neat PF
200
300
400
500
600
700
800
H(M
Pa
)
10
15
20
25
30
Es
(GP
a)
45 min85 min115 min135 min155 min
Dry air 78% RH
0.00 0.05 0.10 0.15 0.20 0.25
Br signal normalized to neat PF
0.8
1.0
1.2
1.4
1.6
1.8
No
rma
lize
dH
0.6
0.8
1.0
1.2
1.4
1.6
No
rma
lize
dE
s
45 min85 min115 min135 min155 min
0.00 0.05 0.10 0.15 0.20 0.25
Br signal normalized to neat PF
0.8
1.0
1.2
1.4
1.6
1.8
No
rma
lize
dH
0.6
0.8
1.0
1.2
1.4
1.6
No
rma
lize
dE
s
45 min85 min115 min135 min155 min

Summary
• Synchrotron-based XFM has sensitivity and spatial resolution to map out Br-labeled PF infiltrated into wood cell walls
• Higher MW PF (longer cook times) infiltrate less into cell walls near bondline
• Hardness and elastic modulus directly proportional to PF infiltration
• PF infiltration decreases moisture-induced softening of wood cell walls
Jakes, J.E., S.-C. Gleber, S. Vogt, C.G. Hunt, D. Yelle, W. Grigsby, C. Frihart. 2013. New
syncrotron-based technique to map adhesive infiltration in wood cell walls. In the Proceedings
of 36th Annual Meeting of the Adhesion Society held in Daytona Beach, FL, USA on March 3-6,
2013. Available online at http://adhesionsociety.org/program2013/

Wood Bonding and Moisture-
Induced Swelling
Stabilized
wood
surface
Adhesive
flexibility
Wood
Adhesive
High interfacial strain during moisture-induced
swelling can lead to bond failure
Wood
C.R. Frihart, Journal of Adhesion Science and
Technology, 2009, 23, pp 611–27.
Wood cells
Adhesive
Need methods for
cell walls
characterization

Wood Bonding and Moisture-
Induced Swelling
Stabilized
wood
surface
Adhesive
flexibility
Wood
Adhesive
High interfacial strain during moisture-induced
swelling can lead to bond failure
Wood
C.R. Frihart, Journal of Adhesion Science and
Technology, 2009, 23, pp 611–27.
We have methods
to map adhesives
and assess
hygromechanical
properties of cell
walls

Wood Bonding and Moisture-
Induced Swelling
High interfacial strain during moisture-induced
swelling can lead to bond failure
We have methods
to map adhesives
and assess
hygromechanical
properties of cell
walls
Possible mechanisms to stabilize wood surface:
• Adhesive infiltration modifies water sorption
behavior of cell wall
• Chemical change (e.g. less –OH groups)
• Mechanical bulking
• Stronger cell walls swell less
• Increased strength from less water or
chemical modification?

Wood Bonding and Moisture-
Induced Swelling
High interfacial strain during moisture-induced
swelling can lead to bond failure
We need methods
to quantify effect of
adhesive infiltration
on moisture-
induced swelling in
cell walls
Fundamental research questions:
• What is cell wall ultrastructure?
• How does cell wall swell with moisture?
• How does adhesive penetration modify
moisture-induced swelling at cell wall level?
• How are moisture-induced swelling forces
generated?
• What is the most efficient method to stabilize
wood surface?
• Increase or decrease mechanical
properties?
• Bulk cell walls? (whole cell different than
cut cell?)
• Chemically modify cell wall polymers?
• How deep into wood does stabilization need
to occur?

PF-filled lumen
Empty lumen
2 µm
10-4
10-3
10-2
10-1
100
Acknowledgements:•Tom Kuster (FPL) for SEM work
Questions?