mappetizer for arcgis
TRANSCRIPT
1
Mappetizer for ArcGIS
Web Mapping with Vector Technology
Manual - Version 13.0
Mappetizer is a tool for ArcGIS by ESRI. It gives you the opportunity to convert a data frame
within ArcMap into a HTML5 web application. You can then use these files to publish them on
the Web or on CD-ROM or DVD, or on your local machine. HTML5 and SVG (Scalable Vector
Graphics) give you the opportunity to produce high accurate cartographic maps.
Homepage:
www.mappetizer.de/en
uismedia
Unterer Öschweg 16/1
D-88427 Bad Schussenried
Phone: (++49) (0)7583 / 37 54 65
Fax: (++49) (0) 7583 / 37 54 66
www.uismedia.de
© 2016 uismedia
2
Table of Contents
1 Introduction ....................................................................................................................................... 4
1.1 Mappetizer for ArcGIS ............................................................................................................. 4
1.2 Product History ........................................................................................................................ 5
1.3 SVG und XML .......................................................................................................................... 5
1.4 Deep-Zoom Technology .......................................................................................................... 6
1.5 Dojo Toolkit .............................................................................................................................. 6
2 System Requirements and Installation ............................................................................................. 6
2.1 System Requirements ............................................................................................................. 6
2.2 Installation ................................................................................................................................ 6
2.3 Licensing .................................................................................................................................. 7
2.4 Loading in ArcMap ................................................................................................................... 7
2.5 Uninstalling .............................................................................................................................. 7
3 Making your ArcMap map ready for Export ...................................................................................... 7
3.1 Document Properties (File -> Map Document Properties) ...................................................... 8
3.2 Bookmarks ............................................................................................................................... 8
3.3 Data Frame Properties ............................................................................................................ 8
3.4 Layer Properties ...................................................................................................................... 9
3.5 Optimize your Map for Export ................................................................................................ 12
3.6 Data Graphs .......................................................................................................................... 12
4 The Mappetizer Export Assistant .................................................................................................... 12
4.1 Layer ...................................................................................................................................... 14
4.1.1 Object Information ............................................................................................................. 14
4.1.2 Display ............................................................................................................................... 18
4.1.3 Legend ............................................................................................................................... 21
4.1.4 Chart settings (expert mode) ............................................................................................. 23
4.1.5 Raster settings ................................................................................................................... 23
4.2 Basemaps .............................................................................................................................. 24
4.3 Web Services ......................................................................................................................... 24
4.4 Graphs ................................................................................................................................... 25
4.5 Document .............................................................................................................................. 26
4.5.1 General .............................................................................................................................. 26
4.5.2 Map .................................................................................................................................... 26
4.5.3 Components ...................................................................................................................... 27
4.5.4 Search tools ....................................................................................................................... 29
3
4.5.5 Metainformation ................................................................................................................. 30
4.5.6 Raster settings ................................................................................................................... 31
4.6 Layout .................................................................................................................................... 32
4.6.1 General .............................................................................................................................. 32
4.6.2 Design ................................................................................................................................ 32
4.6.3 Title / Legend (expert mode) ............................................................................................. 34
4.6.4 Slider / Layer in Combobox ............................................................................................... 35
5 Optional Extensions ........................................................................................................................ 35
5.1 Slider Bar ............................................................................................................................... 35
5.2 Database Access ................................................................................................................... 35
6 Further settings ............................................................................................................................... 35
6.1 Adding own Scripts ................................................................................................................ 35
6.2 Use of internal functions ........................................................................................................ 35
6.2.1 Global Object mv_Doc ....................................................................................................... 35
6.2.2 Global Object mv_Map ...................................................................................................... 36
6.2.3 Function mv_zoomToExtent(xMin,xMax,yMin,yMax,zoomBorder) ................................... 36
6.2.4 Function mv_alert(myText) ................................................................................................ 37
6.2.5 Function mv_userInit ......................................................................................................... 37
6.3 Adding own Tools to the Toolbar ........................................................................................... 37
6.4 File addressmatch.xml, designmanagement.xml, basemaps.xml, language.xml ................. 38
7 The Map in the Browser .................................................................................................................. 40
8 Information about the Demo Version .............................................................................................. 40
9 Technical Support ........................................................................................................................... 40
9.1 ContactingTechnical Support ................................................................................................ 40
9.2 Known Issues ........................................................................................................................ 41
9.3 Frequently Asked Questions ................................................................................................. 41
4
1 Introduction
1.1 Mappetizer for ArcGIS
Mappetizer is a tool for ArcGIS by ESRI. It gives you the opportunity to convert maps within
ArcMap into a HTML5 web map. You can then use these files to view them on your local
machine and to publish them on the Web or on CD-ROM/DVD.
To display the results, you do not need any additional software on your Web server.
The result of an export is simply a folder with several XML, SVG, Javascript and HTML files,
which can be stored anywhere.
Especially for small and medium-sized project, and for projects which do not have to be
frequently updated, Mappetizer will be the solution. With its wide field of application, the easy
use of the exported Web map project, you are able to present your GIS data easy, appealing
and innovative to a large target group. You don't have to have any knowledge in SVG, Microsoft
Silverlight or Web server technology.
With only a few steps your web mapping application is ready to go!
You do not need any skills in programming or web server technology.
Mappetizer offers you the many functions:
• Turn on and off individual layers
• Report object information of ArcGIS layers
• Report attribute table of ArcGIS layers
• Display diagrams
• Finding features by building a query expression
• Mapscale dependent view of layers
• View the map in an individual scale
• Hot-Links for E-Mail and other URL-addresses (internal and external links)
• MapTips
• Scale bar and overview map
• Coordinate Read-out
• Measurement tools
• Data graphs
• Point clustering
• Support of WMS and other map services (BingMaps, OSM, ArcGIS Map Services)
• As an optional feature Mappetizer offer the possibility to use database tables for storing
the attribute data. For this feature a WebServer is needed.
There are many fields of use, environment, tourism, education, forestry and agriculture,
defense, health, public services, real estate:
• Cost-saving publication of interactive mapping applications on the Internet, with no
need of additional software on the Web server
• Creation of cheap GIS working places
• Cost-saving delivery of (GIS-) data
5
1.2 Product History
The idea for Mappetizer (formerly MapViewSVG) came up in 2001, when we figured out that
with SVG a revolutionary new web standard exists which allows for the first time vector based
interactive graphics for the internet.
The advantage compared to other vector based solution (Flash, Silverlight) is, that SVG is a
web standard, a W3C Recommendation, which is nowadays supported natively within all
browsers.
Mappetizer uses right from the beginning web technologies, which are detected from other web
developers quite recently as revolutionary: AJAX und DHTML.
In summer 2002 we delivered MapViewSVG as an extension for ArcView GIS 3.1. Within the
development of ArcGIS (ArcView 8) from ESRI we also developed MapViewSVG/Mappetizer as
an extension to this product. With Mappetizer for ArcGIS 10 we now can offer you this popular
extension also for ArcGIS 10 from ESRI.
1.3 SVG und XML
Mappetizer supports vector based object data and image data. Image data are displayed in
GIF, PNG or JPEG format in the web browser. All vector based objects and all text objects are
converted into the SVG format and are infinitely zoomable without losing cartographic quality.
Scalable Vector Graphics (SVG) is a family of specifications of an XML-based file format for
describing two-dimensional vector graphics, both static and dynamic (i.e. interactive or
animated). The SVG specification is an open standard and has been developed by the World
Wide Web Consortium (W3C). The SVG standard is a W3C Recommendation.
SVG images and their behaviors are defined in XML text files. This means that they can be
searched, indexed, scripted and, if required, compressed.
To display the results, you do not need any browser plug-in.
6
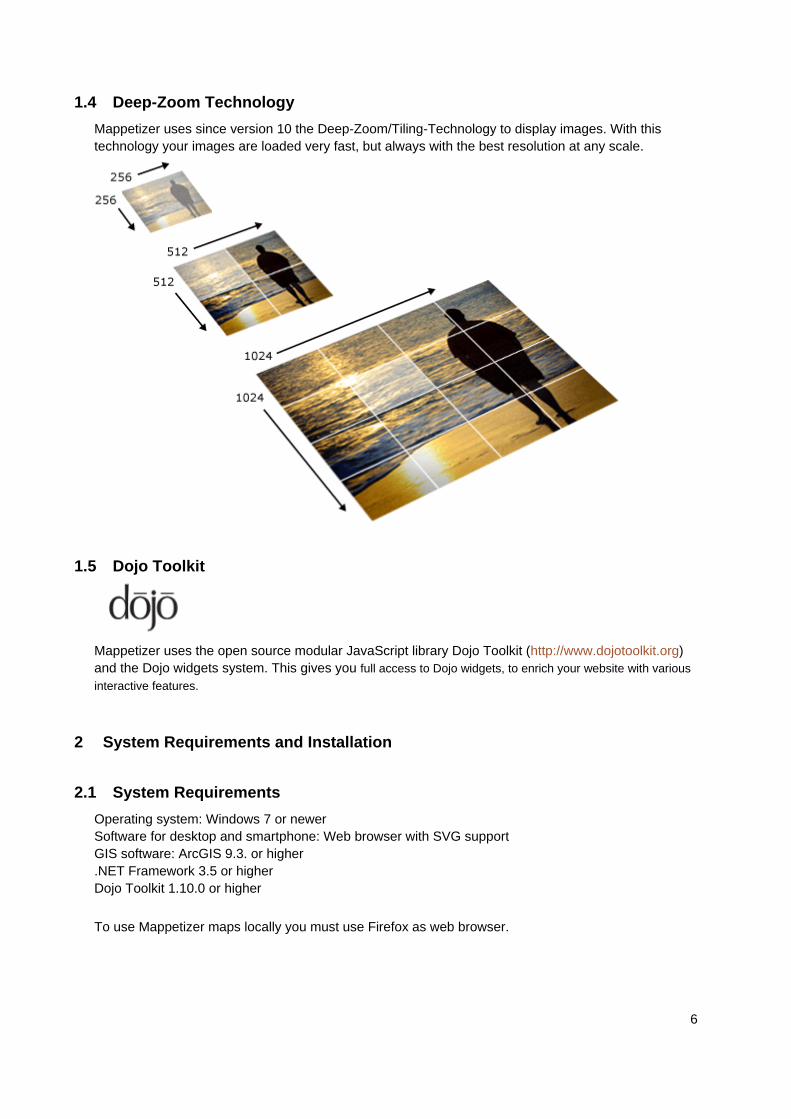
1.4 Deep-Zoom Technology
Mappetizer uses since version 10 the Deep-Zoom/Tiling-Technology to display images. With this
technology your images are loaded very fast, but always with the best resolution at any scale.
1.5 Dojo Toolkit
Mappetizer uses the open source modular JavaScript library Dojo Toolkit (http://www.dojotoolkit.org)
and the Dojo widgets system. This gives you full access to Dojo widgets, to enrich your website with various
interactive features.
2 System Requirements and Installation
2.1 System Requirements
Operating system: Windows 7 or newer
Software for desktop and smartphone: Web browser with SVG support
GIS software: ArcGIS 9.3. or higher
.NET Framework 3.5 or higher
Dojo Toolkit 1.10.0 or higher
To use Mappetizer maps locally you must use Firefox as web browser.
7
2.2 Installation
The installation of Mappetizer for ArcGIS is different for ArcGIS 10 and for ArcGIS 9.3.
ArcGIS 10.x:
Mappetizer for ArcGIS will be installed as ArcGIS-Addin. The installation will be done for the current
user and needs no administrator rights.
Start the setup program with a double click. Read the licensing agreement and agree. The setup will
now install the ArcGIS-AddIn for you.
ArcGIS 9.3:
You need administrator rights to install Mappetizer for ArcGIS 9.3. The software is usable for all users
after installation.
Start the setup program with a double click. Read the licensing agreement and agree. Choose the
installation folder. The setup will now install all necessary files for you.
2.3 Licensing
If you do not have a licensing file yet, a demo version of Mappetizer for ArcGIS is loaded.
After purchasing a commercial license, you can convert the software to the full
version with all functions without a new installation. To archive this choose in the
menu bar the menu point „Help->Import your license“.
Mappetizer use several tools which have own license terms. The following tools are used by
Mappetizer:
• ImageMagick (http://www.imagemagick.org/)
• DeepZoomComposer (http://www.microsoft.com/en-us/download/details.aspx?id=24819)
• DotNetZip Library and Tools (http://dotnetzip.codeplex.com/license)
• Smith HTML Editor (http://smithhtmleditor.codeplex.com/license)
• GongSolutions.Wpf.DragDrop library (https://github.com/punker76/gong-wpf-dragdrop)
Mappetizer offer basemaps from several providers. You do not have the license for the usage of these
basemaps when you own a license of Mappetizer. Please have a look on the license terms of the
providers.
2.4 Loading in ArcMap
Start ArcMap from ESRI.
2.5 Uninstalling
Uninstalling Mappetizer can be done by using the entry „Uninstall Mappetizer“, which can be found
under the program group Mappetizer for ArcGIS. Or you can go to the control panel and use “Add or
Remove Programs” or “Programs and Features”.
3 Making your ArcMap map ready for Export
Basically all visible layers of your map (Personal geodatabase, CAD dataset, Coverages, Shapefiles,
Layers, ArcSDE Connection, Raster image, Raster Catalog) are exported, as far as their symbol types
are supported by Mappetizer. So, all vector based feature data ("Point", "PolyLine", "Polygon" and
"MultiPoint"), rasters, and texts are supported. Beyond this, joins to database and feature tables are
8
supported.
While all images are presented as GIF, JPEG's or PNG's in the browser, all vector based data and the
text-layers are transformed in the SVG format. WMS-Layer are supported as Web Map Services on
the base of the OGC-standard specification. Tile layers (like OpenStreetMap, Bing Map or ArcGIS
Online Map Services) are also supported.
Basemaps and Web Services are only available for export if you have chosen WGS 1984 Web
Mercator as coordinate system for your data frame.
Besides symbology and different layer types of ArcMap a lot of other settings which you have done in
ArcMap are taken over:
3.1 Document Properties (File -> Map Document Properties)
1. Author
This information will be shown in the Mappetizer wizard in the text field "Author".
2. Description
This information will be shown in the Mappetizer wizard in the text field "Comment on Map", if
there are no settings made in the Data Frame Properties/Description.
3. Credits
Credits will be displayed on the map (lower right corner)
4. Hyperlink base
This is supported within Mappetizer.
3.2 Bookmarks
Spatial bookmarks of type "AOIBookmark" are supported within Mappetizer.
3.3 Data Frame Properties
The following properties are factored in:
1. Name (tab General)
The name of the Data Frame is the title of your Web mapping project. If you don't need a title
remove it here.
2. Description (tab General)
This information will be shown in the Mappetizer wizard in the text field "Comment on Map".
3. Map Units (tab General)
Due to the possibility of infinitely zooming of SVG files, the power of Mappetizer is, to show
your map in a user defined scale (similar to ArcMap to display the map in a specific scale).
Choose the appropriate unit.
4. Display Units (tab General)
Choose the appropriate unit for your scale bar and the measurement tools.
5. Clip to Shape (tab Data Frame)
The Mappetizer wizard use this information when exporting the current data frame.
6. Background (tab Frame)
The Mappetizer wizard use the background color for the exported map.
9
3.4 Layer Properties
The following properties are factored in:
1. Layer Name
The name of the layer will be drawn right of the check box in the legend.
2. Description
The Info-Icon will be drawn right to the turn on/off icon in the legend. When you click on it the
description about the layer noted in ArcMap will be shown.
3. Scale Range
Mappetizer takes over your settings for the minimum and maximum scale (except for the Map Unit
"decimal degrees").
4. Fields
If you want to display information about features (e.g. "Identifying Features on the Map") in
your map, Mappetizer will consider those fields which are set to visible (not the Shape field and
the FID field). Aliases are taken over, if they are set.
On programming reasons (JavaScript) the following characters in the field names are not
transformed if you choose the Query Builder: " ' ( ).
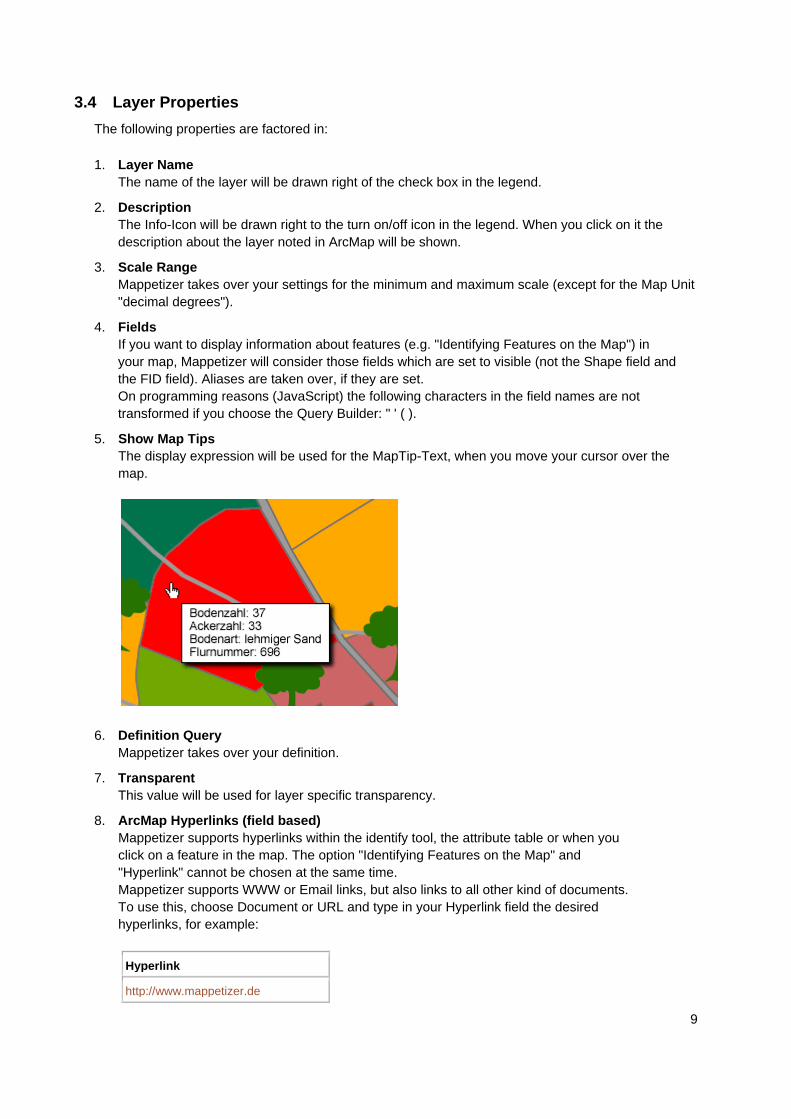
5. Show Map Tips
The display expression will be used for the MapTip-Text, when you move your cursor over the
map.
6. Definition Query
Mappetizer takes over your definition.
7. Transparent
This value will be used for layer specific transparency.
8. ArcMap Hyperlinks (field based)
Mappetizer supports hyperlinks within the identify tool, the attribute table or when you
click on a feature in the map. The option "Identifying Features on the Map" and
"Hyperlink" cannot be chosen at the same time.
Mappetizer supports WWW or Email links, but also links to all other kind of documents.
To use this, choose Document or URL and type in your Hyperlink field the desired
hyperlinks, for example:
Hyperlink
http://www.mappetizer.de
10
C:\project\example.pdf; Example
../example.pdf
../../projekt/index.asp?ID=<<station>>
js:myFunction('example.html')
js:myFunction(<<station>>)
Mappetizer automatically analyses the information of each cell, e.g. external link
(http://www.mappetizer.de), E-Mail ([email protected]) or a relative link (../oak.gif). If you have a
reference to a local file on your machine (C:\project\example.pdf) this file will be copied in your
Mappetizer project and will be linked. Starting point for relative path names is the Mappetizer
project folder.
You can also add links to server-side scripts, e.g. to realize queries to a database on your server.
The parameter will be joined via the GET method to the URL. To create the link to your script give
in your data in the form "path/filename?variable=<<fieldname>>". Replace "path/filename" to your
own file on your server and your own variable name instead of "variable". Replace "fieldname" by
a field in your attribute table (e.g. ../../project/index.asp?ID=<<station>>).
Mappetizer also supports own javascript code, e.g. js:myFunction('example.html'). Strings as
parameter must be quoted with a single quote. You can add your code to the file "variablen.js" if
you like. Beyond this you have the possibility to add object related variables to your javascript
function, like js:myFunction(<<fieldname>>). Replace "fieldname" by a field in your attribute table.
To show Mappetizer that you want to use javascript code, add "js:" in front of the name of the
function.
9. ArcMap Hyperlinks (project based)
Project based hyperlinks in ArcMap will be supported like automatically generated hyperlinks (see
below).
10. Automatically generated Hyperlinks
Beside hyperlinks which are defined within ArcMap, Mappetizer also interprets WWW-
compatible hyperlinks (e.g. http://www.uismedia.de, [email protected]) within the option
"Identifying features on the map" or "Attribute Table" in all other fields. Relative hyperlinks
(within your exported project) or links to local files on your machine are also supported. For this
the data set entry has to be for example:
url:myfolder/ruths-steakhouse/profile.pdf
url:myfolder/ginas-cafe/profile.pdf;Profile
url:C:\project\instructions.pdf
url:C:\project\instructions.pdf;Instructions
Links to javascript code is notated like above with js:myFunction('example.html').
After export you have to copy your folder "myfolder" with all subfolders and documents in the
Mappetizer export folder. References to local files on your machine will be copied automatically.
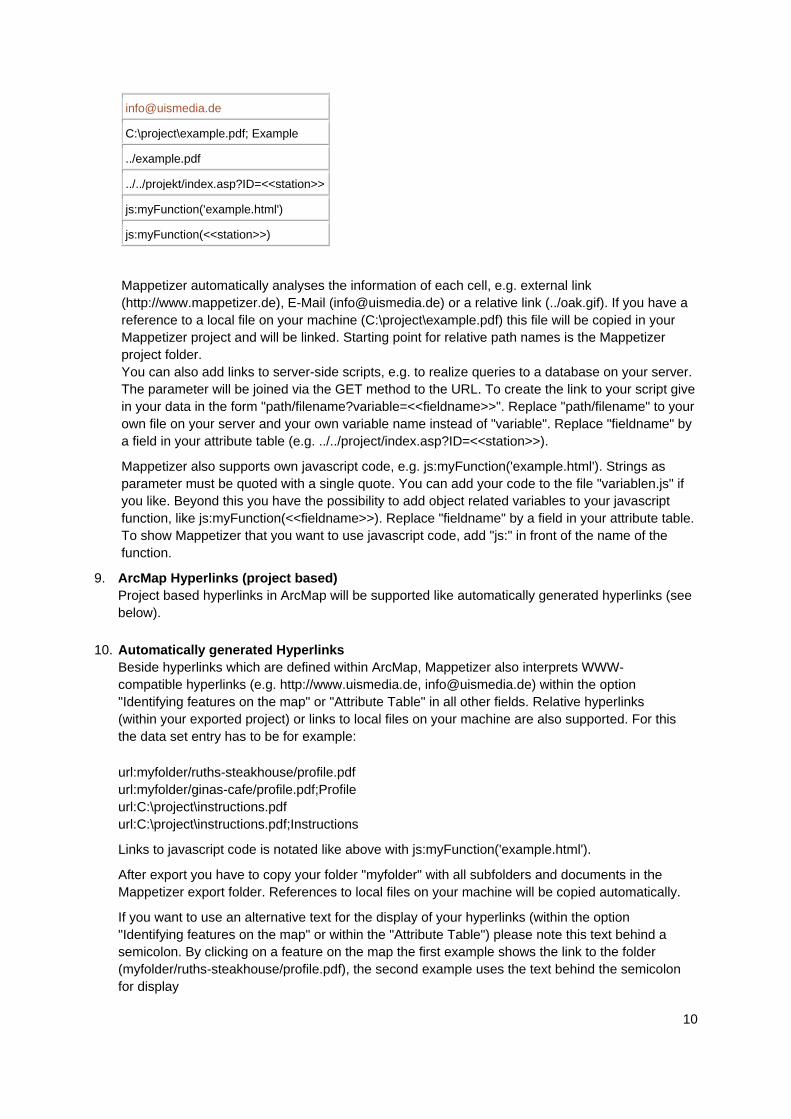
If you want to use an alternative text for the display of your hyperlinks (within the option
"Identifying features on the map" or within the "Attribute Table") please note this text behind a
semicolon. By clicking on a feature on the map the first example shows the link to the folder
(myfolder/ruths-steakhouse/profile.pdf), the second example uses the text behind the semicolon
for display
11
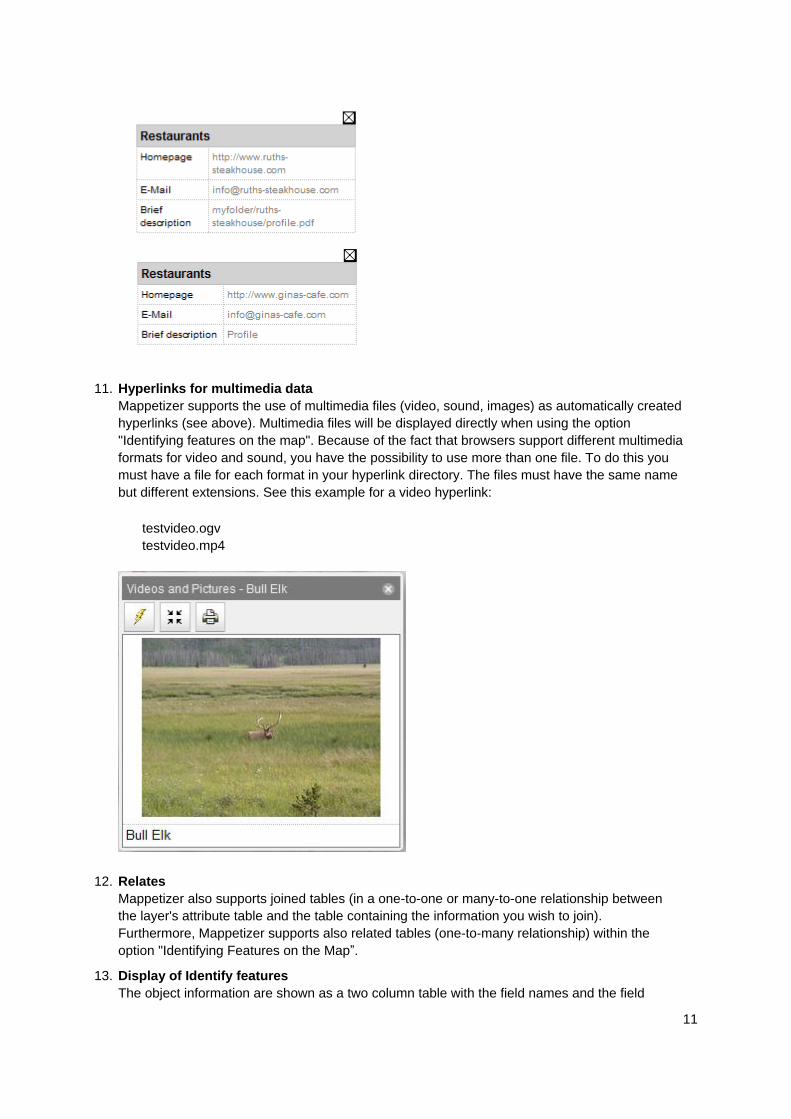
11. Hyperlinks for multimedia data
Mappetizer supports the use of multimedia files (video, sound, images) as automatically created
hyperlinks (see above). Multimedia files will be displayed directly when using the option
"Identifying features on the map". Because of the fact that browsers support different multimedia
formats for video and sound, you have the possibility to use more than one file. To do this you
must have a file for each format in your hyperlink directory. The files must have the same name
but different extensions. See this example for a video hyperlink:
testvideo.ogv
testvideo.mp4
12. Relates
Mappetizer also supports joined tables (in a one-to-one or many-to-one relationship between
the layer's attribute table and the table containing the information you wish to join).
Furthermore, Mappetizer supports also related tables (one-to-many relationship) within the
option "Identifying Features on the Map”.
13. Display of Identify features
The object information are shown as a two column table with the field names and the field
12
values by default. If you only wish the field values to be displayed check the box „Hide field
name column“ in the tab HTMLPopup (see „Display HTML formatting“ and „As a table of the
visible fields“).
14. Hide/Show legend
To wrap your heading text use “\n”. Click the plus or minus sign to the left of the layer name in the
table of contents, to show or hide its legend in your Web project as default setting.
3.5 Optimize your Map for Export
First the good news: Mappetizer does not restrict you in any way regarding of the amount of layers,
image data and hyperlinks. Due to the small sizes of the files there are also (probably) set no limits to
you. The bad news: each successful website takes care of the transfer of data and loading time
between the server and the client. That means at this moment:
• Try to keep the geometries of your layers as simple as possible (e.g. with using the dissolve
option in ArcMap).
• Use a Definition Query if not all features of a layer have to be exported. A feature will also be
exported - and therefore needs loading time - if it is just invisible or does not appear in the
legend because the option <all other values> is off.
• Use "Generalize geometry" in the Layers settings of the Mappetizer export wizard.
• Avoid complex graphic shapes (for example fjord coastlines), they load much slower in a Web
browser.
• Use sparingly image data or reduce them in size.
• Reduce the amount of fields in the attribute tables (make them invisible in the Layer
Properties).
• Use the possibilities of the Scale Ranges of layers: Make a simple layer of your features for
the initial state of loading and add one or more detailed layers for zoom in states.
• Mark some layer as not turned on while the page is loading.
3.6 Data Graphs
Mappetizer supports graphs which are created in ArcMap. Please read more in the ArcGIS Desktop
Help about creating a graph. At the moment Mappetizer supports bar graphs, line graphs and scatter
plots.
4 The Mappetizer Export Assistant
Make the data frame active which you want to export. Click the "Mappetizer-Export". The Mappetizer
export wizard will open. If your map does not contain any data or visible layers, the button or the menu
item will be grayed out.
The export wizard is divided into several sections:
13
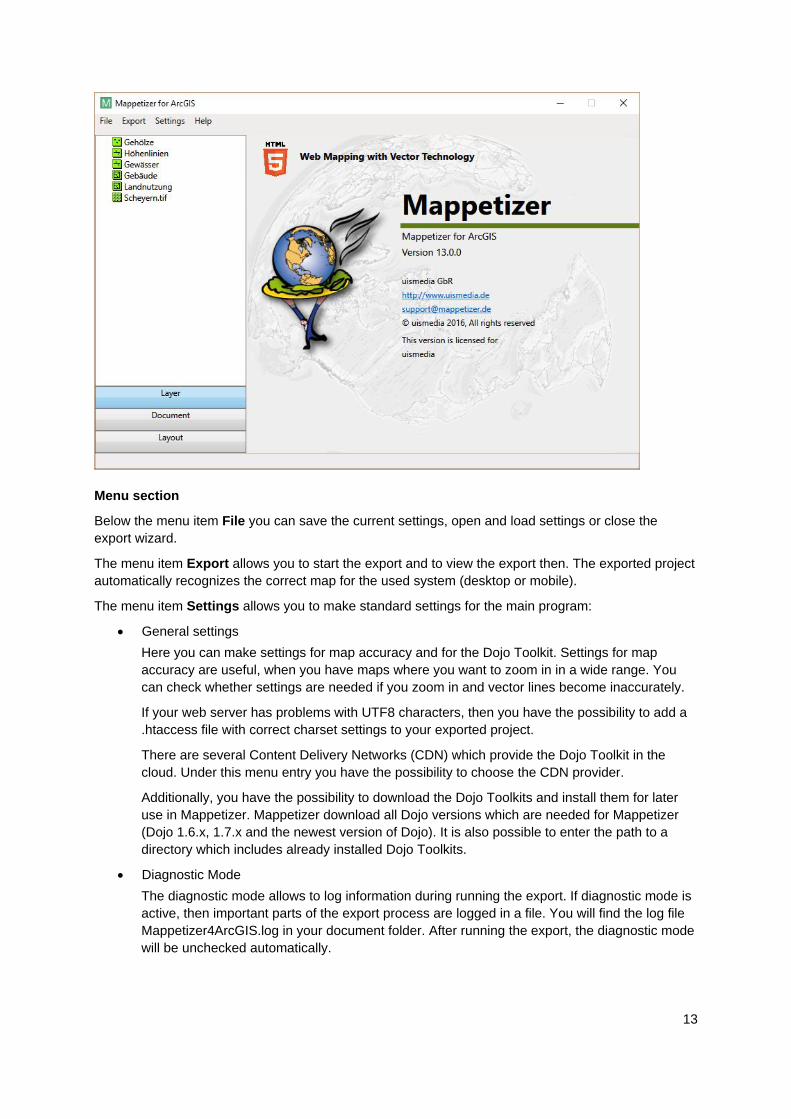
Menu section
Below the menu item File you can save the current settings, open and load settings or close the
export wizard.
The menu item Export allows you to start the export and to view the export then. The exported project
automatically recognizes the correct map for the used system (desktop or mobile).
The menu item Settings allows you to make standard settings for the main program:
• General settings
Here you can make settings for map accuracy and for the Dojo Toolkit. Settings for map
accuracy are useful, when you have maps where you want to zoom in in a wide range. You
can check whether settings are needed if you zoom in and vector lines become inaccurately.
If your web server has problems with UTF8 characters, then you have the possibility to add a
.htaccess file with correct charset settings to your exported project.
There are several Content Delivery Networks (CDN) which provide the Dojo Toolkit in the
cloud. Under this menu entry you have the possibility to choose the CDN provider.
Additionally, you have the possibility to download the Dojo Toolkits and install them for later
use in Mappetizer. Mappetizer download all Dojo versions which are needed for Mappetizer
(Dojo 1.6.x, 1.7.x and the newest version of Dojo). It is also possible to enter the path to a
directory which includes already installed Dojo Toolkits.
• Diagnostic Mode
The diagnostic mode allows to log information during running the export. If diagnostic mode is
active, then important parts of the export process are logged in a file. You will find the log file
Mappetizer4ArcGIS.log in your document folder. After running the export, the diagnostic mode
will be unchecked automatically.
14
• Expert Mode
If expert mode is unchecked (default), then you will only see needed functionalities when using
the export wizard. If you need more functionality, then activate this menu item.
Below the menu item Help you will find this manual as well as information about browsers, an online
help system and feedback functionalities. Additionally, you can license the product here.
Navigation area
On the left side of the wizard you will find the navigation area. Below, you can switch between the
different sections, Layer, Basemaps, Graphs, Web Services, Document and Layout. Above you
find for the specific sections, Layer, Graphs and Web Services the available options.
Functional area
Within the navigation area Layer, Document and Layout you have the possibility to make the settings
here. These settings are for the whole project. The settings within the navigation area Layer or
Basemaps are for the specific layer which you have selected before.
4.1 Layer
This section gives you the possibility to make settings for each layer in the ArcMap frame. The layer
type can be seen in different icons. There are four colors of the icons, which represents different states
of the layer:
• Grey
The layer is not activated in ArcMap. The layer is not part of the export. But you can choose
the layer as part of the overview.
• Green
The layer is valid and is part of the export.
• Orange
The layer is valid and is part of the export. But there are warning messages for the layer.
• Red
The layer is not valid and is not part of the export. There are error messages for the layer.
Moving the mouse over the layer gives you information about warning and error messages for this
layer. Select the layer by clicking. Now you can make settings for the layer.
The position of the layer can be changed. The position in tree view is the position in legend. It has no
influence on the drawing order. To move a layer, click and hold the left mouse button. Now move the
layer t the position you want.
4.1.1 Object Information
Available for feature layers only.
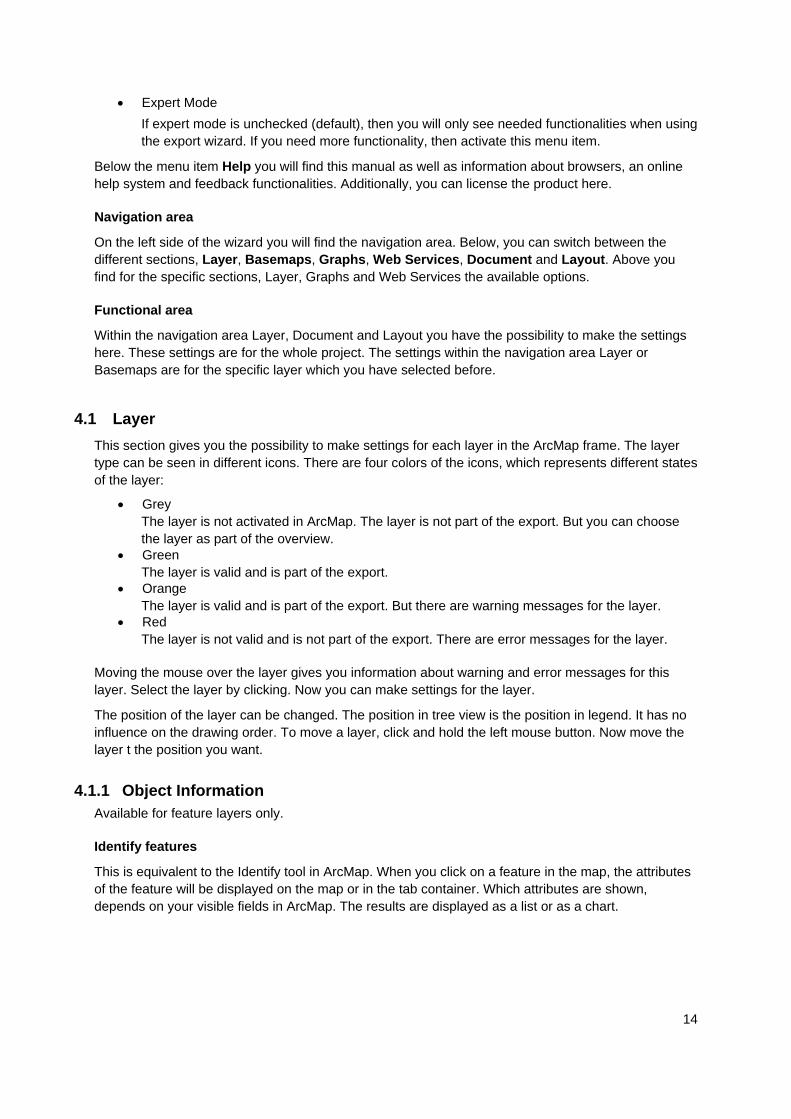
Identify features
This is equivalent to the Identify tool in ArcMap. When you click on a feature in the map, the attributes
of the feature will be displayed on the map or in the tab container. Which attributes are shown,
depends on your visible fields in ArcMap. The results are displayed as a list or as a chart.
15
Each result has a header. You can choose any field in your attribute table as the header (Field for
use in object titles).
In the list option the object information is shown as a two column table with the field names and the
field values by default. If you only wish the field values to be displayed check the box „Hide field name
column“ in ArcMap in the layer properties HTMLPopup (see also chapter layer properties).
Relates which are defined in ArcMap can be taken over in the list option.
Hint: Always those features will be shown, which are on top of the map; but these features must not
belong to the same layer: For example, if you have chosen this option for a line layer and at the same
time for a polygon layer, you will see the attributes for the line layer if you click on a line, you will see
the attributes for the polygon layer if you click on a polygon. Two overlaying polygon layers will always
show the attributes for the layer on the top, until the user does not have turned off this layer. If you
have a polygon layer on top which is only used for visualization (e.g. administration borders) make the
fill symbol for this layer transparent. If you do not have checked "Identifying features on the map" or
"Hotlinks" and have not added Map Tips to your layer in ArcMap, the identifying tool shows the
information of the theme below.
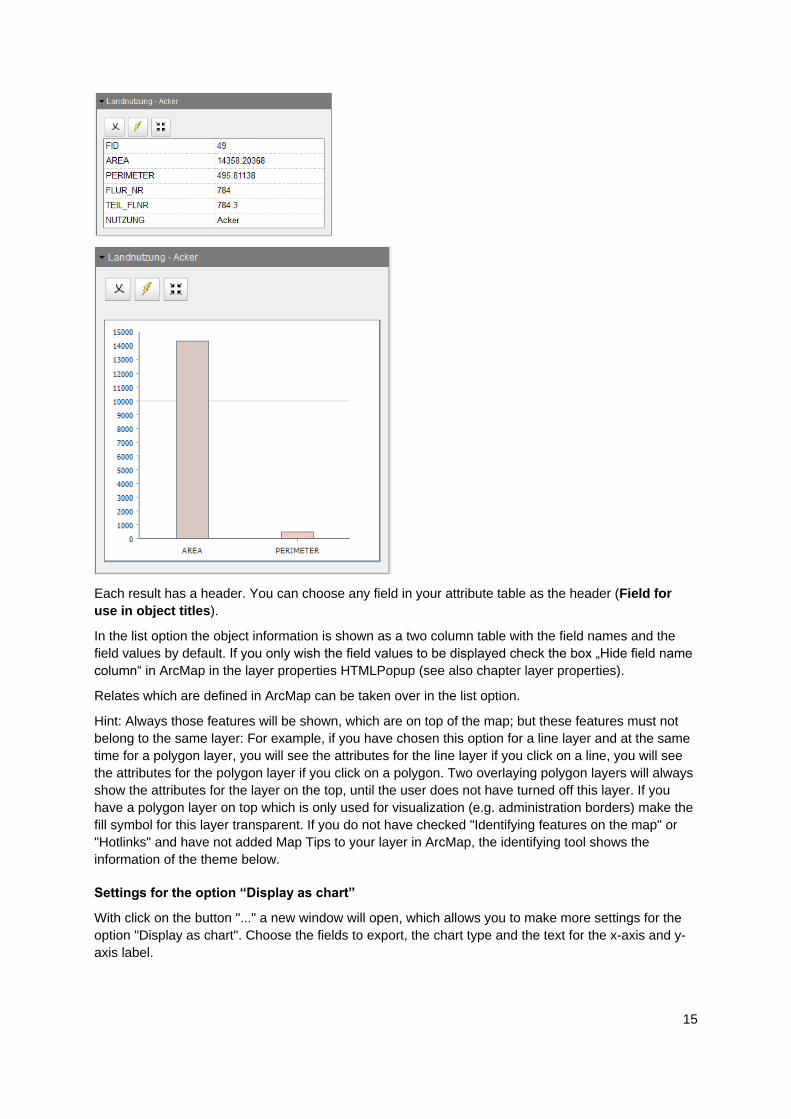
Settings for the option “Display as chart”
With click on the button "..." a new window will open, which allows you to make more settings for the
option "Display as chart". Choose the fields to export, the chart type and the text for the x-axis and y-
axis label.
16
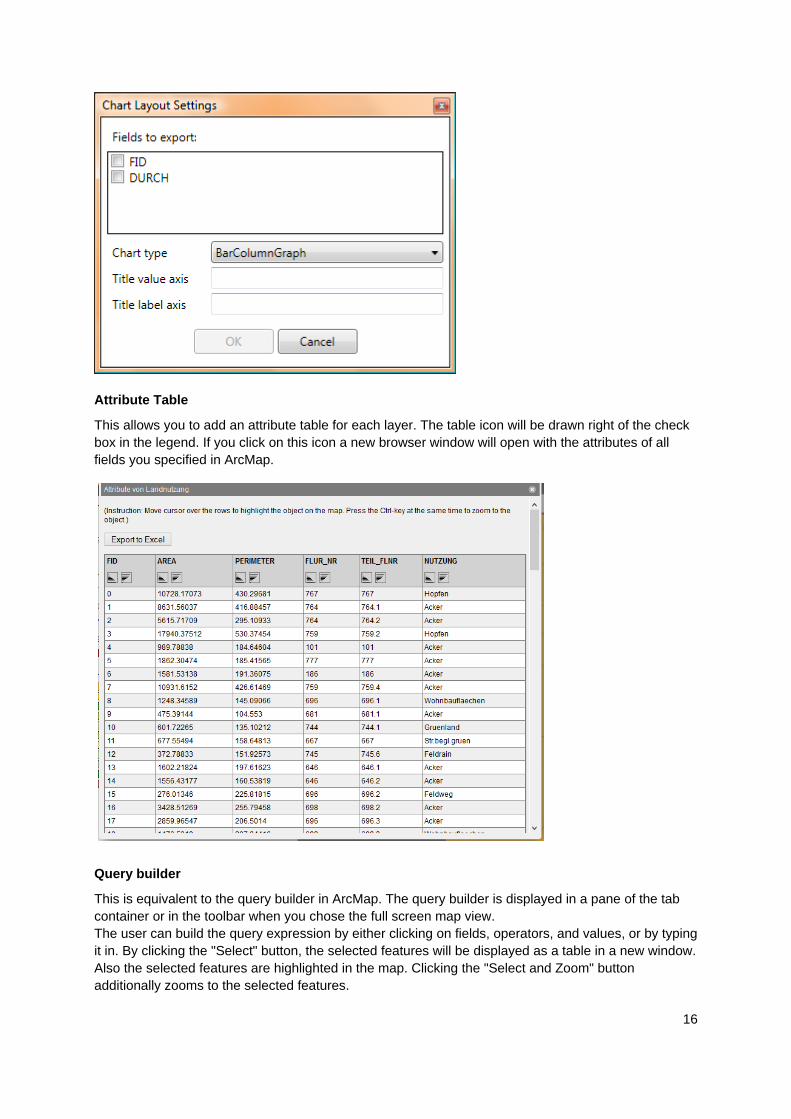
Attribute Table
This allows you to add an attribute table for each layer. The table icon will be drawn right of the check
box in the legend. If you click on this icon a new browser window will open with the attributes of all
fields you specified in ArcMap.
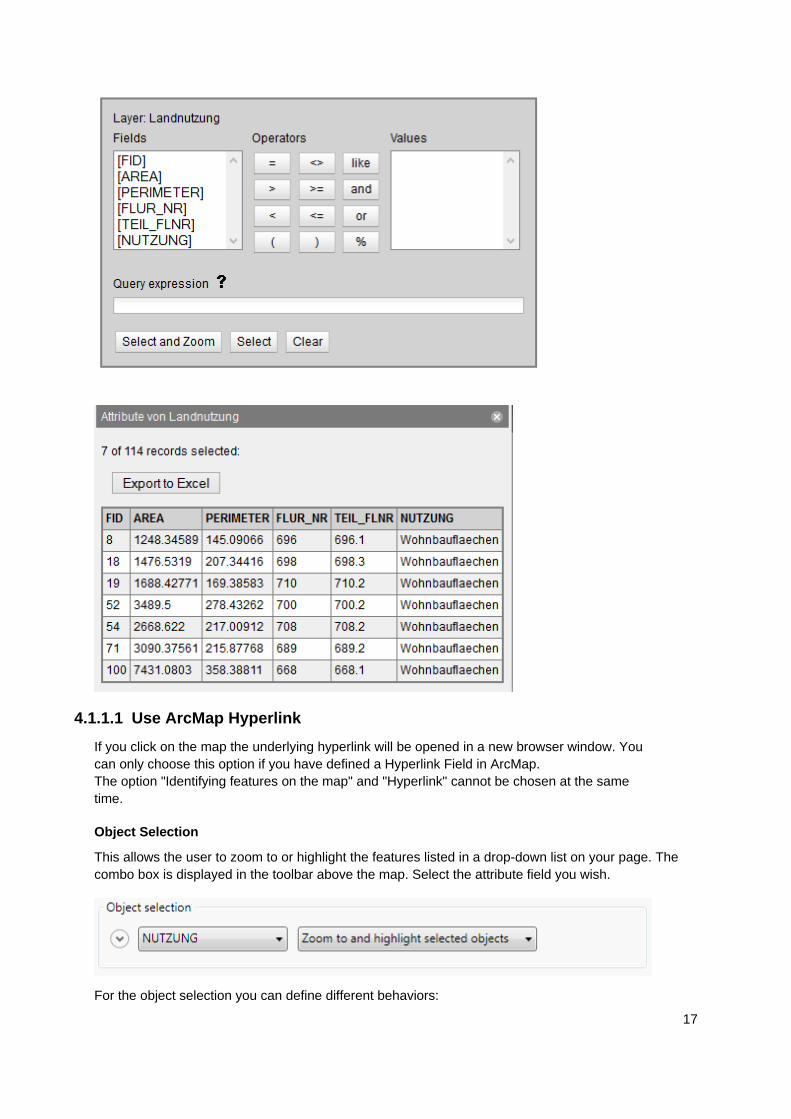
Query builder
This is equivalent to the query builder in ArcMap. The query builder is displayed in a pane of the tab
container or in the toolbar when you chose the full screen map view.
The user can build the query expression by either clicking on fields, operators, and values, or by typing
it in. By clicking the "Select" button, the selected features will be displayed as a table in a new window.
Also the selected features are highlighted in the map. Clicking the "Select and Zoom" button
additionally zooms to the selected features.
17
4.1.1.1 Use ArcMap Hyperlink
If you click on the map the underlying hyperlink will be opened in a new browser window. You
can only choose this option if you have defined a Hyperlink Field in ArcMap.
The option "Identifying features on the map" and "Hyperlink" cannot be chosen at the same
time.
Object Selection
This allows the user to zoom to or highlight the features listed in a drop-down list on your page. The
combo box is displayed in the toolbar above the map. Select the attribute field you wish.
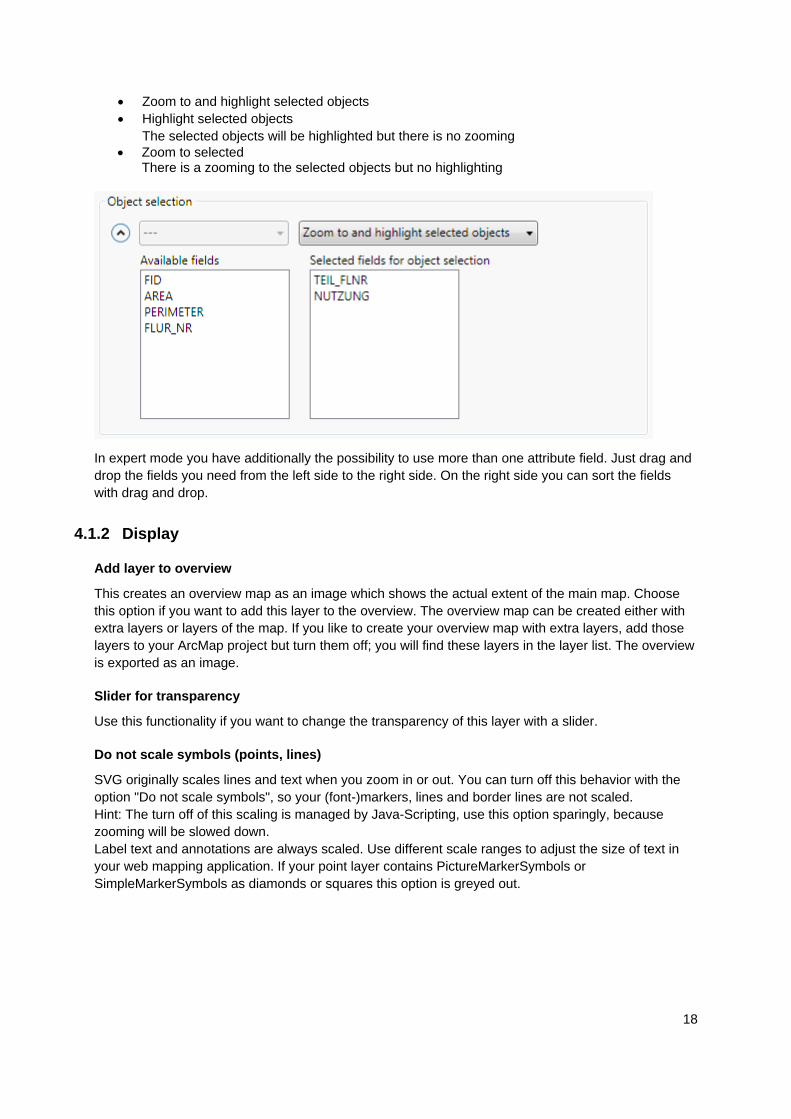
For the object selection you can define different behaviors:
18
• Zoom to and highlight selected objects
• Highlight selected objects
The selected objects will be highlighted but there is no zooming
• Zoom to selected There is a zooming to the selected objects but no highlighting
In expert mode you have additionally the possibility to use more than one attribute field. Just drag and
drop the fields you need from the left side to the right side. On the right side you can sort the fields
with drag and drop.
4.1.2 Display
Add layer to overview
This creates an overview map as an image which shows the actual extent of the main map. Choose
this option if you want to add this layer to the overview. The overview map can be created either with
extra layers or layers of the map. If you like to create your overview map with extra layers, add those
layers to your ArcMap project but turn them off; you will find these layers in the layer list. The overview
is exported as an image.
Slider for transparency
Use this functionality if you want to change the transparency of this layer with a slider.
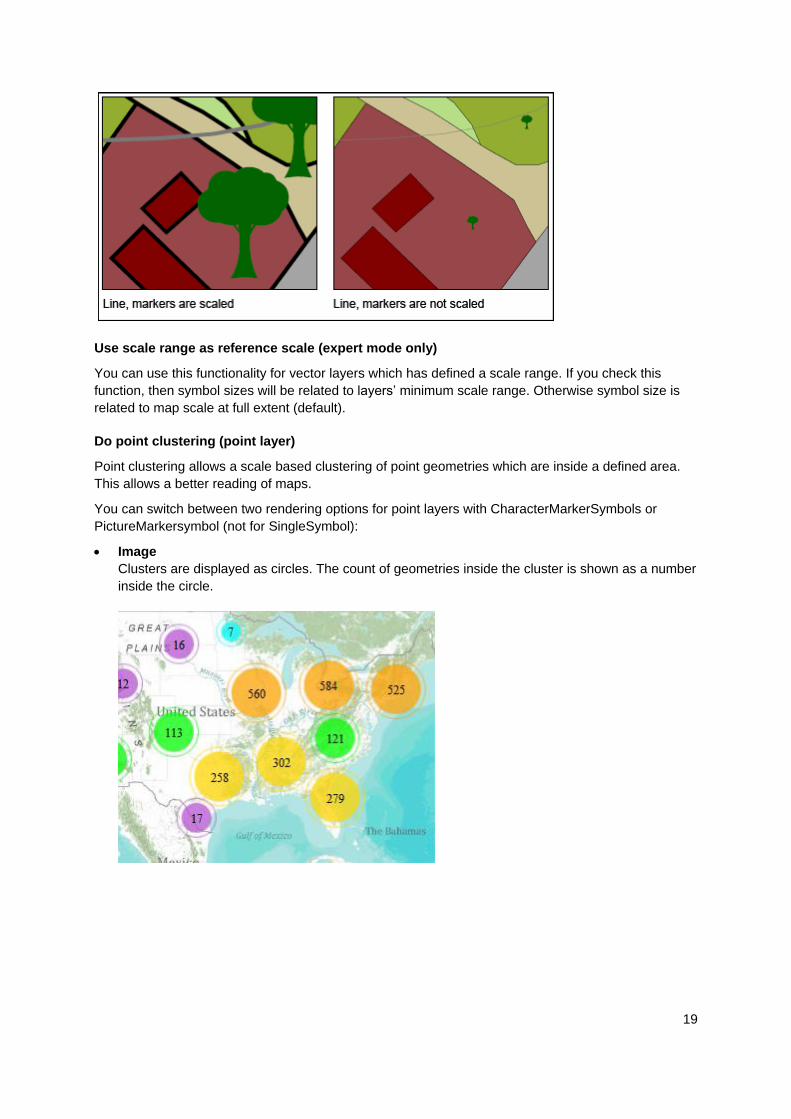
Do not scale symbols (points, lines)
SVG originally scales lines and text when you zoom in or out. You can turn off this behavior with the
option "Do not scale symbols", so your (font-)markers, lines and border lines are not scaled.
Hint: The turn off of this scaling is managed by Java-Scripting, use this option sparingly, because
zooming will be slowed down.
Label text and annotations are always scaled. Use different scale ranges to adjust the size of text in
your web mapping application. If your point layer contains PictureMarkerSymbols or
SimpleMarkerSymbols as diamonds or squares this option is greyed out.
19
Use scale range as reference scale (expert mode only)
You can use this functionality for vector layers which has defined a scale range. If you check this
function, then symbol sizes will be related to layers’ minimum scale range. Otherwise symbol size is
related to map scale at full extent (default).
Do point clustering (point layer)
Point clustering allows a scale based clustering of point geometries which are inside a defined area.
This allows a better reading of maps.
You can switch between two rendering options for point layers with CharacterMarkerSymbols or
PictureMarkersymbol (not for SingleSymbol):
• Image
Clusters are displayed as circles. The count of geometries inside the cluster is shown as a number
inside the circle.
20
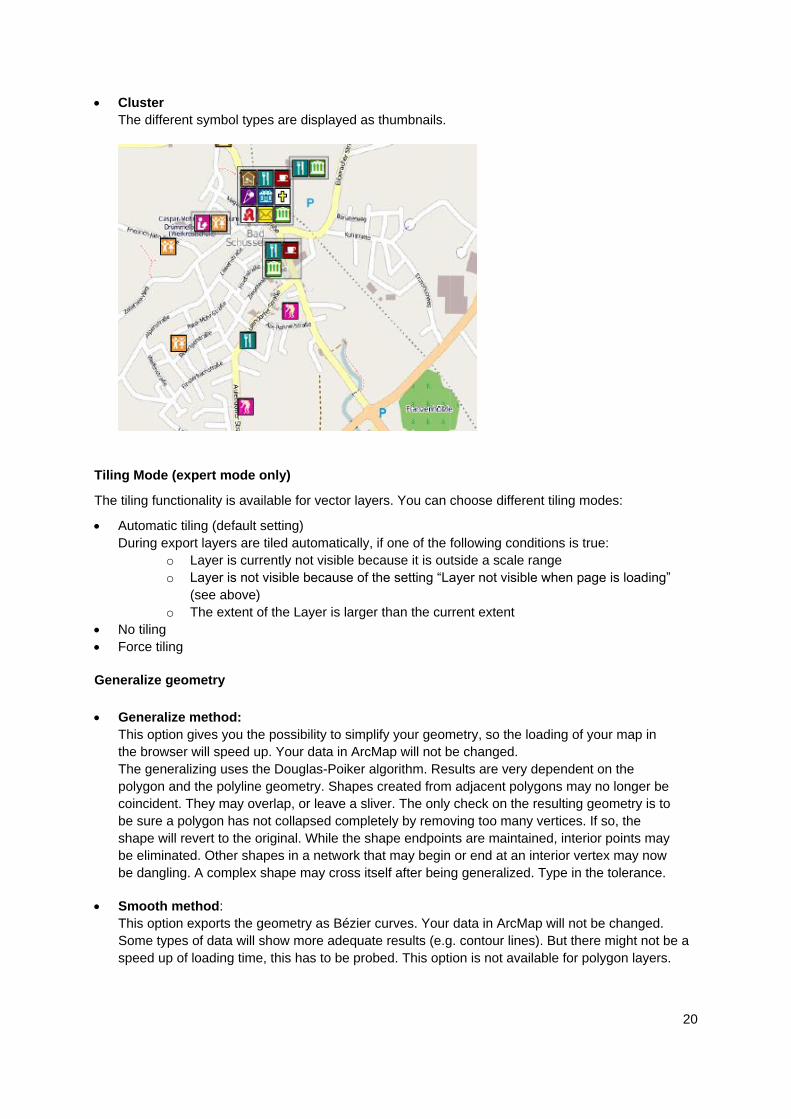
• Cluster
The different symbol types are displayed as thumbnails.
Tiling Mode (expert mode only)
The tiling functionality is available for vector layers. You can choose different tiling modes:
• Automatic tiling (default setting)
During export layers are tiled automatically, if one of the following conditions is true:
o Layer is currently not visible because it is outside a scale range
o Layer is not visible because of the setting “Layer not visible when page is loading”
(see above)
o The extent of the Layer is larger than the current extent
• No tiling
• Force tiling
Generalize geometry
• Generalize method:
This option gives you the possibility to simplify your geometry, so the loading of your map in
the browser will speed up. Your data in ArcMap will not be changed.
The generalizing uses the Douglas-Poiker algorithm. Results are very dependent on the
polygon and the polyline geometry. Shapes created from adjacent polygons may no longer be
coincident. They may overlap, or leave a sliver. The only check on the resulting geometry is to
be sure a polygon has not collapsed completely by removing too many vertices. If so, the
shape will revert to the original. While the shape endpoints are maintained, interior points may
be eliminated. Other shapes in a network that may begin or end at an interior vertex may now
be dangling. A complex shape may cross itself after being generalized. Type in the tolerance.
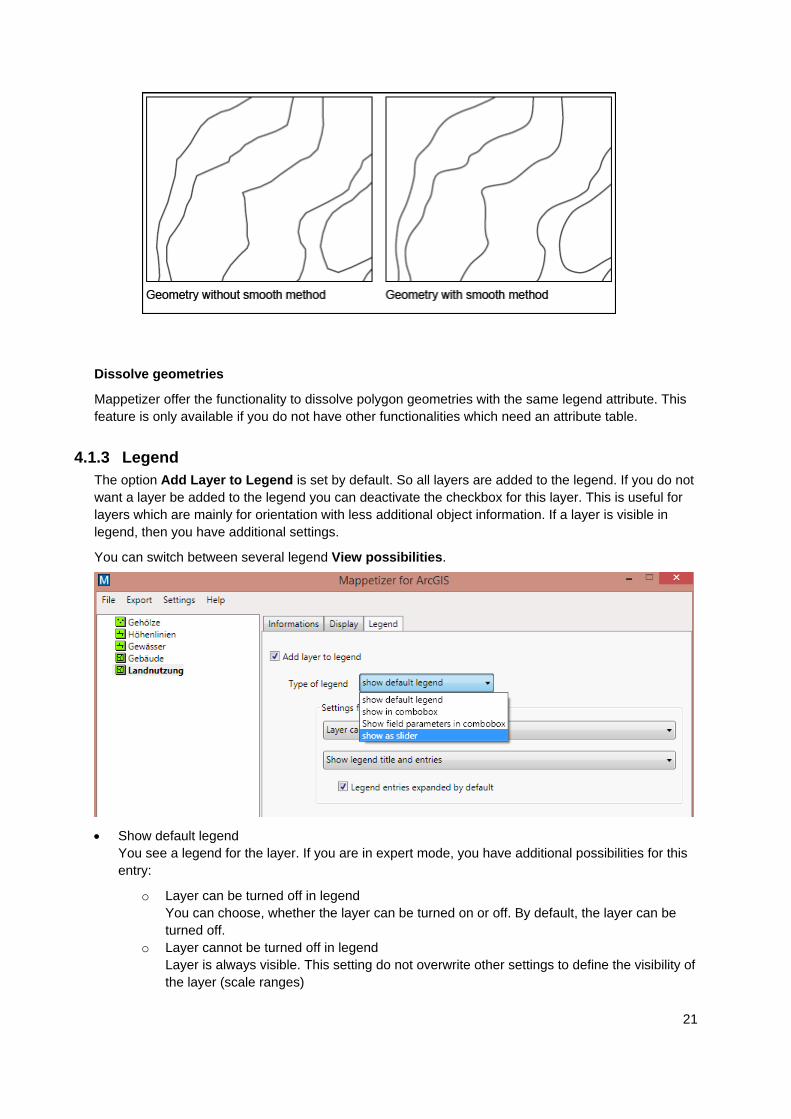
• Smooth method:
This option exports the geometry as Bézier curves. Your data in ArcMap will not be changed.
Some types of data will show more adequate results (e.g. contour lines). But there might not be a
speed up of loading time, this has to be probed. This option is not available for polygon layers.
21
Dissolve geometries
Mappetizer offer the functionality to dissolve polygon geometries with the same legend attribute. This
feature is only available if you do not have other functionalities which need an attribute table.
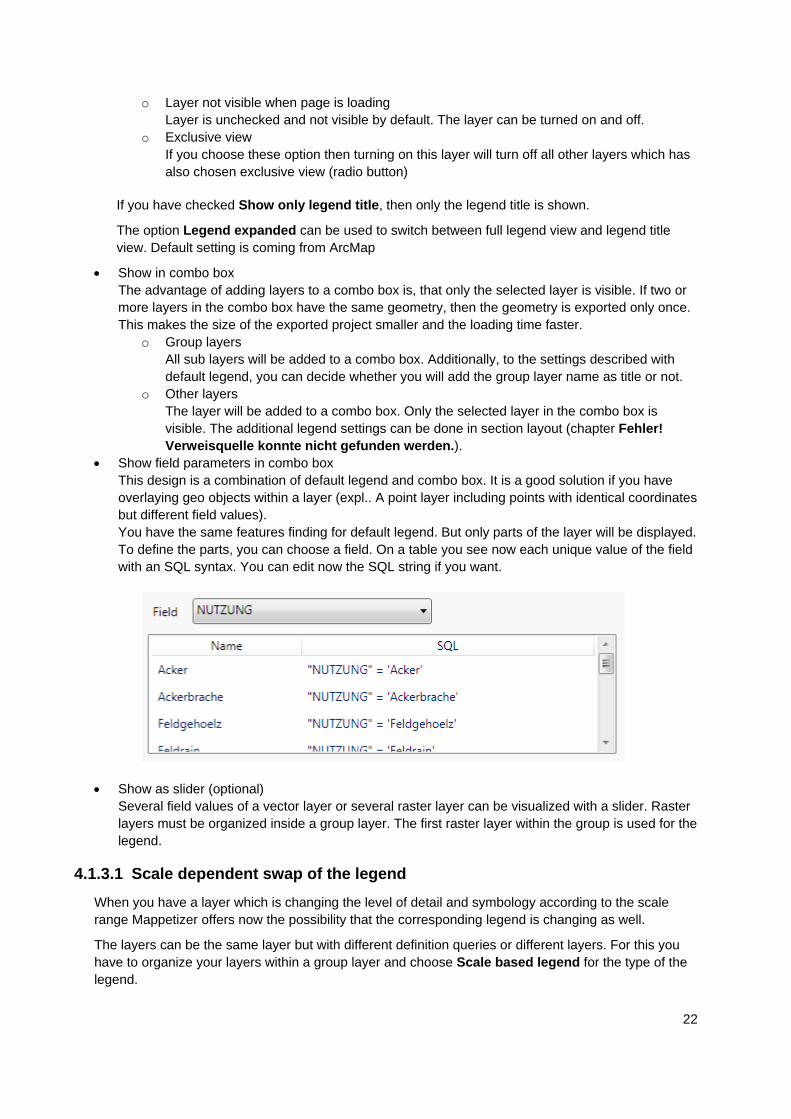
4.1.3 Legend
The option Add Layer to Legend is set by default. So all layers are added to the legend. If you do not
want a layer be added to the legend you can deactivate the checkbox for this layer. This is useful for
layers which are mainly for orientation with less additional object information. If a layer is visible in
legend, then you have additional settings.
You can switch between several legend View possibilities.
• Show default legend
You see a legend for the layer. If you are in expert mode, you have additional possibilities for this
entry:
o Layer can be turned off in legend
You can choose, whether the layer can be turned on or off. By default, the layer can be
turned off.
o Layer cannot be turned off in legend
Layer is always visible. This setting do not overwrite other settings to define the visibility of
the layer (scale ranges)
22
o Layer not visible when page is loading
Layer is unchecked and not visible by default. The layer can be turned on and off.
o Exclusive view
If you choose these option then turning on this layer will turn off all other layers which has
also chosen exclusive view (radio button)
If you have checked Show only legend title, then only the legend title is shown.
The option Legend expanded can be used to switch between full legend view and legend title
view. Default setting is coming from ArcMap
• Show in combo box
The advantage of adding layers to a combo box is, that only the selected layer is visible. If two or
more layers in the combo box have the same geometry, then the geometry is exported only once.
This makes the size of the exported project smaller and the loading time faster.
o Group layers
All sub layers will be added to a combo box. Additionally, to the settings described with
default legend, you can decide whether you will add the group layer name as title or not.
o Other layers
The layer will be added to a combo box. Only the selected layer in the combo box is
visible. The additional legend settings can be done in section layout (chapter Fehler!
Verweisquelle konnte nicht gefunden werden.).
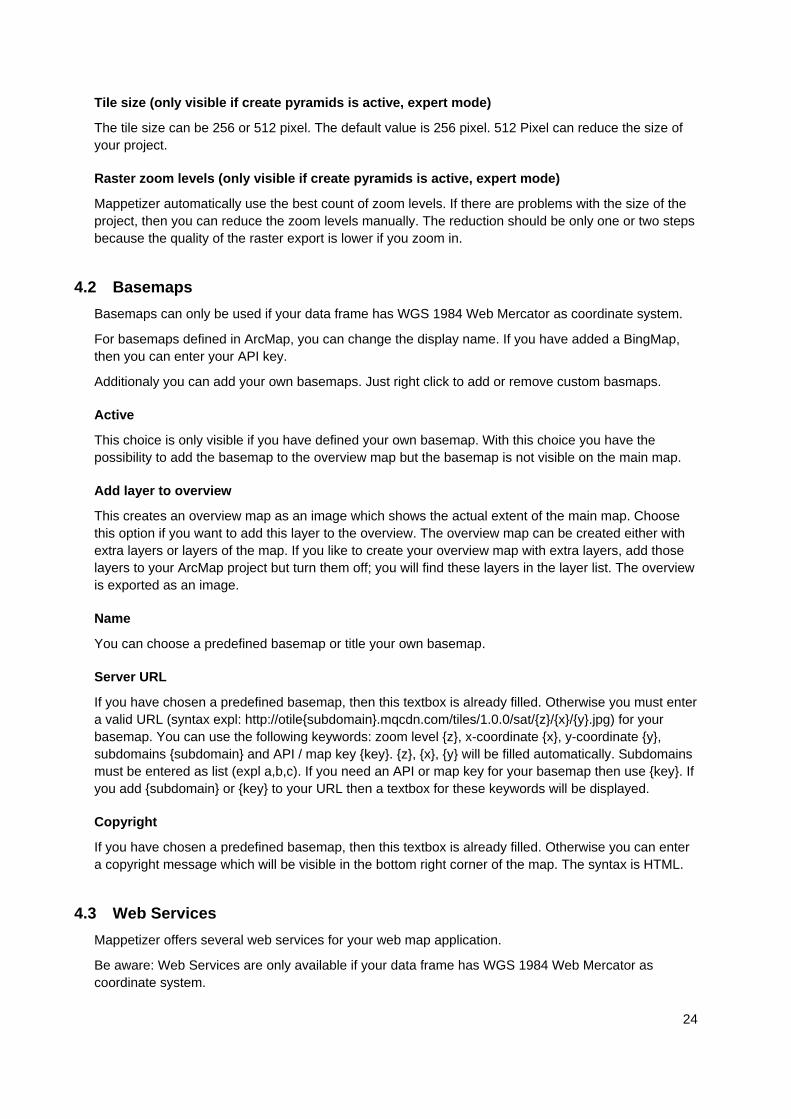
• Show field parameters in combo box
This design is a combination of default legend and combo box. It is a good solution if you have
overlaying geo objects within a layer (expl.. A point layer including points with identical coordinates
but different field values).
You have the same features finding for default legend. But only parts of the layer will be displayed.
To define the parts, you can choose a field. On a table you see now each unique value of the field
with an SQL syntax. You can edit now the SQL string if you want.
• Show as slider (optional)
Several field values of a vector layer or several raster layer can be visualized with a slider. Raster
layers must be organized inside a group layer. The first raster layer within the group is used for the
legend.
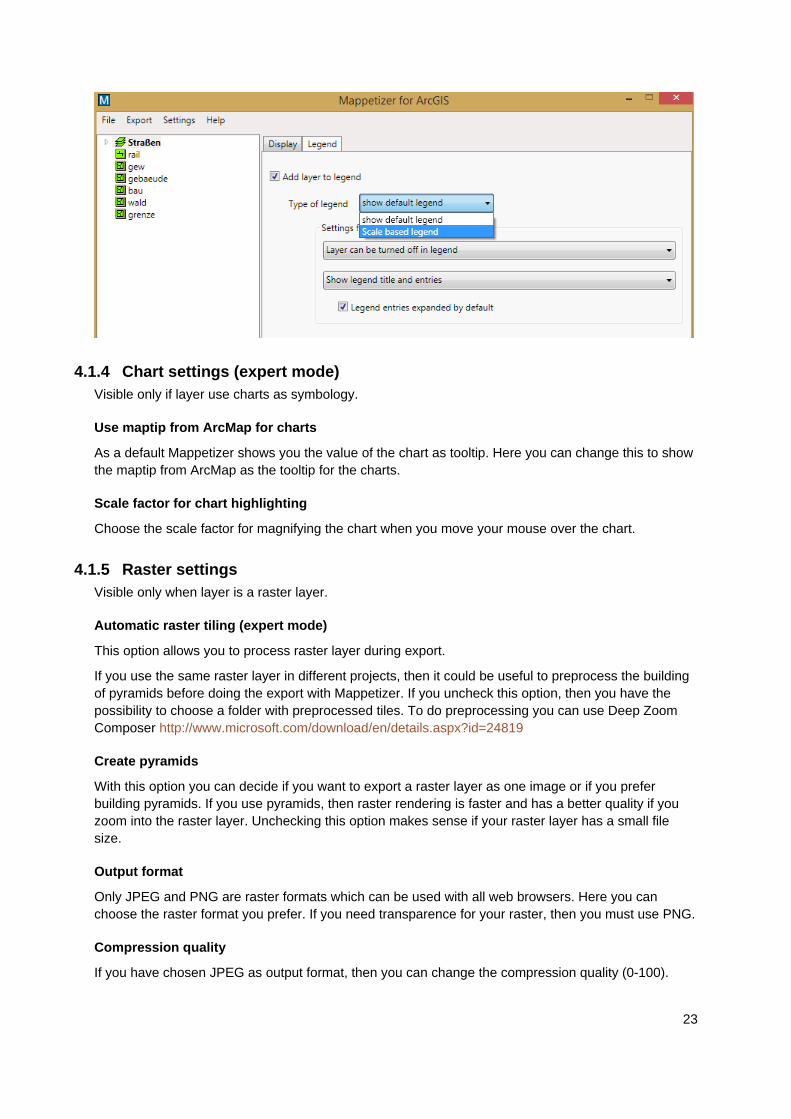
4.1.3.1 Scale dependent swap of the legend
When you have a layer which is changing the level of detail and symbology according to the scale
range Mappetizer offers now the possibility that the corresponding legend is changing as well.
The layers can be the same layer but with different definition queries or different layers. For this you
have to organize your layers within a group layer and choose Scale based legend for the type of the
legend.
23
4.1.4 Chart settings (expert mode)
Visible only if layer use charts as symbology.
Use maptip from ArcMap for charts
As a default Mappetizer shows you the value of the chart as tooltip. Here you can change this to show
the maptip from ArcMap as the tooltip for the charts.
Scale factor for chart highlighting
Choose the scale factor for magnifying the chart when you move your mouse over the chart.
4.1.5 Raster settings
Visible only when layer is a raster layer.
Automatic raster tiling (expert mode)
This option allows you to process raster layer during export.
If you use the same raster layer in different projects, then it could be useful to preprocess the building
of pyramids before doing the export with Mappetizer. If you uncheck this option, then you have the
possibility to choose a folder with preprocessed tiles. To do preprocessing you can use Deep Zoom
Composer http://www.microsoft.com/download/en/details.aspx?id=24819
Create pyramids
With this option you can decide if you want to export a raster layer as one image or if you prefer
building pyramids. If you use pyramids, then raster rendering is faster and has a better quality if you
zoom into the raster layer. Unchecking this option makes sense if your raster layer has a small file
size.
Output format
Only JPEG and PNG are raster formats which can be used with all web browsers. Here you can
choose the raster format you prefer. If you need transparence for your raster, then you must use PNG.
Compression quality
If you have chosen JPEG as output format, then you can change the compression quality (0-100).
24
Tile size (only visible if create pyramids is active, expert mode)
The tile size can be 256 or 512 pixel. The default value is 256 pixel. 512 Pixel can reduce the size of
your project.
Raster zoom levels (only visible if create pyramids is active, expert mode)
Mappetizer automatically use the best count of zoom levels. If there are problems with the size of the
project, then you can reduce the zoom levels manually. The reduction should be only one or two steps
because the quality of the raster export is lower if you zoom in.
4.2 Basemaps
Basemaps can only be used if your data frame has WGS 1984 Web Mercator as coordinate system.
For basemaps defined in ArcMap, you can change the display name. If you have added a BingMap,
then you can enter your API key.
Additionaly you can add your own basemaps. Just right click to add or remove custom basmaps.
Active
This choice is only visible if you have defined your own basemap. With this choice you have the
possibility to add the basemap to the overview map but the basemap is not visible on the main map.
Add layer to overview
This creates an overview map as an image which shows the actual extent of the main map. Choose
this option if you want to add this layer to the overview. The overview map can be created either with
extra layers or layers of the map. If you like to create your overview map with extra layers, add those
layers to your ArcMap project but turn them off; you will find these layers in the layer list. The overview
is exported as an image.
Name
You can choose a predefined basemap or title your own basemap.
Server URL
If you have chosen a predefined basemap, then this textbox is already filled. Otherwise you must enter
a valid URL (syntax expl: http://otile{subdomain}.mqcdn.com/tiles/1.0.0/sat/{z}/{x}/{y}.jpg) for your
basemap. You can use the following keywords: zoom level {z}, x-coordinate {x}, y-coordinate {y},
subdomains {subdomain} and API / map key {key}. {z}, {x}, {y} will be filled automatically. Subdomains
must be entered as list (expl a,b,c). If you need an API or map key for your basemap then use {key}. If
you add {subdomain} or {key} to your URL then a textbox for these keywords will be displayed.
Copyright
If you have chosen a predefined basemap, then this textbox is already filled. Otherwise you can enter
a copyright message which will be visible in the bottom right corner of the map. The syntax is HTML.
4.3 Web Services
Mappetizer offers several web services for your web map application.
Be aware: Web Services are only available if your data frame has WGS 1984 Web Mercator as
coordinate system.
25
• Panoramio
This web service adds fotos coming from Panoramio on your main map.
• Wikipedia:
This web service adds access to GeoNames and their Wikipedia entries. These entries can be
turned off and on with the Wikipedia-Icon in the Toolbar. Entries are localized to the chosen
export language
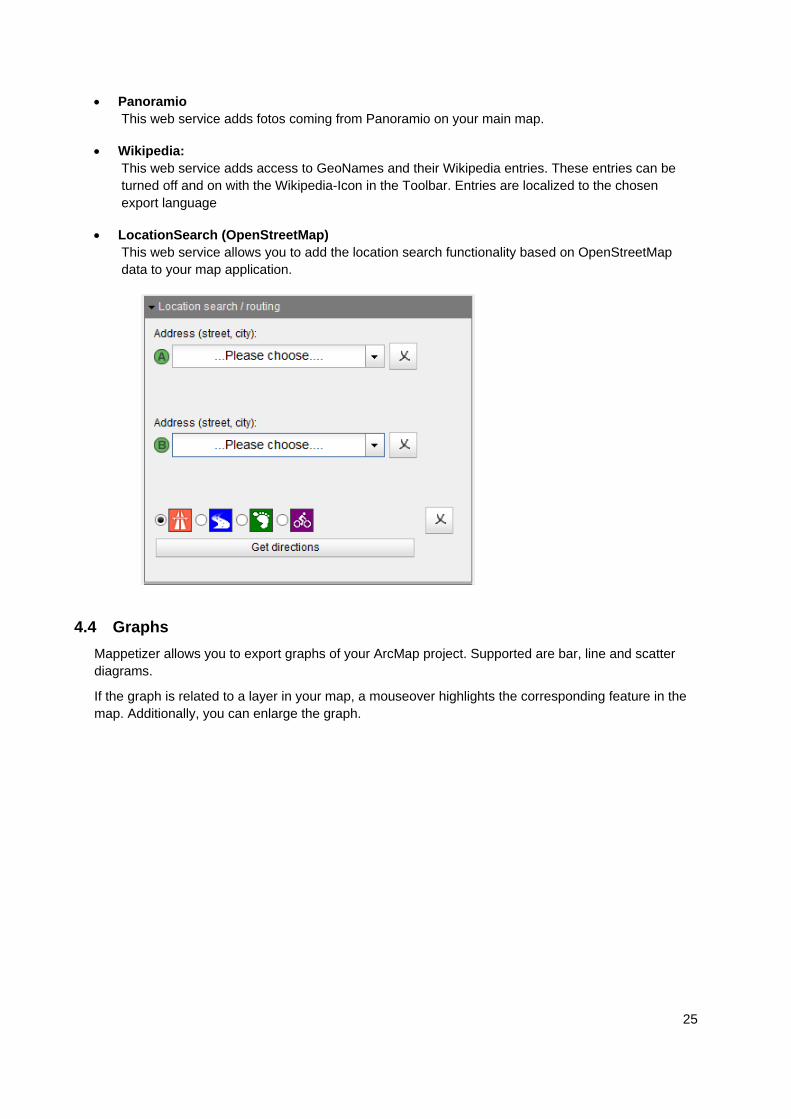
• LocationSearch (OpenStreetMap)
This web service allows you to add the location search functionality based on OpenStreetMap
data to your map application.
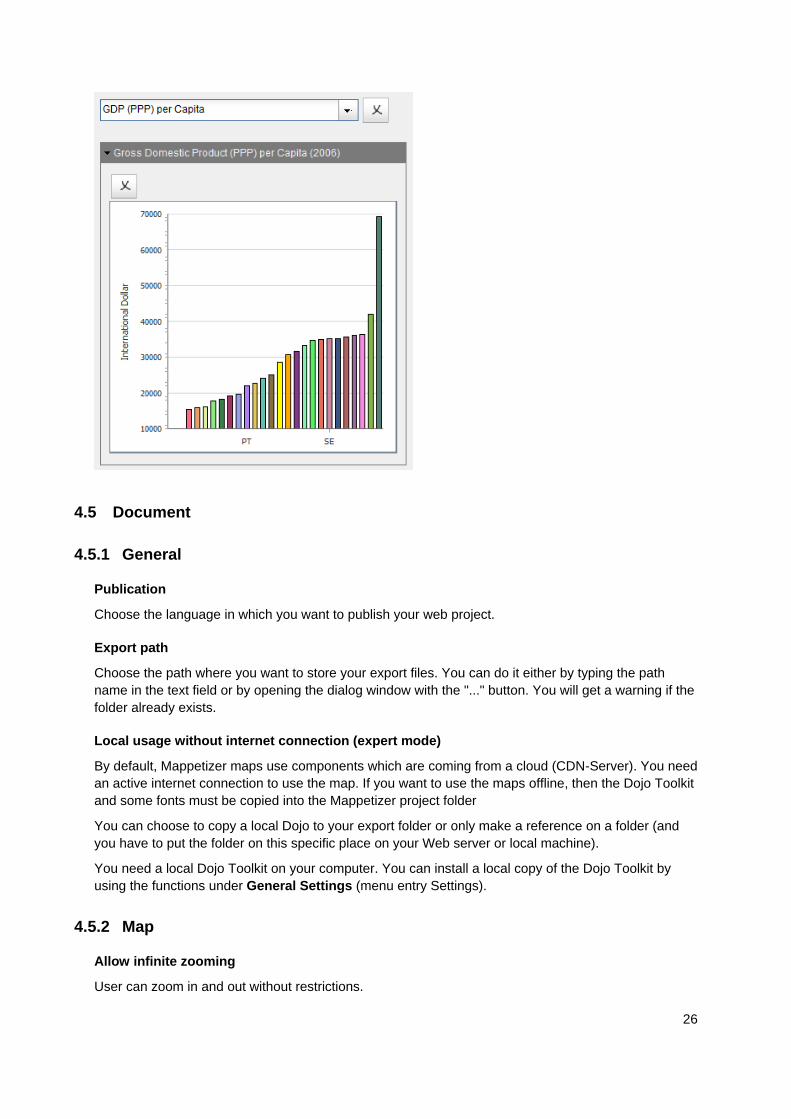
4.4 Graphs
Mappetizer allows you to export graphs of your ArcMap project. Supported are bar, line and scatter
diagrams.
If the graph is related to a layer in your map, a mouseover highlights the corresponding feature in the
map. Additionally, you can enlarge the graph.
26
4.5 Document
4.5.1 General
Publication
Choose the language in which you want to publish your web project.
Export path
Choose the path where you want to store your export files. You can do it either by typing the path
name in the text field or by opening the dialog window with the "..." button. You will get a warning if the
folder already exists.
Local usage without internet connection (expert mode)
By default, Mappetizer maps use components which are coming from a cloud (CDN-Server). You need
an active internet connection to use the map. If you want to use the maps offline, then the Dojo Toolkit
and some fonts must be copied into the Mappetizer project folder
You can choose to copy a local Dojo to your export folder or only make a reference on a folder (and
you have to put the folder on this specific place on your Web server or local machine).
You need a local Dojo Toolkit on your computer. You can install a local copy of the Dojo Toolkit by
using the functions under General Settings (menu entry Settings).
4.5.2 Map
Allow infinite zooming
User can zoom in and out without restrictions.
27
Don’t zoom
Choose the minimum and maximum scale for your map. Beyond this, the user cannot zoom in or out.
You can additionally define scale ranges for individual layers in ArcMap.
Use stored map extent
Choose this if you want to save the current map extent for later use. If you load the saved
project at a later time the saved map extent is used for export instead of the current extent in
ArcMap.
Slider / Layer in Combobox (expert mode)
Here you can make settings for layers with slider and layers in a combobox. Force usage of
one geometry can be used to force the usage of a joint geometry as well as the layers have
different attribute tables. As default Layers with sliders and layers in a combobox are using the
same geometry. If you uncheck Slider and combobox layer can use same geometry, then
you can prevent this.
4.5.3 Components
4.5.3.1 Toolbar
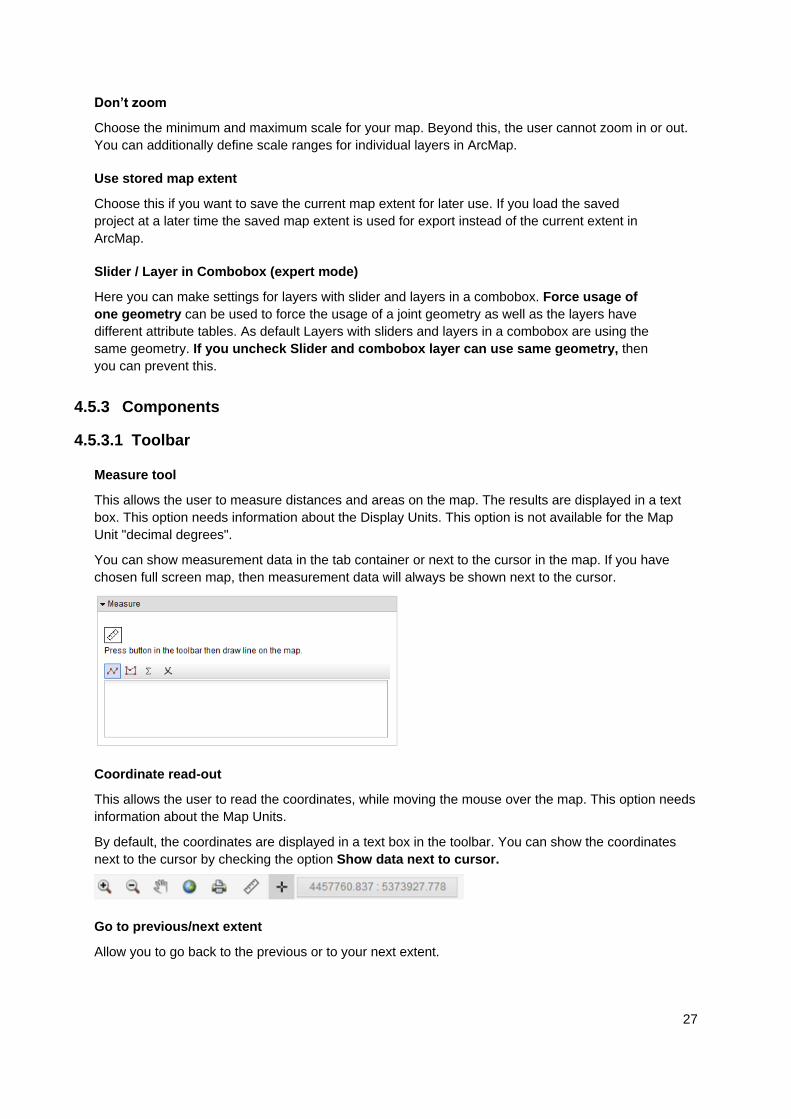
Measure tool
This allows the user to measure distances and areas on the map. The results are displayed in a text
box. This option needs information about the Display Units. This option is not available for the Map
Unit "decimal degrees".
You can show measurement data in the tab container or next to the cursor in the map. If you have
chosen full screen map, then measurement data will always be shown next to the cursor.
Coordinate read-out
This allows the user to read the coordinates, while moving the mouse over the map. This option needs
information about the Map Units.
By default, the coordinates are displayed in a text box in the toolbar. You can show the coordinates
next to the cursor by checking the option Show data next to cursor.
Go to previous/next extent
Allow you to go back to the previous or to your next extent.
28
The print button allows you to print directly a page. The function is equivalent to the printing option of
the browser.
Share Map
This allows the user to share the map with current settings (extent, layer visibility, selected elements)
with others via E-Mail, Facebook, Google+ or Twitter.
Show Position
This allows the user to show his current location on the map. This functionality is only available if your
data frame has WGS 1984 Web Mercator as coordinate system.
4.5.3.2 Other Components
Scale bar
Add a scale bar to your Web project. This option needs information about the Display Units. This
option is not available for the Map Unit "decimal degrees".
Scale display and specifying
This allows the user to see the map in a specific scale. This option needs information about the Map
Units. This option will be converted in a %-zooming for the Map Unit "decimal degrees".
Hint: The results are only correct with a screen resolution of 96 dpi.
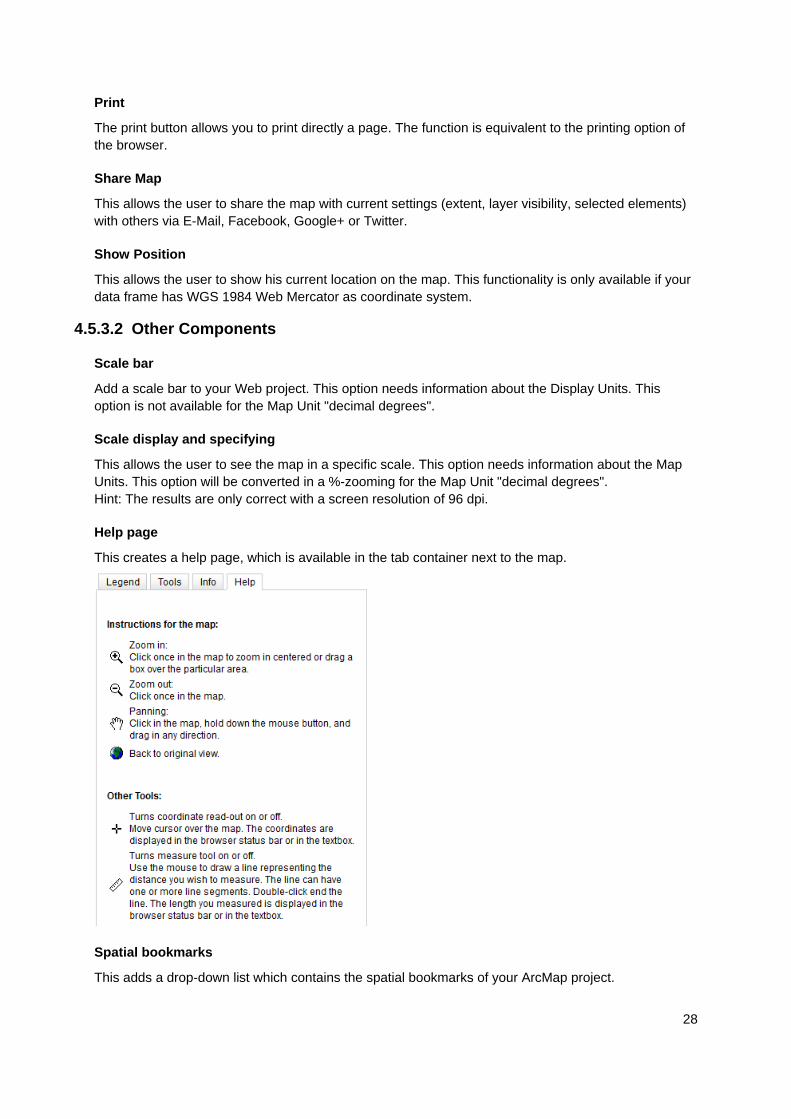
Help page
This creates a help page, which is available in the tab container next to the map.
Spatial bookmarks
This adds a drop-down list which contains the spatial bookmarks of your ArcMap project.
29
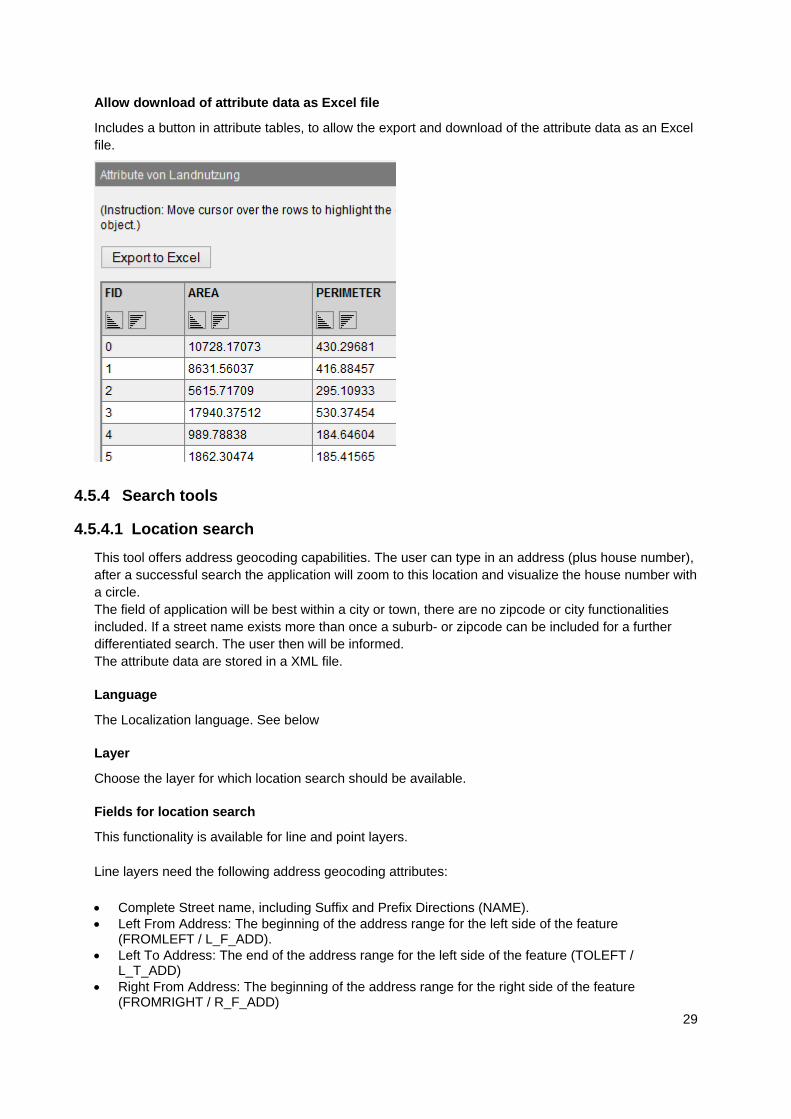
Allow download of attribute data as Excel file
Includes a button in attribute tables, to allow the export and download of the attribute data as an Excel
file.
4.5.4 Search tools
4.5.4.1 Location search
This tool offers address geocoding capabilities. The user can type in an address (plus house number),
after a successful search the application will zoom to this location and visualize the house number with
a circle.
The field of application will be best within a city or town, there are no zipcode or city functionalities
included. If a street name exists more than once a suburb- or zipcode can be included for a further
differentiated search. The user then will be informed.
The attribute data are stored in a XML file.
Language
The Localization language. See below
Layer
Choose the layer for which location search should be available.
Fields for location search
This functionality is available for line and point layers.
Line layers need the following address geocoding attributes:
• Complete Street name, including Suffix and Prefix Directions (NAME).
• Left From Address: The beginning of the address range for the left side of the feature (FROMLEFT / L_F_ADD).
• Left To Address: The end of the address range for the left side of the feature (TOLEFT / L_T_ADD)
• Right From Address: The beginning of the address range for the right side of the feature (FROMRIGHT / R_F_ADD)
30
• Right To Address: The end of the address range for the right side of the feature (TORIGHT/ R_T_ADD)
• Optional: district, zip code for more differentiated search.
Point layers need the following address geocoding attributes:
• Complete Street name, including Suffix and Prefix Directions.
• Street number
• Optional: district, zip code for more differentiated search
Using the field names put in parentheses, the allocation will be set automatically. You can also choose
any available field in attribute table.
Zoom to street
Choose the option "Zoom to street", if you want the application to zoom to the whole street.
Zoom to street segment
"Zoom to street segment", if you want the application to zoom to the specific street segment after a
successful search. We recommend the last option if the spatial area is quite large or there are long
streets, so the circle representing the location will be quite small and almost invisible when zooming to
the whole street (option only available for line layer).
Show attribute values
Choose the option, if you want to see the attribute values after the search is done.
4.5.4.2 Parcel search
Layer
Choose the layer for which location search should be available.
Fields for parcel search
• City (gdz)
• District (gmk)
• Parcel (flr)
• Parcel number (zaehler/nenner, flstnrz/flstnrn)
Using the field names put in parentheses, the allocation will be set automatically. You can also choose
any available field in attribute table.
Show attribute values
Choose the option, if you want to see the attribute values after the search is done.
4.5.5 Metainformation
Author
This information comes from ArcMap.
Add your E-mail addresses. It will automatically be transferred into a clickable link. More than one e-
mail must be separated with a semicolon or comma.
31
Date
The date of today will be the choice of the program.
Comment
This information comes from ArcMap. Carriage returns will be factored in.
Filename for logo
To add a logo on your page (GIF, JPEG or PNG File) click the Add logo button and choose it with the
dialog window. Click the Remove logo button to remove an existing logo.
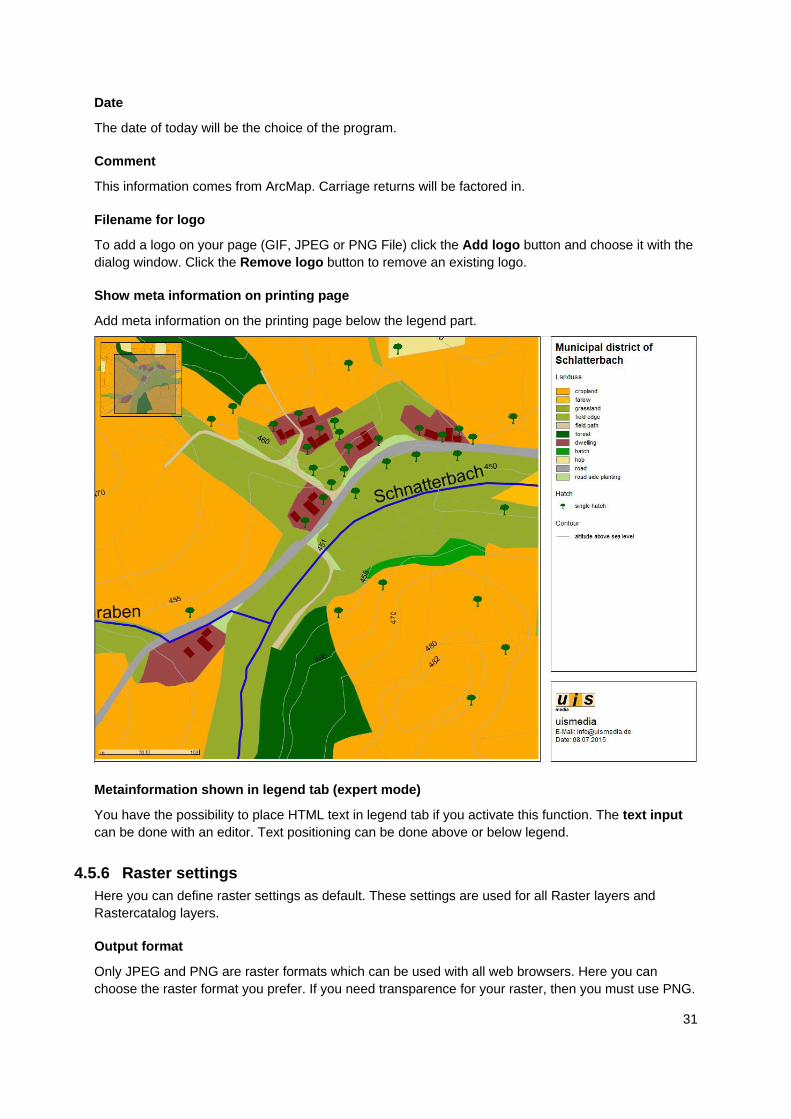
Show meta information on printing page
Add meta information on the printing page below the legend part.
Metainformation shown in legend tab (expert mode)
You have the possibility to place HTML text in legend tab if you activate this function. The text input
can be done with an editor. Text positioning can be done above or below legend.
4.5.6 Raster settings
Here you can define raster settings as default. These settings are used for all Raster layers and
Rastercatalog layers.
Output format
Only JPEG and PNG are raster formats which can be used with all web browsers. Here you can
choose the raster format you prefer. If you need transparence for your raster, then you must use PNG.
32
Compression quality
If you have chosen JPEG as output format, then you can change the compression quality (0-100).
Tile size
The tile size can be 256 or 512 pixel. The default value is 256 pixel. 512 pixel can reduce the size of
your project.
Raster zoom levels
Mappetizer automatically use the best count of zoom levels. If there are problems with the size of the
project, then you can reduce the zoom levels manually. The reduction should be only one or two steps
because the quality of the raster export is lower if you zoom in.
4.6 Layout
4.6.1 General
Color scheme
Choose one of the given color schemes in the drop-down list for your Web project.
Selection color
This color will be seen, when a Map Tip is activated or to highlight the particular feature when the
attributes will be seen.
Text font
The display in the browser depends on the fonts which are installed on the system. So it is just
useable to differentiate between a serif (e.g. Times) and a non-serif (e.g. Arial) font. Choose one of
these font styles. This style will be used for all text in your Web application, such as the legend, the
help text, the title, and the site information
Printing page size
Here you can choose the page size for your printing output. Available page sizes are DIN A4, DIN A3
and Letter.
Own CSS file (expert mode)
Here you can add a path to your own CSS file which will be additionally used in exported map
projects.
Show progress symbol when loading map
If you activate this option, then you will see an animated symbol and the map title until the map is fully
loaded.
4.6.2 Design
Map layout
There are three different layouts for map design. Two have a tab container on the left or right side to
show all map information. The third is a full screen map view.
33
According to the map design, the design will change based on the browser window size. If you have
chosen a left or right side container, then the design switch to full screen map view if the window is too
small.
Information container (expert mode)
Mappetizer automatically calculate the correct size of the tab container. If you want to change the
width, then you can give a width for the tab container manually. If a setting in Mappetizer needs a
special width, then you see a text with the needed width.
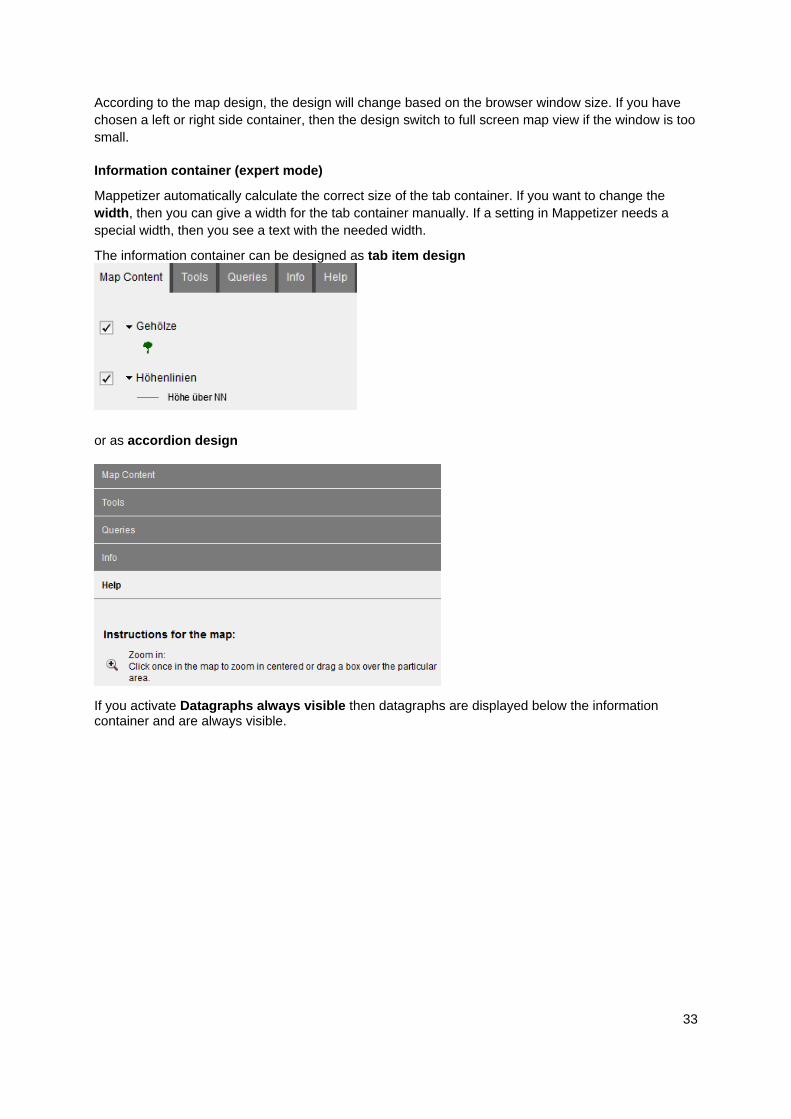
The information container can be designed as tab item design
or as accordion design
If you activate Datagraphs always visible then datagraphs are displayed below the information container and are always visible.
34
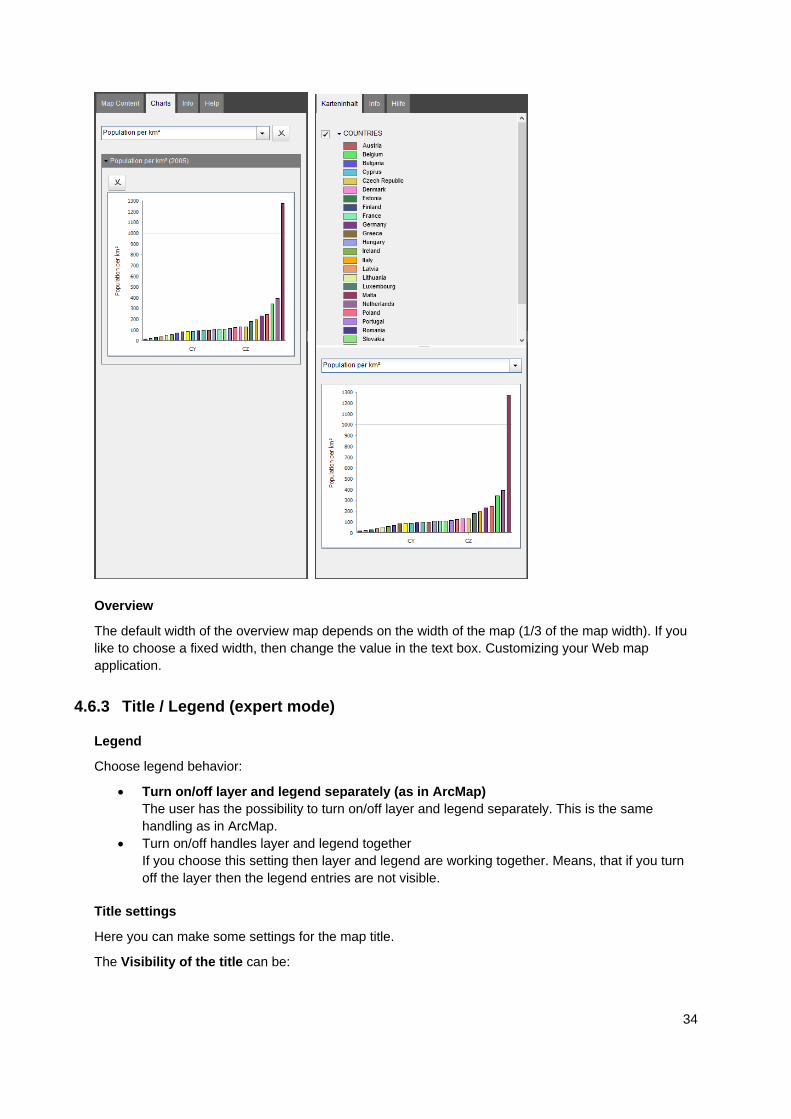
Overview
The default width of the overview map depends on the width of the map (1/3 of the map width). If you
like to choose a fixed width, then change the value in the text box. Customizing your Web map
application.
4.6.3 Title / Legend (expert mode)
Legend
Choose legend behavior:
• Turn on/off layer and legend separately (as in ArcMap)
The user has the possibility to turn on/off layer and legend separately. This is the same
handling as in ArcMap.
• Turn on/off handles layer and legend together
If you choose this setting then layer and legend are working together. Means, that if you turn
off the layer then the legend entries are not visible.
Title settings
Here you can make some settings for the map title.
The Visibility of the title can be:
35
• visible
The title is visible in browser mode and in full screen
• visible in full screen
The title is only visible if map is shown in full screen
• not visible
The map has no title
The title is subdivided into three parts: Title text, Subtitle text and Title image. If you want to use
your own title design, then you can check Use title HTML template. Here you can enter a path to a
HTML file which includes an html fragment for the title.
4.6.4 Slider / Layer in Combobox
You can make some legend settings. See chapter 4.1.3 for more information.
5 Optional Extensions
The functionality of Mappetizer can be expnded by two extensions.
5.1 Slider Bar
This extension allows you to use time series for layer. The time series can be displayed with a slider
tool.
5.2 Database Access
This extension allows you to use database tables for attribute data and geometries.
6 Further settings
6.1 Adding own Scripts
To add further functionalities, you can write your own scripts and add them to your Web application.
You can write down your scripts in the file variablen.js or in a separate file. For this just link in the
index.html to your script file with the line:
<script src="embfiles/myFunction.js" type="text/javascript"></script>
Please be aware, that your scripts might be delete or overwritten when you export your project again.
So, save your ideas in a separate file and copy them again in your Mappetizer project.
6.2 Use of internal functions
You are also able to use internal functions of Mappetizer. The following functions might be of use for
you:
6.2.1 Global Object mv_Doc
mv_Doc.HiColor highlight color, e.g.
Mv_Doc.HiColor = "rgb(100,200,100)";
36
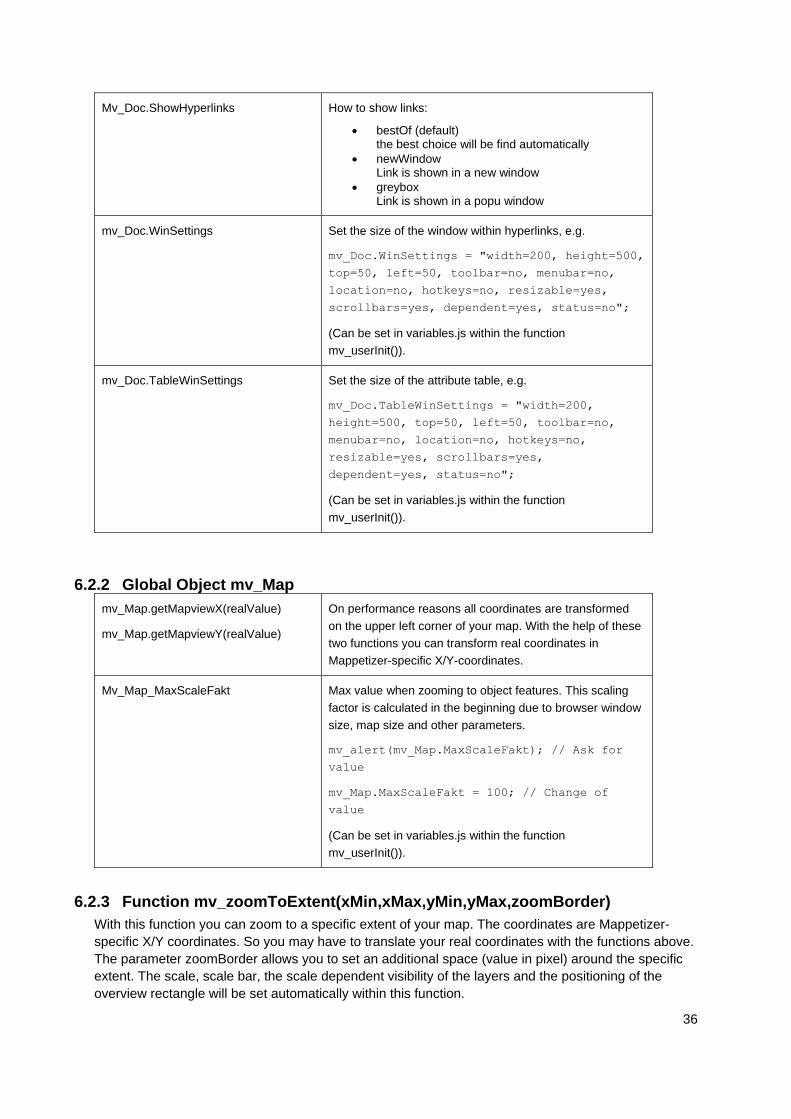
Mv_Doc.ShowHyperlinks How to show links:
• bestOf (default) the best choice will be find automatically
• newWindow Link is shown in a new window
• greybox Link is shown in a popu window
mv_Doc.WinSettings Set the size of the window within hyperlinks, e.g.
mv_Doc.WinSettings = "width=200, height=500,
top=50, left=50, toolbar=no, menubar=no,
location=no, hotkeys=no, resizable=yes,
scrollbars=yes, dependent=yes, status=no";
(Can be set in variables.js within the function
mv_userInit()).
mv_Doc.TableWinSettings Set the size of the attribute table, e.g.
mv_Doc.TableWinSettings = "width=200,
height=500, top=50, left=50, toolbar=no,
menubar=no, location=no, hotkeys=no,
resizable=yes, scrollbars=yes,
dependent=yes, status=no";
(Can be set in variables.js within the function
mv_userInit()).
6.2.2 Global Object mv_Map
mv_Map.getMapviewX(realValue)
mv_Map.getMapviewY(realValue)
On performance reasons all coordinates are transformed
on the upper left corner of your map. With the help of these
two functions you can transform real coordinates in
Mappetizer-specific X/Y-coordinates.
Mv_Map_MaxScaleFakt Max value when zooming to object features. This scaling
factor is calculated in the beginning due to browser window
size, map size and other parameters.
mv_alert(mv_Map.MaxScaleFakt); // Ask for
value
mv_Map.MaxScaleFakt = 100; // Change of
value
(Can be set in variables.js within the function
mv_userInit()).
6.2.3 Function mv_zoomToExtent(xMin,xMax,yMin,yMax,zoomBorder)
With this function you can zoom to a specific extent of your map. The coordinates are Mappetizer-
specific X/Y coordinates. So you may have to translate your real coordinates with the functions above.
The parameter zoomBorder allows you to set an additional space (value in pixel) around the specific
extent. The scale, scale bar, the scale dependent visibility of the layers and the positioning of the
overview rectangle will be set automatically within this function.
37
6.2.4 Function mv_alert(myText)
This gives out text in a dialog window.
6.2.5 Function mv_userInit
You find the function mv_userInit() in the file variablen.js. This function is called on loading and you
can use it for your own purposes. For example if you want to zoom in to a certain extent while loading,
pass your coordinates with the URL like:
http://myURL/mapview/index.html?4457851,4458272,5374027,5373689
(Input: left, right, top, bottom)
In the function mv_userInit add in the following lines:
var URIString = window.location.search;
if(URIString.length > 0) {
var theArray = URIString.substr(1, URIString.length).split(",");
if (theArray.length == 4) {
var left = mv_Map.getMapviewX(theArray[0])
var right = mv_Map.getMapviewX(theArray[1])
var top = mv_Map.getMapviewX(theArray[2])
var bottom = mv_Map.getMapviewX(theArray[3])
mv_zoomToExtent(left,right,top,bottom,20);
}
}
6.3 Adding own Tools to the Toolbar
To add more functionality to Mappetizer you can add your own tools and buttons to the toolbar.
Please do the following to add your tools:
Changes in index.html
In the div-Tag "MVtoolbar":
<div id="MVtoolbar" …..>
add a new entry:
<div class="MVtbButton" data-dojo-type="dijit.form.ToggleButton"
id="MVtoolbar.mytool" data-dojo-props="iconClass:'dijitMapViewIcon
dijitMapViewIconZoomIn', showLabel:false">MyTool</div>
Changes in folder toolbar
Add your icon at the end to the image toolbar.png (all images have a width of 18 pixels).
Changes in style.css
Add a new line
.tundra .dijitMapViewIconMyButton { background-position: -360px; }
Changes in variables.js
You find the dojo.addOnLoad(function()) in the file variables.js. Type in somewhere the following line:
dojo.connect(dojo.byId("MVtoolbar.mytool"),"onclick",myFunction);
38
Next type in the function:
function myFunction() {
mv_clearEvents(true,"myToolTask");
mv_alert("here");
}
6.4 File addressmatch.xml, designmanagement.xml, basemaps.xml, language.xml
To prevent that user settings will be overridden during installation of a new version, the files
addressmatch.xml, designmanagement.xml basemaps.xml and language.xml can be protected by
using “user_” as prefix (expl. User_designmanagement.xml). user_addressmatch.xml, and
user_language.xml must have all settings from the main files. user_designmanagement.xml can
include only user settings.
addressmatch.xml
To adjust incomplete inputs from the user, the application has implemented several search routines:
1. Direct search for the name
2. LIKE search for the name
3. First replace search with use of inputs of the file addressmatch.xml (replace of replace1 elements)
(LIKE search)
4. Second replace search with use of inputs of the file addressmatch.xml (replace of replace2
elements) (LIKE search)
5. Cut of word boundarys from left to right and LIKE search with the string segment
The use of replace1 and replace2 elements allows the staggered search for a streetname. If the user
types in for example "Auenstrasse" but there exists just a "Auenweg" it can be find within the second
search. Replacing "strasse" in the first step will find maybe both, assumed both exist within the data.
You find the addressmatch.xml file in the program folder of Mappetizer (Please do not move or
rename this file). This file already includes algorithms for German and American street names, but you
can add more algorithms or add another language to this file. Please be careful when change this file
(spelling, uppercase and lowercase characters, don't forget the end-Tags). The file has the following
structure:
<?xml version="1.0" encoding="iso-8859-1"?>
<addressmatch>
<language id="de">
<replace1>
<input mode="all">Strasse</input>
<standard>Straße</standard>
</replace1>
<replace2>
<input mode="allLast">weg</input>
<standard></standard>
</replace2>
</language>
</addressmatch>
For a new language add another XML element <language id="xx">. You can name the attribute
whatever you like, this name will appear in the combobox Language and you can choose it from there.
39
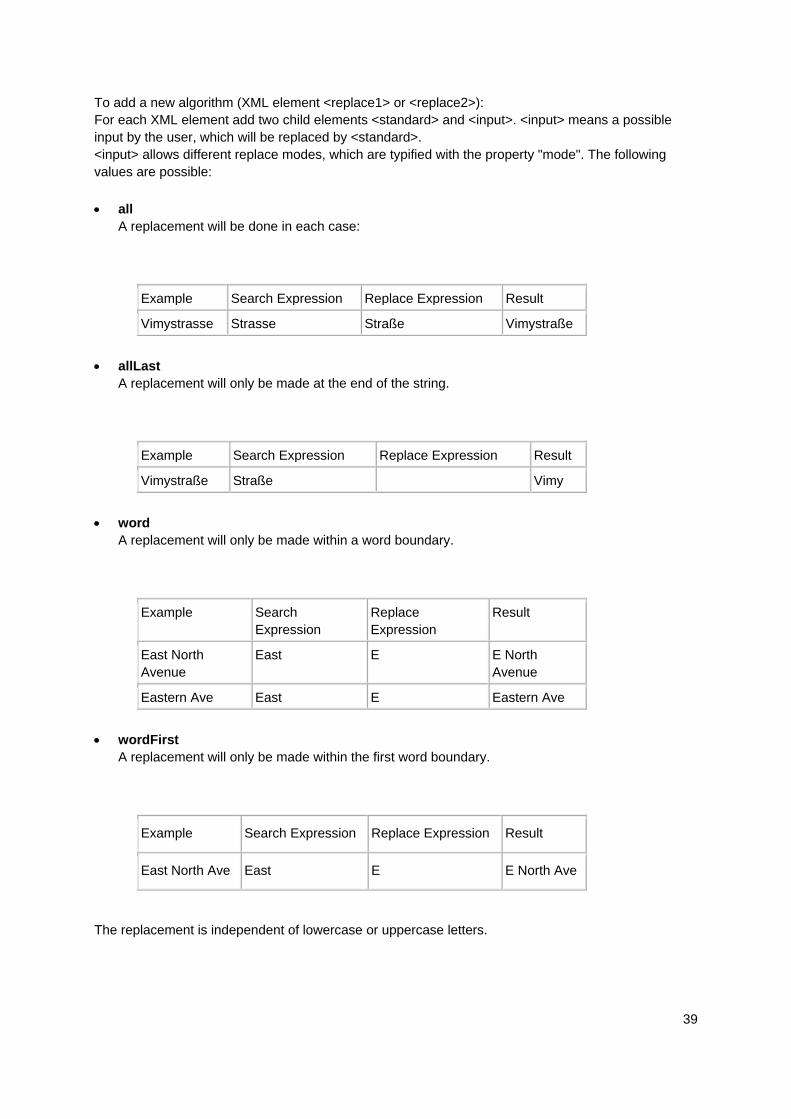
To add a new algorithm (XML element <replace1> or <replace2>):
For each XML element add two child elements <standard> and <input>. <input> means a possible
input by the user, which will be replaced by <standard>.
<input> allows different replace modes, which are typified with the property "mode". The following
values are possible:
• all
A replacement will be done in each case:
Example Search Expression Replace Expression Result
Vimystrasse Strasse Straße Vimystraße
• allLast
A replacement will only be made at the end of the string.
Example Search Expression Replace Expression Result
Vimystraße Straße Vimy
• word
A replacement will only be made within a word boundary.
Example Search
Expression
Replace
Expression
Result
East North
Avenue
East E E North
Avenue
Eastern Ave East E Eastern Ave
• wordFirst
A replacement will only be made within the first word boundary.
Example Search Expression Replace Expression Result
East North Ave East E E North Ave
The replacement is independent of lowercase or uppercase letters.
40
7 The Map in the Browser
… does only operate in the browser. So we might ask to inform you about the functionalities on our
homepage:
http://www.mappetizer.de/en/examples/index.html
You will find a lot of „live“ examples there.
8 Information about the Demo Version
The Demo version is a fully functional version of Mappetizer, with no restrictions in lifetime. So you can
test all the functions without restrictions. The following differences exist between the Demo version
and the registered version:
• the note "DEMO" on the map (if you own Mappetizer and evaluate an additional tool,
Mappetizer will handle this export in the Demo mode.)
• the note "Created with Mappetizer by uismedia" as Author- and Copyright-Informations
• the note "Created with Mappetizer by www.uismedia.de" (strings) or -99999 (numbers) or
"1800-01-01" (dates) in the XML attribute files (randomly instead of the correct object data).
This will have effects on the correct display of object informations, attribute table, results of the
query manager, the location search application or the display of different attributes in use of
the same geometry.
• Hyperlinks are randomly replaced by the URI of the homepage of Mappetizer
(http://www.mappetizer.de).
• the option "Load" is disabled in the Demo Version
Your are not allowed to remove the note "DEMO" from the map and to remove the letters "Created
with Mappetizer by uismedia" from the Author- and Copyright-Informations.
9 Technical Support
You can contact uismedia's Technical Support Center for technical assistance by telephone, fax, or e-
mail during our normal business hours, Monday through Friday, excluding uismedia holidays.
Before you call uismedia for technical support, you should be at your computer running your
Mappetizer software. Be prepared to give the following information:
• The operating system and ESRI software you are using
• The exact wording of any messages that appeared on your screen
• What happened and what you were doing when the problem occurred
• What you tried to solve the problem
9.1 ContactingTechnical Support
Tel: (++49) (0)7583 / 37 54 65
Fax: (++49) (0)7583 / 37 54 66
E-mail: [email protected]
Hours: 9:00 a.m. to 6:00 p.m. German time, Monday through Friday, except uismedia holidays
41
9.2 Known Issues
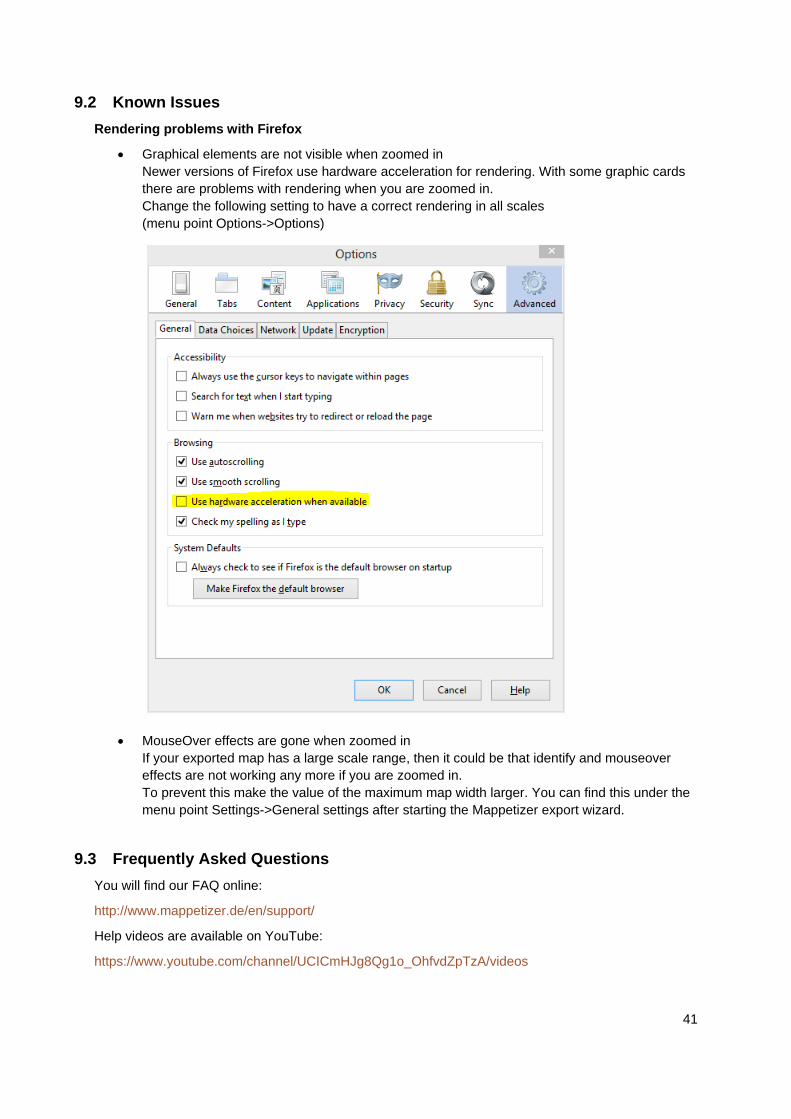
Rendering problems with Firefox
• Graphical elements are not visible when zoomed in
Newer versions of Firefox use hardware acceleration for rendering. With some graphic cards
there are problems with rendering when you are zoomed in.
Change the following setting to have a correct rendering in all scales
(menu point Options->Options)
• MouseOver effects are gone when zoomed in
If your exported map has a large scale range, then it could be that identify and mouseover
effects are not working any more if you are zoomed in.
To prevent this make the value of the maximum map width larger. You can find this under the
menu point Settings->General settings after starting the Mappetizer export wizard.
9.3 Frequently Asked Questions
You will find our FAQ online:
http://www.mappetizer.de/en/support/
Help videos are available on YouTube:
https://www.youtube.com/channel/UCICmHJg8Qg1o_OhfvdZpTzA/videos