maple leaf foods inc. 2015 annual · pdf filemaple leaf foods inc. 2015 annual report 2015 ......
TRANSCRIPT

Map
le Leaf Foo
ds Inc. 20
15 AN
NU
AL R
EP
OR
T 2015 ANNUAL REPORTMAPLE LEAF FOODS INC.
Maple Leaf Foods is Canada’s leading consumer packaged meats company, headquartered in Toronto, Ontario. We make high-quality, great tasting, nutritious and innovative food products under leading brands including Maple Leaf®, Maple Leaf Prime®, Maple Leaf Natural Selections®, Schneiders®, Schneiders Country Naturals® and Mina™. Our Company employs approximately 11,500 people in its operations across Canada and exports to many global markets including the U.S. and Asia.
Table of Contents Financial Highlights and Segmented Operating Results I | Message to Shareholders II | Message from the Chairman IV | Corporate Governance and Board of Directors V | Senior Management and Officers VI | Management’s Discussion and Analysis 1 | Independent Auditors’ Report 34 | Audited Consolidated Financial Statements and Notes 35 | Corporate Information Inside Back Cover
ANNUAL REPORT | 2015 | MAPLE LEAF FOODS INC.
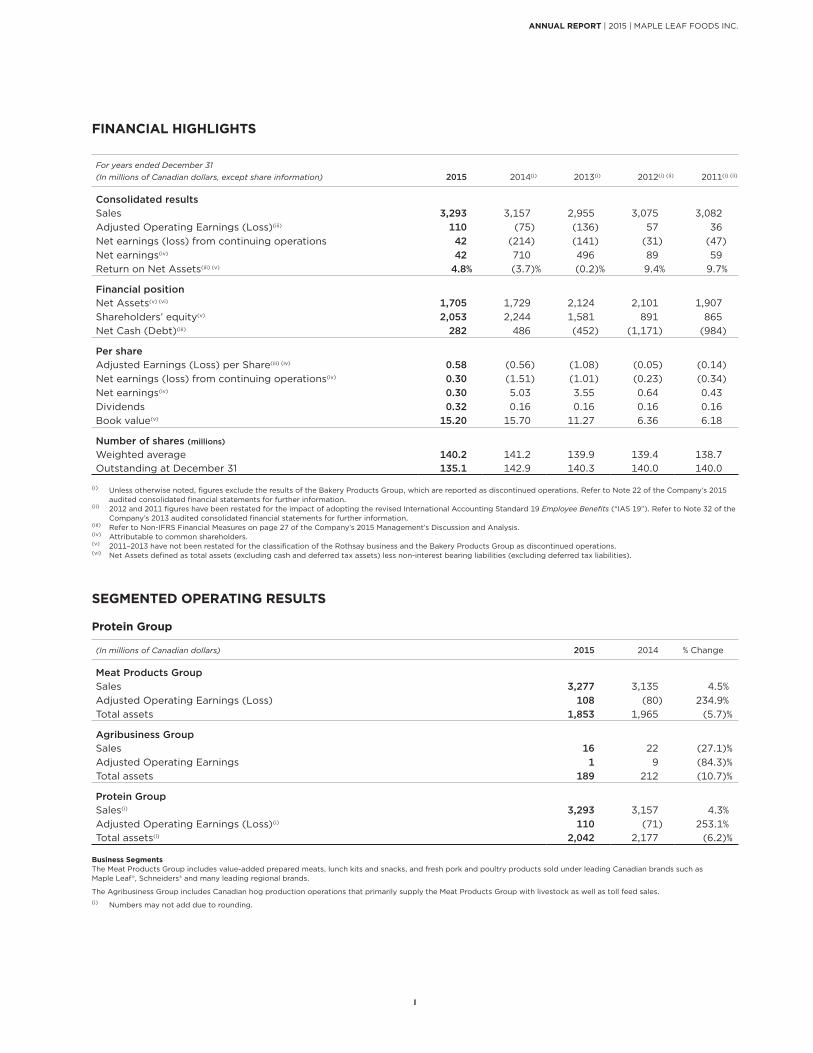
FINANCIAL HIGHLIGHTS
For years ended December 31 (In millions of Canadian dollars, except share information) 2015 2014(i) 2013(i) 2012(i) (ii) 2011(i) (ii)
Consolidated resultsSales 3,293 3,157 2,955 3,075 3,082 Adjusted Operating Earnings (Loss)(iii) 110 (75) (136) 57 36 Net earnings (loss) from continuing operations 42 (214) (141) (31) (47)Net earnings(iv) 42 710 496 89 59 Return on Net Assets(iii) (v) 4.8% (3.7)% (0.2)% 9.4% 9.7%
Financial positionNet Assets(v) (vi) 1,705 1,729 2,124 2,101 1,907 Shareholders’ equity(v) 2,053 2,244 1,581 891 865 Net Cash (Debt)(iii) 282 486 (452) (1,171) (984)
Per shareAdjusted Earnings (Loss) per Share(iii) (iv) 0.58 (0.56) (1.08) (0.05) (0.14)Net earnings (loss) from continuing operations(iv) 0.30 (1.51) (1.01) (0.23) (0.34)Net earnings(iv) 0.30 5.03 3.55 0.64 0.43 Dividends 0.32 0.16 0.16 0.16 0.16 Book value(v) 15.20 15.70 11.27 6.36 6.18
Number of shares (millions)
Weighted average 140.2 141.2 139.9 139.4 138.7 Outstanding at December 31 135.1 142.9 140.3 140.0 140.0
(i) Unless otherwise noted, figures exclude the results of the Bakery Products Group, which are reported as discontinued operations. Refer to Note 22 of the Company’s 2015 audited consolidated financial statements for further information.
(ii) 2012 and 2011 figures have been restated for the impact of adopting the revised International Accounting Standard 19 Employee Benefits (“IAS 19”). Refer to Note 32 of the Company’s 2013 audited consolidated financial statements for further information.
(iii) Refer to Non-IFRS Financial Measures on page 27 of the Company’s 2015 Management’s Discussion and Analysis.(iv) Attributable to common shareholders.(v) 2011–2013 have not been restated for the classification of the Rothsay business and the Bakery Products Group as discontinued operations. (vi) Net Assets defined as total assets (excluding cash and deferred tax assets) less non-interest bearing liabilities (excluding deferred tax liabilities).
SEGMENTED OPERATING RESULTS
Protein Group
(In millions of Canadian dollars) 2015 2014 % Change
Meat Products GroupSales 3,277 3,135 4.5%Adjusted Operating Earnings (Loss) 108 (80) 234.9%Total assets 1,853 1,965 (5.7)%
Agribusiness GroupSales 16 22 (27.1)%Adjusted Operating Earnings 1 9 (84.3)%Total assets 189 212 (10.7)%
Protein GroupSales(i) 3,293 3,157 4.3%Adjusted Operating Earnings (Loss)(i) 110 (71) 253.1%Total assets(i) 2,042 2,177 (6.2)%
Business SegmentsThe Meat Products Group includes value-added prepared meats, lunch kits and snacks, and fresh pork and poultry products sold under leading Canadian brands such as Maple Leaf®, Schneiders® and many leading regional brands.
The Agribusiness Group includes Canadian hog production operations that primarily supply the Meat Products Group with livestock as well as toll feed sales. (i) Numbers may not add due to rounding.
I

To my fellow shareholders:
It was five years ago that the Management and Board of Maple Leaf Foods initiated one of the most significant supply chain transformations in the North American food industry. The objective was to structurally expand our margins and secure the long-term value of our Company. The path lay in significantly reducing our manufacturing costs through investing in scale plants and technology to drive productivity gains.
Fast forward to 2015 and we are a fundamentally different company. Look at what we have accomplished:
• 100% of the over $1 billion capital investment is behind us and has been achieved within expectations outlined in 2010
• We closed 12 sub-scale facilities, treating people affected with respect and fairness
• All our new plants are operational and delivering productivity gains as we complete commissioning
• We rationalized over 600 products and reformulated more than 1,200 others to leverage the capabilities of our new plants and scale technologies
• We smoothly implemented an integrated SAP platform and are realizing the benefits
• We divested of our non-core businesses to become a focused protein company
• We established a streamlined low cost structure
• Our EBITDA (Earnings Before Interest, Tax, Depreciation and Amortization) margin increased from an average of 3.5% (2005–2012) to 8.7% in the fourth quarter of 2015, with the remainder of the path to our strategic goal made up solely of reducing identifiable ramp-up inefficiencies
• We are generating positive cash flow after years of investment and change
• Since early 2016, the stock has been trading between $22 and $24, well above averages of $18 a year ago and roughly $11 when we began this last leg of the journey in 2010
2015 RecapCompleting our strategy resulted in a sizable improvement in profitability in 2015. Adjusted Operating Earnings were $109.8 million (or $0.58 of adjusted earnings per share), compared to a loss of $75.5 million
(or an adjusted loss of $0.56 per share) in 2014.
Throughout 2015, we built on a consecutive trend of quarter-over-quarter EBITDA margin growth, ending the year at 8.7%, up significantly from 1.5% at the end of 2014. This was delivered through a combination of improved operating efficiencies in our new prepared meats plant network, pricing to offset higher costs, an improved sales mix, and strong results in both our fresh pork and poultry businesses. Through eliminating the remaining ramp-up inefficiencies at our prepared meats facility in Hamilton, Ontario – the largest in our network and the last to be commissioned – we are confident we will soon achieve our strategic run-rate EBITDA margin target of 10%.
With the onus of managing significant change behind us, we are sharpening our focus on organizational efficiencies. Last year, we streamlined our structure, shedding over 400 positions, along with implementing other cost reductions. A low cost structure will enable us to increase our investment in growth, including increased marketing spend behind our brands, product innovation and other strategic initiatives, such as building a sustainable future.
Looking AheadMaple Leaf has Canada’s leading brands and market shares in prepared meats, fresh pork and poultry products and a prepared meats network that is competitive on a North American scale. We are using these assets to deliver higher levels of profitable growth in our core categories. In 2016, we have the most robust platform of innovation
MESSAGE TO SHAREHOLDERS
ANNUAL REPORT | 2015 | MAPLE LEAF FOODS INC.
II

ever launched by our Company. We have materially increased our investment behind marketing, including strong campaigns behind our flagship Maple Leaf brand. We are re-launching Schneiders, an iconic Canadian brand, with a clear consumer proposition that reinforces quality, tradition and old world craftsmanship.
We are focusing our market expansion on three new high growth platforms: alternative proteins, snacking and sustainable meat.
While our exploration into alternative protein markets is in the early stages, it is an intriguing opportunity. The North American market for non–meat based protein is forecast to grow at 5%–8% annually, fuelled by health and environmental concerns. It is a natural extension for Maple Leaf Foods, as Canada’s leading meat company, to branch out into alternative protein products. We are continuing our research into this emerging market to assess potential paths to growth.
Snacking now represents approximately 49% of our daily food and beverage consumption and is a dietary trend that is steadily growing. It is a category dominated by high sugar snacks, chips and other lower nutrition foods, with a dearth of healthy and good tasting meat-based options. We completed significant consumer and market research throughout 2015, leading to a launch this year of a new line of natural meat snacks that are moist and flavourful and provide a healthy snacking option packed with protein and essential minerals. We believe there is significant opportunity to leverage our strong brands to increase our penetration in this fast growing market.
Our most ambitious growth platform is in sustainable meat, where our progress is much further advanced. Broadly defined, sustainable meat focuses on how animals are raised and the associated nutritional, welfare and environmental impacts.
In 2015, Maple Leaf launched a comprehensive sustainability strategy focused on advancing nutrition and health, community involvement, animal care and environmental sustainability. Our goal is to deeply embed sustainability in how we operate, and create business value through addressing social and environmental issues. As people increasingly focus on what is in their food and how it is produced, there is significant opportunity in building leadership in sustainable meat: producing more natural, nutritious foods; implementing a strong animal care program; lending our voice and resources to address the critical issue of food insecurity; and substantially reducing our environmental footprint.
Our product innovations all utilize simpler, natural ingredients and conform to 2016 Health Canada sodium guidelines. We are completing an extensive review of our products with a goal to advance nutrition and simplify ingredients across the portfolio. We have committed to being a leader in animal care and are launching a comprehensive strategy in 2016 aimed at further developing our culture, accountability, practices and communications. We are well along in meeting our commitment to transition all sows we manage from restrictive gestation crates to loose housing, with approximately
14,500 sows transitioned by the end of 2015. We are assessing ways to accelerate the pace of this important initiative with a goal to advance the conversion of our remaining barns, delivering significant benefits from both an animal welfare and a commercial perspective.
We are now the largest processor of “raised without antibiotics” pork in North America and the leader in the Canadian poultry industry. In 2016, we are also launching community involvement and environmental sustainability strategies, with ambitious plans and targets to accelerate our progress in becoming a sustainable meat company.
Our success is built on the strength of many – from the dedicated men and women who work at Maple Leaf, to our suppliers, loyal customers and consumers, to our community stakeholders – and I extend my very sincere thanks to all of you. Our leadership team and Board are energized and excited about the years ahead. We have successfully established a highly competitive cost structure and have the brands, market shares and growth strategies to deliver strong financial growth. We look forward to rewarding our shareholders with the benefits from many years of investment and change.
Sincerely,
Michael H. McCain President and CEO February 2016
III
ANNUAL REPORT | 2015 | MAPLE LEAF FOODS INC.
The past year was pivotal for Maple Leaf Foods, as we completed the rebuild of our prepared meats manufacturing and distribution network. This massive undertaking required significant investment, rigorous management and careful oversight. Maple Leaf is now positioned with a more competitive cost base, high-quality products and powerful brands. In combination with our people, our values, and our commitment to customers and the communities we serve, this unlocks exciting potential for the future. Our 2015 financial results provide a glimpse into that future.
A key part of the strategy was the divestiture of several non-core businesses in order to strengthen the balance sheet. Overseeing this balance sheet restructuring was a significant part of our deliberations in 2015. Reflecting a strong cash position, early in 2015 the dividend per share was doubled to $0.08 per quarter, reflecting the Board’s confidence in our progress. This February, the Board approved an increase to $0.09 per quarter. In 2015, we also entered into a Normal Course Issuer Bid to counter the dilutive effect of equity-based compensation plans. By the end of January 2016, $194.5 million was expended to purchase the full 8.65 million shares authorized under the bid.
Anticipation of, and adaptation to, market changes never ends. Current shifts and trends include industry consolidation, accelerated cost reduction and the increasing role of lifestyle and social factors that are influencing food purchasing decisions. The management team views these trends as opportunities. Coupled with Maple Leaf Foods’ commercial strengths, we have the most advanced supply chain in the Canadian prepared meats industry and we are cost competitive with our North American peers. We have also adopted a sustainability strategy focused on delivering social, environmental and commercial benefits.
I want to thank my colleagues on the Board for their many contributions. Like the culture of Maple Leaf Foods, our Board is highly engaged and we encourage different perspectives, points of view and open debate. We benefit from interaction with Management, which deepens our understanding of the business, challenges and opportunities. I offer a vote of thanks to our Management and all the people who define Maple Leaf Foods, what we do, how we do it and what we stand for.
To our shareholders, we thank you for your investment in Maple Leaf Foods. Your support has enabled the Company to reach high ground, with good visibility to alternative paths to prosperity. Your thoughts and perspectives are valued as we weigh options for ongoing deployment of capital to optimize future profitable growth.
Sincerely,
David L. EmersonChairmanFebruary 2016
MESSAGE FROM THE CHAIRMAN
ANNUAL REPORT | 2015 | MAPLE LEAF FOODS INC.
IV
CORPORATE GOVERNANCE AND BOARD OF DIRECTORS
Corporate Governance The Board of Directors and Management of the Company are committed to maintaining a high standard of corporate governance. The Board has responsibility for the overall stewardship of the Company and discharges such responsibility by reviewing, discussing and approving the Company’s strategic planning and organizational structure and supervising Management with a view to preserving and enhancing the underlying value of the Company. Management of the business within this process and structure is the responsibility of the Chief Executive Officer and Senior Management.
The Board has adopted guidelines to assist it in meeting its corporate governance responsibilities. The roles of the Board, the Chief Executive Officer, the Chairman and the individual committees are clearly delineated. Together with the Chairman and the Corporate Governance Committee, the Board assesses its processes and practices regularly to ensure its governance objectives are met.
Composition of the Board of DirectorsThe Company’s directors are very experienced, high-calibre business leaders with diverse relevant skills and competencies. The Board of Directors has assessed each of the Company’s nine non-management directors to be independent.
A more comprehensive analysis of the Company’s approach to corporate governance matters is included in the Management Proxy Circular for the May 4, 2016 annual meeting of shareholders.
Board of Directors William E. Aziz, CPA, CA President and Chief Executive Officer, BlueTree Advisors II Inc. (Private management advisory firm)
W. Geoffrey Beattie Chief Executive Officer, Generation Capital (Investment management firm)
Gregory A. Boland President and Chief Executive Officer, West Face Capital Inc. (Investment manager)
John L. Bragg, O.C., LL.D, F.ICD Chairman, President and Co-Chief Executive Officer, Oxford Frozen Foods Limited (Food manufacturing)
Ronald G. Close Corporate Director
The Honourable David L. Emerson Corporate Director
Jean M. Fraser Retired Partner, Osler, Hoskins & Harcourt
Claude R. Lamoureux, O.C., F.ICD, ICD.D Corporate Director
Michael H. McCain President and Chief Executive Officer, Maple Leaf Foods Inc.
James P. Olson Corporate Director
V
ANNUAL REPORT | 2015 | MAPLE LEAF FOODS INC.
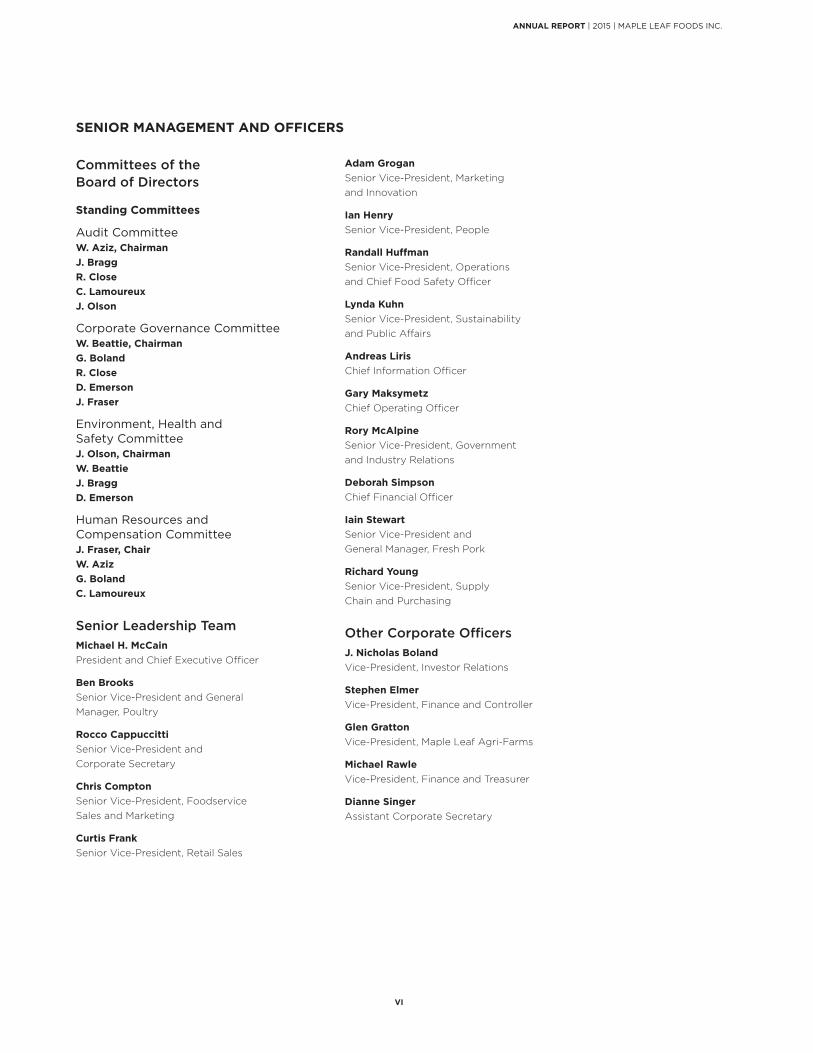
SENIOR MANAGEMENT AND OFFICERS
Committees of the Board of Directors
Standing Committees
Audit CommitteeW. Aziz, Chairman J. BraggR. CloseC. LamoureuxJ. Olson
Corporate Governance CommitteeW. Beattie, ChairmanG. BolandR. CloseD. EmersonJ. Fraser
Environment, Health and Safety CommitteeJ. Olson, ChairmanW. BeattieJ. BraggD. Emerson
Human Resources and Compensation CommitteeJ. Fraser, Chair W. Aziz G. Boland C. Lamoureux
Senior Leadership TeamMichael H. McCain President and Chief Executive Officer
Ben BrooksSenior Vice-President and General Manager, Poultry
Rocco CappuccittiSenior Vice-President and Corporate Secretary
Chris ComptonSenior Vice-President, Foodservice Sales and Marketing
Curtis FrankSenior Vice-President, Retail Sales
Adam GroganSenior Vice-President, Marketing and Innovation
Ian Henry Senior Vice-President, People
Randall Huffman Senior Vice-President, Operations and Chief Food Safety Officer
Lynda Kuhn Senior Vice-President, Sustainability and Public Affairs
Andreas Liris Chief Information Officer
Gary Maksymetz Chief Operating Officer
Rory McAlpine Senior Vice-President, Government and Industry Relations
Deborah Simpson Chief Financial Officer
Iain Stewart Senior Vice-President and General Manager, Fresh Pork
Richard Young Senior Vice-President, Supply Chain and Purchasing
Other Corporate OfficersJ. Nicholas Boland Vice-President, Investor Relations
Stephen Elmer Vice-President, Finance and Controller
Glen Gratton Vice-President, Maple Leaf Agri-Farms
Michael Rawle Vice-President, Finance and Treasurer
Dianne Singer Assistant Corporate Secretary
ANNUAL REPORT | 2015 | MAPLE LEAF FOODS INC.
VI

2015 FINANCIAL REVIEW

All dollar amounts are presented in Canadian dollars unless otherwise noted.
February 29, 2016
THE BUSINESSMaple Leaf Foods Inc. ("Maple Leaf Foods" or the "Company") is a leading Canadian consumer protein company, making highquality, innovative products under national brands including Maple Leaf®, Maple Leaf Prime®, Maple Leaf NaturalSelections®, Schneiders®, Schneiders Country Naturals® and Mina™. The Company employs approximately 11,500 peopleacross Canada and exports to global markets, including the U.S. and Asia. The Company is headquartered in Mississauga,Ontario and its shares trade on the Toronto Stock Exchange (MFI).
DIVESTITURE OF CANADA BREAD COMPANY, LIMITEDOn May 23, 2014, Grupo Bimbo, S.A.B. de C.V. of Mexico (“Grupo Bimbo”) acquired the 90.0% of issued and outstandingshares of Canada Bread Company, Limited ("Canada Bread") owned by the Company, by way of a statutory plan ofarrangement under the Business Corporations Act (Ontario) (the “Arrangement”). The Company received gross proceeds ofapproximately $1,657.0 million (which includes its share of the dividend paid upon closing of the Arrangement) for its 90.0%interest in Canada Bread, resulting in a pre-tax gain of $997.0 million for the year ended December 31, 2014. Upon the sale ofthe business, the net assets of Canada Bread have been derecognized.
OPERATING SEGMENTSThe Company’s results are organized into three segments: Meat Products Group, Agribusiness Group and Bakery ProductsGroup.
The Meat Products Group includes value-added prepared meats, lunch kits and snacks, and fresh pork and poultry productssold under leading Canadian brands such as Maple Leaf®, Schneiders® and many leading regional brands.
The Agribusiness Group includes Canadian hog production operations that primarily supply the Meat Products Group withlivestock as well as toll feed sales.
The combination of the Company's Meat Products Group and Agribusiness Group comprises the Protein Group.
The Bakery Products Group was comprised of the Company's 90.0% ownership in Canada Bread, which has been classifiedas discontinued operations following the announced sale of the Company's interest in Canada Bread in the first quarter of2014. Refer to Note 22 of the Company's 2015 audited consolidated financial statements for further information.
FINANCIAL OVERVIEW
In 2015, sales from continuing operations increased 4.3% to $3,292.9 million from $3,157.2 million last year, or 2.4% afteradjusting for the impact of foreign exchange, due to higher sales in the Meat Products Group and an additional week in thefourth quarter of 2015.
Adjusted Operating Earnings(i) for the year was $109.8 million compared to a loss of $75.5 million last year. Adjusted Earningsper Share(ii) was $0.58 compared to a loss of $0.56 last year. These improvements were largely a result of improved marginsin the Meat Products Group.
Net earnings from continuing operations for the year was $41.6 million ($0.30 per basic share attributable to commonshareholders(iii)) compared to a loss of $213.8 million (loss of $1.51 per share) last year. This included $33.8 million ($0.18 pershare) of restructuring and other related costs (2014: $67.6 million, or $0.36 per share). The improvement was due primarily toimproved margins in the Meat Products Group, non-recurring financing costs that were incurred last year in relation to therepayment of the Company's outstanding debt and lower restructuring and other related costs.
Several items are excluded from the discussions of underlying earnings performance as they are not representative of ongoingoperational activities. Refer to the section entitled Non-IFRS Financial Measures of this Management Discussion and Analysison page 27 for a description and reconciliation of all non-IFRS financial measures.
Notes: (i) Adjusted Operating Earnings, a non-IFRS measure, is used by Management to evaluate financial operating results. It is
defined as earnings from continuing operations adjusted for items that are not considered representative of ongoingoperational activities of the business, and items where the economic impact of the transactions will be reflected inearnings in future periods when the underlying asset is sold or transferred. Please refer to the section entitled Non-IFRSFinancial Measures starting on page 27 of this document.
MANAGEMENT'S DISCUSSION AND ANALYSIS | 2015 | MAPLE LEAF FOODS INC.
Management’s Discussion and Analysis
1

(ii) Adjusted Earnings per Share, a non-IFRS measure, is used by Management to evaluate financial operating results. It isdefined as basic earnings per share from continuing operations attributable to common shareholders, and is adjusted onthe same basis as Adjusted Operating Earnings. Please refer to the section entitled Non-IFRS Financial Measures startingon page 27 of this document.
(iii) Unless otherwise stated, all per share amounts are presented as per basic share attributable to common shareholders.
SELECTED FINANCIAL INFORMATIONThe following table summarizes selected financial information for the three years ended December 31:
($ millions except earnings per share) 2015 2014(i) 2013(ii)
Sales $ 3,292.9 $ 3,157.2 $ 2,954.8Adjusted Operating Earnings(iii) $ 109.8 $ (75.5) $ (136.5)Adjusted EBITDA(iv) $ 219.8 $ 14.8 $ (48.7)Adjusted EBITDA %(iii) 6.7% 0.5% (1.6%)Net earnings (loss) from continuing operations $ 41.6 $ (213.8) $ (141.4)Adjusted Earnings per Share(iii) $ 0.58 $ (0.56) $ (1.08)Basic earnings per share from continuing operations $ 0.30 $ (1.51) $ (1.01)Diluted earnings per share from continuing operations $ 0.29 $ (1.51) $ (1.01)Total assets(v) $ 2,630.9 $ 2,876.5 $ 3,599.1Net Cash (Debt)(iii)(v) $ 281.6 $ 485.8 $ (451.7)Total long-term liabilities(v) $ 248.6 $ 244.8 $ 990.6Return on Net Assets ("RONA")(iii)(v) 4.8% (3.7%) (0.2%)Cash provided (used) by operating activities(v) $ 159.4 $ (362.2) $ 260.1Cash dividends per share $ 0.32 $ 0.16 $ 0.16
(i) 2014 figures exclude the results of the Bakery Products Group, which are reported as discontinued operations. Refer toNote 22 of the Company's 2015 audited consolidated financial statements.
(ii) Unless otherwise noted, 2013 figures have been restated for the classification the Bakery Products Group as discontinuedoperations. Refer to Note 22 of the Company's 2015 audited consolidated financial statements.
(iii) Refer to the section entitled Non-IFRS Financial Measures starting on page 27 of this document.(iv) Adjusted EBITDA is calculated as earnings from continuing operations before interest and income taxes plus depreciation
and intangible asset amortization, adjusted for items that are not considered representative of ongoing operationalactivities of the business, and items where the economic impact of the transactions will be reflected in earnings in futureperiods when the underlying asset is sold or transferred. Please refer to the section entitled Non-IFRS Financial Measuresstarting on page 27 of this document.
(v) 2013 balance sheet figures have not been restated for the classification of Rothsay By-Product Recycling ("Rothsay") andthe Bakery Products Group as discontinued operations. Refer to Note 22 of the Company's 2015 audited consolidatedfinancial statements.
DISCUSSION OF FACTORS IMPACTING THE COMPANY'S OPERATIONS AND RESULTS Value Creation PlanIn September 2010, the Board of Directors of Maple Leaf Foods approved a comprehensive Value Creation Plan ("the Plan")designed to significantly increase profitability and competitiveness through cost reduction and productivity enhancement. TheCompany has executed against the Plan over the last five years by reducing product complexity, closing less efficientmanufacturing and distribution operations and consolidating production and distribution into a smaller number of efficient scalefacilities. The Plan is substantially complete. The only remaining element is to optimize the operations and eliminate ramp-upinefficiencies, primarily at the new prepared meats facility in Hamilton, Ontario.
The Company successfully closed its two remaining legacy facilities in the first half of 2015. Since its inception, the Plan hasincluded the construction of a new 400,000 square foot prepared meats processing facility, the consolidation of 17 distributioncentres into two, the closure of eight legacy manufacturing plants, and expansion of three others.
MANAGEMENT'S DISCUSSION AND ANALYSIS | 2015 | MAPLE LEAF FOODS INC.
2

The Company has standardized product formulations, sizes and specifications and eliminated lower volume, lower valueproduct lines in its prepared meats business. It has largely converted its enterprise resource planning software to SAP,replacing a number of legacy systems into one platform that provides increased controls and capabilities.
The Company has begun to realize savings from multiple sources across the organization, including:
• Enhanced throughput and productivity from larger scale and new technologies,
• Lower total overhead and reduced direct labour,
• Improved product yield, reduced waste and better packaging, and
• Reduced distribution costs.
It is anticipated that the elimination of the ramp-up inefficiencies in 2016 will enable the Company to achieve its target of a run-rate Adjusted EBITDA margin of 10.0% sometime in the course of 2016.
Capital Investment Plan During 2014, estimates of capital investments in the Plan were revised to be approximately $710.0 million in aggregatebetween 2010 and 2015. This estimate included $620.0 million supporting the Company's prepared meats network and $90.0million to implement SAP, both of which are substantially completed as of December 31, 2015 and in line with this costestimate.
Sustainability In 2015, the Company launched a comprehensive sustainability strategy focused on advancement in four areas: nutrition andhealth, people and communities, animal care and environmental sustainability. The Company's goal is to deeply embedsustainability into how it operates and to create business value through addressing social and environmental issues. As peopleincreasingly focus on what is in their food and how it is produced, there is significant opportunity in building leadership insustainable protein by producing more natural, nutritious foods; lending our voice and resources to address the critical issue offood insecurity; implementing a strong animal care program; and reducing our environmental footprint. The Company reportson its progress against its sustainability goals using the Global Reporting Initiative (GRI) Standards for Sustainability Reportingand posts an annual report to its sustainability website (www.mapleleafsustainability.ca). This website is also regularly updatedwith other developments.
Maple Leaf Food’s Sustainability PrioritiesThe Company has defined four sustainability priorities and areas of focus:
Advance Nutrition and Health
There is significant commercial and social benefit to advancing the nutrition and health benefits of the Company’s products.Maple Leaf Foods continues to advance the use of simpler, natural ingredients, reducing or eliminating antibiotic use in animalproduction, and reducing sodium levels to meet Health Canada guidelines. A comprehensive analysis of product ingredients isunderway in order to develop a comprehensive plan to advance nutrition across the portfolio.
Value its People and Communities
The Company values a strong culture that keeps people safe, rewards excellence and empowers employees to learn andcontribute their best. This includes a robust workplace safety program, which has driven continuous material reductions inworkplace accidents. The Company is committed to being a destination for top talent, supported by leadership and careerdevelopment, training and developing a formalized diversity and inclusion strategy. The Company is also increasing itsengagement in responding to the critical national and global issue of hunger, through a comprehensive communityinvolvement program that will advance sustainable food security.
Treat Animals Well
In 2015, the Company launched a formal Animal Care Commitment that articulates the principles, goals and actions it will taketo become a leader in animal care. This includes advancing a culture of animal care through communications, education andtraining; robust policies and procedures; regular reporting of performance and conducting frequent, rigorous internal andindependent audits; advancing practices and technologies based on sound science; and providing clear, fact-basedcommunication of goals, performance and progress.
Eliminate Waste
The Company is committed to reducing its environmental footprint by 50% by 2025, encompassing the three areas where theCompany has the largest environmental impact: climate change, water usage and waste reduction. Utility, water and wasteaudits were initiated in 2015 and will be completed in 2016. The Company is identifying opportunities to advanceenvironmental goals in these three areas. The Company will be implementing environmental sustainability action planscommencing in 2016.
MANAGEMENT'S DISCUSSION AND ANALYSIS | 2015 | MAPLE LEAF FOODS INC.
3

Fluctuating Input PricesThe following table outlines the change in key commodity prices that affected the Company’s business and financial results:
As atDecember
31, 2015
Annual Averages(Unaudited) 2015 2014 Change 2013Pork cutout (US$ per cwt)(i)(ii) $ 69.51 $ 79.13 $ 110.20 (28.2%) $ 92.86Hog market price per cwt (US$ per cwt)(i)(ii) $ 53.03 $ 70.59 $ 105.14 (32.9%) $ 89.64Hog market price per cwt (CAD per cwt)(i)(ii) $ 73.39 $ 90.28 $ 116.14 (22.3%) $ 92.33Poultry meat market price (CAD per kg)(iii) $ 3.61 $ 3.71 $ 3.58 3.6% $ 3.51Poultry live bird cost (CAD per kg)(iii) $ 1.56 $ 1.56 $ 1.61 (3.1%) $ 1.69Corn (US$ per bushel)(iv) $ 3.59 $ 3.81 $ 4.18 (8.9%) $ 5.80Soybeans (US$ per bushel)(iv) $ 8.71 $ 9.44 $ 12.46 (24.2%) $ 14.06Oil (US$ per barrel)(iv) $ 37.13 $ 48.66 $ 93.26 (47.8%) $ 97.91
(i) As at December 31, 2015, rate based on spot prices for the week ended January 2, 2016 based on CME (Source: USDA).(ii) Annual averages based on five-day average on CME (Source: USDA).(iii) Market price (Source: Express Market Inc.) and Live Cost (Source: Chicken Farmers of Ontario).(iv) Daily close prices (Sources: Bloomberg, CME, Thomson Reuters).
In 2015, U.S. hog supplies rebounded from the impacts of the Porcine Epidemic Diarrhea ("PED") virus, resulting in anincrease in hog production and a significant decline in hog market prices, which was offset by a weakening Canadian dollar.Feed grain prices declined slightly compared to last year, however the weakening Canadian dollar increased prices withinCanada. Overall the negative impacts of decreased hog market prices and increased feed costs on earnings in the hogproduction business were largely offset by favourable impacts of commodity hedging programs.
Industry primary pork processing margins, the spread between pork cutout and hog market prices, improved significantly overlast year, exceeding the five-year average margin of $5.80 USD per cwt. This increase was largely attributable to a materialspike in pork belly prices during the second half of 2015. The benefit experienced in fresh pork was mostly offset by increasedinput costs in prepared meats.
The Company uses derivatives and other non-derivative financial instruments to manage its exposures to fluctuations incommodity prices.
Impact of CurrencyThe following table outlines the changes in currency rates that have affected the Company’s business and financial results:
As atDecember
31, 2015
Annual Averages2015 2014 Change 2013
U.S. dollar / Canadian dollar(i) $ 1.38 $ 1.28 $ 1.10 16.4 % $ 1.03Canadian dollar / Japanese yen(i) ¥ 86.88 ¥ 94.66 ¥ 95.63 (1.0)% ¥ 94.64
(i) Source: Bank of Canada daily noon rates
The Canadian dollar weakened relative to the U.S. dollar by 16.4% in 2015. In the short-term, a weaker Canadian dollarexpands export margins in the Company’s primary pork processing and hog production operations. Conversely, a weakerCanadian dollar increases the cost of raw materials and ingredients in the domestic prepared meats business. The preparedmeats business is able to react to changes in input costs through pricing, cost reduction or investment in value-addedproducts. Over the longer-term, a weaker Canadian dollar increases the relative competitiveness of the domestic Canadianpackaged goods operation, as imports of competing products from the U.S. become less competitive. Similarly, the Companyalso has a greater ability to export and expand into the U.S. market.
During 2015, the Japanese yen increased in value relative to the Canadian dollar by 1.0%, which did not have a materialimpact on earnings. In general, an increase in the Japanese yen strengthens export margins to Japan in the Company’s freshpork business. The Company ultimately seeks to manage pricing to offset the impact of currency fluctuations.
The Company uses derivatives and other non-derivative financial instruments to manage its exposures to fluctuations inforeign exchange rates.
MANAGEMENT'S DISCUSSION AND ANALYSIS | 2015 | MAPLE LEAF FOODS INC.
4

OPERATING REVIEW The following table summarizes sales by business segment for the two years ended December 31:
($ millions) 2015(iii) 2014(iii) Change
Meat Products Group $ 3,277.0 $ 3,135.4 4.5%Agribusiness Group 15.9 21.9 (27.1%)Total Sales(i) $ 3,292.9 $ 3,157.2 4.3%
The following table summarizes Adjusted Operating Earnings by business segment for the two years ended December 31:
($ millions) 2015(iii) 2014(iii) Change
Meat Products Group $ 108.4 $ (80.4) $ 188.8Agribusiness Group 1.4 8.6 (7.3)
Protein Group $ 109.8 $ (71.7) $ 181.5Non-Allocated Costs in Adjusted Operating Earnings(ii) — (3.7) 3.7Adjusted Operating Earnings(i) $ 109.8 $ (75.5) $ 185.3
(i) 2014 figures exclude the results of the Bakery Products Group, which are reported as discontinued operations. Refer toNote 22 of the Company's 2015 audited consolidated financial statements.
(ii) Non-allocated costs are comprised of expenses not separately identifiable to business segment groups, and do not formpart of the measures used by the Company when assessing the segments’ operating results.
(iii) May not add due to rounding.
Meat Products Group Includes value-added prepared meats, lunch kits and snacks, and fresh pork and poultry products sold under leadingCanadian brands such as Maple Leaf®, Schneiders® and many leading regional brands.
Sales in the Meat Products Group for 2015 increased 4.5% to $3,277.0 million, or 2.6% after adjusting for the weakerCanadian dollar. Higher sales resulted from increased volume in fresh pork and poultry, pricing in prepared meats that wasimplemented in the second quarter of 2014, a favourable sales mix in fresh poultry and an extra week in the fourth quarter of2015. This increase was partially offset by lower selling prices for fresh pork and a slight decline in prepared meats volume.
Adjusted Operating Earnings for 2015 increased to $108.4 million compared to a loss of $80.4 million last year. Earnings inprepared meats benefited from pricing, an improved sales mix, lower overall raw material costs and lower operating costs inthe new prepared meats plant network. The Company benefited from the flow through of pricing implemented in the secondquarter of 2014 to offset the impact of higher raw material costs driven by the outbreak of the PED virus in U.S. hog productionherds. Although on average raw material costs returned to more normalized levels, this decrease was largely offset by theimpact of a lower Canadian dollar on the Company's prepared meats business. Lower operating costs resulted primarily from areduction of duplicative overhead costs, as the Company closed its two remaining legacy plants in the first half of 2015,eliminating the final components of its duplicative supply chain. In addition, during the second half of 2015 the Companycontinued to make progress in reducing ramp-up inefficiencies in its plant network, primarily at the new prepared meats facilityin Hamilton, Ontario.
Fresh pork earnings increased largely as a result of increased volume and improved Canadian retail and export margins.Industry pork processing margins improved significantly over the same period last year, when they were below the five yearaverage, however the benefit of higher prices was partially offset by declining by-product values. Fresh poultry earningsincreased as a result of higher volume, improved poultry processing margins, an improved sales mix resulting from increasedretail branded volume and increased operating efficiencies.
Agribusiness Group Includes Canadian hog production operations that primarily supply the Meat Products Group with livestock as well as toll feedsales.
Agribusiness Group sales in 2015 were $15.9 million compared to $21.9 million last year, due to lower external sales volumefor feed.
Adjusted Operating Earnings in 2015 decreased to $1.4 million from $8.6 million last year, as a result of a substantial declinein hog prices in the second half of 2015, which was not fully offset by the Company's risk management program and thebenefit of a lower Canadian dollar. Also negatively impacting earnings was an increase in feed grain prices as a result of the
MANAGEMENT'S DISCUSSION AND ANALYSIS | 2015 | MAPLE LEAF FOODS INC.
5
weaker Canadian dollar. Increased operating costs were incurred in relation to the ongoing conversion of existing sow barns toloose housing, supporting the Company's animal care program. This was offset by lower costs relating to the prevention of thePED virus.
Non-allocated Costs Non-allocated amounts that are excluded from Adjusted Operating Earnings in 2015 comprise of a $12.8 million loss due tochanges in the fair value of biological assets (2014: gain of $0.5 million) and a $3.9 million unrealized loss on futures contracts(2014: gain of $4.1 million). In 2014, an $8.7 million expense related to the modification of a long-term incentive compensationplan was excluded from Adjusted Operating Earnings, as described in Note 24 of the Company's 2015 audited consolidatedfinancial statements.
There were no non-allocated costs included in Adjusted Operating Earnings in 2015. In 2014, expenses of $3.7 million wereincluded in Adjusted Operating Earnings and related to corporate costs that were not allocated to any reportable segment.
The changes in the fair value of biological assets and unrealized (gains) losses on futures contracts have been excluded fromAdjusted Operating Earnings, as the economic impact of these transactions will be reflected in earnings in future periods whenthe underlying asset is sold or transferred. The cost associated with the modification of the long-term incentive plan wasexcluded from Adjusted Operating Earnings, as this was a decision made as a result of the sale of the Company’s interest inCanada Bread, and is not considered representative of ongoing operational activities of the business.
DISCONTINUED OPERATIONSSales from discontinued operations for the year ended December 31, 2014 were $567.9 million relating to Canada Bread. Netearnings from discontinued operations for the year ended December 31, 2014 was $925.7 million. This included $931.3 millionin earnings from Canada Bread and residual expenses relating to the divestitures of the Olivieri Fresh Pasta and Sauce andRothsay businesses.
For additional information on discontinued operations please see Note 22 of the Company's 2015 audited consolidatedfinancial statements.
GROSS MARGIN Gross margin in 2015 was $381.1 million (11.6% of sales) compared to $218.3 million (6.9% of sales) last year. The increasein gross margin as a percentage of sales is largely attributable to margin improvement in the Meat Products group. Preparedmeats benefited from pricing, lower raw material costs and lower operating costs in its new plant network, which were partiallyoffset by the impact of a lower Canadian dollar and a slight decline in volume. Fresh pork benefited from increased volumeand higher margins for export and Canadian retail sales, partially offset by lower selling prices for fresh pork. Fresh poultrybenefited from increased volume and a favourable sales mix, driven by increased retail branded volume. Also included ingross margin was a $13.3 million decrease in the fair value of biological assets and an $8.0 million decrease in the fair value ofunrealized mark-to-market commodity contracts.
The changes in the fair value of biological assets and unrealized and realized (gains) losses on futures contracts have beenexcluded from Adjusted Operating Earnings, as the economic impact of the transactions will be reflected in earnings in futureperiods when the underlying asset is sold or transferred.
SELLING, GENERAL AND ADMINISTRATIVE EXPENSE During the year, selling, general and administrative expense decreased by 3.3% to $288.1 million (8.7% of sales), compared to$297.9 million (9.4% of sales) last year. The decrease is largely due to a non-recurring $8.7 million expense related to themodification of a long-term incentive compensation plan recorded in 2014, as described in Note 24 of the of the Company's2015 audited consolidated financial statements. The cost associated with the modification of the long-term incentive plan wasexcluded from Adjusted Operating Earnings as this was a decision made as a result of the then planned sale of the Company’sinterest in Canada Bread, and was therefore not considered representative of ongoing operational activities of the business.
In 2015, the Company enhanced its efforts in streamlining the organization and reducing non-strategic costs, which includedthe reduction of over 400 salaried positions, with a majority being completed late in the fourth quarter and the remaindercontinuing in 2016, along with other cost reductions. The Company expects to continue its focus on organizational efficienciesto maintain a highly competitive cost structure and support a renewed focus on growth. The Company's goal is to minimize thecost of running the business so it can focus its investments on growing the business.
OTHER INCOME (EXPENSE)Other expense for 2015 was $1.9 million (2014: expense of $16.8 million) and primarily included a depreciation charge onassets servicing divested businesses, partially offset by a gain on sale of investment properties. Other expense in 2014 largelycomprised of a depreciation charge on assets servicing divested businesses.
MANAGEMENT'S DISCUSSION AND ANALYSIS | 2015 | MAPLE LEAF FOODS INC.
6

Certain items in other income (expense) are excluded from the calculation of Adjusted EBITDA and Adjusted Earnings perShare as they are not considered representative of ongoing operational activities of the business. Other income (expense)used in the calculation of Adjusted EBITDA and Adjusted Earnings per Share for 2015 is income of $1.2 million (2014: expenseof $1.6 million).
RESTRUCTURING AND OTHER RELATED COSTSRestructuring and other related costs for 2015 were $33.8 million compared to $67.6 million last year. The Meats ProductsGroup incurred $15.3 million (2014: $37.2 million) in restructuring and other related costs. Of this amount, $8.7 million (2014:$21.4 million) related to asset impairment and accelerated depreciation, $2.4 million (2014: $12.8 million) related to severanceand other employee costs and $4.2 million (2014: $3.0 million) related to site closing costs.
The balance of restructuring costs for 2015 and 2014 related primarily to severance and other employee costs that wereincurred in connection with other ongoing management and organizational structure restructuring initiatives.
INTEREST EXPENSE AND OTHER FINANCING COSTS Interest expense and other financing costs for 2015 were $4.7 million compared to $126.9 million last year. The decrease wasmainly due to lower debt levels and nonrecurring financing costs of $98.6 million related to the repayment of the Company'soutstanding debt in the second quarter of 2014.
INCOME TAXESThe Company’s income tax expense relating to continuing operations for 2015 resulted in an effective tax rate of 21.0% (2014:25.9% tax recovery). The lower effective tax rate in 2015 is primarily the result of a favourable resolution of an income taxaudit. The effective tax rate excluding this item is 26.6%. For 2015, the effective tax recovery rate on restructuring chargesused in the computation of Adjusted Earnings per Share is 26.0% (2014: 25.2%). The effective tax recovery rate on items notconsidered representative of continuing operations in 2015 was 26.5% (2014: 27.0%).
MANAGEMENT'S DISCUSSION AND ANALYSIS | 2015 | MAPLE LEAF FOODS INC.
7

TRANSACTIONS WITH RELATED PARTIESThe Company had a 90.0% controlling interest in Canada Bread, a publicly traded subsidiary that was consolidated into theCompany’s results and presented as a discontinued operation, until its sale in May 2014. Transactions between the Companyand its consolidated entities have been eliminated in the Company's 2015 audited consolidated financial statements.Subsequent to the sale of this controlling interest, Canada Bread ceased to be a related party of the Company and theCompany is no longer consolidating the results and the related balance sheet of Canada Bread, as discussed in Note 22 of theCompany's 2015 audited consolidated financial statements.
The Company sponsors a number of defined benefit and defined contribution plans. During the year ended December 31,2015, the Company received $0.0 million (2014: $0.7 million) from the defined benefit pension plans for reimbursement ofexpenses incurred by the Company to provide services to these plans. During the year ended December 31, 2015, theCompany's contributions to these plans were $9.6 million (2014: $21.3 million, which includes $3.7 million made by CanadaBread, which has been presented as discontinued operations).
Key management personnel are those persons having authority and responsibility for planning, directing, and controlling theactivities of the Company and/or its subsidiary, directly or indirectly, including any external director of the Company and/or itssubsidiary.
Remuneration of key management personnel of the Company is comprised of the following expenses:
2015 2014(i)
Short-term employee benefitsSalaries, bonuses, and fees $ 7,052 $ 12,350Company car allowances 274 298Other benefits 256 183
Total short-term employee benefits $ 7,582 $ 12,831Severance benefits(ii) 476 14,193Post-employment benefits 782 946Share-based compensation 8,811 25,076
Total remuneration $ 17,651 $ 53,046(i) Includes remuneration of Canada Bread key management personnel until the sale of Canada Bread on May 23, 2014.(ii) The 2014 balance includes $5.6 million of share-based compensation.
During the year ended December 31, 2015, key management personnel of the Company exercised 0.1 million (2014: 1.3million) share options granted under the Maple Leaf Foods Share Incentive Plan for an amount of $1.7 million (2014: $15.5million).
The Company’s largest shareholder is McCain Capital Inc. (“MCI”) which is beneficially owned and controlled by Mr. MichaelH. McCain, Chief Executive Officer and President of the Company. For the year ended December 31, 2015, the Companyincurred expenses of $0.4 million, which represents the market value of the transactions with MCI. As at December 31, 2015,$0.0 million was owing to MCI relating to these transactions.
During the year ended December 31, 2015, the Company agreed to sublease office space to McCain Financial AdvisoryServices ("MFAS"), an entity jointly controlled by Mr. Michael H. McCain, for cost equal to the amount that the Company isobligated to pay under its lease. For the year ended December 31, 2015, the Company recorded $0.1 million of subleaseincome from MFAS and as at December 31, 2015, $0.1 million was owing from MFAS.
ACQUISITIONS AND DIVESTITURES There were no acquisitions or divestitures relating to continuing operations during the years ended December 31, 2015 and2014.
CAPITAL RESOURCES The consumer packaged meats industry in which the Company operates is generally characterized by high sales volume andhigh turnover of inventories and accounts receivable. In general, accounts receivable and inventories are readily convertibleinto cash. Investment in working capital is affected by fluctuations in the price of raw materials, seasonal and other market-related fluctuations. The Company has in the past consistently generated a strong base level of operating cash flow, even inperiods of higher commodity prices and restructuring of its operations. These operating cash flows provide a base of
MANAGEMENT'S DISCUSSION AND ANALYSIS | 2015 | MAPLE LEAF FOODS INC.
8
underlying liquidity that the Company supplements with credit facilities and cash on hand to provide longer-term funding and tofinance fluctuations in working capital levels.
On February 3, 2015, the Company amended its existing $200.0 million committed credit facility by extending the maturity dateof the facility to June 30, 2016 under similar terms and conditions using the same syndicate of Canadian, U.S., andinternational institutions. The committed facility is unsecured and bears interest based on short-term interest rates. The facilityis intended to meet the Company’s funding requirements for general corporate purposes and to provide appropriate levels ofliquidity. As at December 31, 2015, the Company had drawn letters of credit of $60.3 million (2014: $21.6 million) on thisfacility.
On August 6, 2014, the Company entered a new uncommitted credit facility for issuing up to a maximum of $120.0 million ofletters of credit. As at December 31, 2015, $79.4 million (2014: $82.3 million) of letters of credit had been issued thereon.These letters of credit have been collateralized with cash, as further described in Note 4 of the Company’s 2015 auditedconsolidated financial statements.
The Company's cash balance as at December 31, 2015 is $292.3 million (2014: $496.3 million). The Company has invested inshort-term deposits in Canadian financial institutions with long-term debt ratings of A or higher.
To access competitively priced financing and to further diversify its funding sources, the Company operates accountsreceivable securitization facilities, under which it has sold certain accounts receivable, with very limited recourse, to an entityowned by an international financial institution with a long-term AA- debt rating. The receivables are sold at a discount to facevalue based on prevailing money market rates. At the end of 2015, the Company had $192.6 million (2014: $156.6 million) oftrade accounts receivable serviced under these facilities. In return for the sale of these receivables, the Company will receivecash of $88.9 million (2014: $46.4 million) and notes receivable in the amount of $103.7 million (2014: $110.2 million). Due tothe timing of receipts and disbursements, the Company may, from time to time, record a receivable or payable related to thesecuritization facility, and as at December 31, 2015, this net payable amounted to $2.9 million (2014: $30.4 million netpayable). The maximum cash advance available to the Company under this program is $110.0 million. These facilities wereaccounted for as an off-balance sheet transaction in accordance with International Financial Reporting Standards (“IFRS”) andwill expire in September 2016.
The Company's securitization and other credit facilities are subject to certain restrictions, including the maintenance ofcovenants. The Company was in compliance with all of the requirements of these facilities during 2015. If the securitizationwas to be terminated, the Company would recognize the related amounts on the consolidated balance sheet and consideralternative financing if required.
CAPITAL EXPENDITURES Capital expenditures for 2015 were $145.8 million compared to $233.8 million, or $216.0 million excluding discontinuedoperations, in 2014 and compared to the Company's estimate of $120.0 million at the beginning of the year. The increase overthe Company's original estimate for 2015 was due to spending on a number of smaller scale incremental profit enhancementprojects in the Meat Products Group. The reduction in spending from 2014 is related to lower investments in the meatprocessing facility in Hamilton, Ontario.
The Company currently estimates its capital expenditures for the full year of 2016 will be approximately $175.0 million. Thisestimate includes the Company's expectation that it will spend its depreciation rate on improving and maintaining its plantnetwork. Included in the 2016 estimate is approximately $65.0 million relating to profit enhancement projects, primarilyconsisting of investments to optimize fresh pork packaging capabilities and the prepared meats bacon facility.
NORMAL COURSE ISSUER BIDOn March 23, 2015 the Toronto Stock Exchange ("TSX") accepted the Company's notice of intention to commence a newNormal Course Issuer Bid ("NCIB"), which allowed the Company to repurchase, at its discretion, up to approximately 8.65million common shares in the open market or as otherwise permitted by the TSX, subject to the normal terms and limitations ofsuch bids. Common shares purchased by the Company are canceled. The program commenced on March 25, 2015 and wasterminated subsequent to year end, on January 22, 2016, as the Company completed its purchase and cancellation of 8.65million common shares for $194.5 million at a volume weighted average price paid of $22.48 per common share. During theyear ended December 31, 2015, 8.14 million shares were purchased for cancellation for $182.5 million at a volume weightedaverage price paid of $22.44 per common share.
CASH FLOW AND FINANCING Net cash, a non-IFRS measure as described on page 30, was $281.6 million at the end of 2015, compared to $485.8 million in2014. The decrease in cash for the year ended December 31, 2015 is largely due to share repurchases under the NCIBprogram, investments in property and equipment and increased dividend payments, partially offset by increased cash flowfrom operations.
MANAGEMENT'S DISCUSSION AND ANALYSIS | 2015 | MAPLE LEAF FOODS INC.
9
Cash Flow from Operating Activities Cash provided by operations for 2015 was $159.4 million compared to cash used in operations of $362.2 million in 2014. Theimprovement in cash flow from operations was primarily due to higher earnings from operations, a lower investment in workingcapital and non-recurring one time payments related to the repayment of Company's senior notes in the second quarter of2014.
Cash Flow from Financing Activities Cash used in financing activities was $224.6 million for 2015 compared to $973.7 million in 2014. Cash used in 2015 primarilyrelated to share repurchases under the NCIB program of $182.5 million and dividend payments of $44.7 million. The Companydoubled its annual dividend to $0.32 per voting common share compared to $0.16 last year. Cash used in 2014 primarilyrelated to the repayment of the Company's senior notes and outstanding balance on the credit facility and dividend payments,partially offset by exercised stock options.
Cash Flow from Investing Activities Cash used in investing activities was $138.9 million for 2015 compared to cash provided of $1,330.0 million in 2014. Cashused in 2015 primarily related to capital expenditures. Cash provided in 2014 primarily related to proceeds received from theCanada Bread sale of $1,647.0 million, partially offset by associated transaction costs and capital expenditures relating mainlyto the construction of the new prepared meats facility in Hamilton, Ontario.
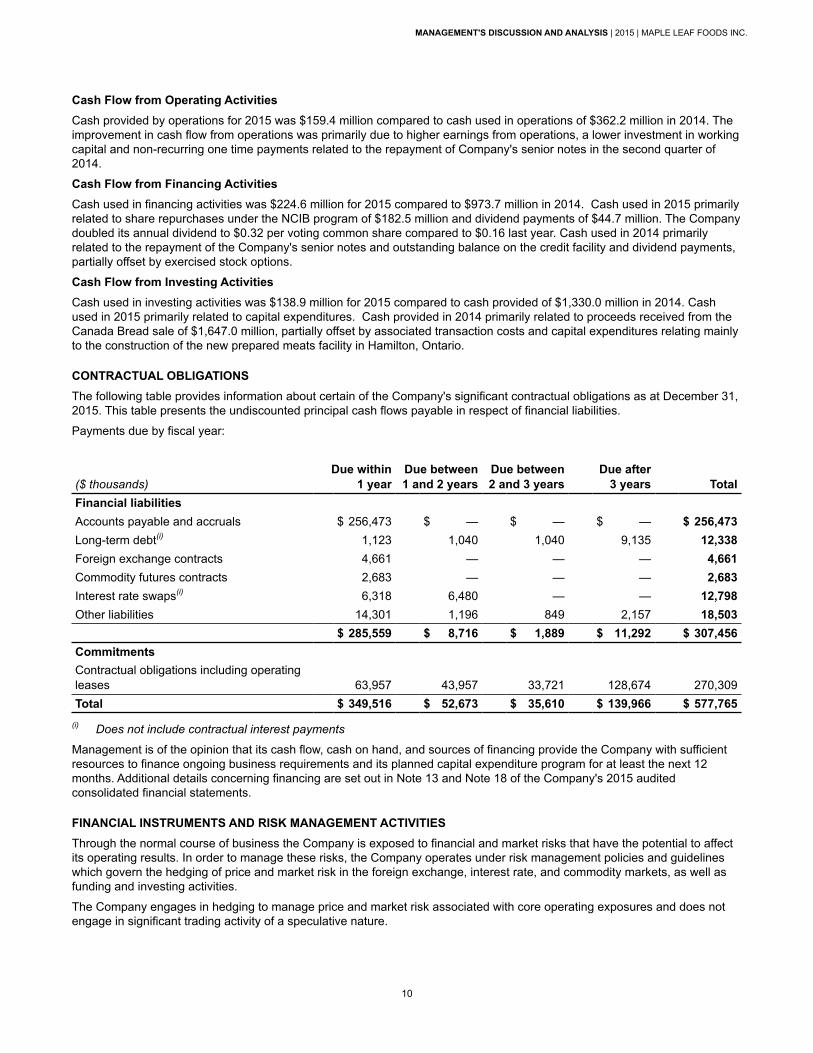
CONTRACTUAL OBLIGATIONSThe following table provides information about certain of the Company's significant contractual obligations as at December 31,2015. This table presents the undiscounted principal cash flows payable in respect of financial liabilities.
Payments due by fiscal year:
($ thousands)Due within
1 yearDue between1 and 2 years
Due between2 and 3 years
Due after 3 years Total
Financial liabilitiesAccounts payable and accruals $ 256,473 $ — $ — $ — $ 256,473Long-term debt(i) 1,123 1,040 1,040 9,135 12,338Foreign exchange contracts 4,661 — — — 4,661Commodity futures contracts 2,683 — — — 2,683Interest rate swaps(i) 6,318 6,480 — — 12,798Other liabilities 14,301 1,196 849 2,157 18,503
$ 285,559 $ 8,716 $ 1,889 $ 11,292 $ 307,456CommitmentsContractual obligations including operatingleases 63,957 43,957 33,721 128,674 270,309Total $ 349,516 $ 52,673 $ 35,610 $ 139,966 $ 577,765
(i) Does not include contractual interest payments
Management is of the opinion that its cash flow, cash on hand, and sources of financing provide the Company with sufficientresources to finance ongoing business requirements and its planned capital expenditure program for at least the next 12months. Additional details concerning financing are set out in Note 13 and Note 18 of the Company's 2015 auditedconsolidated financial statements.
FINANCIAL INSTRUMENTS AND RISK MANAGEMENT ACTIVITIESThrough the normal course of business the Company is exposed to financial and market risks that have the potential to affectits operating results. In order to manage these risks, the Company operates under risk management policies and guidelineswhich govern the hedging of price and market risk in the foreign exchange, interest rate, and commodity markets, as well asfunding and investing activities.
The Company engages in hedging to manage price and market risk associated with core operating exposures and does notengage in significant trading activity of a speculative nature.
MANAGEMENT'S DISCUSSION AND ANALYSIS | 2015 | MAPLE LEAF FOODS INC.
10
The Company’s Risk Management Committee meets frequently to discuss current market conditions, review current hedgingprograms and trading activity, and approve any new hedging or trading strategies.
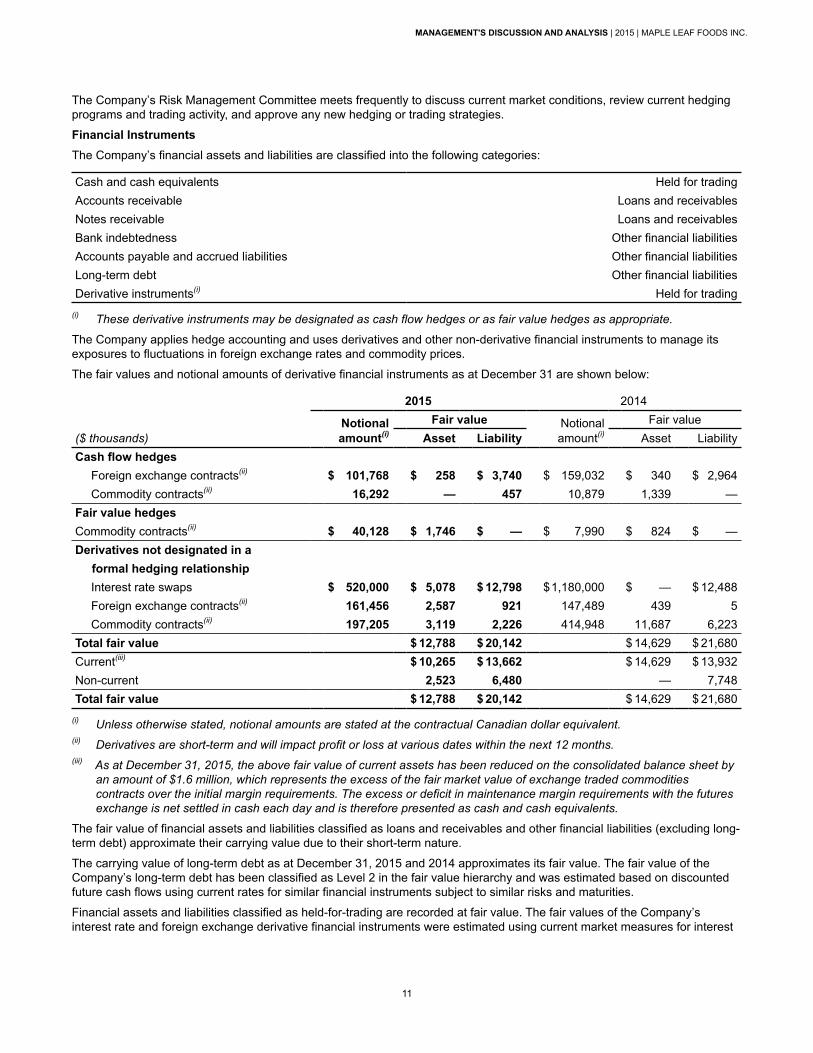
Financial InstrumentsThe Company’s financial assets and liabilities are classified into the following categories:
Cash and cash equivalents Held for tradingAccounts receivable Loans and receivablesNotes receivable Loans and receivablesBank indebtedness Other financial liabilitiesAccounts payable and accrued liabilities Other financial liabilitiesLong-term debt Other financial liabilitiesDerivative instruments(i) Held for trading
(i) These derivative instruments may be designated as cash flow hedges or as fair value hedges as appropriate.
The Company applies hedge accounting and uses derivatives and other non-derivative financial instruments to manage itsexposures to fluctuations in foreign exchange rates and commodity prices.
The fair values and notional amounts of derivative financial instruments as at December 31 are shown below:
2015 2014
Notionalamount(i)
Fair value Notionalamount(i)
Fair value($ thousands) Asset Liability Asset LiabilityCash flow hedges
Foreign exchange contracts(ii) $ 101,768 $ 258 $ 3,740 $ 159,032 $ 340 $ 2,964Commodity contracts(ii) 16,292 — 457 10,879 1,339 —
Fair value hedgesCommodity contracts(ii) $ 40,128 $ 1,746 $ — $ 7,990 $ 824 $ —Derivatives not designated in a formal hedging relationship
Interest rate swaps $ 520,000 $ 5,078 $ 12,798 $1,180,000 $ — $ 12,488Foreign exchange contracts(ii) 161,456 2,587 921 147,489 439 5Commodity contracts(ii) 197,205 3,119 2,226 414,948 11,687 6,223
Total fair value $ 12,788 $ 20,142 $ 14,629 $ 21,680Current(iii) $ 10,265 $ 13,662 $ 14,629 $ 13,932Non-current 2,523 6,480 — 7,748Total fair value $ 12,788 $ 20,142 $ 14,629 $ 21,680
(i) Unless otherwise stated, notional amounts are stated at the contractual Canadian dollar equivalent. (ii) Derivatives are short-term and will impact profit or loss at various dates within the next 12 months. (iii) As at December 31, 2015, the above fair value of current assets has been reduced on the consolidated balance sheet by
an amount of $1.6 million, which represents the excess of the fair market value of exchange traded commoditiescontracts over the initial margin requirements. The excess or deficit in maintenance margin requirements with the futuresexchange is net settled in cash each day and is therefore presented as cash and cash equivalents.
The fair value of financial assets and liabilities classified as loans and receivables and other financial liabilities (excluding long-term debt) approximate their carrying value due to their short-term nature.
The carrying value of long-term debt as at December 31, 2015 and 2014 approximates its fair value. The fair value of theCompany’s long-term debt has been classified as Level 2 in the fair value hierarchy and was estimated based on discountedfuture cash flows using current rates for similar financial instruments subject to similar risks and maturities.
Financial assets and liabilities classified as held-for-trading are recorded at fair value. The fair values of the Company’sinterest rate and foreign exchange derivative financial instruments were estimated using current market measures for interest
MANAGEMENT'S DISCUSSION AND ANALYSIS | 2015 | MAPLE LEAF FOODS INC.
11
rates and foreign exchange rates. Commodity futures and commodity options contracts are exchange-traded and over-the-counter. Fair value is determined based on exchange prices and other observable market data.
Derivatives not designated in a formal hedging relationship are classified as held-for-trading. Net gains and losses on financialinstruments held-for-trading consist of realized and unrealized gains and losses on derivatives that were de-designated orwere otherwise not in a formal hedging relationship.
For the year ended December 31, 2015, the Company recorded a gain of $32.4 million (2014: loss of $27.9 million) onfinancial instruments held for trading. The gain was mainly attributed to a gain in commodity exchange traded contracts whichhedge and offset price risk volatility inherent in the hog operational business.
For the year ended December 31, 2015, the pre-tax amount of hedge ineffectiveness recognized in other income was a gain of$0.1 million (2014: loss of $0.2 million).
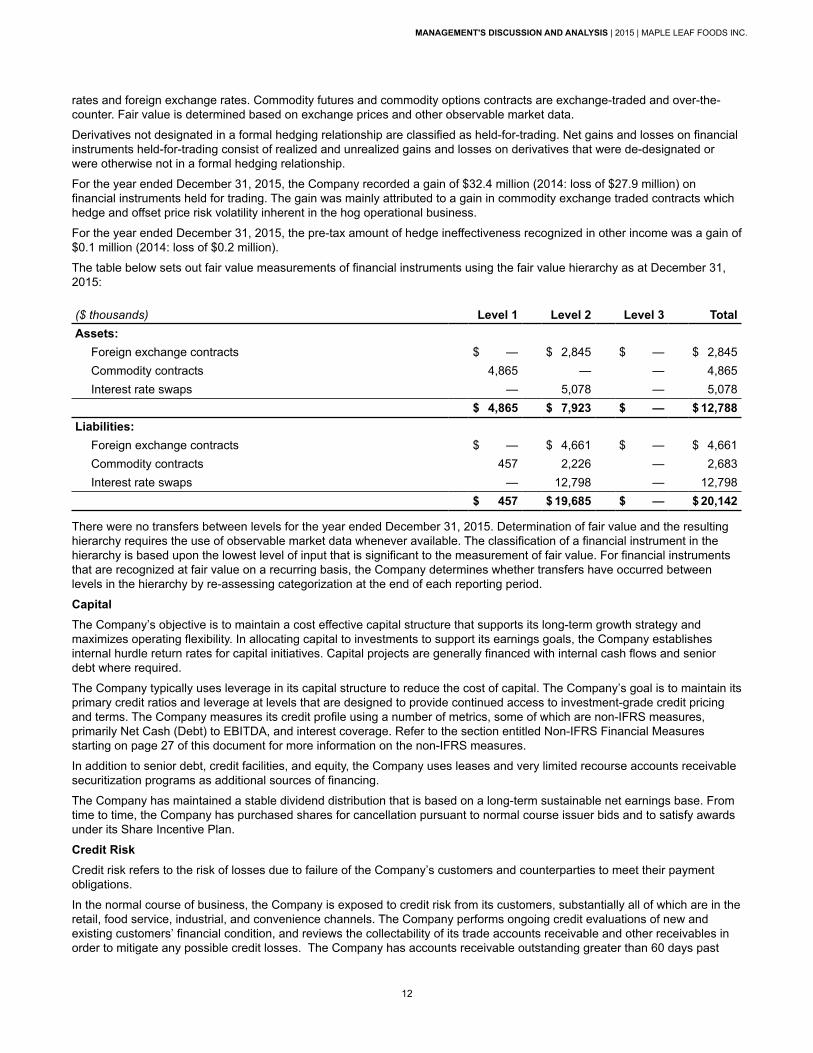
The table below sets out fair value measurements of financial instruments using the fair value hierarchy as at December 31,2015:
($ thousands) Level 1 Level 2 Level 3 TotalAssets:
Foreign exchange contracts $ — $ 2,845 $ — $ 2,845Commodity contracts 4,865 — — 4,865Interest rate swaps — 5,078 — 5,078
$ 4,865 $ 7,923 $ — $ 12,788Liabilities:
Foreign exchange contracts $ — $ 4,661 $ — $ 4,661Commodity contracts 457 2,226 — 2,683Interest rate swaps — 12,798 — 12,798
$ 457 $ 19,685 $ — $ 20,142
There were no transfers between levels for the year ended December 31, 2015. Determination of fair value and the resultinghierarchy requires the use of observable market data whenever available. The classification of a financial instrument in thehierarchy is based upon the lowest level of input that is significant to the measurement of fair value. For financial instrumentsthat are recognized at fair value on a recurring basis, the Company determines whether transfers have occurred betweenlevels in the hierarchy by re-assessing categorization at the end of each reporting period.
CapitalThe Company’s objective is to maintain a cost effective capital structure that supports its long-term growth strategy andmaximizes operating flexibility. In allocating capital to investments to support its earnings goals, the Company establishesinternal hurdle return rates for capital initiatives. Capital projects are generally financed with internal cash flows and seniordebt where required.
The Company typically uses leverage in its capital structure to reduce the cost of capital. The Company’s goal is to maintain itsprimary credit ratios and leverage at levels that are designed to provide continued access to investment-grade credit pricingand terms. The Company measures its credit profile using a number of metrics, some of which are non-IFRS measures,primarily Net Cash (Debt) to EBITDA, and interest coverage. Refer to the section entitled Non-IFRS Financial Measuresstarting on page 27 of this document for more information on the non-IFRS measures.
In addition to senior debt, credit facilities, and equity, the Company uses leases and very limited recourse accounts receivablesecuritization programs as additional sources of financing.
The Company has maintained a stable dividend distribution that is based on a long-term sustainable net earnings base. Fromtime to time, the Company has purchased shares for cancellation pursuant to normal course issuer bids and to satisfy awardsunder its Share Incentive Plan.
Credit RiskCredit risk refers to the risk of losses due to failure of the Company’s customers and counterparties to meet their paymentobligations.
In the normal course of business, the Company is exposed to credit risk from its customers, substantially all of which are in theretail, food service, industrial, and convenience channels. The Company performs ongoing credit evaluations of new andexisting customers’ financial condition, and reviews the collectability of its trade accounts receivable and other receivables inorder to mitigate any possible credit losses. The Company has accounts receivable outstanding greater than 60 days past
MANAGEMENT'S DISCUSSION AND ANALYSIS | 2015 | MAPLE LEAF FOODS INC.
12

due and maintains an allowance for doubtful accounts relating to specific losses estimated on individual exposures asdescribed in Note 5 of the Company's 2015 audited consolidated financial statements. Average accounts receivable dayssales outstanding for the year is consistent with historic trends.
Management believes concentrations of credit risk with respect to accounts receivable is limited due to the generally highcredit quality of the Company’s major customers, the large number and geographic dispersion of smaller customers, and theoperation of the accounts receivable securitization as mentioned previously. The Company does, however, conduct asignificant amount of business with a small number of large grocery retailers.
During the year ended December 31, 2015, the Company reported sales to one customer representing 14.0% of total sales.These revenues were reported in the Meat Products Group. No other sales were made to any one customer that representedin excess of 10% of total sales.
During the year ended December 31, 2014, the Company reported sales to two customers representing 15.5% and 11.1% oftotal sales from continuing operations. No other sales were made to any one customer that represented in excess of 10% oftotal sales.
The Company is exposed to credit risk on its notes receivable from a financial institution that holds an equity interest in anunconsolidated structured entity in respect of the accounts receivable securitization program as described in Note 25 of theCompany's 2015 audited consolidated financial statements. Management believes that this credit risk is limited by the long-term AA- debt rating held by the counterparty. The Company is exposed to credit risk on its cash and cash equivalents(comprising primarily of deposits with Canadian chartered banks) and non-exchange-traded derivative contracts. TheCompany mitigates this credit risk by transacting primarily with counterparties that are major international financial institutionswith long-term debt ratings of A or higher. The Company’s maximum exposure to credit risk at the balance sheet dateconsisted primarily of the carrying value of non-derivative financial assets and non-exchange-traded derivatives with positivefair values.
Liquidity RiskLiquidity risk is the risk that the Company will encounter difficulty in meeting obligations associated with financial liabilities.
The Company manages liquidity risk by monitoring forecasted and actual cash flows, minimizing reliance on any single sourceof credit, maintaining sufficient undrawn committed credit facilities and managing the maturity profiles of financial assets andfinancial liabilities to minimize re-financing risk.
As at December 31, 2015, the Company had available undrawn committed credit of $139.7 million (2014: $178.4 million)under the terms of its principal banking arrangements (refer to Note 13 of the Company's 2015 audited consolidated financialstatements). These banking arrangements are subject to certain covenants and other restrictions.
Market RiskInterest Rate Risk
Interest rate risk refers to the risk that the value of a financial instrument or cash flows associated with the instrument willfluctuate due to changes in market interest rates.
The Company’s interest rate risk arises from long-term borrowings issued at fixed rates that create fair value interest rate riskand variable rate borrowings that create cash flow interest rate risk. In addition, the Company’s cash balances are typicallyinvested in short-term interest bearing assets.
The Company manages its interest rate risk exposure by using a mix of fixed and variable rate debt and periodically usinginterest rate derivatives to achieve the desired proportion of variable to fixed-rate debt.
At December 31, 2015 and 2014, the Company had no variable rate debt, however, the Company is exposed to floatinginterest rates on its accounts receivable securitization program. As at December 31, 2015, the amount serviced pursuant tothis program was $91.5 million at a weighted average interest rate of 1.6% (2014: $76.6 million at a weighted average interestrate of 2.1%). The maximum amount available to the Company under these programs is $110.0 million (2014: $110.0 million).
As at December 31, 2015, 10.4% (2014: 12.0%) of the Company’s outstanding debt and revolving accounts receivablesecuritization program were not exposed to interest rate movements.
On March 14, 2014, the Company issued a notice of repayment of its notes payable, with a subsequent repayment on April 14,2014 (refer to Note 13 of the Company's 2015 audited consolidated financial statements). On the original issuance of the U.S.denominated debt, and in order to hedge against the foreign exchange risk associated with the issuance of U.S. denominateddebt, the Company entered into cross-currency interest rate swaps. The cross-currency swaps converted the U.S.denominated fixed-rate notes, into fixed-rate Canadian denominated notes, and were accounted for as cash flow hedges.
As a result of the decision to accelerate the repayment of all outstanding notes, hedge accounting on all of the cross-currencyinterest rate swaps has been discontinued. This resulted in a reclassification of $9.6 million from accumulated othercomprehensive income (loss), to interest expense and other financing costs for the year ended December 31, 2014. During
MANAGEMENT'S DISCUSSION AND ANALYSIS | 2015 | MAPLE LEAF FOODS INC.
13
the same period, the Company terminated cross-currency interest rate swaps maturing in 2021 and the remaining cross-currency swaps matured in 2014.
As at December 31, 2015, the Company had fixed-rate debt of $10.7 million (2014: $10.5 million) with a weighted averagenotional interest rate of 4.4% (2014: 4.4%). Changes in market interest rates cause the fair value of long-term debt with fixedinterest rates to fluctuate but do not affect net earnings, as the Company’s debt is carried at amortized cost and the carryingvalue does not change as interest rates change.
Foreign Exchange Risk
Foreign exchange risk refers to the risk that the value of financial instruments or cash flows will fluctuate due to changes inforeign exchange rates.
The Company’s foreign exchange risk arises primarily from transactions in currencies other than Canadian dollars, U.S. dollar-denominated borrowings, and investments in foreign operations.
The Company uses foreign exchange forward contracts to manage foreign exchange transaction exposures. The primarycurrencies to which the Company is exposed to are the U.S. dollar and the Japanese yen.
Commodity Price Risk
The Company is exposed to price risk related to commodities such as live hogs, fuel costs, and purchases of certain otheragricultural commodities used as raw materials, including feed grains. The Company may use fixed price contracts withsuppliers as well as exchange-traded and over-the-counter futures and options to manage its exposure to price fluctuations onoperating results.
Derivatives designated as a hedge of an anticipated or forecasted transaction are accounted for either as cash flow or fairvalue hedges and are managed within the Company’s hedge accounting portfolio.
The Company applies the “normal purchases” classification to certain contracts that are entered into for the purpose ofprocuring commodities to be used in production.
For a comprehensive discussion on the Company’s risk management practices and derivative exposures, please refer to Note18 of the Company's 2015 audited consolidated financial statements.
SHARE CAPITAL As at December 31, 2015 there were 135,058,974 voting common shares issued and outstanding (2014: 142,943,520). As atFebruary 19, 2016, there were 134,571,289 common shares issued and outstanding.
In each of the quarters of 2015, the Company declared and paid cash dividends of $0.08 per voting common share,representing a total annual dividend of $0.32 per voting common share and aggregate dividend payments of $44.7 million. Ineach of the quarters of 2014, the Company declared and paid cash dividends of $0.04 per voting common share, representinga total annual dividend of $0.16 per voting common share and aggregate dividend payments of $22.7 million.
OTHER MATTERSOn February 29, 2016, the Board of Directors approved an increase in the quarterly cash dividend to $0.09 per share, $0.36per share on an annual basis, from $0.08 per share, payable March 31, 2016, to shareholders of record at the close ofbusiness on March 11, 2016. Unless indicated otherwise by the Company in writing at or before the time the dividend is paid,the dividend will be considered an Eligible Dividend for the purposes of the “Enhanced Dividend Tax Credit System”.
EMPLOYEE BENEFIT PLANSThe cost of pensions and other post-retirement benefits earned by employees is actuarially determined using the projectedunit credit method calculated on service and Management’s best estimate of salary escalation, retirement ages of employeesand expected health care costs. Management employs external experts to advise it when deciding upon the appropriateestimates to use to value employee benefit plan obligations and expenses. These estimates are determined at the beginningof each year and re-evaluated if changes in estimates and market conditions indicate that there may be a significant effect onthe Company’s financial statements.
During 2015, the Company recorded a pre-tax gain of $0.5 million through other comprehensive income (loss) related to there-measurement of plan assets and liabilities. This includes $1.4 million of pre-tax returns on plan assets in excess of thediscount rate, which was offset by a pre-tax loss of $0.8 million related to differences between plan experience compared toactuarial assumptions.
During 2014, the Company recorded a loss of $67.0 million through other comprehensive income (loss) related to the re-measurement of plan assets and liabilities. This includes a loss of $102.4 million related to changes in liability assumptions,primarily a change in the discount rate, and a further $21.5 million as a result of changes in other actuarial assumptions,
MANAGEMENT'S DISCUSSION AND ANALYSIS | 2015 | MAPLE LEAF FOODS INC.
14

primarily related to a change in mortality rate assumptions. This was partially offset by $57.9 million of returns on plan assetsin excess of the discount rate. The above amounts exclude the results of discontinued operations.
The Company operates both defined contribution and defined benefit plans. The assets of the defined benefit plans areinvested primarily in foreign and domestic fixed income and equity securities that are subject to fluctuations in market prices.Discount rates used to measure plan liabilities are based on long-term market interest rates. Fluctuations in these marketprices and rates can impact pension expense and funding requirements. In 2015, the investment return before expenses onthe Company's defined benefit pension plan assets was 3.9% compared to 10.1% in 2014.
The Company's contributions are funded through cash flows generated from operations. Management anticipates that futurecash flows from operations will be sufficient to fund expected future cash contributions. Contributions to defined benefit plansduring 2015 were $5.2 million (2014: $6.3 million excluding discontinued operations).
The Company expects to contribute $10.7 million to the pension plans in 2016, inclusive of defined contribution and multi-employer plans.
MANAGEMENT'S DISCUSSION AND ANALYSIS | 2015 | MAPLE LEAF FOODS INC.
15

SUMMARY OF QUARTERLY RESULTS The following is a summary of unaudited quarterly financial information for each quarter in the last three fiscal years:
($ millions except earnings per share)First
QuarterSecond Quarter
Third Quarter
Fourth Quarter Total(iv)
Sales(i) 2015 $ 780.2 $ 820.8 $ 818.8 $ 873.1 $ 3,292.92014 711.3 831.8 820.1 794.0 3,157.22013 689.4 759.3 757.8 748.3 2,954.8
Net earnings (loss) from continuingoperations(i) 2015 $ (2.9) $ (7.5) $ 18.7 $ 33.3 $ 41.6
2014 (124.6) (39.5) (26.7) (23.0) (213.8)2013 (30.6) (38.4) (24.5) (47.9) (141.4)
Net earnings (loss) 2015 $ (2.9) $ (7.5) $ 18.7 $ 33.3 $ 41.62014 (132.0) 898.9 (26.8) (28.2) 711.92013 (14.7) 0.0 15.5 511.4 512.2
Earnings (loss) per share from continuingoperations(i)
Basic(ii) 2015 $ (0.02) $ (0.05) $ 0.13 $ 0.24 $ 0.302014 (0.89) (0.28) (0.19) (0.16) (1.51)2013 (0.22) (0.27) (0.18) (0.34) (1.01)
Diluted(ii) 2015 $ (0.02) $ (0.05) $ 0.13 $ 0.24 $ 0.292014 (0.89) (0.28) (0.19) (0.16) (1.51)2013 (0.22) (0.27) (0.18) (0.34) (1.01)
Adjusted EPS(ii)(iii) 2015 $ 0.05 $ 0.13 $ 0.16 $ 0.25 $ 0.582014 (0.24) (0.12) (0.12) (0.08) (0.56)2013 (0.24) (0.25) (0.19) (0.41) (1.08)
Earnings (loss) per share(ii)
Basic(ii) 2015 $ (0.02) $ (0.05) $ 0.13 $ 0.24 $ 0.302014 (0.95) 6.38 (0.19) (0.20) 5.032013 (0.11) (0.02) 0.09 3.58 3.55
Diluted(ii) 2015 $ (0.02) $ (0.05) $ 0.13 $ 0.24 $ 0.292014 (0.95) 6.38 (0.19) (0.20) 5.032013 (0.11) (0.02) 0.09 3.58 3.55
(i) Figures exclude discontinued operations.(ii) Basic and diluted earnings (loss) per share, earnings (loss) per share from continuing operations and Adjusted Earnings
(loss) per Share from continuing operations are based on amounts attributable to common shareholders. (iii) Refer to Non-IFRS Financial Measures starting on page 27 of this document. (iv) May not add due to rounding.
Quarterly sales in 2015 were affected by improved volume in fresh pork and poultry, increased pricing in prepared meats in2014, a favourable sales mix in fresh poultry and an extra week in the fourth quarter of 2015. This was partially offset by lowermarket prices and a slight decline in prepared meats volume. Quarterly sales in 2014 were affected by higher market prices infresh pork, increased pricing in prepared meats in 2013 and 2014, offset by lower volume in prepared meats.
Quarterly net earnings from continuing operations in 2015 were affected by price increases in prepared meats in 2014, lowertransitional costs, improved pork and poultry processing margins, restructuring and other related costs, changes in fair value ofnon-designated interest rate swaps, (gains) losses from changes in market values of biological assets, and (gains) losses onfutures contracts. Quarterly net earnings from continuing operations in 2014 were affected by transitional costs, lower volumeand compressed margins due to increased raw material costs in prepared meats, higher market prices for hogs, earlyredemption financing costs, restructuring and other related costs, the expense related to a modification of a long-term
MANAGEMENT'S DISCUSSION AND ANALYSIS | 2015 | MAPLE LEAF FOODS INC.
16

incentive plan and changes in fair value of non-designated interest rate swaps, (gains) losses from changes in market valuesof biological assets, and (gains) losses on futures contracts.
For an explanation and analysis of quarterly results, please refer to the Company’s Management’s Discussion and Analysis foreach of the respective quarterly periods which are filed on SEDAR and also available on the Company’s website atwww.mapleleaffoods.com.
SUMMARY OF 2015 FOURTH QUARTER RESULTSThe following is a summary of sales by business segment:
($ millions)(Unaudited)
Fourth Quarter2015 2014 Change
Meat Products Group $ 868.5 $ 789.7 10.0%Agribusiness Group 4.6 4.3 7.0%Total Sales(i) $ 873.1 $ 794.0 10.0%
The following is a summary of Adjusted Operating Earnings by Business Segment:
($ millions)(Unaudited)
Fourth Quarter2015(ii) 2014(ii) Change(ii)
Meat Products Group $ 54.6 $ (19.1) $ 73.7Agribusiness Group (6.9) 5.4 (12.3)Adjusted Operating Earnings(i) $ 47.8 $ (13.7) $ 61.4
(i) 2014 figures exclude the results of the Bakery Products Group, which are reported as discontinued operations. Refer toNote 22 of the Company's 2015 audited consolidated financial statements.
(ii) May not add due to rounding.
Sales of $873.1 million for the fourth quarter increased 10.0% from last year, or 7.0% after adjusting for the impacts of foreignexchange. This improvement was due to increased volume in fresh pork and poultry, a favourable sales mix in fresh poultryand an extra week in the fourth quarter of 2015, which was partially offset by lower selling prices for fresh pork and a slightdecline in prepared meats volume.
Adjusted Operating Earnings for the fourth quarter was $47.8 million compared to a loss of $13.7 million last year. Earnings inprepared meats increased as a result of lower operating costs in the Company's new prepared meats plant network, improvedsales mix resulting from a higher proportion of retail branded volume, and pricing. This was partially offset by a sharp rise inpork belly prices, which compressed margins. Fresh pork earnings grew due to increased volume and improved exportmargins. While industry pork processing margins strengthened compared to last year, when they were below the five yearaverage, the benefit to the Company was partially offset by declining by-product values and a sharp rise in belly prices, whichaffected prepared meats margins. Earnings in fresh poultry increased due to higher volume, stronger industry processingmargins, an improved sales mix reflecting higher retail branded volume and increased operating efficiencies.
Earnings in the Agribusiness Group declined due to a substantial decline in hog prices, which was not fully offset by theCompany's risk management program and the benefit of a lower Canadian dollar.
Adjusted Earnings per Share in the fourth quarter of 2015 was $0.25 compared to a loss of $0.08 last year. Net earnings fromcontinuing operations for the fourth quarter was $33.3 million ($0.24 per share) compared to net loss from continuingoperations of $23.0 million (loss of $0.16 per share) last year.
SEASONALITYThe Company is sufficiently large and diversified that seasonal factors within each operation and business tend to offset eachother; therefore, in isolation, they do not have a material impact on the Company’s consolidated earnings. For example, ingeneral, pork processing margins tend to be higher in the last half of the year when hog prices historically decline and, as aresult, earnings from hog production operations tend to be lower. Strong demand for grilled meat products positively affects thefresh and prepared meats operations in the summer, while back-to-school promotions support increased sales of sliced meatsand lunch items in the fall. Higher demand for turkey and ham products occurs in the spring and fourth quarter holidayseasons.
MANAGEMENT'S DISCUSSION AND ANALYSIS | 2015 | MAPLE LEAF FOODS INC.
17
ENVIRONMENTMaple Leaf Foods is committed to maintaining high standards of environmental responsibility and positive relationships in thecommunities where it operates. It operates within the framework of an environmental policy entitled “Our EnvironmentalCommitment” that is approved by the Board of Directors’ Environment, Health and Safety Committee ("Committee").
The Company’s environmental program is monitored on a regular basis by the Committee, including compliance withregulatory requirements and the use of internal environmental specialists and independent, external environmental experts.The Company continues to invest in environmental infrastructure related to water, waste, and air emissions to ensure thatenvironmental standards continue to be met or exceeded, while implementing procedures to reduce the impact of operationson the environment. In 2015, the Company closed its two remaining legacy facilities as part of its network transition under thePlan. In each case, environmental assessments were done to ensure that environmental matters are appropriately addressedduring decommissioning activities.
Expenditures related to current environmental requirements are not expected to have a material effect on the financial positionor earnings of the Company. However, there can be no assurance that certain events will not occur that will causeexpenditures related to the environment to be significant and have a material adverse effect on the Company’s financialcondition or results of operations. Such events could include, but not be limited to, additional environmental regulation or theoccurrence of an adverse event at one of the Company’s locations. The Company currently has a provision of $8.3 millionrelated to expected environmental remediation costs, please refer to Note 12 of the Company's 2015 audited consolidatedfinancial statements for additional information.
As a large food company there are health, environmental, and social issues that go beyond short-term profitability thatManagement believes must shape its business if the Company is to realize a sustainable future. Increasingly, soundenvironmental sustainability practices are becoming a key component of maintaining a competitive advantage. In 2015, theCompany announced a long-term goal to reduce its environmental footprint by 50% by 2025 in three key areas: climatechange, water usage and waste reduction. Performance will be communicated in the Company’s annual Sustainability Report.
RISK FACTORSThe Company operates in the food processing and agricultural businesses, and is therefore subject to risks and uncertaintiesrelated to this business that may have adverse effects on the Company’s results of operations and financial condition. Thefollowing risk factors should be considered carefully. These risk factors, along with other risks and uncertainties not currentlyknown to the Company, or that the Company currently considers immaterial, could materially and adversely affect theCompany’s future operating results and could cause actual events to differ materially from those described in forward-lookinginformation, including any financial outlooks, relating to the Company.
Risks Related to the Business of Maple Leaf Foods Focus on Protein Business
In 2013 and 2014, the Company sold its non-protein operations including potato products, rendering services and bakeryoperations. The Company is now primarily a protein business and as a result it is possible that earnings volatility may increaseand synergies and economies of scale will be forgone. Each of these factors may have a material adverse effect on theCompany’s financial condition and results of operations.
Risk of Returning or not Returning Capital to Shareholders
The Company has retained funds realized on the sales of its potato products, rendering services and bakery operations afterthe repayment of debt. In 2015, the Company initiated a normal course issuer bid for 8.65 million of its common shares, whichwas completed by the end of January 2016 for a total of $194.5 million. There can be no assurance that the Company willreturn any further funds to shareholders. In addition, if funds are returned to shareholders, there can be no assurance as to theexact mechanism by which such funds will be returned to shareholders. Furthermore, a return of funds or a failure to returnfunds to shareholders may have a material adverse effect on the Company’s share price.
Implementing the Value Creation Plan
The Plan announced in October 2010 is complex, lengthy, and transformational. Under the Plan, the Company constructedone large-scale manufacturing facility, closed eight plants and expanded three others. The Company also reconfigured itsdistribution systems into two large distribution centers. The Plan is substantially complete but work still remains to optimize theoperations and eliminate ramp-up inefficiencies.
There can be no assurance that the Company will be successful in achieving the full expected benefits of the Plan. As with anycomplex project or plan, events will transpire outside the Company’s control that were not anticipated or expected when thePlan was launched.
As a result of these initiatives, the Company’s operations will be more concentrated in fewer facilities resulting in the risk thatany unforeseen disruption in such facilities could have a greater effect on the operations of the Company as a whole.
MANAGEMENT'S DISCUSSION AND ANALYSIS | 2015 | MAPLE LEAF FOODS INC.
18

Leverage and Availability of Capital
The ability of the Company to secure short-term and long-term financing on terms acceptable to the Company is critical togrow and fund business growth and manage its liquidity. The ability to secure such additional capital on commerciallyfavourable and acceptable terms will, in part be determined by achieving the full financial objectives of the Plan. The failure orinability of the Company to secure short-term and long-term financing in the future on terms that are commercially reasonableand acceptable to the Company could have a significant impact on the Company’s opportunity for growth. Even if theCompany does successfully raise additional capital when needed, if it issues equity securities, investors will be diluted, and if itraises additional debt, it will be further leveraged and could be subject to restrictive covenants, such as restrictions on payingdividends or being required to pledge assets.
Systems Conversion, Standardization and Common Systems
The Company regularly implements process improvement initiatives to simplify and harmonize its systems and processes tooptimize performance and reduce the risk of errors in financial reporting. There cannot be any guarantee that any suchchanges will improve current processes or operating results or reduce the risk of errors in financial reporting. Any of thesefailures could have a material adverse impact on the Company’s financial condition and results of operations.
The Company continues to provide, among other things, information technology services to certain of its formerly ownedoperations under transitional arrangements with the purchasers on a cost recovery basis. The Company has developed a planto reduce the size and costs of information technology systems to fit its remaining operations at the end of the transitionalassistance period. There can be no assurance that the Company will be fully successful in eliminating these costs at the endof the transitional assistance period or that after the reduction the information systems will maintain their accuracy andreliability. Any of these failures could have a material adverse impact on the Company’s financial condition and results ofoperations.
Food Safety and Consumer Health
The Company is subject to risks that affect the food industry in general, including risks posed by food spoilage, accidentalcontamination, product tampering, consumer product liability, and the potential costs and disruptions of a product recall. TheCompany’s products are susceptible to contamination by disease-producing organisms, or pathogens, such as E. coli,salmonella and listeria. There is a risk that these pathogens could be present in the Company’s products. The Companyactively manages these risks by maintaining strict and rigorous controls and processes in its manufacturing facilities anddistribution systems and by maintaining prudent levels of insurance. However, the Company cannot assure that such systems,even when working effectively, will eliminate the risks related to food safety. The Company could be required to recall certain ofits products in the event of contamination or adverse test results or as precautionary measures, similar to other recalls initiatedin the past. There is also a risk that not all of the product subject to the recall will be properly identified, or that the recall willnot be successful or not be enacted in a timely manner. Any product contamination could subject the Company to productliability claims, adverse publicity and government scrutiny, investigation or intervention, resulting in increased costs anddecreased sales. Many of these costs and losses are not covered by insurance. Any of these events could have a materialadverse impact on the Company’s financial condition and results of operations.
Business Acquisitions, Divestitures, and Capital Expansion Projects
While the Company’s focus has been integration of existing operations and supply chain optimization, the Company continuesto review opportunities for strategic growth through acquisitions. Any acquisitions may involve large transactions orrealignment of existing investments, and present financial, managerial and operational challenges, which, if not successfullyovercome, may reduce the Company’s profitability. These risks include: the diversion of Management’s attention from existingcore businesses; difficulties integrating or separating personnel, financial, and other systems; adverse effects on existingbusiness relationships with suppliers and customers; inaccurate estimates of the rate of return on acquisitions or investments;inaccurate estimates of fair value made in the accounting for acquisitions and amortization of acquired intangible assets, whichcould reduce future reported earnings; potential loss of customers or key employees of acquired businesses; and indemnitiesand potential disputes with the buyers or sellers. Any of these items could materially adversely affect the Company’s financialcondition and results of operations.
The Company may, from time to time, determine that certain aspects of its operations are not required to be owned to supportits core business operations and may seek to sell an operation if it believes it can realize sufficient value from its sale. Such asale may divert Management’s attention from existing core businesses during the sale process, create difficulties in separatingpersonnel, financial, and other systems, and cause adverse effects on existing business relationships with suppliers andcustomers. Any of these items could materially adversely affect the Company’s financial condition and result in a reduction ofearnings beyond the earnings of any operation to be sold.
Pension Plan Assets and Liabilities
In the normal course of business, the Company provides post-retirement pension benefits to its employees under both definedcontribution and defined benefit pension plan arrangements. The funded status of the plans significantly affects the net
MANAGEMENT'S DISCUSSION AND ANALYSIS | 2015 | MAPLE LEAF FOODS INC.
19

periodic benefit costs of the Company’s pension plans and the ongoing funding requirements of those plans. Among otherfactors, changes in interest rates, mortality rates, early retirement rates, and the market value of plan assets can affect thelevel of plan funding required, increase the Company’s future funding requirements, and cause volatility in the net periodicpension cost as well as the Company’s financial results. Furthermore, the Company has merged, and is in the process ofmerging, a number of its defined benefit pension plans. The funding status of the individual plans depends, in part, on whetherthe mergers are approved. Failure by the regulators to approve the mergers could also result in an increase to the Company’sfunding requirements. Any increase in pension expense or funding requirements could have a material adverse impact on theCompany’s financial condition and results of operations.
Hog and Pork Market Cyclicality and Supply
The Company’s results of operations and financial condition are partially dependent upon the cost and supply of hogs as wellas the selling prices for fresh meat products, both of which are influenced by constantly changing market forces of supply anddemand over which the Company has little or no control. These prices, for the most part, are denominated in or related to U.S.dollars, which adds further variability due to fluctuations in exchange rates. The North American primary pork processingmarkets are highly competitive, with major and regional companies competing in each market. The market prices for porkproducts regularly experience periods of supply and demand imbalance and are sensitive to changes in industry processingcapacity. Other factors that can influence the supply and market price of live hogs include: fluctuations in the size of herdsmaintained by North American hog suppliers; environmental and conservation regulations; economic conditions; the relativecost of feed for hogs; weather; livestock diseases; and changes to foreign jurisdiction restrictions on drugs, vitamin and feedadditives used in hogs raised in Canada. There can be no assurance that all or part of any such increased costs experiencedby the Company from time to time can be passed along to consumers of the Company’s products directly or in a timelymanner or that meat restricted from certain foreign markets can be sold at acceptable prices. The factors described abovemay also impact the supply of hogs available for processing at the Company’s pork processing plants by negatively impactingthe financial strength of the various independent farming operations upon which the Company relies to meet its requirementsfor hogs. Any of these could have a material adverse effect on the Company's financial condition and results of operations.
Livestock
The Company’s operations and the demand for the Company’s products can be significantly affected by outbreaks of diseaseamong livestock, or attributed to livestock whether it occurs within the Company’s production operations or in the operations ofthird parties.
The Company monitors herd health status and has strict bio-security procedures and employee training programs throughoutits hog production system and ensures the animals receive veterinary medications as required. However, there is noguarantee these processes will not fail. In addition, not all livestock procured by the Company may be subject to theseprocesses, as the majority of hog and poultry livestock processed by the Company is purchased from independent thirdparties. In addition to risks associated with maintaining the health of the Company’s livestock, any outbreak of diseaseelsewhere in the world could reduce consumer confidence in the meat products affected by the particular disease andgenerate adverse publicity. Accordingly, there can be no assurance that an outbreak of animal disease in Canada or elsewherewill not have a material adverse effect on the Company’s financial condition and results of operations.
The Company is increasing its committed sales of raised without antibiotic pork and meat products and in turn expanding theportion of its hog supply raised without antibiotics. Hogs raised without antibiotics have a significantly higher cost of productionand command higher prices. If the Company fails to find markets or buyers willing to pay the premium price for all the raisedwithout antibiotic meat produced, a portion of the higher cost meat will have to be sold in conventional channels at the lowerprice conventionally raised meat commands.
The Company has developed a comprehensive internal contingency plan for dealing with animal disease occurrences and/or amore broad-based pandemic. It has taken steps to support the Canadian government in enhancing both the country’sprevention measures and preparedness plans. There can be no assurance, however, that these prevention measures or planswill be successful in minimizing or containing the impact of an outbreak of animal disease and that such outbreak will not havea material adverse effect on the Company’s financial condition and results of operations. Furthermore, the Company’s supplyof raised without antibiotic meats may be at a greater risk supply disruption in the event of an animal disease outbreak.
Foreign Currencies
A portion of the Company’s revenues and costs are either denominated in or directly linked to other currencies (primarily U.S.dollars and Japanese yen). In periods when the Canadian dollar has appreciated both rapidly and materially against theseforeign currencies, revenues linked to U.S. dollars or Japanese yen are immediately reduced, while the Company’s ability tochange prices or realize natural hedges may lag the immediate currency change. The effect of such sudden changes inexchange rates can have a significant immediate impact on the Company’s earnings. Due to the diversity of the Company’soperations, normal fluctuations in other currencies do not generally have a material impact on the Company’s profitability in theshort term due to either natural hedges and offsetting currency exposures (for example, when revenues and costs are bothlinked to other currencies) or the ability in the near term to change prices of its products to offset adverse currency
MANAGEMENT'S DISCUSSION AND ANALYSIS | 2015 | MAPLE LEAF FOODS INC.
20

movements. However, as the Company competes in international markets, and faces competition in its domestic markets fromU.S. competitors, significant changes in the Canadian to U.S. dollar exchange rate can have, and have had, significant effectson the Company’s relative competitiveness in its domestic and international markets, which can have, and have had,significant effects on the Company’s financial condition and results of operations.
Commodities
The Company is a purchaser of, and its business is dependent on, certain commodities in the course of normal operations,such as feed grains, livestock, and energy, such as oil-based fuel, natural gas, and electricity. Commodity prices are subject tofluctuation and such fluctuations are sometimes severe. The Company may use commodity futures and options for hedgingpurposes to reduce the effect of changing prices in the short term, but such hedges may not be successful in mitigating thiscommodity price risk and may, in some circumstances, subject the Company to loss. On a longer-term basis, the Companyattempts to manage the risk of increases in commodities and other input costs by increasing the prices it charges to itscustomers; however, no assurance can be given that customers will continue to purchase the Company’s products if pricesrise. Any fluctuations in commodity prices that the Company is unable to properly hedge or mitigate could have a materialadverse effect on the Company’s financial condition and results of operations.
International Trade
The Company exports significant amounts of its products to customers outside of Canada and certain of its inputs are affectedby global commodity prices. The Company’s international operations are subject to inherent risks, including: change in the freeflow of food products between countries; fluctuations in currency values; discriminatory fiscal policies; unexpected changes inlocal regulations and laws; and the uncertainty of enforcement of remedies in foreign jurisdictions. In addition, foreignjurisdictions could impose tariffs, quotas, trade barriers, and other similar restrictions on the Company’s international sales, aswell as subsidize competing agricultural products. All of these risks could result in increased costs or decreased revenues,either of which could have a material adverse effect on the Company’s financial condition and results of operations.
Regulation
The Company’s operations are subject to extensive regulation by government agencies in the countries in which it operates,including: the Canadian Food Inspection Agency; the Ministry of Agriculture in Canada; provincial Ministries of the Environmentin Canada; and the United States Department of Agriculture. These agencies regulate the processing, packaging, storage,distribution, advertising, and labeling of the Company’s products, including food safety standards. The Company’smanufacturing facilities and products are subject to inspection by federal, provincial, and local authorities. The Companystrives to maintain compliance with all laws and regulations and maintains all permits and licenses relating to its operations.Nevertheless, there can be no assurance that the Company is in compliance with such laws and regulations, has all necessarypermits and licenses, and will be able to comply with such laws and regulations, permits and licenses in the future. Failure bythe Company to comply with applicable laws and regulations and permits and licenses could subject the Company to civilremedies, including fines, injunctions, recalls or seizures, as well as potential criminal sanctions, which could have a materialadverse effect on the Company’s financial condition and results of operations. Various governments throughout the world areconsidering regulatory proposals relating to genetically modified organisms, drug residues in food ingredients, food safety, andmarket and environmental regulation that, if adopted, may increase the Company’s costs. There can be no assurance thatadditional regulation will not be enacted. In fact, new regulations and standards were enacted to address the risks associatedwith certain pathogens in response to the Company’s August 2008 recall of ready-to-eat meat products. If any of these or otherproposals or regulations are enacted, the Company could experience a disruption in the supply or distribution of its products,increased operating costs, and significant additional cost for capital improvements. The Company may be unable to pass onthe cost increases associated with such increased regulatory burden to its customers without incurring volume loss as a resultof higher prices. Any of these events could have a material adverse effect on the Company’s financial condition and results ofoperations.
Legal Matters
In the normal course of its operations, the Company becomes involved in various legal actions, either as plaintiff or defendant,relating to its commercial relationships, employment matters, product liabilities, in addition to other things. The Companygenerally believes that the resolution of these claims will not have a material effect on the Company based, in part, on theavailability of insurance. However, the final outcome with respect to actions outstanding, pending or with respect to futureclaims cannot be predicted with certainty. Furthermore, even if any action is settled within insurance limits, this can result inincreases to the Company’s insurance premiums. Therefore there can be no assurance that their resolution will not have amaterial adverse effect on the Company’s financial condition or results of operations.
Consumer Trends
Success of the Company depends in part on the Company’s ability to respond to market trends and produce innovativeproducts that anticipate and respond to the changing tastes and dietary habits of consumers. From time to time certainproducts are deemed more or less healthy and this can impact consumer buying patterns. The Company’s failure to anticipate,
MANAGEMENT'S DISCUSSION AND ANALYSIS | 2015 | MAPLE LEAF FOODS INC.
21

identify, or react to these changes or to innovate could result in declining demand and prices for the Company’s products,which in turn could have a material adverse effect on the Company’s financial condition and results of operations.
Environmental Regulation
The Company’s operations are subject to extensive environmental laws and regulations pertaining to the discharge ofmaterials into the environment and the handling and disposition of wastes (including solid and hazardous wastes) or otherwiserelating to protection of the environment. Failure to comply could have serious consequences, such as criminal as well as civilpenalties, liability for damages, and negative publicity for the Company. No assurances can be given that additionalenvironmental issues relating to presently known matters or identified sites or to other matters or sites will not requireadditional expenditures, or that requirements applicable to the Company will not be altered in ways that will require theCompany to incur significant additional costs. In addition, certain facilities of the Company have been in operation for manyyears and, over time, the Company and other prior operators of such facilities may have generated and disposed of wastewhich is or may be considered to be hazardous. Future discovery of previously unknown contamination of property underlyingor in the vicinity of the Company’s present or former properties or manufacturing facilities and/or waste disposal sites couldrequire the Company to incur material unforeseen expenses. Occurrences of any such events could have a material adverseeffect on the Company’s financial condition and results of operations.
Consolidating Customer Environment
As the retail grocery and foodservice trades continue to consolidate and customers grow larger and more sophisticated, theCompany is required to adjust to changes in purchasing practices and changing customer requirements. Failure to do so couldresult in losing sales volumes and market share. The Company’s net sales and profitability could also be affected bydeterioration in the financial condition of, or other adverse developments in, the relationship with one or more of its majorcustomers. Any of these events could have a material adverse effect on the Company’s financial condition and results ofoperations.
Competitive Industry Environment
The food industry is intensely competitive. In many product categories in which the Company operates there are low barriersto entry. Competition is based on product availability, product quality, price, effective promotions, and the ability to targetchanging consumer preferences. The Company experiences price pressure from time to time as a result of competitors’promotional efforts and in product categories and markets characterized by low capacity utilization. Increased competitioncould result in reduced sales, margins, profits, and market share, all of which could have a material adverse effect on theCompany’s financial condition and results of operations.
Employment Matters
The Company and its subsidiaries have approximately 11,500 full-time and part-time employees, which include salaried andunion employees, many of whom are covered by collective agreements. These employees are located in various jurisdictions,each such jurisdiction having differing employment laws. While the Company maintains systems and procedures to complywith the applicable requirements, there is a risk that failures or lapses by individual managers could result in a violation orcause of action that could have a material adverse effect on the Company’s financial condition and results of operations.Furthermore, if a collective agreement covering a significant number of employees or involving certain key employees were toexpire or otherwise cease to have effect leading to a work stoppage, there can be no assurance that such work stoppagewould not have a material adverse effect on the Company’s financial condition and results of operations. The Company’ssuccess is also dependent on its ability to recruit and retain qualified personnel. The loss of one or more key personnel couldhave a material adverse effect on the Company’s financial condition and results of operations.
Product Pricing
The Company’s profitability is dependent, in large part, on the Company’s ability to make pricing decisions regarding itsproducts that, on one hand encourage consumers to buy, yet on the other hand recoup development and other costsassociated with those products. Products that are priced too high will not sell and products priced too low will not generate anadequate return. Accordingly, any failure by the Company to properly price its products could have a material adverse effect onthe Company’s financial condition and results of operations.
Supply Chain Management
Successful management of the Company’s supply chain is critical to the Company’s success. Insufficient supply of productsthreatens the Company’s ability to meet customer demands while over capacity threatens the Company’s ability to generatecompetitive profit margins. Accordingly, any failure by the Company to properly manage the Company’s supply chain couldhave a material adverse effect on the Company’s financial condition and results of operations.
Strategic Risk Management
Successful identification and management of the strategic risks facing the Company from time to time is critical to theCompany’s success. Among other things, these risks include changes in technology, the food industry, customers, consumers,
MANAGEMENT'S DISCUSSION AND ANALYSIS | 2015 | MAPLE LEAF FOODS INC.
22

and competitors. Failure to properly adapt to changes in strategic risks could have a material adverse effect on the Company’sfinancial condition and results of operations.
CRITICAL ACCOUNTING ESTIMATES AND JUDGEMENTSThe preparation of consolidated financial statements in accordance with IFRS requires Management to make judgements,estimates, and assumptions that affect the application of accounting policies and the reported amounts of assets, liabilities,income, and expenses. Actual amounts may differ from these estimates.
Estimates and underlying assumptions are reviewed on an ongoing basis. Revisions to accounting estimates are recognized inthe period in which the estimates are revised and in any future periods affected.
Judgements included in the financial statements are decisions made by Management, based on analysis of relevantinformation available at the time the decision is made. Judgements relate to the application of accounting policies anddecisions related to the measurement, recognition, and disclosure of financial amounts. Information about significant areas ofcritical judgements in applying accounting policies, that have the most significant effects on the amounts recognized in theconsolidated financial statements, are included both below and in the statement notes relating to items subject to significantand critical judgements.
Information about significant areas of estimation uncertainty and critical judgements in applying accounting policies, that havethe most significant effects on the amounts recognized in the consolidated financial statements, are included both below and inthe statement notes relating to items subject to significant estimate uncertainty and critical judgements.
Long-Lived Assets Valuation
The Company performs impairment testing annually for goodwill and indefinite life intangible assets and, when circumstancesindicate that there may be impairment, for other long-lived assets. Management judgement is involved in determining if thereare circumstances indicating that testing for impairment is required, and in identifying Cash Generating Units (“CGUs”) for thepurpose of impairment testing.
The Company assesses impairment by comparing the recoverable amount of a long-lived asset, CGU, or CGU group to itscarrying value. The recoverable amount is defined as the higher of: (i) value in use; or (ii) fair value less cost to sell.
The determination of the recoverable amount involves significant estimates and assumptions, including those with respect tofuture cash inflows and outflows, discount rates, and asset lives. These estimates and assumptions could affect theCompany’s future results if the current estimates of future performance and fair values change. These determinations willaffect the amount of amortization expense on definite life intangible assets recognized in future periods.
Measurement of Fair Values
A number of the Company’s accounting policies and disclosures require the measurement of fair values, for both financial andnon-financial assets and liabilities. When the measurement of fair values cannot be determined based on quoted prices inactive markets, fair value is measured using valuation techniques and models. The inputs to these models are taken fromobservable markets where possible, but where this is not feasible, a degree of judgement is required in establishing fairvalues. Changes in assumptions about the inputs to these models could affect the reported fair value of the Company’sfinancial and non-financial assets and liabilities.
When measuring fair value of an asset or liability, the Company uses market observable data to the extent that it is possible.To the extent that these estimates differ from those realized, the measured asset or liability, net earnings, and/orcomprehensive income will be affected in future periods.
Information about the valuation techniques and inputs used in determining the fair value of various assets and liabilities aredisclosed in Notes 7, 9, 10, 11, and 18 of the Company's 2015 audited consolidated financial statements.
Nature of Interests in Other Entities
Management applies significant judgement in assessing the nature of its interest in an unconsolidated structured entity. TheCompany does not hold any equity interest in the structured entity and based on the terms of the agreements under which theentity is established, the Company does not receive the returns related to their operations and is exposed to limited recoursewith respect to losses (refer to Note 25 of the Company's 2015 audited consolidated financial statements).
Valuation of Inventory
Management makes estimates of the future customer demand for products when establishing appropriate provisions forinventory. In making these estimates, Management considers the product life of inventory and the profitability of recent sales ofinventory. In many cases, product sold by the Company turns quickly and inventory on-hand values are low, thus reducing therisk of inventory obsolescence. However, code or “best before” dates are very important in the determination of realizablevalue of inventory. Management ensures that systems are in place to highlight and properly value inventory that may be
MANAGEMENT'S DISCUSSION AND ANALYSIS | 2015 | MAPLE LEAF FOODS INC.
23

approaching code dates. To the extent that actual losses on inventory differ from those estimated, inventory, net earnings, andcomprehensive income will be affected in future periods.
Biological Assets
Biological assets are measured at each reporting date, at fair value less costs to sell, except when fair value cannot be reliablymeasured. If fair value cannot be reliably measured, biological assets are measured at cost less depreciation and impairmentlosses. Although a reliable measure of fair value may not be available at the point of initial recognition, it may subsequentlybecome available. In such circumstances, biological assets are measured at fair value less costs to sell from the point at whichthe reliable measure of fair value becomes available. Gains and losses that arise on measuring biological assets at fair valueless costs to sell are recognized in the statement of net earnings in the period in which they arise. Costs to sell include allcosts that would be necessary to sell the biological assets, including costs necessary to get the biological assets to market.Management uses estimates for some of the inputs into the determination of fair value. To the extent that actual values differfrom estimates, biological assets, net earnings and comprehensive income will be affected in future periods.
Trade Merchandise Allowances and Other Trade Discounts
The Company provides for estimated payments to customers based on various trade programs and contracts that ofteninclude payments that are contingent upon attainment of specified sales volumes. Significant estimates used to determinethese liabilities include: (i) the projected level of sales volume for the relevant period and (ii) customer contracted rates forallowances, discounts, and rebates. These arrangements are complex and there are a significant number of customers andproducts affected. Management has systems and processes in place to estimate and value these obligations. To the extentthat payments on trade discounts differ from estimates of the related liability, accounts payable and accruals, net earnings, andcomprehensive income will be affected in future periods.
Employee Benefit Plans
The cost of pensions and other post-retirement benefits earned by employees is actuarially determined using the projectedunit credit method prorated on service, and Management’s best estimate of salary escalation and mortality rates. Discountrates used in actuarial calculations are based on long-term interest rates and can have a material effect on the amount of planliabilities and expenses. Management employs external experts to advise the Company when deciding upon the appropriateestimates to use to value employee benefit plan obligations and expenses. To the extent that these estimates differ from thoserealized, employee benefit plan assets and liabilities and comprehensive income will be affected in future periods.
Significant actuarial assumptions adopted in measuring the Company’s accrued benefit obligations and net benefit plan expensesare as follows:
2015 2014Weighted average discount rate used to calculate the net benefit plan expense 3.75% 4.50%Weighted average discount rate used to calculate year end benefit obligation 3.75% 3.75%(i)
Rate of salary increase 3.50% 3.50%Medical cost trend rates 5.00% 5.00%(i) 4.25% was used for the plans related to Canada Bread as at February 12, 2014.
Information about the sensitivity of the plan obligations to changes in assumptions is presented below:
Increase (decrease) in defined benefit obligationOther post-
Total retirementActuarial Assumption Sensitivity pensions benefits TotalPeriod end discount rate 3.75% 0.25% decrease $ 34,344 $ 1,655 $ 35,999
0.25% increase $ (33,312) $ (1,496) $ (34,808)Rate of salary increase 3.50% 0.50% increase $ 3,164 N/A $ 3,164Mortality 110% of 2014 Private
Sector CanadianPensioners' Mortality
Table, projectedgenerationally using
Scale CPM-B
Increase of 1 yearin expected
lifetime of planparticipants
$ 32,035 $ 1,924 $ 33,959
MANAGEMENT'S DISCUSSION AND ANALYSIS | 2015 | MAPLE LEAF FOODS INC.
24
Income Taxes
Provisions for income taxes are based on domestic and international statutory income tax rates and the amount of incomeearned in the jurisdictions in which the Company operates. Significant judgement is required in determining income taxprovisions and the recoverability of deferred tax assets. The calculation of current and deferred income tax balances requiresManagement to make estimates regarding the carrying values of assets and liabilities that include estimates of future cashflows and earnings related to such assets and liabilities, the interpretation of income tax legislation in the jurisdictions in whichthe Company operates, and the timing of reversal of temporary differences. The Company establishes additional provisions forincome taxes when, despite Management’s opinion that the Company’s tax positions are fully supportable, there is sufficientcomplexity or uncertainty in the application of legislation that certain tax positions may be reassessed by tax authorities. TheCompany adjusts these additional accruals in light of changing facts and circumstances. To the extent that these adjustmentsdiffer from original estimates, deferred tax assets and liabilities, net earnings, and comprehensive income will be affected infuture periods.
Provisions
The Company evaluates all provisions at each reporting date. These provisions can be significant and are prepared usingestimates of the costs of future activities. In certain instances, Management may determine that these provisions are no longerrequired or that certain provisions are insufficient as new events occur or as additional information is obtained. Provisions areseparately identified and disclosed in the Company’s consolidated financial statements. Changes to these estimates mayaffect the value of provisions, net earnings, and comprehensive income in future periods.
Share-Based Compensation
The Company uses estimates including, but not limited to, estimates of forfeitures, share price volatility, dividends, expectedlife of the award, risk-free interest rates, and Company performance in the calculation of the liability and expenses for certainshare-based incentive plans. These estimates are based on previous experience and may change throughout the life of anincentive plan. Such changes could impact the carrying value of contributed surplus, liabilities, net earnings, andcomprehensive income in future periods.
Some of the Company’s share-based payment plans are settleable in either cash or equity instruments at the option of theCompany. Management uses judgement in determining the appropriate accounting treatment for these plans, based onexpectations and historical settlement decisions. Changes to accounting treatment based on Management’s judgement mayimpact contributed surplus, liabilities, net earnings, and comprehensive income in future periods.
Depreciation and Amortization
The Company’s property and equipment and definite life intangible assets are depreciated and amortized on a straight-linebasis, taking into account the estimated useful lives of the assets and residual values. Changes to these estimates may affectthe carrying value of these assets, inventories, net earnings, and comprehensive income in future periods.
SIGNIFICANT ACCOUNTING POLICIES Accounting Standards Adopted During the Period For the first time beginning on January 1, 2015, the Company adopted certain standards and amendments. As required by IAS8 Accounting Policies, Change in Accounting Estimates and Errors, the nature and the effect of these changes are disclosedbelow:
Employee Benefits
Beginning on January 1, 2015, the Company adopted the amendments to IAS 19 Employee Benefits retrospectively. Theamendments to IAS 19 required contributions from employees or third parties that are linked to service to be attributed toperiods of service as a negative benefit. The amendments to IAS 19 provide simplified accounting in certain situations. If theamount of contribution is independent of the number of years of service, an entity is permitted to recognize such contributionsas a reduction in the service costs in the period in which the service is rendered, instead of allocating the contributions to theperiod’s service. The adoption of the amendments to IAS 19 did not have a material impact on the Company's consolidatedfinancial statements.
Annual Improvements to IFRS (2010 – 2012) and (2011 – 2013) Cycles
Beginning on January 1, 2015, the Company adopted various amendments to a total of nine standards including disclosure onthe aggregation of operating segments in IFRS 8 Operating Segments, measurement of short-term receivables and payablesunder IFRS 13 Fair Value Measurement, definition of related party in IAS 24 Related Party Disclosures, and otheramendments. The adoption of these amendments did not have a material impact on the Company's consolidated financialstatements.
MANAGEMENT'S DISCUSSION AND ANALYSIS | 2015 | MAPLE LEAF FOODS INC.
25

Accounting Pronouncements Issued But Not Yet Effective Annual Improvements to IFRS (2012-2014) Cycle
In September 2014, the IASB issued narrow-scope amendments to a total of four standards as part of its annual improvementprocess. Amendments were made to clarify items including the consistent classification of assets if they are reclassified fromheld for sale to held for distribution in IFRS 5 Non-current Assets Held for Sale and Discontinued Operations, clarification ofinterim financial statement disclosure requirements regarding offsetting financial assets and liabilities and clarification ofwhether a servicing contract constitutes continuing involvement for the purposes of disclosures of transferred financial assetsthat are derecognized under IFRS 7 Financial Instruments: Disclosures. The amendments also include clarification that thecurrency of the bonds used to estimate the discount rate for pension obligations must be the same as the currency in whichthe benefits will be paid under IAS 19 Employee Benefits and additional requirements under IAS 34 Interim FinancialReporting that cross-referenced information from the interim financial statements must be available at the same time and onthe same terms as the interim financial statements. The Company intends to adopt these amendments in its consolidatedfinancial statements for the annual period beginning January 1, 2016. The adoption of these amendments is not expected tohave a material impact on the consolidated financial statements.
Joint Arrangements
In May 2014, IFRS 11 Joint Arrangements was amended to require an acquisition of a joint operation that constitutes abusiness to be accounted for using the principles of business combinations in IFRS 3 Business Combinations. Thisamendment applies to both initial and additional interest acquired in the joint operation. The Company intends to adopt theamendments to IFRS 11 in its consolidated financial statements for the annual period beginning January 1, 2016. The adoptionof the amendments to IFRS 11 is not expected to have a material impact on the consolidated financial statements.
Consolidated Financial Statements and Investments in Associates and Joint Ventures
In September 2014, IFRS 10 Consolidated Financial Statements and IAS 28 Investments in Associates and Joint Ventureswere amended to clarify an inconsistency between the two standards relating to the sale or contribution of assets from aninvestor to its associate or joint venture. The amendment requires that a full gain or loss is recorded if the sold or contributedassets constitute a business and that a partial gain or loss is recognized when a sale or contribution of assets do notcontribute a business. The Company intends to adopt these amendments in its consolidated financial statements for theannual period beginning January 1, 2016. The adoption of these amendments is not expected to have a material impact on theconsolidated financial statements.
Revenue Recognition
In May 2014, the IASB issued IFRS 15 Revenue from Contracts with Customers. IFRS 15 replaces the detailed guidance onrevenue recognition requirements that currently exists under IFRS. IFRS 15 specifies the accounting treatment for all revenuearising from contracts with customers, unless the contracts are within the scope of other IFRSs. The standard also provides amodel for the measurement and recognition of gains and losses on the sale of certain non-financial assets that are not anoutput of the Company's ordinary activities. Additional disclosure is required under the standard, including disaggregation oftotal revenue, information about performance obligations, changes in contract asset and liability account balances betweenperiods, and key judgments and estimates. In July 2015, the effective date for IFRS 15 was deferred to apply to annualperiods beginning on or after January 1, 2018; early application is permitted either following a full retrospective approach or amodified retrospective approach. The modified retrospective approach allows the standard to be applied to existing contractsbeginning the initial period of adoption and restatements to the comparative periods are not required. The Company isrequired to disclose the impact by financial line item as a result of the adoption of the new standard. The Company intends toadopt IFRS 15 in its consolidated financial statements for the annual period beginning January 1, 2018. The extent of theimpact of adoption of IFRS 15 has not yet been determined.
Financial Instruments – Recognition and Measurement
In July 2014, the IASB issued the final version of IFRS 9 Financial Instruments with a mandatory effective date of January 1,2018. The new standard brings together the classification and measurement, impairment and hedge accounting phases of theIASB’s project to replace IAS 39 Financial Instruments: Recognition and Measurement. In addition to the new requirements forclassification and measurement of financial assets, a new general hedge accounting model and other amendments issued inprevious versions of IFRS 9, the standard also introduces new impairment requirements that are based on a forward-lookingexpected credit loss model. The Company intends to adopt IFRS 9 in its consolidated financial statements for the annualperiod beginning January 1, 2018. The extent of the impact of the adoption of IFRS 9 has not yet been determined.
The disclosure requirements in IFRS 7 Financial Instruments - Disclosure have also been amended to include the additionaldisclosure required under IFRS 9. The Company intends to adopt these amendments to IFRS 7 at the same time as adoptionof IFRS 9. The extent of the impact of the adoption of the amendments to IFRS 7 has not yet been determined.
MANAGEMENT'S DISCUSSION AND ANALYSIS | 2015 | MAPLE LEAF FOODS INC.
26

Leases
In January 2016, the IASB issued IFRS 16 Leases with a mandatory effective date of January 1, 2019. The new standard willreplace IAS 17 Leases and will carry forward the accounting requirements for lessors. IFRS 16 provides a new framework forlessee accounting that requires substantially all assets obtained through operating leases to be capitalized and a relatedliability to be recorded. The new standard seeks to provide a more accurate picture of a Company's leased assets and relatedliabilities and create greater comparability between companies who lease assets and those who purchase assets. TheCompany intends to adopt IFRS 16 in its consolidated financial statements for the annual period beginning January 1, 2019.The extent of the impact of the adoption of IFRS 16 has not yet been determined.
DISCLOSURE CONTROLS AND INTERNAL CONTROLS OVER FINANCIAL REPORTING The Company’s disclosure controls and procedures are designed to provide reasonable assurance that material informationrelating to the Company, including its consolidated subsidiaries, is accumulated and communicated to Management in a timelymanner so that information required to be disclosed by the Company under securities legislation is recorded, processed,summarized and reported within the time periods specified in applicable securities legislation. The Company’s Management,under the direction and supervision of the Company’s Chief Executive Officer and Chief Financial Officer, is also responsiblefor establishing and maintaining internal control over financial reporting. These controls are designed to provide reasonableassurance regarding the reliability of financial reporting and the preparation of financial statements for external purposes inaccordance with IFRS.
The Company’s Chief Executive Officer and Chief Financial Officer have evaluated, or caused to be evaluated under theirsupervision, the effectiveness of the Company’s internal control over financial reporting and disclosure controls andprocedures as at December 31, 2015, and have concluded that such controls and procedures are effective. There have beenno changes in the Company’s internal control over financial reporting that occurred during the period beginning on January 1,2015, and ended on December 31, 2015, that have materially affected, or are reasonably likely to materially affect, theCompany’s internal control over financial reporting. On January 1, 2014, the Company adopted the Committee of SponsoringOrganizations new internal control framework, which did not have a material impact on the Company’s internal controls overfinancial reporting and disclosure controls and procedures.
NON-IFRS FINANCIAL MEASURESThe Company uses the following non-IFRS measures: Adjusted Operating Earnings, Adjusted Earnings per Share, AdjustedEBITDA, Net Cash (Debt), and Return on Net Assets. Management believes that these non-IFRS measures provide usefulinformation to investors in measuring the financial performance of the Company for the reasons outlined below. Thesemeasures do not have a standardized meaning prescribed by IFRS and therefore they may not be comparable to similarlytitled measures presented by other publicly traded companies and should not be construed as an alternative to other financialmeasures determined in accordance with IFRS.
Adjusted Operating Earnings Adjusted Operating Earnings, a non-IFRS measure, is used by Management to evaluate financial operating results. It isdefined as earnings before income taxes from continuing operations adjusted for items that are not considered representativeof ongoing operational activities of the business and items where the economic impact of the transactions will be reflected inearnings in future periods when the underlying asset is sold or transferred. The table below provides a reconciliation of netearnings as reported under IFRS in the audited consolidated statements of earnings to Adjusted Operating Earnings for theyears ended, as indicated below. Management believes that this basis is the most appropriate on which to evaluate operatingresults, as they are representative of the ongoing operations of the Company.
MANAGEMENT'S DISCUSSION AND ANALYSIS | 2015 | MAPLE LEAF FOODS INC.
27
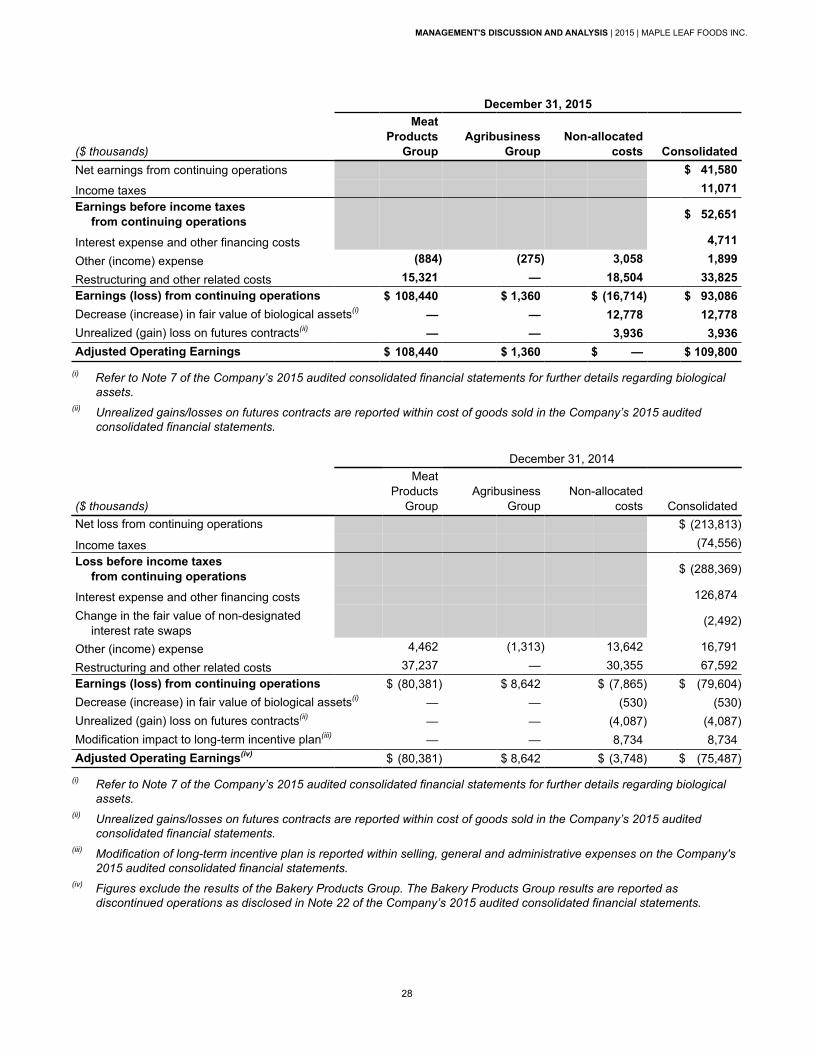
December 31, 2015
($ thousands)
Meat Products
GroupAgribusiness
GroupNon-allocated
costs ConsolidatedNet earnings from continuing operations $ 41,580
Income taxes 11,071Earnings before income taxes
from continuing operations $ 52,651
Interest expense and other financing costs 4,711
Other (income) expense (884) (275) 3,058 1,899
Restructuring and other related costs 15,321 — 18,504 33,825Earnings (loss) from continuing operations $ 108,440 $ 1,360 $ (16,714) $ 93,086Decrease (increase) in fair value of biological assets(i) — — 12,778 12,778Unrealized (gain) loss on futures contracts(ii) — — 3,936 3,936Adjusted Operating Earnings $ 108,440 $ 1,360 $ — $ 109,800
(i) Refer to Note 7 of the Company’s 2015 audited consolidated financial statements for further details regarding biologicalassets.
(ii) Unrealized gains/losses on futures contracts are reported within cost of goods sold in the Company’s 2015 auditedconsolidated financial statements.
December 31, 2014
($ thousands)
Meat Products
GroupAgribusiness
GroupNon-allocated
costs ConsolidatedNet loss from continuing operations $ (213,813)
Income taxes (74,556)Loss before income taxes
from continuing operations $ (288,369)
Interest expense and other financing costs 126,874
Change in the fair value of non-designated interest rate swaps
(2,492)
Other (income) expense 4,462 (1,313) 13,642 16,791
Restructuring and other related costs 37,237 — 30,355 67,592Earnings (loss) from continuing operations $ (80,381) $ 8,642 $ (7,865) $ (79,604)Decrease (increase) in fair value of biological assets(i) — — (530) (530)Unrealized (gain) loss on futures contracts(ii) — — (4,087) (4,087)Modification impact to long-term incentive plan(iii) — — 8,734 8,734Adjusted Operating Earnings(iv) $ (80,381) $ 8,642 $ (3,748) $ (75,487)
(i) Refer to Note 7 of the Company’s 2015 audited consolidated financial statements for further details regarding biologicalassets.
(ii) Unrealized gains/losses on futures contracts are reported within cost of goods sold in the Company’s 2015 auditedconsolidated financial statements.
(iii) Modification of long-term incentive plan is reported within selling, general and administrative expenses on the Company's2015 audited consolidated financial statements.
(iv) Figures exclude the results of the Bakery Products Group. The Bakery Products Group results are reported asdiscontinued operations as disclosed in Note 22 of the Company’s 2015 audited consolidated financial statements.
MANAGEMENT'S DISCUSSION AND ANALYSIS | 2015 | MAPLE LEAF FOODS INC.
28
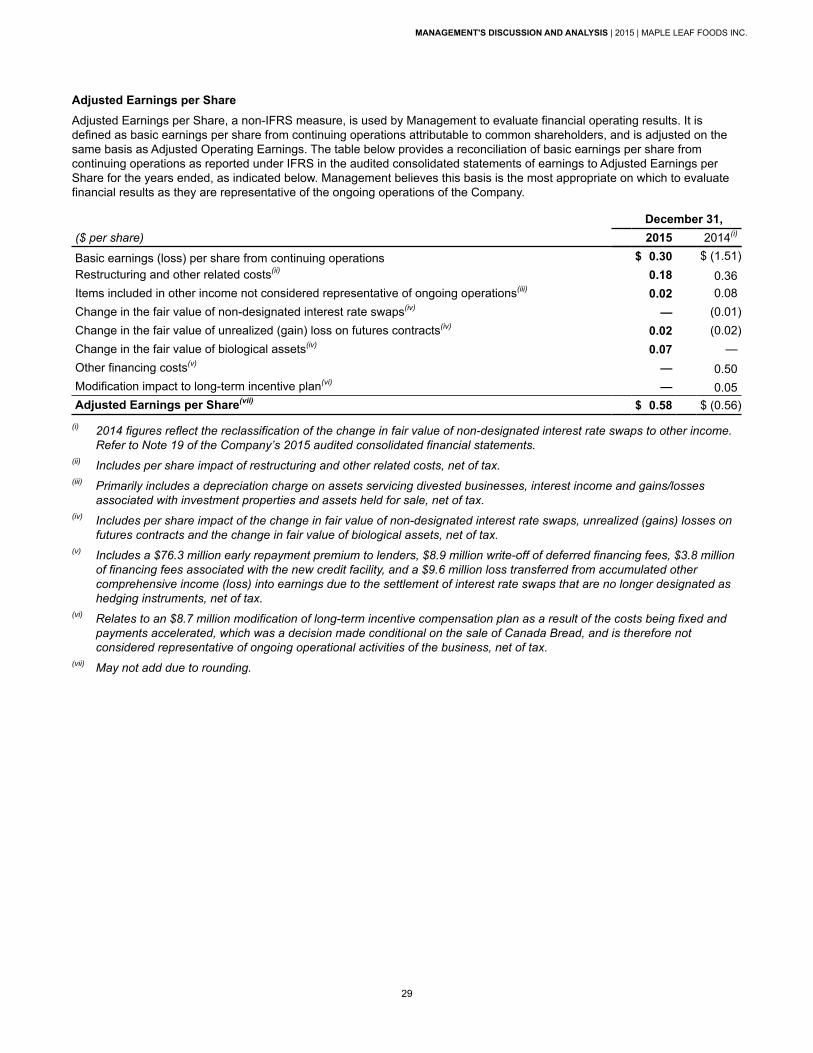
Adjusted Earnings per Share Adjusted Earnings per Share, a non-IFRS measure, is used by Management to evaluate financial operating results. It isdefined as basic earnings per share from continuing operations attributable to common shareholders, and is adjusted on thesame basis as Adjusted Operating Earnings. The table below provides a reconciliation of basic earnings per share fromcontinuing operations as reported under IFRS in the audited consolidated statements of earnings to Adjusted Earnings perShare for the years ended, as indicated below. Management believes this basis is the most appropriate on which to evaluatefinancial results as they are representative of the ongoing operations of the Company.
($ per share) December 31,
2015 2014(i)
Basic earnings (loss) per share from continuing operations $ 0.30 $ (1.51)Restructuring and other related costs(ii) 0.18 0.36Items included in other income not considered representative of ongoing operations(iii) 0.02 0.08Change in the fair value of non-designated interest rate swaps(iv) — (0.01)Change in the fair value of unrealized (gain) loss on futures contracts(iv) 0.02 (0.02)Change in the fair value of biological assets(iv) 0.07 —Other financing costs(v) — 0.50Modification impact to long-term incentive plan(vi) — 0.05Adjusted Earnings per Share(vii) $ 0.58 $ (0.56)
(i) 2014 figures reflect the reclassification of the change in fair value of non-designated interest rate swaps to other income.Refer to Note 19 of the Company’s 2015 audited consolidated financial statements.
(ii) Includes per share impact of restructuring and other related costs, net of tax.(iii) Primarily includes a depreciation charge on assets servicing divested businesses, interest income and gains/losses
associated with investment properties and assets held for sale, net of tax. (iv) Includes per share impact of the change in fair value of non-designated interest rate swaps, unrealized (gains) losses on
futures contracts and the change in fair value of biological assets, net of tax. (v) Includes a $76.3 million early repayment premium to lenders, $8.9 million write-off of deferred financing fees, $3.8 million
of financing fees associated with the new credit facility, and a $9.6 million loss transferred from accumulated othercomprehensive income (loss) into earnings due to the settlement of interest rate swaps that are no longer designated ashedging instruments, net of tax.
(vi) Relates to an $8.7 million modification of long-term incentive compensation plan as a result of the costs being fixed andpayments accelerated, which was a decision made conditional on the sale of Canada Bread, and is therefore notconsidered representative of ongoing operational activities of the business, net of tax.
(vii) May not add due to rounding.
MANAGEMENT'S DISCUSSION AND ANALYSIS | 2015 | MAPLE LEAF FOODS INC.
29
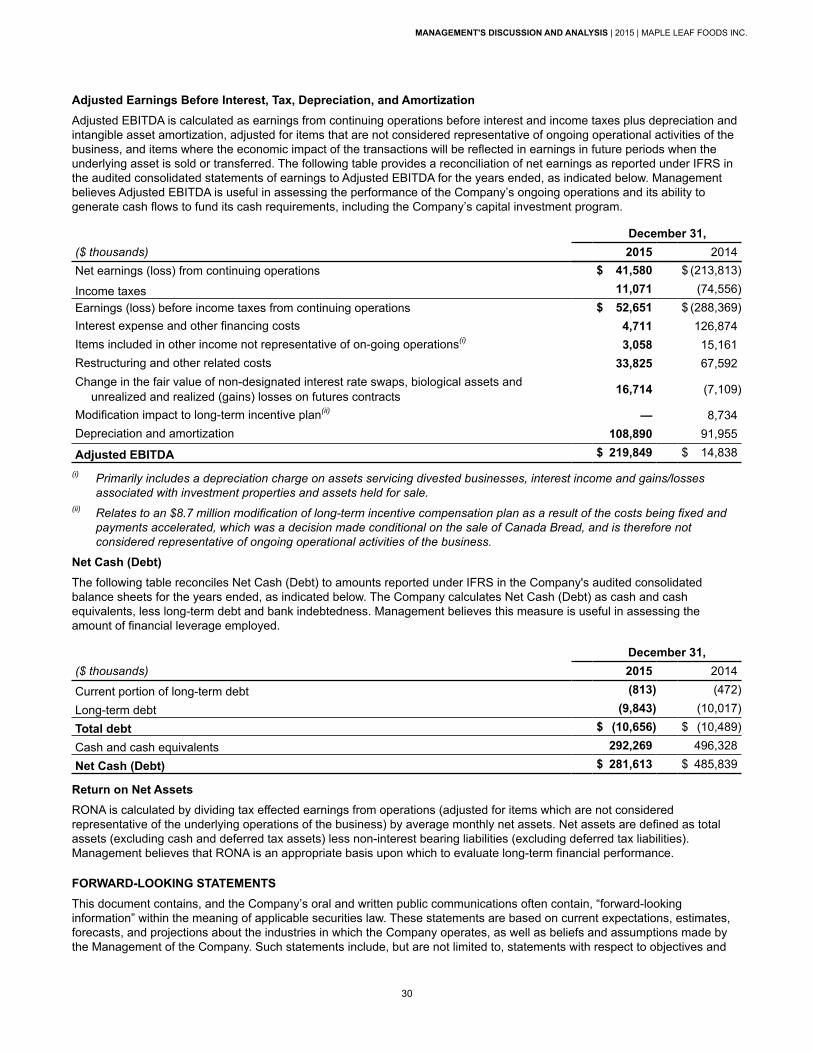
Adjusted Earnings Before Interest, Tax, Depreciation, and AmortizationAdjusted EBITDA is calculated as earnings from continuing operations before interest and income taxes plus depreciation andintangible asset amortization, adjusted for items that are not considered representative of ongoing operational activities of thebusiness, and items where the economic impact of the transactions will be reflected in earnings in future periods when theunderlying asset is sold or transferred. The following table provides a reconciliation of net earnings as reported under IFRS inthe audited consolidated statements of earnings to Adjusted EBITDA for the years ended, as indicated below. Managementbelieves Adjusted EBITDA is useful in assessing the performance of the Company’s ongoing operations and its ability togenerate cash flows to fund its cash requirements, including the Company’s capital investment program.
($ thousands) December 31,
2015 2014Net earnings (loss) from continuing operations $ 41,580 $ (213,813)
Income taxes 11,071 (74,556)Earnings (loss) before income taxes from continuing operations $ 52,651 $ (288,369)Interest expense and other financing costs 4,711 126,874Items included in other income not representative of on-going operations(i) 3,058 15,161Restructuring and other related costs 33,825 67,592Change in the fair value of non-designated interest rate swaps, biological assets and
unrealized and realized (gains) losses on futures contracts 16,714 (7,109)
Modification impact to long-term incentive plan(ii) — 8,734Depreciation and amortization 108,890 91,955
Adjusted EBITDA $ 219,849 $ 14,838
(i) Primarily includes a depreciation charge on assets servicing divested businesses, interest income and gains/lossesassociated with investment properties and assets held for sale.
(ii) Relates to an $8.7 million modification of long-term incentive compensation plan as a result of the costs being fixed andpayments accelerated, which was a decision made conditional on the sale of Canada Bread, and is therefore notconsidered representative of ongoing operational activities of the business.
Net Cash (Debt) The following table reconciles Net Cash (Debt) to amounts reported under IFRS in the Company's audited consolidatedbalance sheets for the years ended, as indicated below. The Company calculates Net Cash (Debt) as cash and cashequivalents, less long-term debt and bank indebtedness. Management believes this measure is useful in assessing theamount of financial leverage employed.
($ thousands)December 31,2015 2014
Current portion of long-term debt (813) (472)
Long-term debt (9,843) (10,017)
Total debt $ (10,656) $ (10,489)
Cash and cash equivalents 292,269 496,328
Net Cash (Debt) $ 281,613 $ 485,839
Return on Net AssetsRONA is calculated by dividing tax effected earnings from operations (adjusted for items which are not consideredrepresentative of the underlying operations of the business) by average monthly net assets. Net assets are defined as totalassets (excluding cash and deferred tax assets) less non-interest bearing liabilities (excluding deferred tax liabilities).Management believes that RONA is an appropriate basis upon which to evaluate long-term financial performance.
FORWARD-LOOKING STATEMENTS This document contains, and the Company’s oral and written public communications often contain, “forward-lookinginformation” within the meaning of applicable securities law. These statements are based on current expectations, estimates,forecasts, and projections about the industries in which the Company operates, as well as beliefs and assumptions made bythe Management of the Company. Such statements include, but are not limited to, statements with respect to objectives and
MANAGEMENT'S DISCUSSION AND ANALYSIS | 2015 | MAPLE LEAF FOODS INC.
30

goals, in addition to statements with respect to beliefs, plans, objectives, expectations, anticipations, estimates, and intentions.Specific forward-looking information in this document includes, but is not limited to, statements with respect to: the anticipatedbenefits, timing, actions, costs, and investments associated with the Value Creation Plan; expectations regarding the use ofderivatives, futures and options; expectations regarding improving efficiencies; the expected use of cash balances; source offunds for ongoing business requirements; capital investments and expectations regarding capital expenditures; expectationsregarding the implementation of environmental sustainability initiatives; expectations regarding the adoption of new accountingstandards and the impact of such adoption on financial position; expectations regarding pension plan performance and futurepension plan liabilities and contributions; expectations regarding levels of credit risk; and expectations regarding outcomes oflegal actions. Words such as “expect”, “anticipate”, “intend”, “may”, “will”, “plan”, “believe”, “seek”, “estimate”, and variations ofsuch words and similar expressions are intended to identify such forward-looking information. These statements are notguarantees of future performance and involve assumptions and risks and uncertainties that are difficult to predict.
In addition, these statements and expectations concerning the performance of the Company’s business in general are basedon a number of factors and assumptions including, but not limited to: the condition of the Canadian, U.S., and Japaneseeconomies; the rate of exchange of the Canadian dollar to the U.S. dollar, and the Japanese yen; the availability and prices ofraw materials, energy and supplies; product pricing; the availability of insurance; the competitive environment and relatedmarket conditions; improvement of operating efficiencies whether as a result of the Value Creation Plan or otherwise;continued access to capital; the cost of compliance with environmental and health standards; no adverse results from ongoinglitigation; no unexpected actions of domestic and foreign governments; and the general assumption that none of the risksidentified below or elsewhere in this document will materialize. All of these assumptions have been derived from informationcurrently available to the Company, including information obtained by the Company from third-party sources. Theseassumptions may prove to be incorrect in whole or in part. In addition, actual results may differ materially from thoseexpressed, implied, or forecasted in such forward-looking information, which reflect the Company’s expectations only as of thedate hereof.
Factors that could cause actual results or outcomes to differ materially from the results expressed, implied, or forecasted byforward-looking information include, among other things:
• risks associated with the Company focusing solely on the protein business;
• risks related to the Company's decisions regarding any potential return of capital to shareholders;
• risks associated with completing the Value Creation Plan and the risk associated with the concentration of production infewer facilities;
• risks associated with the availability of capital;
• risks associated with changes in the Company’s information systems and processes;
• risks posed by food contamination, consumer liability, and product recalls;
• risks associated with acquisitions, divestitures, and capital expansion projects;
• impact on pension expense and funding requirements of fluctuations in the market prices of fixed income and equitysecurities and changes in interest rates;
• cyclical nature of the cost and supply of hogs and the competitive nature of the pork market generally;
• risks related to the health status of livestock;
• impact of a pandemic on the Company’s operations;
• the Company’s exposure to currency exchange risks;
• ability of the Company to hedge against the effect of commodity price changes through the use of commodity futures andoptions;
• impact of changes in the market value of the biological assets and hedging instruments;
• impact of international events on commodity prices and the free flow of goods;
• risks posed by compliance with extensive government regulation;
• risks posed by litigation;
• impact of changes in consumer tastes and buying patterns;
• impact of extensive environmental regulation and potential environmental liabilities;
• risks associated with a consolidating retail environment;
• risks posed by competition;
MANAGEMENT'S DISCUSSION AND ANALYSIS | 2015 | MAPLE LEAF FOODS INC.
31
• risks associated with complying with differing employment laws and practices, the potential for work stoppages due tonon-renewal of collective agreements, and recruiting and retaining qualified personnel;
• risks associated with pricing the Company’s products;
• risks associated with managing the Company’s supply chain; and
• risks associated with failing to identify and manage the strategic risks facing the Company.
The Company cautions the reader that the foregoing list of factors is not exhaustive. These factors are discussed in moredetail under the heading “Risk Factors” presented previously in this document. The reader should review such section in detail.Some of the forward-looking information may be considered to be financial outlooks for purposes of applicable securitieslegislation including, but not limited to, statements concerning future Adjusted EBITDA margins; capital expenditures; and cashcosts. These financial outlooks are presented to allow the Company to benchmark the results of the Value Creation Plan.These financial outlooks may not be appropriate for other purposes and readers should not assume they will be achieved. TheCompany does not intend to, and the Company disclaims any obligation to, update any forward-looking information, whetherwritten or oral, or whether as a result of new information, future events or otherwise, except as required by law. Additionalinformation concerning the Company, including the Company’s Annual Information Form, is available on SEDAR atwww.sedar.com.
MANAGEMENT'S DISCUSSION AND ANALYSIS | 2015 | MAPLE LEAF FOODS INC.
32
Independent Auditors' Report 34
Consolidated Balance Sheets 35
Consolidated Statements of Net Earnings 36
Consolidated Statements of Other Comprehensive Income (Loss) 37
Consolidated Statements of Changes in Total Equity 38
Consolidated Statements of Cash Flows 39
Notes to the Consolidated Financial Statements
Note 1. The Company 40
Note 2. Basis of Preparation 40
Note 3. Significant Accounting Policies 42
Note 4. Cash and Cash Equivalents 50
Note 5. Accounts Receivable 51
Note 6. Inventories 51
Note 7. Biological Assets 52
Note 8. Property and Equipment 53
Note 9. Employee Benefits 54
Note 10. Goodwill 58
Note 11. Intangible Assets 59
Note 12. Provisions 61
Note 13. Long-Term Debt 62
Note 14. Other Current Liabilities 63
Note 15. Other Long-Term Liabilities 63
Note 16. Accumulated Other Comprehensive Income (Loss) Attributable to Common Shareholders 64
Note 17. Share Capital 65
Note 18. Financial Instruments and Risk Management Activities 65
Note 19. Other Income (Expense) 70
Note 20. Interest Expense and Other Financing Costs 71
Note 21. Income Taxes 71
Note 22. Discontinued Operations 73
Note 23. Earnings (Loss) Per Share 75
Note 24. Share-Based Payment 75
Note 25. Composition of the Company 78
Note 26. Commitments and Contingencies 79
Note 27. Related Party Transactions 80
Note 28. Government Incentives 81
Note 29. Segmented Financial Information 81
TABLE OF CONTENTS | 2015 | MAPLE LEAF FOODS INC.
Consolidated Financial Statements
33
INDEPENDENT AUDITORS' REPORT | 2015 | MAPLE LEAF FOODS INC.
Independent Auditors' Report
34
To the Shareholders of Maple Leaf Foods Inc. We have audited the accompanying consolidated financial statements of Maple Leaf Foods Inc., which comprise the consolidated balance sheets as at December 31, 2015 and December 31, 2014, the consolidated statements of net earnings, other comprehensive income (loss), changes in total equity and cash flows for the years then ended, and notes, comprising a summary of significant accounting policies and other explanatory information. Management’s Responsibility for the Consolidated Financial Statements Management is responsible for the preparation and fair presentation of these consolidated financial statements in accordance with International Financial Reporting Standards, and for such internal control as management determines is necessary to enable the preparation of consolidated financial statements that are free from material misstatement, whether due to fraud or error. Auditors’ Responsibility Our responsibility is to express an opinion on these consolidated financial statements based on our audits. We conducted our audits in accordance with Canadian generally accepted auditing standards. Those standards require that we comply with ethical requirements and plan and perform the audit to obtain reasonable assurance about whether the consolidated financial statements are free from material misstatement. An audit involves performing procedures to obtain audit evidence about the amounts and disclosures in the consolidated financial statements. The procedures selected depend on our judgement, including the assessment of the risks of material misstatement of the consolidated financial statements, whether due to fraud or error. In making those risk assessments, we consider internal control relevant to the entity’s preparation and fair presentation of the consolidated financial statements in order to design audit procedures that are appropriate in the circumstances, but not for the purpose of expressing an opinion on the effectiveness of the entity’s internal control. An audit also includes evaluating the appropriateness of accounting policies used and the reasonableness of accounting estimates made by management, as well as evaluating the overall presentation of the consolidated financial statements. We believe that the audit evidence we have obtained in our audits is sufficient and appropriate to provide a basis for our audit opinion. Opinion In our opinion, the consolidated financial statements present fairly, in all material respects, the consolidated financial position of Maple Leaf Foods Inc. as at December 31, 2015 and December 31, 2014, and its consolidated financial performance and its consolidated cash flows for the years then ended in accordance with International Financial Reporting Standards.
Chartered Professional Accountants, Licensed Public Accountants February 29, 2016 Toronto, Canada

(In thousands of Canadian dollars) NotesAs at December 31,
2015As at December 31,
2014
ASSETSCurrent assets
Cash and cash equivalents 4 $ 292,269 $ 496,328Accounts receivable 5 57,958 60,396Notes receivable 25 103,706 110,209Inventories 6 257,671 270,401Biological assets 7 103,877 105,743Prepaid expenses and other assets 14,946 20,157Assets held for sale 130 1,107
$ 830,557 $ 1,064,341Property and equipment 8 1,082,360 1,042,506Investment property 7,336 3,312Employee benefits 9 66,519 88,162Other long-term assets 10,791 9,881Deferred tax asset 21 66,911 74,986Goodwill 10 428,236 428,236Intangible assets 11 138,155 165,066Total assets $ 2,630,865 $ 2,876,490
LIABILITIES AND EQUITYCurrent liabilities
Accounts payable and accruals $ 256,473 $ 275,249Provisions 12 32,531 60,443Current portion of long-term debt 13 813 472Income taxes payable 21 9,670 26,614Other current liabilities 14 29,637 24,383
$ 329,124 $ 387,161Long-term debt 13 9,843 10,017Employee benefits 9 203,241 196,482Provisions 12 14,622 17,435Other long-term liabilities 15 20,901 20,899Total liabilities $ 577,731 $ 631,994
Shareholders’ equityShare capital 17 $ 882,770 $ 936,479Retained earnings 1,172,864 1,228,815Contributed surplus — 79,652Accumulated other comprehensive income (loss) associated with continuing operations 16 (414) (226)Treasury stock 17 (2,086) (224)Total shareholders’ equity $ 2,053,134 $ 2,244,496Total liabilities and equity $ 2,630,865 $ 2,876,490
Commitments and contingencies (Note 26)
See accompanying Notes to the Consolidated Financial Statements.
On behalf of the Board:
MICHAEL H. MCCAIN WILLIAM E. AZIZDirector Director
CONSOLIDATED BALANCE SHEETS | 2015 | MAPLE LEAF FOODS INC.
Consolidated Balance Sheets
35

Years ended December 31, (In thousands of Canadian dollars, except share amounts) Notes 2015 2014
Sales $ 3,292,932 $ 3,157,241Cost of goods sold 2,911,791 2,938,964Gross margin $ 381,141 $ 218,277Selling, general and administrative expenses 288,055 297,881Earnings (loss) from continuing operations before the following: $ 93,086 $ (79,604)Restructuring and other related costs 12 (33,825) (67,592)Change in fair value of non-designated interest rate swaps 19 — 2,492Other income (expense) 19 (1,899) (16,791)Earnings (loss) before interest and income taxes from continuing operations $ 57,362 $ (161,495)Interest expense and other financing costs 20 4,711 126,874Earnings (loss) before income taxes from continuing operations $ 52,651 $ (288,369)Income taxes expense (recovery) 21 11,071 (74,556)Earnings (loss) from continuing operations $ 41,580 $ (213,813)Earnings (loss) from discontinued operations 22 — 925,719Net earnings $ 41,580 $ 711,906
Attributed to:Common shareholders $ 41,580 $ 709,931Non-controlling interest — 1,975
$ 41,580 $ 711,906Earnings (loss) per share attributable to common shareholders: 23
Basic earnings per share $ 0.30 $ 5.03Diluted earnings per share $ 0.29 $ 5.03Basic earnings (loss) per share from continuing operations $ 0.30 $ (1.51 )Diluted earnings (loss) per share from continuing operations $ 0.29 $ (1.51 )
Weighted average number of shares (millions) 23Basic 140.2 141.2Diluted 141.7 141.2
See accompanying Notes to the Consolidated Financial Statements.
CONSOLIDATED STATEMENTS OF NET EARNINGS | 2015 | MAPLE LEAF FOODS INC.
Consolidated Statements of Net Earnings
36
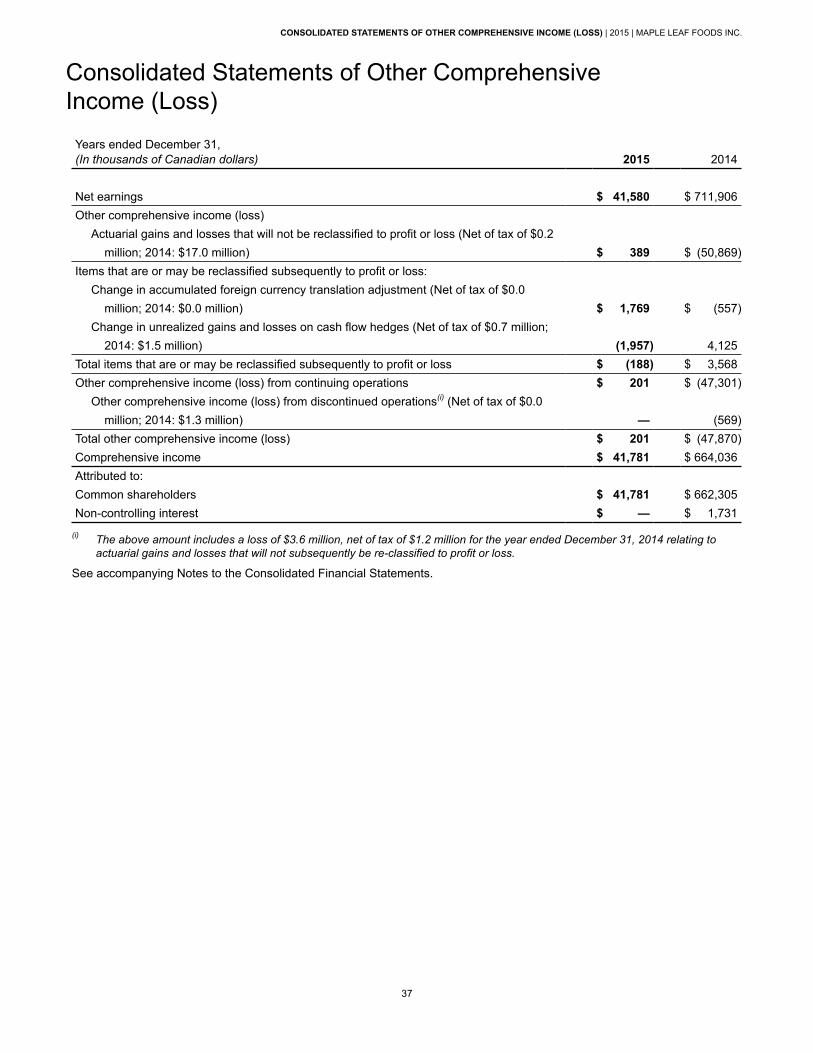
Years ended December 31, (In thousands of Canadian dollars) 2015 2014
Net earnings $ 41,580 $ 711,906Other comprehensive income (loss)
Actuarial gains and losses that will not be reclassified to profit or loss (Net of tax of $0.2 million; 2014: $17.0 million) $ 389 $ (50,869)
Items that are or may be reclassified subsequently to profit or loss:Change in accumulated foreign currency translation adjustment (Net of tax of $0.0 million; 2014: $0.0 million) $ 1,769 $ (557)Change in unrealized gains and losses on cash flow hedges (Net of tax of $0.7 million; 2014: $1.5 million) (1,957) 4,125
Total items that are or may be reclassified subsequently to profit or loss $ (188) $ 3,568Other comprehensive income (loss) from continuing operations $ 201 $ (47,301)
Other comprehensive income (loss) from discontinued operations(i) (Net of tax of $0.0 million; 2014: $1.3 million) — (569)
Total other comprehensive income (loss) $ 201 $ (47,870)Comprehensive income $ 41,781 $ 664,036Attributed to:Common shareholders $ 41,781 $ 662,305Non-controlling interest $ — $ 1,731
(i) The above amount includes a loss of $3.6 million, net of tax of $1.2 million for the year ended December 31, 2014 relating toactuarial gains and losses that will not subsequently be re-classified to profit or loss.
See accompanying Notes to the Consolidated Financial Statements.
CONSOLIDATED STATEMENTS OF OTHER COMPREHENSIVE INCOME (LOSS) | 2015 | MAPLE LEAF FOODS INC.
Consolidated Statements of Other Comprehensive Income (Loss)
37
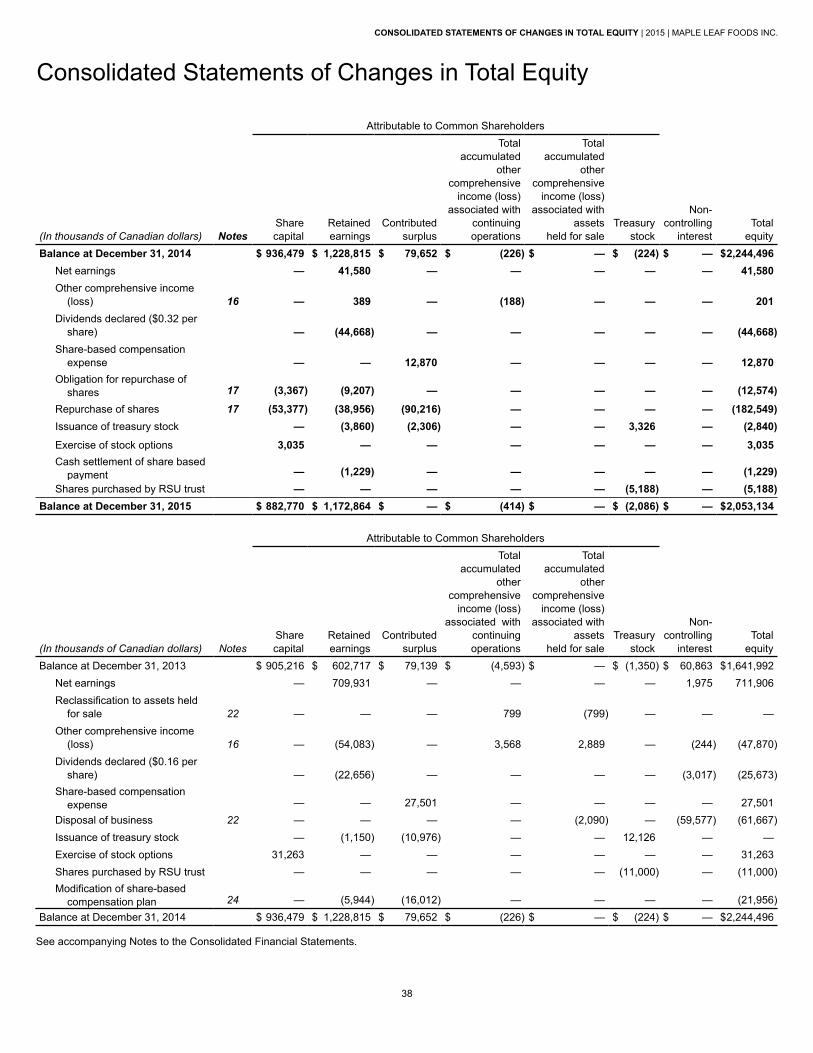
Attributable to Common Shareholders
(In thousands of Canadian dollars) NotesSharecapital
Retained earnings
Contributed surplus
Total accumulated
other comprehensive
income (loss)associated with
continuing operations
Total accumulated
other comprehensive
income (loss)associated with
assetsheld for sale
Treasury stock
Non- controlling
interestTotal
equityBalance at December 31, 2014 $ 936,479 $ 1,228,815 $ 79,652 $ (226) $ — $ (224) $ — $2,244,496
Net earnings — 41,580 — — — — — 41,580Other comprehensive income
(loss) 16 — 389 — (188) — — — 201Dividends declared ($0.32 per
share) — (44,668) — — — — — (44,668)Share-based compensation
expense — — 12,870 — — — — 12,870Obligation for repurchase of
shares 17 (3,367) (9,207) — — — — — (12,574)
Repurchase of shares 17 (53,377) (38,956) (90,216) — — — — (182,549)Issuance of treasury stock — (3,860) (2,306) — — 3,326 — (2,840)
Exercise of stock options 3,035 — — — — — — 3,035Cash settlement of share based
payment — (1,229) — — — — — (1,229)Shares purchased by RSU trust — — — — — (5,188) — (5,188)
Balance at December 31, 2015 $ 882,770 $ 1,172,864 $ — $ (414) $ — $ (2,086) $ — $2,053,134
Attributable to Common Shareholders
(In thousands of Canadian dollars) NotesSharecapital
Retained earnings
Contributed surplus
Total accumulated
other comprehensive
income (loss) associated with
continuing operations
Total accumulated
other comprehensive
income (loss)associated with
assetsheld for sale
Treasury stock
Non- controlling
interestTotal
equityBalance at December 31, 2013 $ 905,216 $ 602,717 $ 79,139 $ (4,593) $ — $ (1,350) $ 60,863 $1,641,992
Net earnings — 709,931 — — — — 1,975 711,906Reclassification to assets held
for sale 22 — — — 799 (799) — — —Other comprehensive income
(loss) 16 — (54,083) — 3,568 2,889 — (244) (47,870)Dividends declared ($0.16 per
share) — (22,656) — — — — (3,017) (25,673)Share-based compensation
expense — — 27,501 — — — — 27,501Disposal of business 22 — — — — (2,090) — (59,577) (61,667)Issuance of treasury stock — (1,150) (10,976) — — 12,126 — —Exercise of stock options 31,263 — — — — — — 31,263Shares purchased by RSU trust — — — — — (11,000) — (11,000)Modification of share-based
compensation plan 24 — (5,944) (16,012) — — — — (21,956)Balance at December 31, 2014 $ 936,479 $ 1,228,815 $ 79,652 $ (226) $ — $ (224) $ — $2,244,496
See accompanying Notes to the Consolidated Financial Statements.
CONSOLIDATED STATEMENTS OF CHANGES IN TOTAL EQUITY | 2015 | MAPLE LEAF FOODS INC.
Consolidated Statements of Changes in Total Equity
38

Years ended December 31, (In thousands of Canadian dollars) Notes 2015 2014CASH PROVIDED BY (USED IN) :Operating activities
Net earnings $ 41,580 $ 711,906Add (deduct) items not affecting cash:
Change in fair value of biological assets 12,778 (530)Depreciation and amortization 123,480 111,375Share-based compensation 12,870 27,501Deferred income taxes 9,178 (26,533)Income tax current 1,893 59,100Interest expense and other financing costs 4,711 127,660Loss (gain) on sale of long-term assets (10,344) (718)Loss (gain) on sale of business 22 — (1,000,968)Change in fair value of non-designated derivative financial instruments (1,429) (10,983)Impairment of assets (net of reversals) 1,907 2,466
Change in net pension liability 26,761 18,794Net income taxes paid (12,735) (1,442)Net settlement of financial instruments — (23,631)Early repayment premium — (76,311)Interest paid (3,674) (39,897)Change in provision for restructuring and other related costs (14,963) 30,409Settlement of cash-settled restricted share units (11,236) (21,640)Other 2,519 (5,741)Change in non-cash operating working capital (23,889) (243,035)
Cash provided by (used in) operating activities $ 159,407 $ (362,218)Financing activities
Dividends paid $ (44,668) $ (22,656)Dividends paid to non-controlling interest — (24,621)Net increase (decrease) in long-term debt (125) (698,889)Net drawings (payments) on the credit facility — (255,000)Exercise of stock options 3,035 31,263Repurchase of shares (182,549) —Payment of financing fees (277) (3,769)
Cash provided by (used in) financing activities $ (224,584) $ (973,672)Investing activities
Additions to long-term assets $ (147,699) $ (259,181)Capitalization of interest expense — (5,504)Adjustment to sale of business 22 — (468)Proceeds from sale of business — 1,647,015Transaction costs (64) (28,227)Cash associated with divested business — (23,011)Proceeds from sale of long-term assets 14,069 10,332Purchase of treasury stock (5,188) (11,000)
Cash provided by (used in) investing activities $ (138,882) $ 1,329,956Increase (decrease) in cash and cash equivalents $ (204,059) $ (5,934)Net cash and cash equivalents, beginning of period 496,328 502,262Net cash and cash equivalents, end of period 4 $ 292,269 $ 496,328
See accompanying Notes to the Consolidated Financial Statements.
CONSOLIDATED STATEMENTS OF CASH FLOWS | 2015 | MAPLE LEAF FOODS INC.
Consolidated Statements of Cash Flows
39

1. THE COMPANY Maple Leaf Foods Inc. (“Maple Leaf Foods” or the “Company”) is a producer of food products under leading brands includingMaple Leaf®, Maple Leaf Prime®, Maple Leaf Natural Selections®, Schneiders®, Schneiders Country Naturals® and Mina™.The Company's portfolio includes prepared meats, ready-to-cook and ready-to-serve meals and valued-added fresh pork andpoultry. The address of the Company’s registered office is 6985 Financial Dr. Mississauga, Ontario, L5N 0A1, Canada. Theconsolidated financial statements of the Company as at and for the year ended December 31, 2015, include the accounts ofthe Company and its subsidiaries. The principle activities and composition of the Company are further described in Note 25.The Company’s results are organized into three segments: Meat Products Group, Agribusiness Group, and Bakery ProductsGroup. During the year ended December 31, 2014, the operations of the Bakery Products Group were sold (Note 22).
2. BASIS OF PREPARATION (a) Statement of Compliance The consolidated financial statements have been prepared in accordance with International Financial Reporting Standards("IFRS") as issued by the International Accounting Standards Board (“IASB”) and using the accounting policies describedherein.
The consolidated financial statements were authorized for issue by the Board of Directors on February 29, 2016.
(b) Basis of Measurement The consolidated financial statements have been prepared on a historical cost basis except for certain financial instruments,biological assets, defined benefit plan assets, and liabilities associated with certain share-based compensation, which arestated at fair value. Liabilities associated with employee benefits are stated at actuarially determined present values.
(c) Functional and Presentation Currency The consolidated financial statements are presented in Canadian dollars, which is the Company’s functional currency.
(d) Disposal of businessThe consolidated financial statements have been prepared including the results of businesses that were disposed of during theprior years up to the date of disposal.
The prior year Consolidated Balance Sheet includes the assets of divested businesses up until the date of sale. From the pointof time when Management determines that the carrying amount of a business will be recovered through a sale transactionrather than continuing use, the assets and liabilities of that business are presented as assets held for sale, and liabilitiesassociated with assets held for sale. The Consolidated Statements of Cash Flows include the cash flows of divested businessup to the date of sale. Comparative balance sheet and cash flow information has not been restated to reflect this.
The results of businesses sold have been presented in the Consolidated Statements of Net Earnings and ConsolidatedStatements of Other Comprehensive Income (Loss) separately, net of tax. A full statement of earnings for each divestedbusiness is included in Note 22.
(e) Use of Estimates and Judgements The preparation of consolidated financial statements in accordance with IFRS requires Management to make judgements,estimates, and assumptions that affect the application of accounting policies and the reported amounts of assets, liabilities,income, and expenses. Actual amounts may differ from these estimates.
Estimates and underlying assumptions are reviewed on an ongoing basis. Revisions to accounting estimates are recognized inthe period in which the estimates are revised and in any future periods affected.
Judgements included in the financial statements are decisions made by Management, based on analysis of relevantinformation available at the time the decision is made. Judgements relate to the application of accounting policies anddecisions related to the measurement, recognition, and disclosure of financial amounts. Information about significant areas ofcritical judgements in applying accounting policies, that have the most significant effects on the amounts recognized in theconsolidated financial statements, are included both below and in the statement notes relating to items subject to significantand critical judgements.
Information about significant areas of estimation uncertainty and critical judgements in applying accounting policies, that havethe most significant effects on the amounts recognized in the consolidated financial statements, are included both below and inthe statement notes relating to items subject to significant estimate uncertainty and critical judgements.
NOTES TO THE CONSOLIDATED FINANCIAL STATEMENTS | 2015 | MAPLE LEAF FOODS INC.
Notes to the Consolidated Financial Statements(Tabular amounts in thousands of Canadian dollars unless otherwise indicated)Years ended December 31, 2015 and 2014
40
Long-Lived Assets Valuation
The Company performs impairment testing annually for goodwill and indefinite life intangible assets and, when circumstancesindicate that there may be impairment, for other long-lived assets. Management judgement is involved in determining if thereare circumstances indicating that testing for impairment is required, and in identifying Cash Generating Units (“CGUs”) for thepurpose of impairment testing.
The Company assesses impairment by comparing the recoverable amount of a long-lived asset, CGU, or CGU group to itscarrying value. The recoverable amount is defined as the higher of: (i) value in use; or (ii) fair value less cost to sell.
The determination of the recoverable amount involves significant estimates and assumptions, including those with respect tofuture cash inflows and outflows, discount rates, and asset lives. These estimates and assumptions could affect theCompany’s future results if the current estimates of future performance and fair values change. These determinations willaffect the amount of amortization expense on definite life intangible assets recognized in future periods.
Measurement of Fair Values
A number of the Company’s accounting policies and disclosures require the measurement of fair values, for both financial andnon-financial assets and liabilities. When the measurement of fair values cannot be determined based on quoted prices inactive markets, fair value is measured using valuation techniques and models. The inputs to these models are taken fromobservable markets where possible, but where this is not feasible, a degree of judgement is required in establishing fairvalues. Changes in assumptions about the inputs to these models could affect the reported fair value of the Company’sfinancial and non-financial assets and liabilities.
When measuring fair value of an asset or liability, the Company uses market observable data to the extent that it is possible.To the extent that these estimates differ from those realized, the measured asset or liability, net earnings, and/orcomprehensive income will be affected in future periods.
Information about the valuation techniques and inputs used in determining the fair value of various assets and liabilities aredisclosed in Notes 7, 9, 10, 11, and 18.
Nature of Interests in Other Entities
Management applies significant judgement in assessing the nature of its interest in an unconsolidated structured entity. TheCompany does not hold any equity interest in the structured entity and based on the terms of the agreements under which theentity is established, the Company does not receive the returns related to their operations and is exposed to limited recoursewith respect to losses (Note 25).
Valuation of Inventory
Management makes estimates of the future customer demand for products when establishing appropriate provisions forinventory. In making these estimates, Management considers the product life of inventory and the profitability of recent sales ofinventory. In many cases, product sold by the Company turns quickly and inventory on-hand values are low, thus reducing therisk of inventory obsolescence. However, code or “best before” dates are very important in the determination of realizablevalue of inventory. Management ensures that systems are in place to highlight and properly value inventory that may beapproaching code dates. To the extent that actual losses on inventory differ from those estimated, inventory, net earnings, andcomprehensive income will be affected in future periods.
Biological Assets
Biological assets are measured at each reporting date, at fair value less costs to sell, except when fair value cannot be reliablymeasured. If fair value cannot be reliably measured, biological assets are measured at cost less depreciation and impairmentlosses. Although a reliable measure of fair value may not be available at the point of initial recognition, it may subsequentlybecome available. In such circumstances, biological assets are measured at fair value less costs to sell from the point at whichthe reliable measure of fair value becomes available. Gains and losses that arise on measuring biological assets at fair valueless costs to sell are recognized in the statement of net earnings in the period in which they arise. Costs to sell include allcosts that would be necessary to sell the biological assets, including costs necessary to get the biological assets to market.Management uses estimates for some of the inputs into the determination of fair value. To the extent that actual values differfrom estimates, biological assets, net earnings and comprehensive income will be affected in future periods.
Trade Merchandise Allowances and Other Trade Discounts
The Company provides for estimated payments to customers based on various trade programs and contracts that ofteninclude payments that are contingent upon attainment of specified sales volumes. Significant estimates used to determinethese liabilities include: (i) the projected level of sales volume for the relevant period and (ii) customer contracted rates forallowances, discounts, and rebates. These arrangements are complex and there are a significant number of customers andproducts affected. Management has systems and processes in place to estimate and value these obligations. To the extentthat payments on trade discounts differ from estimates of the related liability, accounts payable and accruals, net earnings, andcomprehensive income will be affected in future periods.
NOTES TO THE CONSOLIDATED FINANCIAL STATEMENTS | 2015 | MAPLE LEAF FOODS INC.
41

Employee Benefit Plans
The cost of pensions and other post-retirement benefits earned by employees is actuarially determined using the projectedunit credit method prorated on service, and Management’s best estimate of salary escalation and mortality rates. Discountrates used in actuarial calculations are based on long-term interest rates and can have a material effect on the amount of planliabilities and expenses. Management employs external experts to advise the Company when deciding upon the appropriateestimates to use to value employee benefit plan obligations and expenses. To the extent that these estimates differ from thoserealized, employee benefit plan assets and liabilities and comprehensive income will be affected in future periods.
Income Taxes
Provisions for income taxes are based on domestic and international statutory income tax rates and the amount of incomeearned in the jurisdictions in which the Company operates. Significant judgement is required in determining income taxprovisions and the recoverability of deferred tax assets. The calculation of current and deferred income tax balances requiresManagement to make estimates regarding the carrying values of assets and liabilities that include estimates of future cashflows and earnings related to such assets and liabilities, the interpretation of income tax legislation in the jurisdictions in whichthe Company operates, and the timing of reversal of temporary differences. The Company establishes additional provisions forincome taxes when, despite Management’s opinion that the Company’s tax positions are fully supportable, there is sufficientcomplexity or uncertainty in the application of legislation that certain tax positions may be reassessed by tax authorities. TheCompany adjusts these additional accruals in light of changing facts and circumstances. To the extent that these adjustmentsdiffer from original estimates, deferred tax assets and liabilities, net earnings, and comprehensive income will be affected infuture periods.
Provisions
The Company evaluates all provisions at each reporting date. These provisions can be significant and are prepared usingestimates of the costs of future activities. In certain instances, Management may determine that these provisions are no longerrequired or that certain provisions are insufficient as new events occur or as additional information is obtained. Provisions areseparately identified and disclosed in the Company’s consolidated financial statements. Changes to these estimates mayaffect the value of provisions, net earnings, and comprehensive income in future periods.
Share-Based Compensation
The Company uses estimates including, but not limited to, estimates of forfeitures, share price volatility, dividends, expectedlife of the award, risk-free interest rates, and Company performance in the calculation of the liability and expenses for certainshare-based incentive plans. These estimates are based on previous experience and may change throughout the life of anincentive plan. Such changes could impact the carrying value of contributed surplus, liabilities, net earnings, andcomprehensive income in future periods.
Some of the Company’s share-based payment plans are settleable in either cash or equity instruments at the option of theCompany. Management uses judgement in determining the appropriate accounting treatment for these plans, based onexpectations and historical settlement decisions. Changes to accounting treatment based on Management’s judgement mayimpact contributed surplus, liabilities, net earnings, and comprehensive income in future periods.
Depreciation and Amortization
The Company’s property and equipment and definite life intangible assets are depreciated and amortized on a straight-linebasis, taking into account the estimated useful lives of the assets and residual values. Changes to these estimates may affectthe carrying value of these assets, inventories, net earnings, and comprehensive income in future periods.
3. SIGNIFICANT ACCOUNTING POLICIES The accounting policies set out below have been applied consistently to all periods presented in these consolidated financialstatements.
(a) Principles of ConsolidationThese consolidated financial statements include the accounts of the Company and its subsidiaries from the date that controlcommences until the date that control ceases. Control exists when the Company is exposed to or has rights to variable returnsfrom its involvement with the entity and has the ability to affect those returns through its power over the entity. Non-controllinginterest represents the portion of a subsidiary’s net earnings and net assets that are attributable to shares of such a subsidiarynot held by the Company. Acquisitions of non-controlling interests are accounted for as transactions with equity holders in theircapacity as equity holders; therefore, no goodwill is recognized as a result of such transactions.
All intercompany accounts and transactions have been eliminated on consolidation.
NOTES TO THE CONSOLIDATED FINANCIAL STATEMENTS | 2015 | MAPLE LEAF FOODS INC.
42
(b) Business Combinations and GoodwillBusiness combinations are accounted for using the acquisition method at the acquisition date, which is the date that control istransferred to the Company. In assessing control, the Company takes into consideration potential voting rights that arecurrently exercisable.
Goodwill is measured as the excess of the sum of the fair value of the consideration transferred, the amount of any non-controlling interests in the acquiree, and the fair value of the Company’s previously held equity interest in the acquiree (if any)over the net of the acquisition-date fair value of the identifiable assets acquired and the liabilities assumed. If the excess isnegative, a purchase gain is recognized immediately in earnings. Transaction costs, other than those associated with the issueof debt or equity, are recognized in earnings as incurred.
Goodwill is not amortized and is tested for impairment annually in October and as required if events occur that indicate that itscarrying amount may not be recoverable. Goodwill is tested for impairment at the CGU group level by comparing the carryingamount to its recoverable amount, consistent with the methodology outlined in Note 3(k).
Non-controlling interests that are present ownership interests at the acquisition date, and entitle their holders to aproportionate share of the entity’s net assets in the event of liquidation, are initially measured either at fair value or at the non-controlling interests’ proportionate share of the recognized amounts of the acquired business' identifiable assets. The choice ofmeasurement basis is made on a transaction-by-transaction basis depending on individual factors of the transaction. Othertypes of non-controlling interest are measured at fair value or, when applicable, on the basis specified in the applicable IFRS.
Any contingent consideration payable is measured at fair value at the acquisition date. If the contingent consideration isclassified as equity, then it is not re-measured and settlement is accounted for in equity. Otherwise, subsequent changes in thefair value of the contingent consideration are recognized in earnings.
When the initial accounting for a business combination has not been finalized by the end of the reporting period in which thecombination occurs, the Company reports provisional amounts for the items for which the accounting has not been finalized.These provisional amounts are adjusted during the measurement period, which does not exceed one year from the acquisitiondate, or additional assets or liabilities are recognized, to reflect new information obtained about facts and circumstances thatexisted at the acquisition date that, if known, would have affected the amounts recognized at that date.
(c) Fair Value MeasurementsThe Company measures certain financial and non-financial assets and liabilities at fair value at each balance sheet date. Inaddition, fair value measurements are disclosed for certain financial and non-financial assets and liabilities.
Fair value is the price that would be received to sell an asset or paid to transfer a liability in an orderly transaction betweenmarket participants at the measurement date. In estimating the fair value of an asset or a liability, the Company takes intoaccount the characteristics of the asset or liability if market participants would take those characteristics into account whenpricing the asset or liability at the measurement date. Fair value for measurement and disclosure purposes is determined onsuch a basis, except for share-based payment transactions, and measurements that have some similarities to fair value butare not fair value, such as net realizable value or value in use.
Assets and liabilities, for which fair value is measured or disclosed in the financial statements, are classified using a three-levelfair value hierarchy that reflects the significance and transparency of the inputs used in making the fair value measurements.Each level is based on the following:
Level 1 - inputs are unadjusted quoted prices of identical assets or liabilities in active markets
Level 2 - inputs other than quoted prices included in Level 1 that are observable for the asset or liability, either directlyor indirectly
Level 3 - one or more significant inputs used in a valuation technique are unobservable in determining fair values ofthe asset or liability
Determination of fair value and the resulting hierarchy requires the use of observable market data whenever available. Theclassification of an asset or liability in the hierarchy is based upon the lowest level of input that is significant to themeasurement of fair value.
(d) Non-current Assets (or Disposal Groups) Held for Sale and Discontinued OperationsThe Company classifies non-current assets and disposal groups as held for sale if their carrying amounts will be recoveredprincipally through a sale transaction rather than through continuing use. The criteria for held for sale classification is regardedas met when a sale is highly probable, the asset or disposal group is available for immediate sale in its present condition, andmanagement is committed to the sale, which is expected to be completed within one year from the date of classification. Non-current assets and disposal groups classified as held for sale are measured at the lower of their carrying amount and fair valueless costs to sell. Non-current assets are not depreciated once classified as held for sale.
NOTES TO THE CONSOLIDATED FINANCIAL STATEMENTS | 2015 | MAPLE LEAF FOODS INC.
43
A discontinued operation is a component of the Company’s business which can be clearly distinguished from the rest of theCompany, both operationally and for financial reporting purposes. Classification as a discontinued operation occurs at theearlier of disposal or when the operation meets the criteria to be classified as held for sale. When an operation is classified asa discontinued operation, the comparative statements of net earnings and other comprehensive income (loss) are re-presented as if the operation has been discontinued from the start of the comparative year. Discontinued operations areexcluded from the results of continuing operations and are presented as a single amount net of tax as net earnings (loss) fromdiscontinued operations in the statements of net earnings.
(e) Translation of Foreign CurrenciesThe accounts of the Company are presented in Canadian dollars. Transactions in foreign currencies are translated at theactual rates of exchange. Monetary assets and liabilities denominated in foreign currencies at the reporting date are translatedto the Canadian dollar at the exchange rate for that date. Foreign exchange differences arising on translation are recognized innet earnings, except for financial assets and liabilities designated as hedges of the net investment in foreign operations orqualifying cash flow hedges, which are recognized in other comprehensive income (loss). Non-monetary assets and liabilitiesthat are measured at historical cost are translated using the exchange rate at the date of the transaction.
The financial statements of foreign subsidiaries whose unit of measure is not the Canadian dollar are translated into Canadiandollars using the exchange rate in effect at the period-end for assets and liabilities, and the average exchange rates for theperiod for revenue, expenses, and cash flows. Foreign exchange differences arising on translation are recognized inaccumulated other comprehensive income (loss) in total equity.
When a foreign operation is disposed of in its entirety or partially such that control, significant influence or joint control is lost,the cumulative amount in the translation reserve related to that foreign operation is reclassified to profit or loss as part of thegain or loss on disposal. If the Company disposes of part of its interest in a subsidiary but retains control, then the relevantproportion of the cumulative amount is reattributed to the non-controlling interest. When the Company disposes of only part ofan associate or joint venture while retaining significant influence or joint control, the relevant proportion of the cumulativeamount is reclassified to net earnings.
Foreign exchange gains and losses arising from a receivable or payable to a foreign operation, the settlement of which isneither planned nor likely to occur in the foreseeable future and which in substance is considered to form part of the netinvestment in the foreign operations, are recognized in other comprehensive income (loss) in the cumulate foreign currencytranslation differences.
(f) Financial InstrumentsThe Company’s financial assets and financial liabilities, upon initial recognition, are measured at fair value and are classifiedas held for trading, loans and receivables, or other financial liabilities. The classification depends on the purpose for which thefinancial instruments were acquired and their characteristics. Held for trading is the required classification for all derivativefinancial instruments unless they are specifically designated within an effective hedge relationship. Held for trading financialinstruments not designated within an effective hedging relationship are measured at fair value with changes in fair valuerecognized in consolidated statements of net earnings in the period in which such changes arise. Loans and receivables andother financial liabilities are initially recorded at fair value and are subsequently measured at amortized cost.
Financial assets are assessed at each reporting date to determine whether there is any objective evidence of impairment. Afinancial asset is considered to be impaired if objective evidence indicates that one or more events have had a negative effecton the estimated future cash flows of that asset, with impairment losses recognized in the consolidated statements of netearnings. If, in a subsequent period, the impairment loss decreases, the previously recognized impairment is reversed to theextent of the impairment.
Transaction costs, other than those related to financial instruments classified as fair value through profit or loss, which areexpensed as incurred, are capitalized to the carrying amount of the instrument and amortized using the effective interestmethod.
(g) Hedge AccountingThe Company uses derivatives and other non-derivative financial instruments to manage its exposures to fluctuations ininterest rates, foreign exchange rates, and commodity prices.
At the inception of a hedging relationship, the Company designates and formally documents the relationship between thehedging instrument and the hedged item, the risk management objective, and its strategy for undertaking the hedge. Thedocumentation identifies the specific asset, liability, or anticipated cash flows being hedged, the risk that is being hedged, thetype of hedging instrument used, and how effectiveness will be assessed.
The Company also formally assesses both at inception and at least quarterly thereafter, whether or not the derivatives that areused in hedging transactions are highly effective in offsetting the changes attributable to the hedged risks in the fair values or
NOTES TO THE CONSOLIDATED FINANCIAL STATEMENTS | 2015 | MAPLE LEAF FOODS INC.
44
cash flows of the hedged items. If a hedge relationship becomes ineffective, it no longer qualifies for hedge accounting andany subsequent change in the fair value of the hedging instrument is recognized in net earnings.
When hedge accounting is appropriate, the hedging relationship is designated as a cash flow hedge, a fair value hedge, or ahedge of foreign currency exposure of a net investment in a self-sustaining foreign operation. In a cash flow hedge, thechange in fair value of the hedging instrument is recorded, to the extent it is effective, in other comprehensive income until thehedged item affects net earnings. In a fair value hedge, the change in fair value of the hedging derivative is offset in theconsolidated statements of net earnings by the change in fair value of the hedged item relating to the hedged risk.
In a net investment hedge, the change in fair value of the hedging instrument is recorded, to the extent effective, directly inother comprehensive income (loss). These amounts are recognized in earnings when the corresponding accumulated othercomprehensive income (loss) from self-sustaining foreign operations is recognized in net earnings. The Company hadpreviously designated certain U.S. dollar-denominated notes payable as net investment hedges of U.S. operations that weredisposed of during the year ended December 31, 2014.
Hedge ineffectiveness is measured and recorded in current period earnings in the consolidated statements of net earnings.When either a fair value hedge or cash flow hedge is discontinued, any cumulative adjustment to either the hedged item orother comprehensive income (loss) is recognized in net earnings, as the hedged item affects net earnings, or when thehedged item is derecognized. If a designated hedge is no longer effective, the associated derivative instrument issubsequently carried at fair value through net earnings without any offset from the hedged item.
Derivatives that do not qualify for hedge accounting are carried at fair value on the consolidated balance sheets, andsubsequent changes in their fair value are recorded in the consolidated statements of net earnings.
(h) Cash and Cash EquivalentsCash and cash equivalents are comprised of cash balances and demand deposits.
(i) InventoriesInventories are valued at the lower of cost and net realizable value, with cost being determined substantially on a first-in, first-out basis. The cost of inventory includes direct product costs, direct labour, and an allocation of variable and fixedmanufacturing overhead, including depreciation. When circumstances that previously caused inventories to have a write-downbelow cost no longer exist, or when there is clear evidence of an increase in the net realizable value, the amount of a write-down previously recorded is reversed through cost of goods sold.
(j) Biological AssetsBiological assets consist of live hogs, poultry, and eggs. For the purposes of valuation, these assets are categorized as eitherparent stock or commercial stock. Parent stock represents animals held and bred for the purpose of generating commercialstock and to replace parent stock nearing the end of its productive cycle. Commercial stock is held for the purposes of furtherprocessing or eventual sale, at which point it becomes inventory. The fair value of commercial stock is determined based onmarket prices of livestock of similar age, breed, and generic merit, less costs to sell the assets, including estimated costsnecessary to transport the assets to market. Where reliable market prices of parent stock are not available, they are valued atcost less accumulated depreciation and any accumulated impairment losses. No active liquid market exists for parent stock asthey are rarely sold. Hog parent stock is depreciated on a straight-line basis over two to three years after taking into accountresidual values, whereas poultry parent stock is depreciated on a straight-line basis over six to eight months.
Biological assets are transferred into inventory at fair value less costs to sell at the point of delivery.
(k) Impairment or Disposal of Long-Lived AssetsThe Company reviews long-lived assets or asset groups held and used, including property and equipment and intangibleassets subject to amortization, for recoverability whenever events or changes in circumstances indicate that their carryingamount may not be recoverable. Asset groups referred to as CGUs include an allocation of corporate assets and are reviewedat their lowest level for which identifiable cash inflows are largely independent of cash inflows of other assets or groups ofassets. The recoverable amount is the greater of its value in use and its fair value less cost to sell.
Value in use is based on estimates of discounted future cash flows expected to be recovered from a CGU through its use.Management develops its cash flow projections based on past performance and its expectations of future market and businessdevelopments. Once calculated, the estimated future pre-tax cash flows are discounted to their present value using a pre-taxdiscount rate that reflects current market assessments of the time value of money and the risks specific to the asset.
Fair value less cost to sell is the amount obtainable from the sale of an asset or CGU in an arm’s-length transaction betweenknowledgeable, willing parties, less the costs of disposal. Costs of disposal are incremental costs directly attributable to thedisposal of an asset or CGU, excluding financing costs and income tax expense.
An impairment loss is recognized in the consolidated statements of net earnings when the carrying amount of any asset or itsCGU exceeds its estimated recoverable amount. Impairment losses recognized in respect of CGUs are allocated, first to
NOTES TO THE CONSOLIDATED FINANCIAL STATEMENTS | 2015 | MAPLE LEAF FOODS INC.
45
reduce the carrying amount of any goodwill allocated to the CGU, and then to reduce the net carrying amount of the otherassets in the CGU on a pro rata basis.
Impairment losses related to long-lived assets recognized in prior periods are assessed at each reporting date for anyindications that the loss has decreased or no longer exists. An impairment loss is reversed if there has been a change in theestimates used to determine the recoverable amount. An impairment loss is reversed only to the extent that the asset’scarrying amount does not exceed the carrying amount that would have been determined, net of depreciation and amortization,if no previous impairment loss had been recognized.
(l) Property and EquipmentProperty and equipment, with the exception of land, is recorded at cost less accumulated depreciation and any netaccumulated impairment losses. Land is carried at cost and not depreciated. For qualifying assets, cost includes interestcapitalized during the construction or development period. Construction-in-process assets are capitalized during constructionand depreciation commences when the asset is available for use. Depreciation related to assets used in production isrecorded in inventory and cost of goods sold. Depreciation related to non-production assets is recorded through selling,general, and administrative expense. Depreciation is calculated on a straight-line basis, after taking into account residualvalues, over the following expected useful lives of the assets:
___________________________________________________________________________________________________
Buildings, including other components 10-40 yearsMachinery and equipment 3-20 years____________________________________________________________________________________________________
When parts of an item of property and equipment have different useful lives, those components are accounted for as separateitems of property and equipment.
(m) Investment PropertyInvestment property is comprised of properties owned by the Company that are held to either earn rental income or for capitalappreciation, or both. The Company’s investment properties include land and buildings.
Investment properties are recorded at cost less accumulated depreciation and any accumulated impairment losses, with theexception of land which is recorded at cost less any accumulated impairment losses. The depreciation policies for investmentproperties are consistent with those for buildings.
(n) Intangible AssetsIntangible assets include computer software, trademarks, customer relationships, poultry production quota, and deliveryroutes. Definite life intangible assets are measured at cost less accumulated amortization and any net accumulatedimpairment losses. Amortization is recognized in the consolidated statements of earnings on a straight-line basis over theirestimated useful lives as follows:
____________________________________________________________________________________________________
Trademarks 10 years Computer software 3-10 years Customer relationships 20-25 years____________________________________________________________________________________________________
Indefinite life intangibles including trademarks, poultry production quota, and delivery routes are tested for impairment annuallyin the fourth quarter and otherwise as required if events occur that indicate that the net carrying value may not be recoverable.
Upon recognition of an intangible asset, the Company determines if the asset has a definite or indefinite life. In making thisdetermination, the Company considers the expected use, expiry of agreements, the nature of the asset, and whether the valueof the asset decreases over time.
(o) Employee Benefit PlansThe Company provides post-employment benefits through defined benefit and defined contribution plans.
Defined Benefit Plans
The Company accrues obligations and costs in respect of employee defined benefit plans. The cost of pensions and otherretirement benefits earned by employees is actuarially determined using the projected unit credit method prorated on serviceand Management's best estimate of salary escalation, retirement ages of employees, mortality rates, and expected health carecosts. Changes in these assumptions could affect future pension expense. The fair value of plan assets and the present valueof the obligation are used to calculate net interest cost or income. The discount rate used to value the defined benefit
NOTES TO THE CONSOLIDATED FINANCIAL STATEMENTS | 2015 | MAPLE LEAF FOODS INC.
46
obligation is based on high-quality corporate bonds in the same currency in which the benefits are expected to be paid andwith terms to maturity that, on average, match the terms of the defined benefit obligations.
Actuarial gains and losses due to changes in defined benefit plan assets and obligations are recognized immediately inaccumulated other comprehensive income (loss).
When the calculation results in a net benefit asset, the recognized asset is limited to the total of any unrecognized past servicecosts and the present value of economic benefits available in the form of future refunds from the plan or reductions in futurecontributions to the plan (the “asset ceiling”). In order to calculate the present value of economic benefits, consideration isgiven to minimum funding requirements that apply to the plan. Where it is anticipated that the Company will not be able torecover the value of the net defined benefit asset, after considering minimum funding requirements for future services, the netdefined benefit asset is reduced to the amount of the asset ceiling. The impact of the asset ceiling is recognized in othercomprehensive income (loss).
When future payment of minimum funding requirements related to past service would result in a net defined benefit asset“surplus” or an increase in a surplus, the minimum funding requirements are recognized as a liability, to the extent that thesurplus would not be fully available as a refund or a reduction in future contributions. Re-measurement of this liability isrecognized in other comprehensive income (loss) in the period in which the re-measurement occurs.
Defined Contribution Plans
The Company’s obligations for contributions to employee defined contribution pension plans are recognized in theconsolidated statement of net earnings in the periods during which services are rendered by employees.
Multi-Employer Plans
The Company participates in multi-employer pension plans which are accounted for as defined contribution plans. TheCompany does not administer these plans as the administration and the investment of these assets are controlled by a boardof trustees consisting of union and employer representatives. The Company’s responsibility to make contributions to theseplans is established pursuant to collective bargaining agreements. The contributions made by the Company to the multi-employer plans are expensed when due.
(p) Share-Based CompensationThe Company applies the fair value method of accounting for share-based compensation. The fair value at grant date of stockoptions is estimated using the Black-Scholes option-pricing model. The fair value of restricted share units (“RSUs”), includingperformance share units (“PSUs”), is measured based on the fair value of the underlying shares on the grant date.Compensation cost is recognized on a straight-line basis over the expected vesting period of the share-based compensation.The Company estimates the number of units expected to vest at the grant date and revises the estimate as necessary ifsubsequent information indicates that the actual number of units vesting differs significantly from the original estimate. The fairvalue of deferred share units (“DSUs”) is measured based on the fair value of the underlying shares at each reporting date.
The Company has share-based compensation plans which are able to be settled in either cash or equity instruments at theoption of the Company. Each grant is accounted for based on the expected settlement method at the time of issue. Theexpectation is re-evaluated at the end of each reporting period.
(q) ProvisionsProvisions are liabilities of the Company for which the amount and/or timing of settlement is uncertain. A provision isrecognized in the consolidated financial statements when the Company has a present legal or constructive obligation as aresult of a past event, and it is probable that an outflow of economic benefits will be required to settle the obligation. If theeffect is material, provisions are determined by discounting the expected future cash flows at a pre-tax rate that reflects currentmarket assessments of the time value of money and, when appropriate, the risks specific to the liability.
(r) Revenue RecognitionThe majority of the Company’s revenue is derived from the sale of product to retail and foodservice customers, as well as thesale of by-products to industrial and agricultural customers. The Company recognizes revenue from product sales at the fairvalue of the consideration received or receivable, net of estimated returns, and an estimate of sales incentives provided tocustomers. Revenue is recognized when the customer takes ownership of the product, title has transferred, all the risks andrewards of ownership have transferred to the customer, recovery of the consideration is probable, the Company has satisfiedits performance obligations under the arrangement, and has no ongoing involvement with the sold product. The value of salesincentives provided to customers are estimated using historical trends and are recognized at the time of sale as a reduction ofrevenue. Sales incentives include rebate and promotional programs provided to the Company's customers. These rebates arebased on achievement of specified volume or growth in volume levels and other agreed promotional activities. In subsequentperiods, the Company monitors the performance of customers against agreed upon obligations related to sales incentiveprograms and makes any adjustments to both revenue and sales incentive accruals as required.
NOTES TO THE CONSOLIDATED FINANCIAL STATEMENTS | 2015 | MAPLE LEAF FOODS INC.
47

The Company generally does not accept returns of spoiled products from customers. For product that may not be returned, theCompany, in certain cases, provides customers with allowances to cover any damage or spoilage, and such allowances arededucted from sales at the time of revenue recognition.
(s) Borrowing CostsBorrowing costs are primarily comprised of interest on the Company's indebtedness. Borrowing costs are capitalized whenthey are attributable to the acquisition, construction, or production of a qualifying asset. The Company defines qualifyingassets as any asset that requires more than six months to prepare for its intended use. Borrowing costs attributable toqualifying assets are calculated using the Company’s average borrowing cost excluding the costs associated with the de-recognition of accounts receivables under securitization programs. Borrowing costs that are not attributable to a qualifyingasset are expensed in the period in which they are incurred and reported within interest expense in the consolidated statementof net earnings.
(t) Government IncentivesGovernment incentives are not recognized until there is reasonable assurance that they will be received and that the Companywill be in compliance with any conditions associated with the incentives. Incentives that compensate the Company forexpenses or losses are recognized in earnings with the same classification as the related expense or loss in the same periodsin which the expenses or losses are recognized.
Government incentives received with the primary condition that the Company should purchase, construct, or otherwise acquirenon-current assets are recognized as a deduction from the associated asset on the consolidated balance sheet. The incentiveis recognized in earnings over the useful life of the asset as a reduction of the related depreciation expense.
Government incentives that are receivable as compensation for expenses or losses already incurred, or for the purpose ofgiving immediate financial support to the Company with no future related costs, are recognized in earnings in the period inwhich they become receivable.
The benefit of a government loan at a below-market rate of interest is treated as a government incentive, and is measured asthe difference between proceeds received and the fair value of the loan based on prevailing market interest rates.
(u) Income TaxesIncome tax expense is comprised of current and deferred tax. Income tax is recognized in the consolidated statement of netearnings, except to the extent that it relates to a business combination, or items recognized directly in equity or in othercomprehensive income (loss).
Current tax expense represents the amount of income taxes payable, in respect of the taxable profit for the period, based ontax law that is enacted or substantially enacted at the reporting date, and is adjusted for changes in estimates of tax expenserecognized in prior periods. A current tax liability or asset is recognized for income tax payable, or paid but recoverable inrespect of all periods to date.
The Company uses the asset and liability method of accounting for income taxes. Accordingly, deferred tax assets andliabilities are recognized for the deferred tax consequences attributable to differences between the financial statement carryingamounts of assets and liabilities and their respective tax bases. Deferred tax assets and liabilities are measured using enactedor substantively enacted tax rates expected to apply to taxable income in the years in which those temporary differences areexpected to be recovered or settled. In addition, the effect on deferred tax assets and liabilities of a change in tax rates isrecognized in both net earnings and comprehensive income in the period in which the enactment or substantive enactmenttakes place.
A deferred tax asset is recognized for unused tax losses, tax credits, and deductible temporary differences, to the extent that itis probable that future taxable income will be available to utilize such amounts. Deferred tax assets are reviewed at eachreporting date and are adjusted to the extent that it is no longer probable that the related tax benefits will be realized.
Deferred tax assets and liabilities are offset when they relate to income taxes levied by the same taxation authority and theCompany intends to settle its current tax assets and liabilities on a net basis.
Deferred tax is provided on temporary differences arising on investments in subsidiaries, except where the timing of thereversal of the temporary difference is controlled by the Company and it is probable that the temporary difference will notreverse in the foreseeable future.
NOTES TO THE CONSOLIDATED FINANCIAL STATEMENTS | 2015 | MAPLE LEAF FOODS INC.
48
(v) Accounting Standards Adopted During the Period For the first time beginning on January 1, 2015, the Company adopted certain standards and amendments. As required by IAS8 Accounting Policies, Change in Accounting Estimates and Errors, the nature and the effect of these changes are disclosedbelow:
Employee Benefits
Beginning on January 1, 2015, the Company adopted the amendments to IAS 19 Employee Benefits retrospectively. Theamendments to IAS 19 required contributions from employees or third parties that are linked to service to be attributed toperiods of service as a negative benefit. The amendments to IAS 19 provide simplified accounting in certain situations. If theamount of contribution is independent of the number of years of service, an entity is permitted to recognize such contributionsas a reduction in the service costs in the period in which the service is rendered, instead of allocating the contributions to theperiod’s service. The adoption of the amendments to IAS 19 did not have a material impact on the Company's consolidatedfinancial statements.
Annual Improvements to IFRS (2010 – 2012) and (2011 – 2013) Cycles
Beginning on January 1, 2015, the Company adopted various amendments to a total of nine standards including disclosure onthe aggregation of operating segments in IFRS 8 Operating Segments, measurement of short-term receivables and payablesunder IFRS 13 Fair Value Measurement, definition of related party in IAS 24 Related Party Disclosures, and otheramendments. The adoption of these amendments did not have a material impact on the Company's consolidated financialstatements.
(w) Accounting Pronouncements Issued But Not Yet Effective Annual Improvements to IFRS (2012-2014) Cycle
In September 2014, the IASB issued narrow-scope amendments to a total of four standards as part of its annual improvementprocess. Amendments were made to clarify items including the consistent classification of assets if they are reclassified fromheld for sale to held for distribution in IFRS 5 Non-current Assets Held for Sale and Discontinued Operations, clarification ofinterim financial statement disclosure requirements regarding offsetting financial assets and liabilities and clarification ofwhether a servicing contract constitutes continuing involvement for the purposes of disclosures of transferred financial assetsthat are derecognized under IFRS 7 Financial Instruments: Disclosures. The amendments also include clarification that thecurrency of the bonds used to estimate the discount rate for pension obligations must be the same as the currency in whichthe benefits will be paid under IAS 19 Employee Benefits and additional requirements under IAS 34 Interim FinancialReporting that cross-referenced information from the interim financial statements must be available at the same time and onthe same terms as the interim financial statements. The Company intends to adopt these amendments in its consolidatedfinancial statements for the annual period beginning January 1, 2016. The adoption of these amendments is not expected tohave a material impact on the consolidated financial statements.
Joint Arrangements
In May 2014, IFRS 11 Joint Arrangements was amended to require an acquisition of a joint operation that constitutes abusiness to be accounted for using the principles of business combinations in IFRS 3 Business Combinations. Thisamendment applies to both initial and additional interest acquired in the joint operation. The Company intends to adopt theamendments to IFRS 11 in its consolidated financial statements for the annual period beginning January 1, 2016. The adoptionof the amendments to IFRS 11 is not expected to have a material impact on the consolidated financial statements.
Consolidated Financial Statements and Investments in Associates and Joint Ventures
In September 2014, IFRS 10 Consolidated Financial Statements and IAS 28 Investments in Associates and Joint Ventureswere amended to clarify an inconsistency between the two standards relating to the sale or contribution of assets from aninvestor to its associate or joint venture. The amendment requires that a full gain or loss is recorded if the sold or contributedassets constitute a business and that a partial gain or loss is recognized when a sale or contribution of assets do notcontribute a business. The Company intends to adopt these amendments in its consolidated financial statements for theannual period beginning January 1, 2016. The adoption of these amendments is not expected to have a material impact on theconsolidated financial statements.
Revenue Recognition
In May 2014, the IASB issued IFRS 15 Revenue from Contracts with Customers. IFRS 15 replaces the detailed guidance onrevenue recognition requirements that currently exists under IFRS. IFRS 15 specifies the accounting treatment for all revenuearising from contracts with customers, unless the contracts are within the scope of other IFRSs. The standard also provides amodel for the measurement and recognition of gains and losses on the sale of certain non-financial assets that are not anoutput of the Company's ordinary activities. Additional disclosure is required under the standard, including disaggregation oftotal revenue, information about performance obligations, changes in contract asset and liability account balances betweenperiods, and key judgments and estimates. In July 2015, the effective date for IFRS 15 was deferred to apply to annual
NOTES TO THE CONSOLIDATED FINANCIAL STATEMENTS | 2015 | MAPLE LEAF FOODS INC.
49

periods beginning on or after January 1, 2018; early application is permitted either following a full retrospective approach or amodified retrospective approach. The modified retrospective approach allows the standard to be applied to existing contractsbeginning the initial period of adoption and restatements to the comparative periods are not required. The Company isrequired to disclose the impact by financial line item as a result of the adoption of the new standard. The Company intends toadopt IFRS 15 in its consolidated financial statements for the annual period beginning January 1, 2018. The extent of theimpact of adoption of IFRS 15 has not yet been determined.
Financial Instruments – Recognition and Measurement
In July 2014, the IASB issued the final version of IFRS 9 Financial Instruments with a mandatory effective date of January 1,2018. The new standard brings together the classification and measurement, impairment and hedge accounting phases of theIASB’s project to replace IAS 39 Financial Instruments: Recognition and Measurement. In addition to the new requirements forclassification and measurement of financial assets, a new general hedge accounting model and other amendments issued inprevious versions of IFRS 9, the standard also introduces new impairment requirements that are based on a forward-lookingexpected credit loss model. The Company intends to adopt IFRS 9 in its consolidated financial statements for the annualperiod beginning January 1, 2018. The extent of the impact of the adoption of IFRS 9 has not yet been determined.
The disclosure requirements in IFRS 7 Financial Instruments - Disclosure have also been amended to include the additionaldisclosure required under IFRS 9. The Company intends to adopt these amendments to IFRS 7 at the same time as adoptionof IFRS 9. The extent of the impact of the adoption of the amendments to IFRS 7 has not yet been determined.
Leases
In January 2016, the IASB issued IFRS 16 Leases with a mandatory effective date of January 1, 2019. The new standard willreplace IAS 17 Leases and will carry forward the accounting requirements for lessors. IFRS 16 provides a new framework forlessee accounting that requires substantially all assets obtained through operating leases to be capitalized and a relatedliability to be recorded. The new standard seeks to provide a more accurate picture of a Company's leased assets and relatedliabilities and create greater comparability between companies who lease assets and those who purchase assets. TheCompany intends to adopt IFRS 16 in its consolidated financial statements for the annual period beginning January 1, 2019.The extent of the impact of the adoption of IFRS 16 has not yet been determined.
4. CASH AND CASH EQUIVALENTSAs at December 31, 2015, the Company had agreements to cash collateralize certain of its letters of credit up to an amount of$120.0 million (2014: $120.0 million), of which $83.9 million (2014: $85.8 million) was deposited with a major financialinstitution.
NOTES TO THE CONSOLIDATED FINANCIAL STATEMENTS | 2015 | MAPLE LEAF FOODS INC.
50

5. ACCOUNTS RECEIVABLE
As at December 31,2015 2014
Trade receivables $ 25,537 $ 20,498Less: Allowance for doubtful accounts (5) (4)Net trade receivables $ 25,532 $ 20,494
Other receivables:Commodity taxes receivable 8,972 9,539Interest rate swap receivable 435 2,308Government receivable 11,890 16,583Other 11,129 11,472
$ 57,958 $ 60,396
The aging of trade receivables is as follows:
As at December 31,2015 2014
Current $ 16,295 $ 16,875Past due 0-30 days 9,070 3,623Past due 31-60 days 161 —Past due > 60 days 11 —
$ 25,537 $ 20,498
The Company maintains an allowance for doubtful accounts that represents its estimate of the uncollectible amounts based onspecific losses estimated on individual exposures.
The Company has sold certain of its trade accounts receivables under securitization programs as described in Note 25. TheCompany's securitization programs require the sale of trade receivables to be treated as a sale from an accountingperspective and as a result, trade receivables sold under these programs are derecognized in the consolidated balance sheetsas at December 31, 2015 and 2014.
6. INVENTORIES
As at December 31,2015 2014
Raw materials $ 28,237 $ 31,345Work in process 17,367 19,502Finished goods 165,522 169,103Packaging 15,856 22,083Spare parts 30,689 28,368
$ 257,671 $ 270,401
For the year ended December 31, 2015, inventory in the amount of $2,567.0 million (2014: $2,509.4 million) was expensedthrough cost of goods sold.
NOTES TO THE CONSOLIDATED FINANCIAL STATEMENTS | 2015 | MAPLE LEAF FOODS INC.
51

7. BIOLOGICAL ASSETS
Hog stock Poultry stockCommercial Parent Commercial Parent Total
Balance at December 31, 2014 $ 81,049 $ 19,777 $ 3,234 $ 1,683 $ 105,743 Additions and purchases 238,128 6,903 50,871 2,494 298,396 Depreciation — (4,030) — (2,404) (6,434) Change in fair value realized (11,110) — — — (11,110) Change in fair value unrealized (1,668) — — — (1,668) Further processing and sales (230,684) — (50,366) — (281,050)
Balance at December 31, 2015 $ 75,715 $ 22,650 $ 3,739 $ 1,773 $ 103,877
Hog stock Poultry stockCommercial Parent Commercial Parent Total
Balance at December 31, 2013 $ 73,345 $ 17,748 $ 3,112 $ 1,535 $ 95,740 Additions and purchases 254,382 5,980 47,286 2,356 310,004 Depreciation — (3,951) — (2,208) (6,159) Change in fair value realized (10,580) — — — (10,580) Change in fair value unrealized 11,110 — — — 11,110 Further processing and sales (247,208) — (47,164) — (294,372)
Balance at December 31, 2014 $ 81,049 $ 19,777 $ 3,234 $ 1,683 $ 105,743
Hog stock is comprised of approximately 0.8 million animals as at December 31, 2015 (2014: 0.8 million). During the yearsended December 31, 2014 and 2015, substantially all hog stock was directly transferred to the Company's primary processingoperations.
Poultry stock is comprised of approximately 7.6 million eggs and 0.2 million birds as at December 31, 2015 (2014: 6.7 millioneggs and 0.2 million birds).
The change in fair value of commercial hog and poultry stock for the year was a loss of $12.8 million for the year endedDecember 31, 2015 (2014: gain of $0.5 million) recorded in cost of goods sold.
The fair value measures of commercial hog stock have been categorized as a Level 3 fair value based on inputs to thevaluation techniques used. There were no transfers between levels for the year ended December 31, 2015.
The Company uses the market comparison approach to determine the fair value of its commercial hog stock. The valuationmodel is based on the market price of hog stock of similar age, weight, breed, and genetic make-up. The model is based onthe U.S. dollar market price per cut weight and adjusted for foreign exchange, conversion from pounds to kilograms, andspecific significant unobservable inputs, including a quality index adjustment and a market conversion factor, as defined below.
The quality index adjustment is a value adjustment based on the relative quality of a processed hog based on the lean yield(being the ratio between muscle and fat content) and total weight. Quality adjustments range from 6.7% to 7.7%. A higher(lower) quality adjustment percentage will result in an increase (decrease) to the fair market value of the commercial hogstock.
The market conversion factor is a market adjustment used to discount the formula from a U.S. market price to a Canadianpricing model. The market conversion factor experiences minimal fluctuation. A higher (lower) market conversion factor willresult in an increase (decrease) to the fair market value of the commercial hog stock.
Commercial poultry stock are valued at cost as an indicator of fair value in the case where little biological transformation hastaken place since initial cost occurrence or when the impact of the biological transformation on price is not expected to bematerial.
Where reliable market prices of parent stock are not available, they are valued at cost less accumulated depreciation and anyaccumulated impairment losses. No active liquid market exists for parent stock as they are rarely sold.
The Company has established environmental policies and procedures which comply with local environmental and other laws.Management performs regular reviews to identify environmental risks and to ensure that the systems in place are adequate tomanage those risks.
NOTES TO THE CONSOLIDATED FINANCIAL STATEMENTS | 2015 | MAPLE LEAF FOODS INC.
52
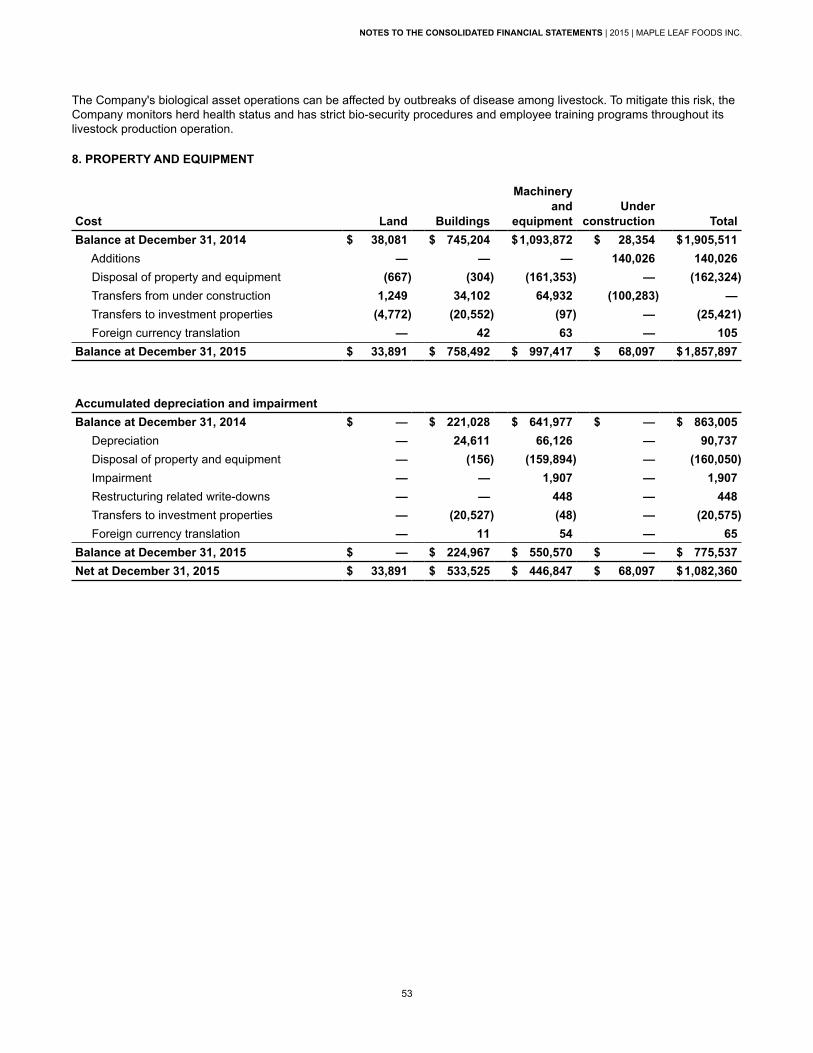
The Company's biological asset operations can be affected by outbreaks of disease among livestock. To mitigate this risk, theCompany monitors herd health status and has strict bio-security procedures and employee training programs throughout itslivestock production operation.
8. PROPERTY AND EQUIPMENT
Cost Land Buildings
Machineryand
equipmentUnder
construction TotalBalance at December 31, 2014 $ 38,081 $ 745,204 $1,093,872 $ 28,354 $1,905,511 Additions — — — 140,026 140,026 Disposal of property and equipment (667) (304) (161,353) — (162,324) Transfers from under construction 1,249 34,102 64,932 (100,283) — Transfers to investment properties (4,772) (20,552) (97) — (25,421) Foreign currency translation — 42 63 — 105Balance at December 31, 2015 $ 33,891 $ 758,492 $ 997,417 $ 68,097 $1,857,897
Accumulated depreciation and impairmentBalance at December 31, 2014 $ — $ 221,028 $ 641,977 $ — $ 863,005 Depreciation — 24,611 66,126 — 90,737 Disposal of property and equipment — (156) (159,894) — (160,050) Impairment — — 1,907 — 1,907 Restructuring related write-downs — — 448 — 448 Transfers to investment properties — (20,527) (48) — (20,575) Foreign currency translation — 11 54 — 65Balance at December 31, 2015 $ — $ 224,967 $ 550,570 $ — $ 775,537Net at December 31, 2015 $ 33,891 $ 533,525 $ 446,847 $ 68,097 $1,082,360
NOTES TO THE CONSOLIDATED FINANCIAL STATEMENTS | 2015 | MAPLE LEAF FOODS INC.
53

Cost Land Buildings
Machineryand
equipmentUnder
construction TotalBalance at December 31, 2013 $ 67,653 $ 819,480 $1,501,697 $ 308,598 $2,697,428 Additions(i) — — — 208,155 208,155 Disposal of property and equipment (16) (24,013) (119,543) (1,347) (144,919) Transfers from under construction 187 179,431 274,021 (453,639) — Transfers to investment properties (407) (21,117) (3,544) — (25,068) Transfers to assets held for sale (29,460) (210,757) (566,225) (39,033) (845,475) Interest capitalized — — — 5,252 5,252 Foreign currency translation 124 2,180 8,072 1,132 11,508 Other — — (606) (764) (1,370)Balance at December 31, 2014 $ 38,081 $ 745,204 $1,093,872 $ 28,354 $1,905,511
Accumulated depreciation and impairmentBalance at December 31, 2013 $ — $ 311,326 $1,062,784 $ — $1,374,110 Depreciation — 24,791 60,575 — 85,366 Disposal of property and equipment — (23,839) (118,998) — (142,837) Impairment — — 1,557 — 1,557 Reversal of impairment — (124) — — (124) Restructuring related write-downs — 8,056 12,175 — 20,231 Transfers to investment properties — (21,111) (3,353) — (24,464) Transfers to assets held for sale — (78,794) (377,506) — (456,300) Foreign currency translation — 723 5,349 — 6,072 Other — — (606) — (606)Balance at December 31, 2014 $ — $ 221,028 $ 641,977 $ — $ 863,005Net at December 31, 2014 $ 38,081 $ 524,176 $ 451,895 $ 28,354 $1,042,506
(i) Includes accruals of $1.9 million.
Borrowing CostsFor the year ended December 31, 2015, there were no borrowing costs capitalized (2014: $5.2 million, using an averagecapitalization rate of 6.7%).
9. EMPLOYEE BENEFITS
The Company sponsors several defined benefit pension plans for Canadian employees which are either final salary plans,career salary plans, service based plans, or a combination thereof. The Company also sponsors a final salary defined benefitpension plan in the U.K. in which membership is closed. These defined benefit plans require contributions to be made toseparately administered funds. Certain retired employees are covered under a post-retirement benefit plan, which reimbursescertain medical costs and provides life insurance coverage.
The Canadian plans are governed by the pension laws of the province in which the respective plan is registered. The U.K. planis governed by the employment laws of the U.K.
The Company's pension funding policy is to contribute amounts sufficient, at a minimum, to meet local statutory fundingrequirements. For the Company's defined benefit pension plans, local regulatory bodies either define minimum fundingrequirements or approve funding plans submitted by the Company. From time to time the Company may make additionaldiscretionary contributions taking into account actuarial assessments and other factors. The contributions that have beenmade to support ongoing plan obligations have been recorded in the respective asset or liability accounts on the consolidatedbalance sheet. Actuarial valuations for the Company's defined benefit pension plans are completed based on the regulations inplace in the jurisdictions where the plans operate.
NOTES TO THE CONSOLIDATED FINANCIAL STATEMENTS | 2015 | MAPLE LEAF FOODS INC.
54

Information about the Company's defined benefit plans as at December 31, in aggregate, is as follows:
Other post- Other post- retirement 2015 retirement 2014
benefits Pension Total benefits Pension Total Accrued benefit obligation: Balance, beginning of year $ 60,369 $1,163,748 $1,224,117 $ 57,462 $1,201,340 $1,258,802 Current service cost 112 13,688 13,800 147 13,340 13,487 Interest cost 2,191 42,988 45,179 2,447 47,517 49,964 Benefits paid from plan assets — (71,376) (71,376) — (69,165) (69,165) Benefits paid directly from the Company (3,530) (1,464) (4,994) (3,315) (1,412) (4,727) Actuarial (gains) losses - experience (603) 1,435 832 (675) 1,645 970 Actuarial (gains) losses - demographic experience — — — 1,447 20,019 21,466 Actuarial (gains) losses - financial assumptions — — — 4,354 103,012 107,366 Employee contributions — 3,522 3,522 — 3,616 3,616 Plan amendments — — — — 540 540 Special termination benefits — 1,131 1,131 — 590 590 Curtailments — (109) (109) — (1,030) (1,030) Settlements — (7,231) (7,231) — (296) (296) Transfer to assets held for sale — — — (1,498) (155,968) (157,466)Balance, end of year $ 58,539 $1,146,332 $1,204,871 $ 60,369 $1,163,748 $1,224,117 Unfunded $ 58,539 $ 28,766 $ 87,305 $ 60,369 $ 27,936 $ 88,305 Funded(i) — 1,117,566 1,117,566 — 1,135,812 1,135,812Total obligation $ 58,539 $1,146,332 $1,204,871 $ 60,369 $1,163,748 $1,224,117(i) Includes wholly and partially funded plans
Plan Assets Fair value, beginning of year $ — $1,117,224 $1,117,224 $ — $1,203,175 $1,203,175 Interest income — 40,473 40,473 — 48,057 48,057 Actuarial gains (losses)(ii) — 1,397 1,397 — 61,551 61,551 Employer contributions — 3,781 3,781 — 6,992 6,992 Employee contributions — 3,522 3,522 — 3,616 3,616 Benefits paid — (71,376) (71,376) — (69,165) (69,165) Asset transfer to Company defined contribution plan — (14,351) (14,351) — (9,580) (9,580) Administrative costs — (3,024) (3,024) — (3,550) (3,550) Settlements — (8,386) (8,386) — (351) (351) Transfer to assets held for sale — — — — (123,521) (123,521)Fair value, end of year $ — $1,069,260 $1,069,260 $ — $1,117,224 $1,117,224Other $ — $ (1,111) $ (1,111) $ — $ (1,427) $ (1,427)Accrued benefit asset (liability), end of year $ (58,539) $ (78,183) $ (136,722) $ (60,369) $ (47,951) $ (108,320)(ii) Return on plan assets greater (less) than discount rate
NOTES TO THE CONSOLIDATED FINANCIAL STATEMENTS | 2015 | MAPLE LEAF FOODS INC.
55

Amounts recognized in the consolidated balance sheet consist of:
As at December 31,2015 2014
Employee benefit assets $ 66,519 $ 88,162Employee benefit liabilities 203,241 196,482
$ (136,722) $ (108,320)
Pension benefit expense recognized in net earnings (loss) from continuing operations:
2015 2014Current service cost - defined benefit $ 13,688 $ 12,822Current service cost - defined contribution and multi-employer plans 16,038 16,781Net interest cost (benefit) 2,515 (782)Administrative costs 3,024 3,483Curtailment (gain)(i) (109) (1,030)Special termination benefits(i) 1,131 590Plan amendments(i) — 540Settlement loss(i) 1,155 —Net pension benefit expense $ 37,442 $ 32,404
(i) Included in restructuring and other related costs.
For the year ended December 31, 2015, the Company expensed salaries of $708.5 million (2014: $696.1 million fromcontinuing operations), excluding pension and other post-retirement benefits.
Amounts recognized in other comprehensive income (loss) (before income taxes) from continuing operations:
2015 2014Actuarial gains (losses) $ 539 $ (66,983)
The significant actuarial assumptions adopted in measuring the Company’s accrued benefit obligations and net benefit planexpense are as follows:
2015 2014Weighted average discount rate used to calculate the net benefit plan expense 3.75% 4.50%Weighted average discount rate used to calculate year end benefit obligation 3.75% 3.75%(i)
Rate of salary increase 3.50% 3.50%Medical cost trend rates 5.00% 5.00%
(i) 4.25% was used for the plans related to Canada Bread as at February 12, 2014.
Plan assets comprise of:
As at December 31,2015 2014
Equity securities 59% 60%Debt securities 40% 39%Other investments and cash 1% 1%
100% 100%
NOTES TO THE CONSOLIDATED FINANCIAL STATEMENTS | 2015 | MAPLE LEAF FOODS INC.
56
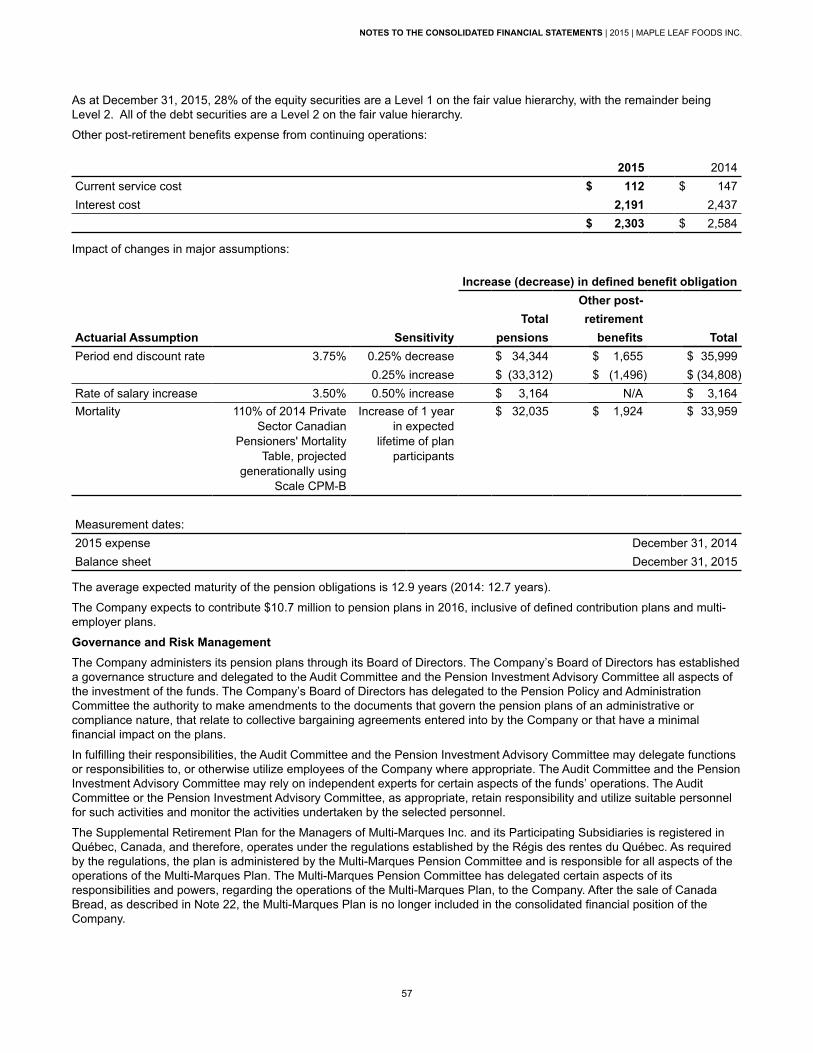
As at December 31, 2015, 28% of the equity securities are a Level 1 on the fair value hierarchy, with the remainder beingLevel 2. All of the debt securities are a Level 2 on the fair value hierarchy.
Other post-retirement benefits expense from continuing operations:
2015 2014Current service cost $ 112 $ 147Interest cost 2,191 2,437
$ 2,303 $ 2,584
Impact of changes in major assumptions:
Increase (decrease) in defined benefit obligationOther post-
Total retirementActuarial Assumption Sensitivity pensions benefits TotalPeriod end discount rate 3.75% 0.25% decrease $ 34,344 $ 1,655 $ 35,999
0.25% increase $ (33,312) $ (1,496) $ (34,808)Rate of salary increase 3.50% 0.50% increase $ 3,164 N/A $ 3,164Mortality 110% of 2014 Private
Sector CanadianPensioners' Mortality
Table, projectedgenerationally using
Scale CPM-B
Increase of 1 yearin expected
lifetime of planparticipants
$ 32,035 $ 1,924 $ 33,959
Measurement dates:2015 expense December 31, 2014Balance sheet December 31, 2015
The average expected maturity of the pension obligations is 12.9 years (2014: 12.7 years).
The Company expects to contribute $10.7 million to pension plans in 2016, inclusive of defined contribution plans and multi-employer plans.
Governance and Risk ManagementThe Company administers its pension plans through its Board of Directors. The Company’s Board of Directors has establisheda governance structure and delegated to the Audit Committee and the Pension Investment Advisory Committee all aspects ofthe investment of the funds. The Company’s Board of Directors has delegated to the Pension Policy and AdministrationCommittee the authority to make amendments to the documents that govern the pension plans of an administrative orcompliance nature, that relate to collective bargaining agreements entered into by the Company or that have a minimalfinancial impact on the plans.
In fulfilling their responsibilities, the Audit Committee and the Pension Investment Advisory Committee may delegate functionsor responsibilities to, or otherwise utilize employees of the Company where appropriate. The Audit Committee and the PensionInvestment Advisory Committee may rely on independent experts for certain aspects of the funds’ operations. The AuditCommittee or the Pension Investment Advisory Committee, as appropriate, retain responsibility and utilize suitable personnelfor such activities and monitor the activities undertaken by the selected personnel.
The Supplemental Retirement Plan for the Managers of Multi-Marques Inc. and its Participating Subsidiaries is registered inQuébec, Canada, and therefore, operates under the regulations established by the Régis des rentes du Québec. As requiredby the regulations, the plan is administered by the Multi-Marques Pension Committee and is responsible for all aspects of theoperations of the Multi-Marques Plan. The Multi-Marques Pension Committee has delegated certain aspects of itsresponsibilities and powers, regarding the operations of the Multi-Marques Plan, to the Company. After the sale of CanadaBread, as described in Note 22, the Multi-Marques Plan is no longer included in the consolidated financial position of theCompany.
NOTES TO THE CONSOLIDATED FINANCIAL STATEMENTS | 2015 | MAPLE LEAF FOODS INC.
57
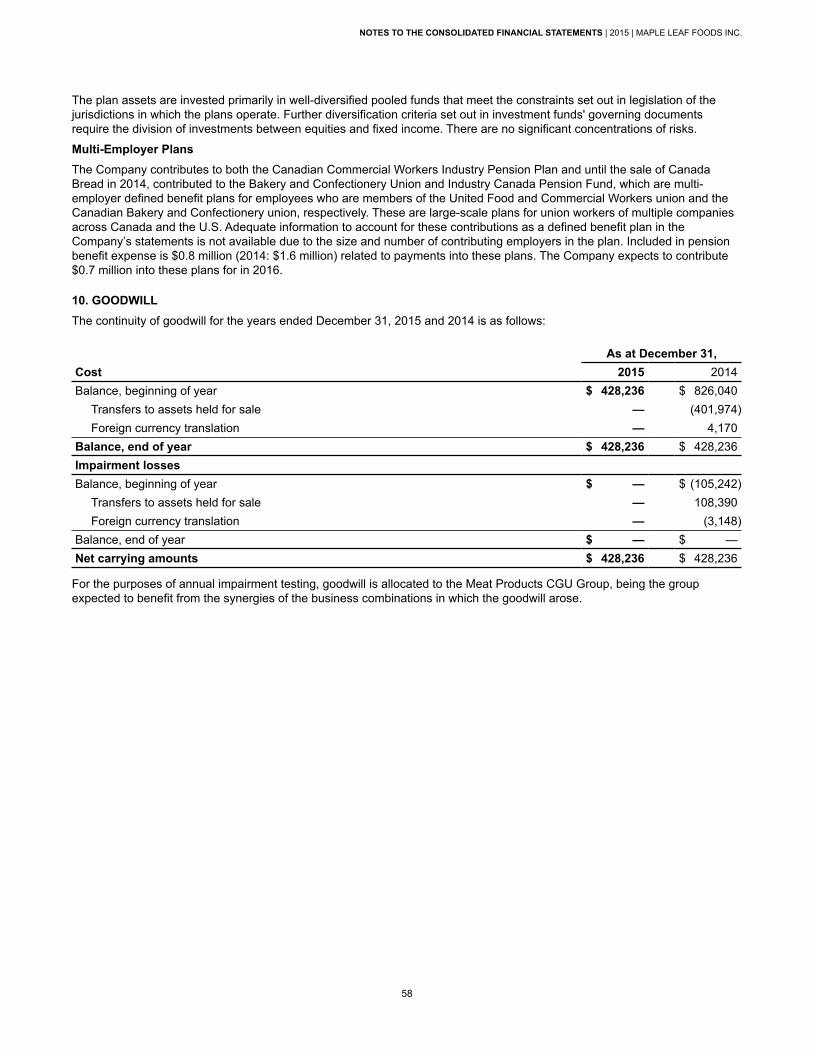
The plan assets are invested primarily in well-diversified pooled funds that meet the constraints set out in legislation of thejurisdictions in which the plans operate. Further diversification criteria set out in investment funds' governing documentsrequire the division of investments between equities and fixed income. There are no significant concentrations of risks.
Multi-Employer PlansThe Company contributes to both the Canadian Commercial Workers Industry Pension Plan and until the sale of CanadaBread in 2014, contributed to the Bakery and Confectionery Union and Industry Canada Pension Fund, which are multi-employer defined benefit plans for employees who are members of the United Food and Commercial Workers union and theCanadian Bakery and Confectionery union, respectively. These are large-scale plans for union workers of multiple companiesacross Canada and the U.S. Adequate information to account for these contributions as a defined benefit plan in theCompany’s statements is not available due to the size and number of contributing employers in the plan. Included in pensionbenefit expense is $0.8 million (2014: $1.6 million) related to payments into these plans. The Company expects to contribute$0.7 million into these plans for in 2016.
10. GOODWILL The continuity of goodwill for the years ended December 31, 2015 and 2014 is as follows:
As at December 31,Cost 2015 2014Balance, beginning of year $ 428,236 $ 826,040
Transfers to assets held for sale — (401,974)Foreign currency translation — 4,170
Balance, end of year $ 428,236 $ 428,236Impairment lossesBalance, beginning of year $ — $ (105,242)
Transfers to assets held for sale — 108,390Foreign currency translation — (3,148)
Balance, end of year $ — $ —Net carrying amounts $ 428,236 $ 428,236
For the purposes of annual impairment testing, goodwill is allocated to the Meat Products CGU Group, being the groupexpected to benefit from the synergies of the business combinations in which the goodwill arose.
NOTES TO THE CONSOLIDATED FINANCIAL STATEMENTS | 2015 | MAPLE LEAF FOODS INC.
58
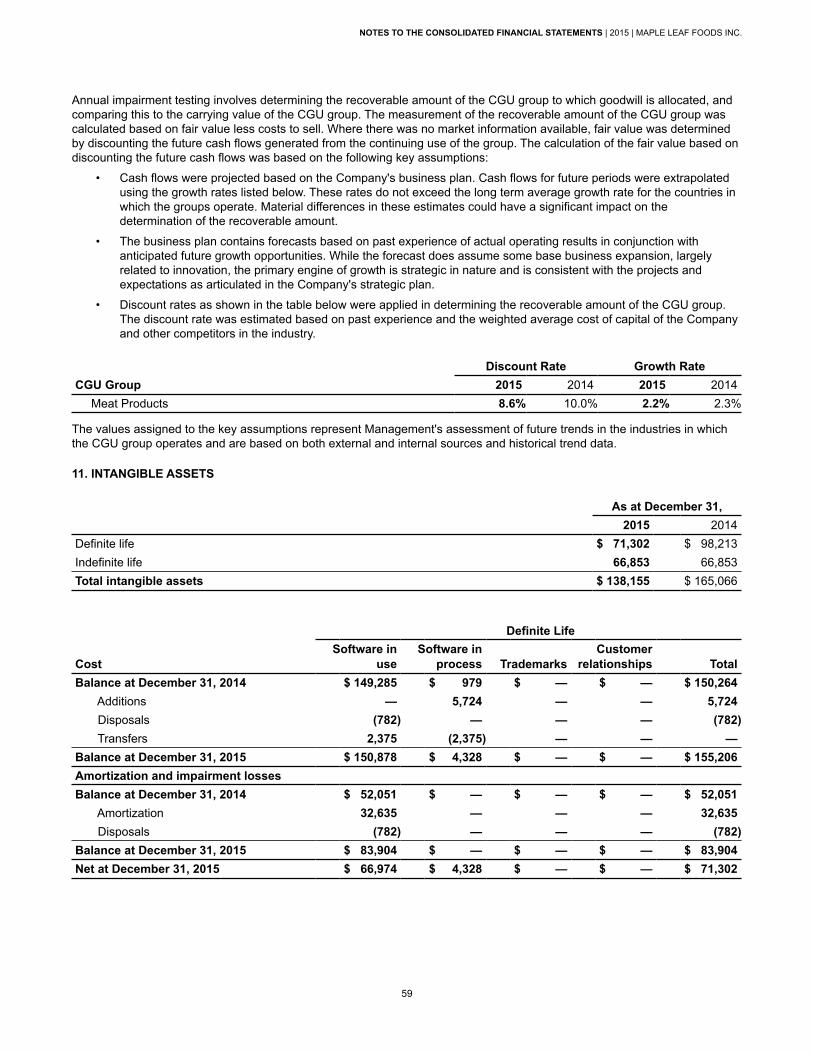
Annual impairment testing involves determining the recoverable amount of the CGU group to which goodwill is allocated, andcomparing this to the carrying value of the CGU group. The measurement of the recoverable amount of the CGU group wascalculated based on fair value less costs to sell. Where there was no market information available, fair value was determinedby discounting the future cash flows generated from the continuing use of the group. The calculation of the fair value based ondiscounting the future cash flows was based on the following key assumptions:
• Cash flows were projected based on the Company's business plan. Cash flows for future periods were extrapolatedusing the growth rates listed below. These rates do not exceed the long term average growth rate for the countries inwhich the groups operate. Material differences in these estimates could have a significant impact on thedetermination of the recoverable amount.
• The business plan contains forecasts based on past experience of actual operating results in conjunction withanticipated future growth opportunities. While the forecast does assume some base business expansion, largelyrelated to innovation, the primary engine of growth is strategic in nature and is consistent with the projects andexpectations as articulated in the Company's strategic plan.
• Discount rates as shown in the table below were applied in determining the recoverable amount of the CGU group.The discount rate was estimated based on past experience and the weighted average cost of capital of the Companyand other competitors in the industry.
Discount Rate Growth RateCGU Group 2015 2014 2015 2014
Meat Products 8.6% 10.0% 2.2% 2.3%
The values assigned to the key assumptions represent Management's assessment of future trends in the industries in whichthe CGU group operates and are based on both external and internal sources and historical trend data.
11. INTANGIBLE ASSETS
As at December 31,2015 2014
Definite life $ 71,302 $ 98,213Indefinite life 66,853 66,853Total intangible assets $ 138,155 $ 165,066
Definite Life
CostSoftware in
useSoftware in
process TrademarksCustomer
relationships TotalBalance at December 31, 2014 $ 149,285 $ 979 $ — $ — $ 150,264
Additions — 5,724 — — 5,724 Disposals (782) — — — (782) Transfers 2,375 (2,375) — — —
Balance at December 31, 2015 $ 150,878 $ 4,328 $ — $ — $ 155,206Amortization and impairment lossesBalance at December 31, 2014 $ 52,051 $ — $ — $ — $ 52,051
Amortization 32,635 — — — 32,635 Disposals (782) — — — (782)
Balance at December 31, 2015 $ 83,904 $ — $ — $ — $ 83,904Net at December 31, 2015 $ 66,974 $ 4,328 $ — $ — $ 71,302
NOTES TO THE CONSOLIDATED FINANCIAL STATEMENTS | 2015 | MAPLE LEAF FOODS INC.
59
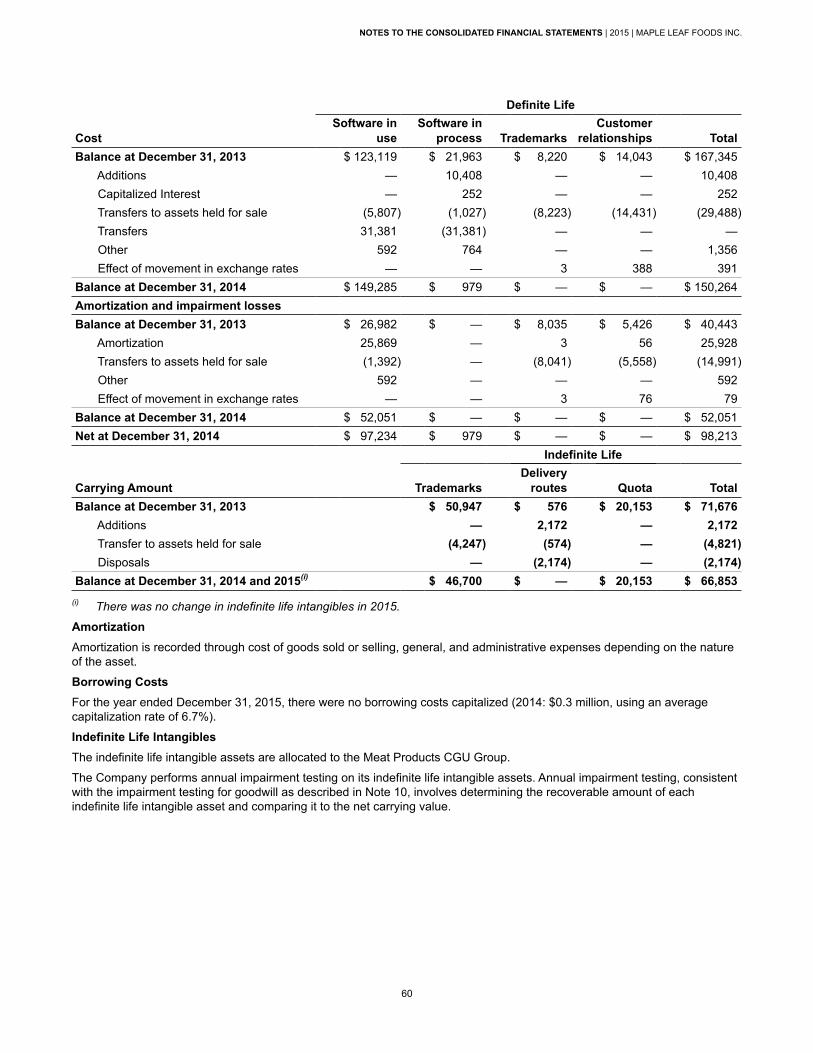
Definite Life
CostSoftware in
useSoftware in
process TrademarksCustomer
relationships TotalBalance at December 31, 2013 $ 123,119 $ 21,963 $ 8,220 $ 14,043 $ 167,345
Additions — 10,408 — — 10,408 Capitalized Interest — 252 — — 252 Transfers to assets held for sale (5,807) (1,027) (8,223) (14,431) (29,488) Transfers 31,381 (31,381) — — — Other 592 764 — — 1,356 Effect of movement in exchange rates — — 3 388 391
Balance at December 31, 2014 $ 149,285 $ 979 $ — $ — $ 150,264Amortization and impairment lossesBalance at December 31, 2013 $ 26,982 $ — $ 8,035 $ 5,426 $ 40,443
Amortization 25,869 — 3 56 25,928 Transfers to assets held for sale (1,392) — (8,041) (5,558) (14,991) Other 592 — — — 592 Effect of movement in exchange rates — — 3 76 79
Balance at December 31, 2014 $ 52,051 $ — $ — $ — $ 52,051Net at December 31, 2014 $ 97,234 $ 979 $ — $ — $ 98,213
Indefinite Life
Carrying Amount TrademarksDelivery
routes Quota TotalBalance at December 31, 2013 $ 50,947 $ 576 $ 20,153 $ 71,676
Additions — 2,172 — 2,172 Transfer to assets held for sale (4,247) (574) — (4,821) Disposals — (2,174) — (2,174)
Balance at December 31, 2014 and 2015(i) $ 46,700 $ — $ 20,153 $ 66,853(i) There was no change in indefinite life intangibles in 2015.
AmortizationAmortization is recorded through cost of goods sold or selling, general, and administrative expenses depending on the natureof the asset.
Borrowing CostsFor the year ended December 31, 2015, there were no borrowing costs capitalized (2014: $0.3 million, using an averagecapitalization rate of 6.7%).
Indefinite Life Intangibles The indefinite life intangible assets are allocated to the Meat Products CGU Group.
The Company performs annual impairment testing on its indefinite life intangible assets. Annual impairment testing, consistentwith the impairment testing for goodwill as described in Note 10, involves determining the recoverable amount of eachindefinite life intangible asset and comparing it to the net carrying value.
NOTES TO THE CONSOLIDATED FINANCIAL STATEMENTS | 2015 | MAPLE LEAF FOODS INC.
60
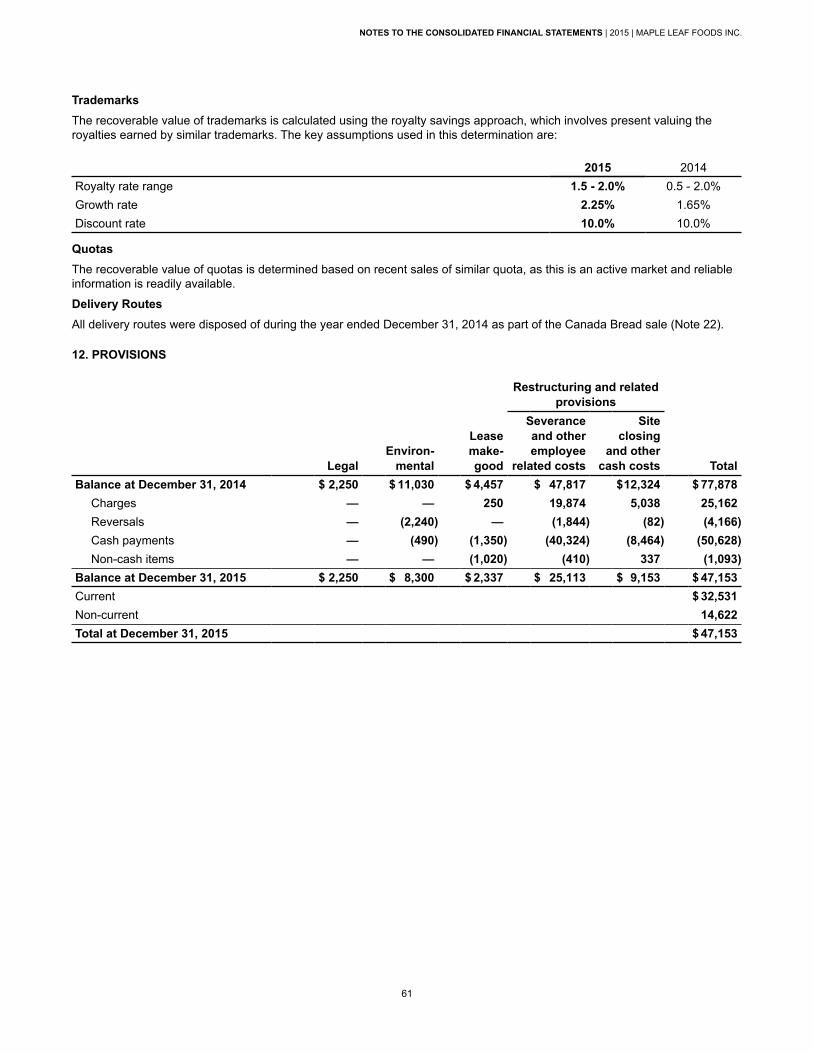
TrademarksThe recoverable value of trademarks is calculated using the royalty savings approach, which involves present valuing theroyalties earned by similar trademarks. The key assumptions used in this determination are:
2015 2014Royalty rate range 1.5 - 2.0% 0.5 - 2.0%Growth rate 2.25% 1.65%Discount rate 10.0% 10.0%
QuotasThe recoverable value of quotas is determined based on recent sales of similar quota, as this is an active market and reliableinformation is readily available.
Delivery RoutesAll delivery routes were disposed of during the year ended December 31, 2014 as part of the Canada Bread sale (Note 22).
12. PROVISIONS
Restructuring and relatedprovisions
LegalEnviron-
mental
Leasemake-good
Severanceand otheremployee
related costs
Siteclosing
and othercash costs Total
Balance at December 31, 2014 $ 2,250 $ 11,030 $ 4,457 $ 47,817 $12,324 $ 77,878Charges — — 250 19,874 5,038 25,162Reversals — (2,240) — (1,844) (82) (4,166)Cash payments — (490) (1,350) (40,324) (8,464) (50,628)Non-cash items — — (1,020) (410) 337 (1,093)
Balance at December 31, 2015 $ 2,250 $ 8,300 $ 2,337 $ 25,113 $ 9,153 $ 47,153Current $ 32,531Non-current 14,622Total at December 31, 2015 $ 47,153
NOTES TO THE CONSOLIDATED FINANCIAL STATEMENTS | 2015 | MAPLE LEAF FOODS INC.
61
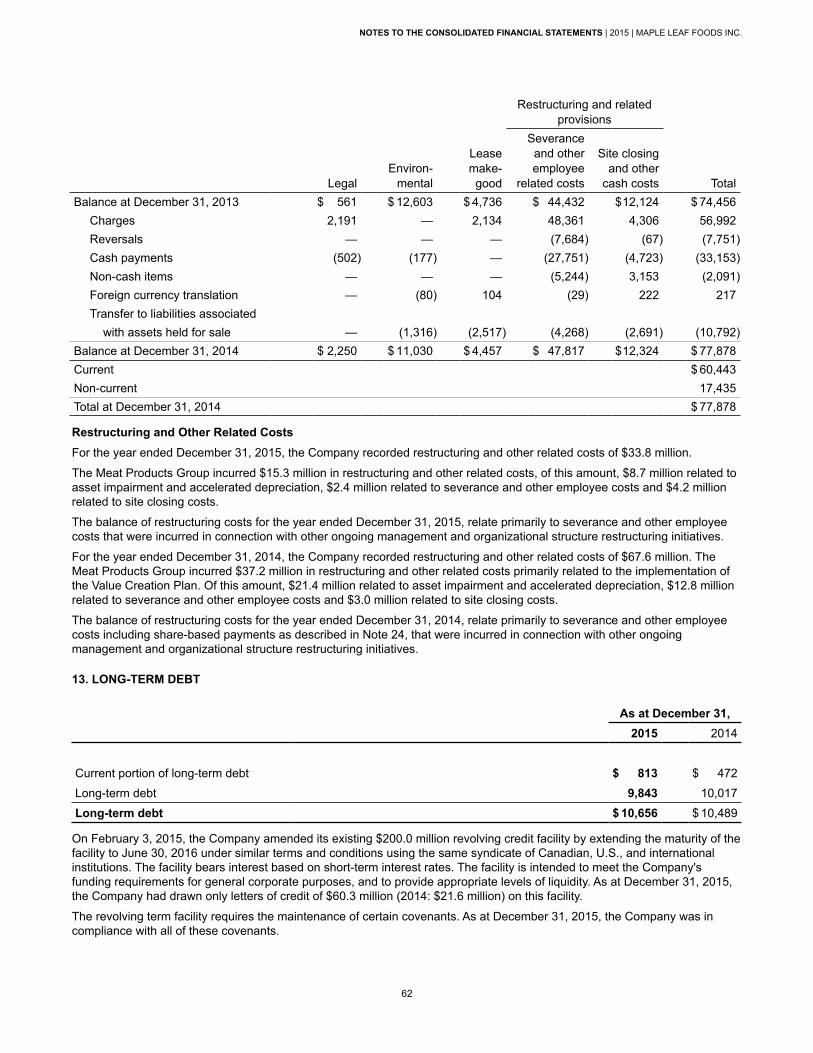
Restructuring and relatedprovisions
LegalEnviron-
mental
Lease make- good
Severanceand otheremployee
related costs
Site closingand other
cash costs TotalBalance at December 31, 2013 $ 561 $ 12,603 $ 4,736 $ 44,432 $12,124 $ 74,456
Charges 2,191 — 2,134 48,361 4,306 56,992Reversals — — — (7,684) (67) (7,751)Cash payments (502) (177) — (27,751) (4,723) (33,153)Non-cash items — — — (5,244) 3,153 (2,091)Foreign currency translation — (80) 104 (29) 222 217Transfer to liabilities associated with assets held for sale — (1,316) (2,517) (4,268) (2,691) (10,792)
Balance at December 31, 2014 $ 2,250 $ 11,030 $ 4,457 $ 47,817 $12,324 $ 77,878Current $ 60,443Non-current 17,435Total at December 31, 2014 $ 77,878
Restructuring and Other Related Costs For the year ended December 31, 2015, the Company recorded restructuring and other related costs of $33.8 million.
The Meat Products Group incurred $15.3 million in restructuring and other related costs, of this amount, $8.7 million related toasset impairment and accelerated depreciation, $2.4 million related to severance and other employee costs and $4.2 millionrelated to site closing costs.
The balance of restructuring costs for the year ended December 31, 2015, relate primarily to severance and other employeecosts that were incurred in connection with other ongoing management and organizational structure restructuring initiatives.
For the year ended December 31, 2014, the Company recorded restructuring and other related costs of $67.6 million. TheMeat Products Group incurred $37.2 million in restructuring and other related costs primarily related to the implementation ofthe Value Creation Plan. Of this amount, $21.4 million related to asset impairment and accelerated depreciation, $12.8 millionrelated to severance and other employee costs and $3.0 million related to site closing costs.
The balance of restructuring costs for the year ended December 31, 2014, relate primarily to severance and other employeecosts including share-based payments as described in Note 24, that were incurred in connection with other ongoingmanagement and organizational structure restructuring initiatives.
13. LONG-TERM DEBT
As at December 31,2015 2014
Current portion of long-term debt $ 813 $ 472
Long-term debt 9,843 10,017
Long-term debt $ 10,656 $ 10,489
On February 3, 2015, the Company amended its existing $200.0 million revolving credit facility by extending the maturity of thefacility to June 30, 2016 under similar terms and conditions using the same syndicate of Canadian, U.S., and internationalinstitutions. The facility bears interest based on short-term interest rates. The facility is intended to meet the Company'sfunding requirements for general corporate purposes, and to provide appropriate levels of liquidity. As at December 31, 2015,the Company had drawn only letters of credit of $60.3 million (2014: $21.6 million) on this facility.
The revolving term facility requires the maintenance of certain covenants. As at December 31, 2015, the Company was incompliance with all of these covenants.
NOTES TO THE CONSOLIDATED FINANCIAL STATEMENTS | 2015 | MAPLE LEAF FOODS INC.
62

On August 6, 2014, the Company entered into an uncommitted credit facility for issuing up to a maximum of $120.0 millionletters of credit. As at December 31, 2015, $79.4 million of letters of credit had been issued thereon (2014: $82.3 million).These letters of credit have been collateralized with cash, as further described in Note 4 of the consolidated financialstatements.
The Company has various government loans on specific projects, with interest rates ranging from non-interest bearing to 2.9%per annum. These facilities are repayable over various terms from 2022 to 2025. As at December 31, 2015, $10.7 million(2014: $10.5 million) was outstanding. All of these facilities are committed.
The Company’s estimated average effective cost of borrowing for 2015 was approximately 4.5%, which excludes any impact ofinterest rate hedges (2014: 7.0% after taking into account the impact of interest rate hedges). Required repayments of long-term debt are as follows:
2016 $ 1,1232017 1,0402018 1,0402019 1,0402020 1,040Thereafter 7,055Total long-term debt $ 12,338
In 2014, the Company repaid notes payable for an amount of US$360.5 million (CDN$395.5 million) and CDN$400.0 million,comprising US$318.0 million (CDN$348.8 million) and CDN$354.5 million of principal, US$36.7 million (CDN$38.7 million) andCDN$37.6 million of early repayment premium, and US$5.8 million (CDN$6.4 million) and CDN$7.9 million of accrued interest.
The notes were issued in various tranches in both U.S. and Canadian dollar-denominations, with maturity dates from 2014 to2021 and bearing interest at fixed coupon rates between 4.9% and 6.2%.
In 2014, the Company amended its existing revolving credit facility to include additional shorter-term financing with a non-revolving component. Upon the closing of the sale of Canada Bread on May 23, 2014, the non-revolving component of thefacility expired and the revolving component was reduced to $200.0 million expiring on March 31, 2015 (Note 20). The facilitywas subsequently amended and extended to June 30, 2016 as described above.
14. OTHER CURRENT LIABILITIES
As at December 31,Notes 2015 2014
Derivative instruments 18 $ 13,662 $ 13,932Liability for share-based compensation 24 — 6,469Obligation for repurchase of shares 17 12,574 —Other 3,401 3,982
$ 29,637 $ 24,383
15. OTHER LONG-TERM LIABILITIES
As at December 31,Note 2015 2014
Derivative instruments 18 $ 6,480 $ 7,748Step rent and lease inducements 9,545 8,521Other 4,876 4,630
$ 20,901 $ 20,899
NOTES TO THE CONSOLIDATED FINANCIAL STATEMENTS | 2015 | MAPLE LEAF FOODS INC.
63
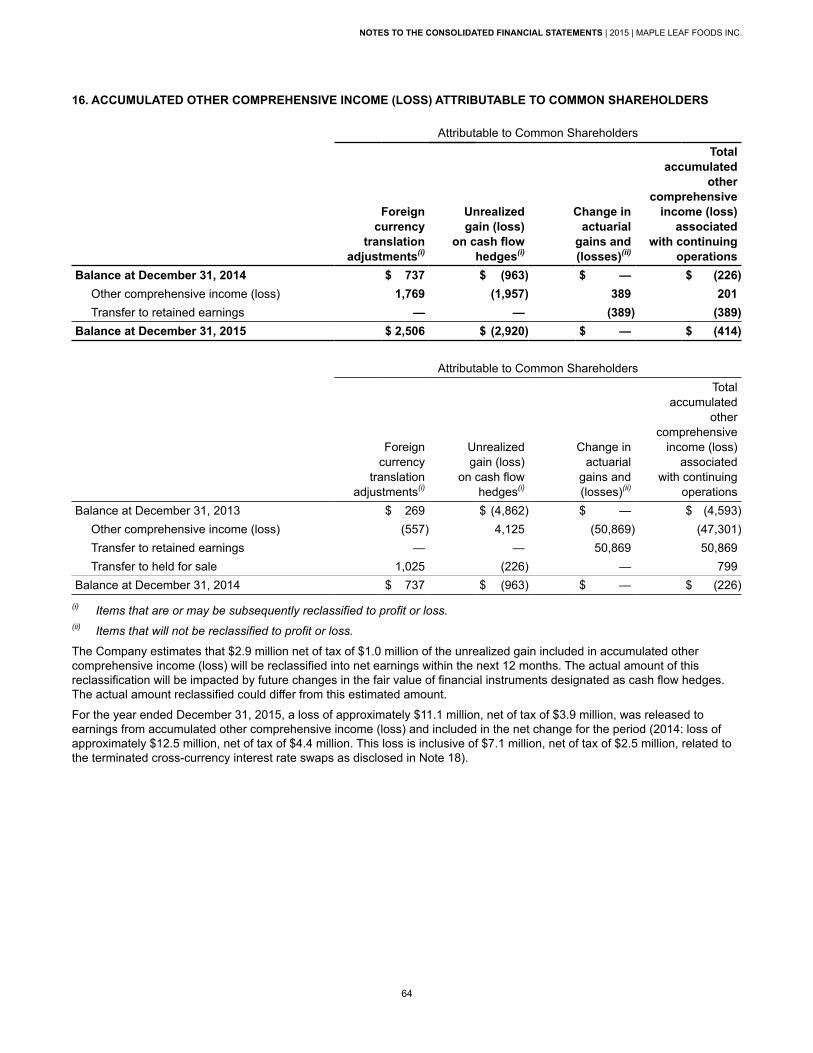
16. ACCUMULATED OTHER COMPREHENSIVE INCOME (LOSS) ATTRIBUTABLE TO COMMON SHAREHOLDERS
Attributable to Common Shareholders
Foreign currency
translation adjustments(i)
Unrealized gain (loss)
on cash flow hedges(i)
Change inactuarial
gains and (losses)(ii)
Total accumulated
other comprehensive
income (loss) associated
with continuing operations
Balance at December 31, 2014 $ 737 $ (963) $ — $ (226)Other comprehensive income (loss) 1,769 (1,957) 389 201Transfer to retained earnings — — (389) (389)
Balance at December 31, 2015 $ 2,506 $ (2,920) $ — $ (414)
Attributable to Common Shareholders
Foreign currency
translation adjustments(i)
Unrealized gain (loss)
on cash flow hedges(i)
Change in actuarial
gains and (losses)(ii)
Total accumulated
other comprehensive
income (loss) associated
with continuing operations
Balance at December 31, 2013 $ 269 $ (4,862) $ — $ (4,593)Other comprehensive income (loss) (557) 4,125 (50,869) (47,301)Transfer to retained earnings — — 50,869 50,869Transfer to held for sale 1,025 (226) — 799
Balance at December 31, 2014 $ 737 $ (963) $ — $ (226)(i) Items that are or may be subsequently reclassified to profit or loss. (ii) Items that will not be reclassified to profit or loss.
The Company estimates that $2.9 million net of tax of $1.0 million of the unrealized gain included in accumulated othercomprehensive income (loss) will be reclassified into net earnings within the next 12 months. The actual amount of thisreclassification will be impacted by future changes in the fair value of financial instruments designated as cash flow hedges.The actual amount reclassified could differ from this estimated amount.
For the year ended December 31, 2015, a loss of approximately $11.1 million, net of tax of $3.9 million, was released toearnings from accumulated other comprehensive income (loss) and included in the net change for the period (2014: loss ofapproximately $12.5 million, net of tax of $4.4 million. This loss is inclusive of $7.1 million, net of tax of $2.5 million, related tothe terminated cross-currency interest rate swaps as disclosed in Note 18).
NOTES TO THE CONSOLIDATED FINANCIAL STATEMENTS | 2015 | MAPLE LEAF FOODS INC.
64

17. SHARE CAPITAL Share Capital
Common Shares Treasury Stock(thousands of shares) 2015 2014 2015 2014Balance, beginning of year 142,943 140,142 12 114
Distributions under share-based compensation plans 148 642 (148) (642)Exercise of share options 262 2,699 — —Shares repurchased (8,137) — — —Purchase of treasury stock (229) (540) 229 540
Balance, end of year 134,987 142,943 93 12
Common SharesThe authorized share capital consists of an unlimited number of common shares, an unlimited number of non-voting commonshares, and an unlimited number of preference shares. These shares have no par value.
The holders of common shares are entitled to receive dividends as declared from time to time, and are entitled to one vote pershare at meetings of the Company.
On May 1, 2014, shareholders of the Company reconfirmed the Shareholder Rights Plan (the "Rights Plan"). While the RightsPlan was entered into on December 5, 2011, it required reconfirmation by shareholders of the Company at the May 2014annual meeting in order to remain in effect. The Rights Plan will expire if it is not reconfirmed by shareholders at the 2017annual meeting, unless it is otherwise terminated pursuant to its terms before that time.
Treasury StockTreasury stock is comprised of shares purchased by a trust in order to satisfy the requirements of the Company's ShareIncentive Plan, as described in Note 24.
Share RepurchaseOn March 23, 2015 the Toronto Stock Exchange ("TSX") accepted the Company's notice of intention to commence a newNormal Course Issuer Bid ("NCIB"), which allowed the Company to repurchase, at its discretion, up to approximately 8.65million common shares in the open market or as otherwise permitted by the TSX, subject to the normal terms and limitations ofsuch bids. Common shares purchased by the Company are canceled. The program commenced on March 25, 2015 and wasterminated subsequent to year end, on January 22, 2016, as the Company completed its purchase and cancellation of 8.65million common shares for $194.5 million at a weighted average price paid of $22.48 per common share.
During the year ended December 31, 2015, 8.14 million shares were purchased for cancellation for $182.5 million at a volumeweighted average price paid of $22.44 per common share.
The Company entered into an Automatic Share Purchase Plan ("ASPP") with a broker that allows the purchase of commonshares for cancellation under the NCIB at any time during predetermined trading blackout periods. During the year endedDecember 31, 2015, an obligation for the repurchase of shares of $12.6 million was recognized under the ASPP.
18. FINANCIAL INSTRUMENTS AND RISK MANAGEMENT ACTIVITIES CapitalThe Company’s objective is to maintain a cost effective capital structure that supports its long-term growth strategy andmaximizes operating flexibility. In allocating capital to investments to support its earnings goals, the Company establishesinternal hurdle return rates for capital initiatives. Capital projects are generally financed with internal cash flows and seniordebt where required.
The Company typically uses leverage in its capital structure to reduce the cost of capital. The Company’s goal is to maintain itsprimary credit ratios and leverage at levels that are designed to provide continued access to investment-grade credit pricingand terms. The Company measures its credit profile using a number of metrics, some of which are non-IFRS measures,primarily cash and cash equivalents, less long-term debt and bank indebtedness (“net cash (debt)”) to earnings before interest,income taxes, depreciation, amortization, restructuring and other related costs (“EBITDA”), and interest coverage.
The Company’s various credit facilities are subject to certain financial covenants. As at December 31, 2015, the Company wasin compliance with all of these covenants.
In addition to senior debt, credit facilities, and equity, the Company uses leases and very limited recourse accounts receivablesecuritization programs as additional sources of financing.
NOTES TO THE CONSOLIDATED FINANCIAL STATEMENTS | 2015 | MAPLE LEAF FOODS INC.
65
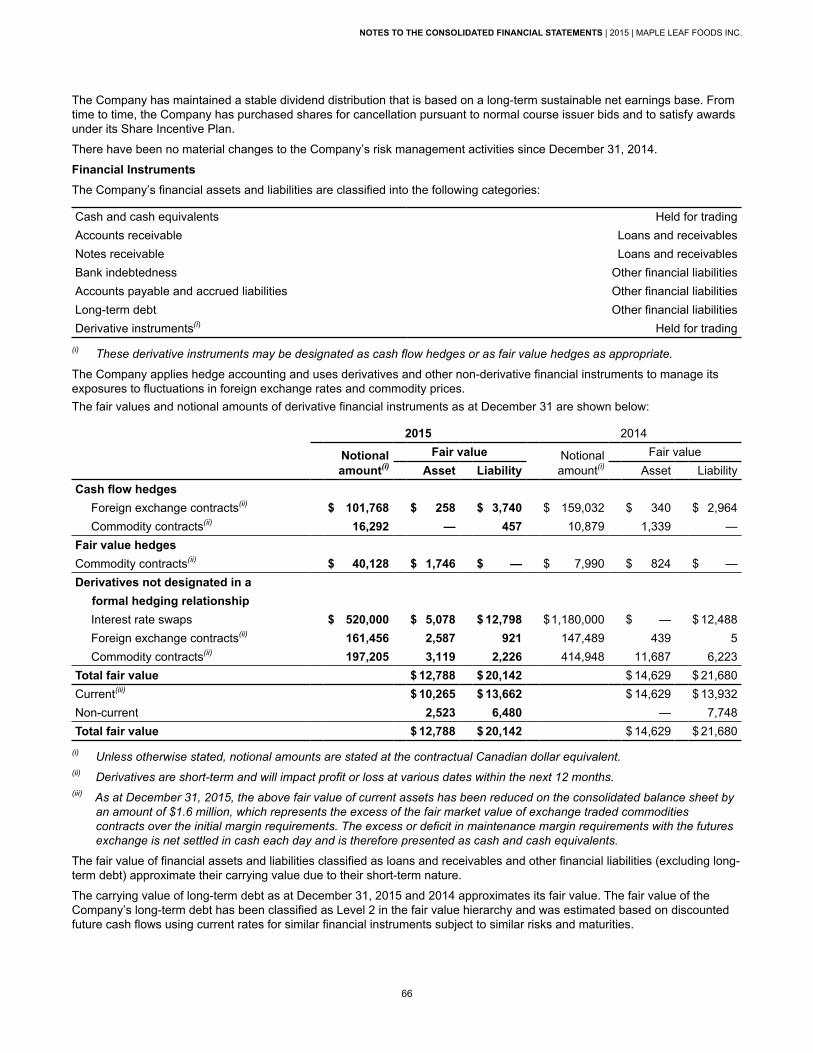
The Company has maintained a stable dividend distribution that is based on a long-term sustainable net earnings base. Fromtime to time, the Company has purchased shares for cancellation pursuant to normal course issuer bids and to satisfy awardsunder its Share Incentive Plan.
There have been no material changes to the Company’s risk management activities since December 31, 2014.
Financial Instruments The Company’s financial assets and liabilities are classified into the following categories:
Cash and cash equivalents Held for tradingAccounts receivable Loans and receivablesNotes receivable Loans and receivablesBank indebtedness Other financial liabilitiesAccounts payable and accrued liabilities Other financial liabilitiesLong-term debt Other financial liabilitiesDerivative instruments(i) Held for trading
(i) These derivative instruments may be designated as cash flow hedges or as fair value hedges as appropriate.
The Company applies hedge accounting and uses derivatives and other non-derivative financial instruments to manage itsexposures to fluctuations in foreign exchange rates and commodity prices. The fair values and notional amounts of derivative financial instruments as at December 31 are shown below:
2015 2014
Notionalamount(i)
Fair value Notionalamount(i)
Fair valueAsset Liability Asset Liability
Cash flow hedgesForeign exchange contracts(ii) $ 101,768 $ 258 $ 3,740 $ 159,032 $ 340 $ 2,964Commodity contracts(ii) 16,292 — 457 10,879 1,339 —
Fair value hedgesCommodity contracts(ii) $ 40,128 $ 1,746 $ — $ 7,990 $ 824 $ —Derivatives not designated in a formal hedging relationship
Interest rate swaps $ 520,000 $ 5,078 $ 12,798 $1,180,000 $ — $ 12,488Foreign exchange contracts(ii) 161,456 2,587 921 147,489 439 5Commodity contracts(ii) 197,205 3,119 2,226 414,948 11,687 6,223
Total fair value $ 12,788 $ 20,142 $ 14,629 $ 21,680Current(iii) $ 10,265 $ 13,662 $ 14,629 $ 13,932Non-current 2,523 6,480 — 7,748Total fair value $ 12,788 $ 20,142 $ 14,629 $ 21,680
(i) Unless otherwise stated, notional amounts are stated at the contractual Canadian dollar equivalent. (ii) Derivatives are short-term and will impact profit or loss at various dates within the next 12 months. (iii) As at December 31, 2015, the above fair value of current assets has been reduced on the consolidated balance sheet by
an amount of $1.6 million, which represents the excess of the fair market value of exchange traded commoditiescontracts over the initial margin requirements. The excess or deficit in maintenance margin requirements with the futuresexchange is net settled in cash each day and is therefore presented as cash and cash equivalents.
The fair value of financial assets and liabilities classified as loans and receivables and other financial liabilities (excluding long-term debt) approximate their carrying value due to their short-term nature.
The carrying value of long-term debt as at December 31, 2015 and 2014 approximates its fair value. The fair value of theCompany’s long-term debt has been classified as Level 2 in the fair value hierarchy and was estimated based on discountedfuture cash flows using current rates for similar financial instruments subject to similar risks and maturities.
NOTES TO THE CONSOLIDATED FINANCIAL STATEMENTS | 2015 | MAPLE LEAF FOODS INC.
66
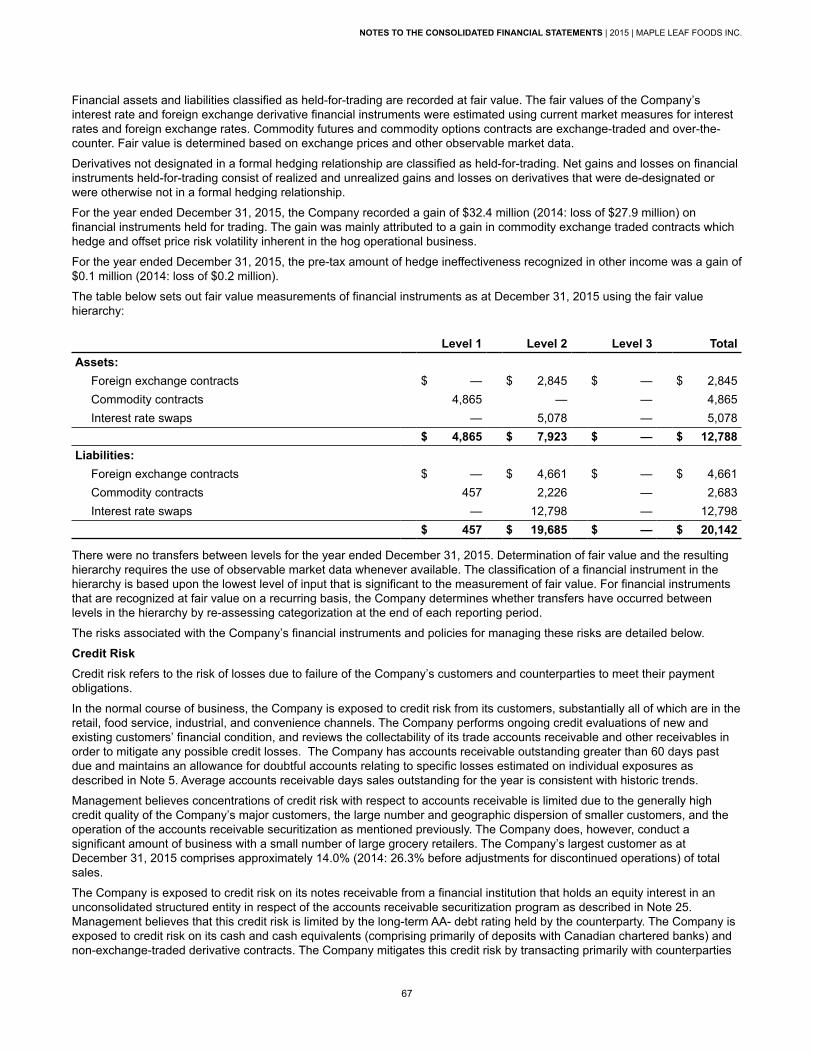
Financial assets and liabilities classified as held-for-trading are recorded at fair value. The fair values of the Company’sinterest rate and foreign exchange derivative financial instruments were estimated using current market measures for interestrates and foreign exchange rates. Commodity futures and commodity options contracts are exchange-traded and over-the-counter. Fair value is determined based on exchange prices and other observable market data.
Derivatives not designated in a formal hedging relationship are classified as held-for-trading. Net gains and losses on financialinstruments held-for-trading consist of realized and unrealized gains and losses on derivatives that were de-designated orwere otherwise not in a formal hedging relationship.
For the year ended December 31, 2015, the Company recorded a gain of $32.4 million (2014: loss of $27.9 million) onfinancial instruments held for trading. The gain was mainly attributed to a gain in commodity exchange traded contracts whichhedge and offset price risk volatility inherent in the hog operational business.
For the year ended December 31, 2015, the pre-tax amount of hedge ineffectiveness recognized in other income was a gain of$0.1 million (2014: loss of $0.2 million).
The table below sets out fair value measurements of financial instruments as at December 31, 2015 using the fair valuehierarchy:
Level 1 Level 2 Level 3 TotalAssets:
Foreign exchange contracts $ — $ 2,845 $ — $ 2,845Commodity contracts 4,865 — — 4,865Interest rate swaps — 5,078 — 5,078
$ 4,865 $ 7,923 $ — $ 12,788Liabilities:
Foreign exchange contracts $ — $ 4,661 $ — $ 4,661Commodity contracts 457 2,226 — 2,683Interest rate swaps — 12,798 — 12,798
$ 457 $ 19,685 $ — $ 20,142
There were no transfers between levels for the year ended December 31, 2015. Determination of fair value and the resultinghierarchy requires the use of observable market data whenever available. The classification of a financial instrument in thehierarchy is based upon the lowest level of input that is significant to the measurement of fair value. For financial instrumentsthat are recognized at fair value on a recurring basis, the Company determines whether transfers have occurred betweenlevels in the hierarchy by re-assessing categorization at the end of each reporting period.
The risks associated with the Company’s financial instruments and policies for managing these risks are detailed below.
Credit RiskCredit risk refers to the risk of losses due to failure of the Company’s customers and counterparties to meet their paymentobligations.
In the normal course of business, the Company is exposed to credit risk from its customers, substantially all of which are in theretail, food service, industrial, and convenience channels. The Company performs ongoing credit evaluations of new andexisting customers’ financial condition, and reviews the collectability of its trade accounts receivable and other receivables inorder to mitigate any possible credit losses. The Company has accounts receivable outstanding greater than 60 days pastdue and maintains an allowance for doubtful accounts relating to specific losses estimated on individual exposures asdescribed in Note 5. Average accounts receivable days sales outstanding for the year is consistent with historic trends.
Management believes concentrations of credit risk with respect to accounts receivable is limited due to the generally highcredit quality of the Company’s major customers, the large number and geographic dispersion of smaller customers, and theoperation of the accounts receivable securitization as mentioned previously. The Company does, however, conduct asignificant amount of business with a small number of large grocery retailers. The Company’s largest customer as atDecember 31, 2015 comprises approximately 14.0% (2014: 26.3% before adjustments for discontinued operations) of totalsales.
The Company is exposed to credit risk on its notes receivable from a financial institution that holds an equity interest in anunconsolidated structured entity in respect of the accounts receivable securitization program as described in Note 25.Management believes that this credit risk is limited by the long-term AA- debt rating held by the counterparty. The Company isexposed to credit risk on its cash and cash equivalents (comprising primarily of deposits with Canadian chartered banks) andnon-exchange-traded derivative contracts. The Company mitigates this credit risk by transacting primarily with counterparties
NOTES TO THE CONSOLIDATED FINANCIAL STATEMENTS | 2015 | MAPLE LEAF FOODS INC.
67

that are major international financial institutions with long-term debt ratings of A or higher. The Company’s maximum exposureto credit risk at the balance sheet date consisted primarily of the carrying value of non-derivative financial assets and non-exchange-traded derivatives with positive fair values.
Liquidity riskLiquidity risk is the risk that the Company will encounter difficulty in meeting obligations associated with financial liabilities.
The contractual undiscounted principal cash flows payable in respect of financial liabilities as at the balance sheet date, wereas follows:
December 31, 2015Due within 1
yearDue between1 and 2 years
Due between2 and 3 years
Due after 3years Total
Financial liabilitiesAccounts payable and accruals $ 256,473 $ — $ — $ — $ 256,473Long-term debt(i) 1,123 1,040 1,040 9,135 12,338Foreign exchange contracts 4,661 — — — 4,661Commodity futures contracts 2,683 — — — 2,683Interest rate swaps(i) 6,318 6,480 — — 12,798Other liabilities 14,301 1,196 849 2,157 18,503Total $ 285,559 $ 8,716 $ 1,889 $ 11,292 $ 307,456
(i) Does not include contractual interest payments
The Company manages liquidity risk by monitoring forecasted and actual cash flows, minimizing reliance on any single sourceof credit, maintaining sufficient undrawn committed credit facilities and managing the maturity profiles of financial assets andfinancial liabilities to minimize re-financing risk.
As at December 31, 2015, the Company had available undrawn committed credit of $139.7 million (2014: $178.4 million)under the terms of its principal banking arrangements (Note 13). These banking arrangements are subject to certaincovenants and other restrictions.
Market RiskInterest Rate Risk
Interest rate risk refers to the risk that the value of a financial instrument or cash flows associated with the instrument willfluctuate due to changes in market interest rates.
The Company’s interest rate risk arises from long-term borrowings issued at fixed rates that create fair value interest rate riskand variable rate borrowings that create cash flow interest rate risk. In addition, the Company’s cash balances are typicallyinvested in short-term interest bearing assets.
The Company manages its interest rate risk exposure by using a mix of fixed and variable rate debt and periodically usinginterest rate derivatives to achieve the desired proportion of variable to fixed-rate debt.
At December 31, 2015 and 2014, the Company had no variable rate debt, however, the Company is exposed to floatinginterest rates on its accounts receivable securitization program. As at December 31, 2015, the amount serviced pursuant tothis program was $91.5 million at a weighted average interest rate of 1.6% (2014: $76.6 million at a weighted average interestrate of 2.1%). The maximum amount available to the Company under these programs is $110.0 million (2014: $110.0 million).
As at December 31, 2015, 10.4% (2014: 12.0%) of the Company’s outstanding debt and revolving accounts receivablesecuritization program were not exposed to interest rate movements.
On March 14, 2014, the Company issued a notice of repayment of its notes payable, with a subsequent repayment on April 14,2014 (Note 13). On the original issuance of the U.S. denominated debt, and in order to hedge against the foreign exchangerisk associated with the issuance of U.S. denominated debt, the Company entered into cross-currency interest rate swaps.The cross-currency swaps converted the U.S. denominated fixed-rate notes, into fixed-rate Canadian denominated notes, andwere accounted for as cash flow hedges.
As a result of the decision to accelerate the repayment of all outstanding notes, hedge accounting on all of the cross-currencyinterest rate swaps has been discontinued. This resulted in a reclassification of $9.6 million from accumulated othercomprehensive income (loss), to interest expense and other financing costs for the year ended December 31, 2014. During
NOTES TO THE CONSOLIDATED FINANCIAL STATEMENTS | 2015 | MAPLE LEAF FOODS INC.
68
the same period, the Company terminated cross-currency interest rate swaps maturing in 2021 and the remaining cross-currency swaps matured in 2014.
As at December 31, 2015, the Company had fixed-rate debt of $10.7 million (2014: $10.5 million) with a weighted averagenotional interest rate of 4.4% (2014: 4.4%). Changes in market interest rates cause the fair value of long-term debt with fixedinterest rates to fluctuate but do not affect net earnings, as the Company’s debt is carried at amortized cost and the carryingvalue does not change as interest rates change.
Foreign Exchange Risk
Foreign exchange risk refers to the risk that the value of financial instruments or cash flows will fluctuate due to changes inforeign exchange rates.
The Company’s foreign exchange risk arises primarily from transactions in currencies other than Canadian dollars, U.S. dollar-denominated borrowings, and investments in foreign operations.
The Company uses foreign exchange forward contracts to manage foreign exchange transaction exposures. The primarycurrencies to which the Company is exposed to are the U.S. dollar and the Japanese yen. Qualifying foreign currency forwardcontracts are accounted for as cash flow hedges. As of December 31, 2015, $101.8 million (2014: $159.0 million) ofanticipated foreign currency denominated sales and purchases have been hedged with underlying foreign exchange forwardcontracts settling at various dates beginning January 2016. The aggregate net fair value of these forward contracts was a lossof $3.5 million as at December 31, 2015 (2014: loss of $2.6 million) that was recorded in accumulated other comprehensiveincome (loss) with an offsetting amount recorded in other current assets and liabilities. The Company also holds foreignexchange contracts for $161.5 million (2014: $147.5 million) related to anticipated foreign currency denominated sales andpurchases that are not held in a qualifying hedge relationship.
It is estimated that, all else constant, an adverse hypothetical 10% change in the value of the Canadian dollar against allrelevant currencies would result in a change in the fair value of the Company’s foreign exchange forward contracts of $4.2million, with a corresponding change in net earnings of $5.5 million offset by a change in other comprehensive income (loss) of$9.7 million.
Commodity Price Risk
The Company is exposed to price risk related to commodities such as live hogs, fuel costs, and purchases of certain otheragricultural commodities used as raw materials, including feed grains. The Company may use fixed price contracts withsuppliers as well as exchange-traded and over-the-counter futures and options to manage its exposure to price fluctuations.
The Company uses futures to minimize the price risk assumed under forward priced contracts with suppliers. This includesfutures contracts that are designated and accounted for as fair value hedges as well as non-designated instruments.
The Company also uses futures to minimize the price risk of anticipated or forecasted transactions which are accounted for ascash flow hedges as well as non-designated derivative instruments.
Changes in the fair value of the cash flow hedging derivatives are recorded in other comprehensive income (loss) to the extentthe hedge is effective in mitigating the exposure to the related anticipated transaction, and subsequently reclassified toearnings to offset the impact of the hedged items when they affect earnings. The aggregate fair value of these futurescontracts was a gain of $0.5 million for the year ended December 31, 2015 (2014: gain of $1.3 million) that was recorded inaccumulated other comprehensive income (loss) with an offsetting amount recorded in other current liabilities.
It is estimated that, all else constant, an adverse hypothetical 10% change in market prices of the underlying commoditieswould result in a change in the fair value of underlying outstanding derivative contracts of $7.5 million, with a change in netearnings of $7.0 million and $0.5 million in other comprehensive income (loss). These amounts exclude the offsetting impact ofthe commodity price risk inherent in the transactions being hedged.
NOTES TO THE CONSOLIDATED FINANCIAL STATEMENTS | 2015 | MAPLE LEAF FOODS INC.
69

19. OTHER INCOME (EXPENSE)
2015 2014Gain (loss) on disposal of property and equipment $ (753) $ (1,688)Gain (loss) on sale of investment properties 11,097 350Recovery from insurance claims 2,010 —Net investment property loss (3,578) (1,268)Impairment of assets(i) (1,907) (2,287)Depreciation of assets used to support divested businesses(ii) (14,482) (11,508)Interest income 3,393 3,344Provision estimate changes 2,217 (4,220)Net expense on non-designated interest rate swaps(iii) (5,034) (3,970)Change in fair value of non-designated interest rate swaps(iii) 4,768 3,783Other 370 673
$ (1,899) $ (16,791)(i) Impairments of assets
2015 2014Property and equipment $ 1,907 $ 1,522Other assets — 765Total impairments $ 1,907 $ 2,287
(ii) Depreciation of assets used to support divested businesses
Relates to assets used to provide ongoing information systems support to divested businesses during a transitional period. Asa result of divestitures during the previous year, the Company revised the estimated useful life of these assets, resulting in adepreciation charge in excess of cost recoveries. During the year ended December 31, 2015, the Company further revised theestimated useful life of these assets, resulting in a reduction in the depreciation charge recorded during the period.(iii) Non-designated Interest Rate Swaps
For the year ended December 31, 2015, the net expense on non-designated interest rate swaps is presented in other income,as this expense is no longer considered a financing cost as a result of the repayment of all of the Company’s outstanding debtin the second quarter of 2014. The change in fair value of non-designated interest rate swaps has also been reclassified toother income to appropriately group the similar charges together.
For the year ended December 31, 2014, $4.0 million of net expense on non-designated interest rate swaps, that waspreviously presented as interest expense and other financing charges, has been presented as other income. This amountrepresents the portion of the expense relating to the period after the outstanding debt was fully repaid. The portion of thechange in fair value of non-designated interest rate swaps relating to the period after the debt was paid of $3.8 million for theyear ended December 31, 2014 has also been reclassified to other income.
NOTES TO THE CONSOLIDATED FINANCIAL STATEMENTS | 2015 | MAPLE LEAF FOODS INC.
70

20. INTEREST EXPENSE AND OTHER FINANCING COSTS
2015 2014Interest expense on long-term debt $ 377 $ 13,237Interest on bankers’ acceptances and prime loans — 9,143Net interest expense on interest rate swaps — 941Net interest expense on non-designated interest rate swaps — 2,714Interest expense on securitized receivables 1,667 1,821Deferred finance charges 337 3,113Other interest charges 2,330 2,831Interest capitalized — (5,504)Other financing costs(i) — 98,578
$ 4,711 $ 126,874(i) Other financing costs for the year ended December 31, 2014, included costs associated with the repayment of all of the
Company’s outstanding senior notes including an early repayment premium of $76.3 million, write-off of deferred financingfees of $8.9 million, financing costs associated with the new credit facility of $3.8 million and a release from accumulatedother comprehensive income (loss) on the de-designation of cross-currency interest rate swaps of $9.6 million.
21. INCOME TAXES
The components of income tax expense from continuing operations were as follows:
2015 2014Current tax expense Current year $ 1,893 $ 3,536
$ 1,893 $ 3,536Deferred tax expense Origination and reversal of temporary differences $ 13,225 $ (75,494) Adjustment for prior periods (3,881) (2,598) Change in tax rates (166) —
$ 9,178 $ (78,092)Total income tax expense (recovery) $ 11,071 $ (74,556)
NOTES TO THE CONSOLIDATED FINANCIAL STATEMENTS | 2015 | MAPLE LEAF FOODS INC.
71
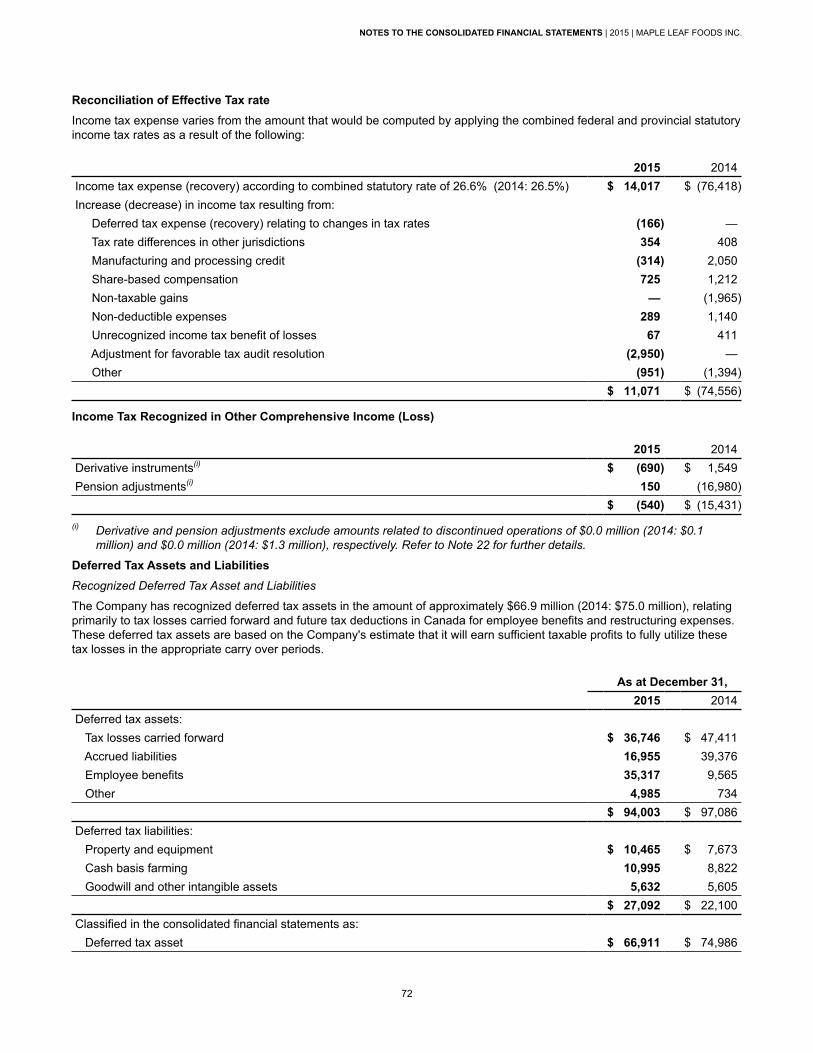
Reconciliation of Effective Tax rateIncome tax expense varies from the amount that would be computed by applying the combined federal and provincial statutoryincome tax rates as a result of the following:
2015 2014Income tax expense (recovery) according to combined statutory rate of 26.6% (2014: 26.5%) $ 14,017 $ (76,418)Increase (decrease) in income tax resulting from: Deferred tax expense (recovery) relating to changes in tax rates (166) — Tax rate differences in other jurisdictions 354 408 Manufacturing and processing credit (314) 2,050 Share-based compensation 725 1,212 Non-taxable gains — (1,965) Non-deductible expenses 289 1,140 Unrecognized income tax benefit of losses 67 411
Adjustment for favorable tax audit resolution (2,950) — Other (951) (1,394)
$ 11,071 $ (74,556)
Income Tax Recognized in Other Comprehensive Income (Loss)
2015 2014Derivative instruments(i) $ (690) $ 1,549Pension adjustments(i) 150 (16,980)
$ (540) $ (15,431)(i) Derivative and pension adjustments exclude amounts related to discontinued operations of $0.0 million (2014: $0.1
million) and $0.0 million (2014: $1.3 million), respectively. Refer to Note 22 for further details.
Deferred Tax Assets and LiabilitiesRecognized Deferred Tax Asset and Liabilities
The Company has recognized deferred tax assets in the amount of approximately $66.9 million (2014: $75.0 million), relatingprimarily to tax losses carried forward and future tax deductions in Canada for employee benefits and restructuring expenses.These deferred tax assets are based on the Company's estimate that it will earn sufficient taxable profits to fully utilize thesetax losses in the appropriate carry over periods.
As at December 31,2015 2014
Deferred tax assets: Tax losses carried forward $ 36,746 $ 47,411 Accrued liabilities 16,955 39,376 Employee benefits 35,317 9,565 Other 4,985 734
$ 94,003 $ 97,086Deferred tax liabilities: Property and equipment $ 10,465 $ 7,673 Cash basis farming 10,995 8,822 Goodwill and other intangible assets 5,632 5,605
$ 27,092 $ 22,100Classified in the consolidated financial statements as: Deferred tax asset $ 66,911 $ 74,986
NOTES TO THE CONSOLIDATED FINANCIAL STATEMENTS | 2015 | MAPLE LEAF FOODS INC.
72
Unrecognized Deferred Tax Assets
The Company has no unrecognized deferred tax assets as at December 31, 2015 and 2014.
Unrecognized Deferred Tax Liabilities
There is no unrecognized temporary difference as at December 31, 2015 and 2014.
22. DISCONTINUED OPERATIONS Canada Bread Company, Limited On May 23, 2014, Grupo Bimbo, S.A.B. de C.V. of Mexico (“Grupo Bimbo”) acquired the 90.0% of issued and outstandingshares of Canada Bread owned by the Company, by way of a statutory plan of arrangement under the Business CorporationsAct (Ontario) (the “Arrangement”). The Company received proceeds of $1,647.0 million for its 90.0% interest in Canada Bread,resulting in a pre-tax gain of $997.0 million for the year ended December 31, 2014. Upon the sale of the business, the netassets of Canada Bread have been de-recognized from assets held for sale. For the year ended December 31, 2014, theCanada Bread operations have been classified as discontinued operations on the Consolidated Statements of Net Earnings,and are presented as part of Bakery Products Group for segmented reporting.
Olivieri Fresh Pasta and Sauce Business On November 25, 2013, the Company sold substantially all the net assets of its Olivieri fresh pasta and sauce business(“Olivieri”), a component of the Bakery Products Group, to Catelli Foods Corporation. The purchase price was finalized duringMarch 2014. The final net proceeds were $115.8 million, including a pre-tax adjustment in 2014 of $1.9 million and the finalgain on sale was $77.6 million. The adjustment to the gain on disposal and its related tax impact is recognized as part of theresults of discontinued operations for the year ended December 31, 2014.
Rothsay By-product Recycling Business On October 28, 2013 the Company sold substantially all of the net assets of its Rothsay animal by-product recyclingoperations (“Rothsay”), a component of the Agribusiness Group, to Darling International Inc. for net proceeds of $628.5 million,resulting in pre-tax gain of $526.5 million recognized for the year ended December 31, 2013. For the year endedDecember 31, 2014, the Company recorded an adjustment to the gain on disposal of $5.1 million relating to additionaltransaction costs incurred associated with the sale.
NOTES TO THE CONSOLIDATED FINANCIAL STATEMENTS | 2015 | MAPLE LEAF FOODS INC.
73

Following is a summary of earnings from discontinued operations:
2014
Year ended December 31, NoteCanada
Bread Olivieri Rothsay TotalSales $ 567,861 $ — $ — $ 567,861Cost of goods sold 439,710 — — 439,710Gross margin $ 128,151 $ — $ — $ 128,151Selling, general, and administrative expenses 80,322 — — 80,322Operating Earnings before the following: $ 47,829 $ — $ — $ 47,829Restructuring and other related costs (2,612) — — (2,612)Gain on disposal of discontinued operations(i)(ii) 996,994 — — 996,994Adjustment of prior gain on disposal of discontinued operations(iii) — (1,866) (5,135) (7,001)Other income (expense) (1,582) — — (1,582)Earnings (loss) before interest and income taxes from discontinued operations $1,040,629 $ (1,866) $ (5,135) $1,033,628Interest expense and other financing costs 786 — — 786Earnings (loss) before income taxes from discontinued operations $1,039,843 $ (1,866) $ (5,135) $1,032,842Income taxes 108,505 (140) (1,242) 107,123Net earnings (loss) from discontinued operations $ 931,338 $ (1,726) $ (3,893) $ 925,719Attributed to:Common shareholders $ 929,326 $ (1,689) $ (3,893) $ 923,744Non-controlling interest 2,012 (37) — 1,975
$ 931,338 $ (1,726) $ (3,893) $ 925,719Earnings per share from discontinued operations attributable to common shareholders: 23Basic and diluted earnings per share from discontinued operations $ 6.54Weighted average number of shares (millions) 141.2
(i) Included in the gain on disposal of discontinued operations is $8.5 million of share-based compensation expenses for theyear ended December 31, 2014.
(ii) Gain, net of tax, attributable to common shareholders $894.5 million for the year ended December 31, 2014.(iii) Adjustment of prior gain on disposal of discontinued operations includes $2.5 million of share-based compensation
granted for the year ended December 31, 2014.
In order to accurately represent the continuing and discontinuing operations sales and cost of goods sold, certainintercompany eliminations have been reversed in the amounts presented above and in the statement of net earnings for allperiods presented.
NOTES TO THE CONSOLIDATED FINANCIAL STATEMENTS | 2015 | MAPLE LEAF FOODS INC.
74

2014
Twelve months ended December 31,Canada
Bread Olivieri Total(i)
Operating cash flows $ (41,059) $ 160 $ (40,899)Financing cash flows(ii) (246,583) — (246,583)Investing cash flows 1,584,833 (468) 1,584,365Net cash flows $1,297,191 $ (308) $1,296,883
(i) The Rothsay operation was sold during the year ended December 31, 2013, and had no cash flows for the year endedDecember 31, 2014.
(ii) Includes intercompany dividends that are eliminated on consolidation.
23. EARNINGS (LOSS) PER SHARE Basic earnings (loss) per share amounts are calculated by dividing the net earnings (loss) attributable to commonshareholders of the Company by the weighted average number of shares outstanding during the year.
Diluted earnings (loss) per share amounts are calculated by dividing the net earnings (loss) attributable to commonshareholders of the Company by the weighted average number of shares outstanding during the year, adjusted for the effectsof potentially dilutive stock options.
The following table sets forth the calculation of basic and diluted earnings (loss) per share (“EPS”):
Attributable to Common Shareholders2015 2014
Years ended December 31,
Netearnings
(loss)
Weighted average
number of shares(ii) EPS
Netearnings
(loss)
Weighted average
number of shares(ii) EPS
BasicContinuing operations $ 41,580 140.2 $ 0.30 $ (213,813) 141.2 $ (1.51)Gain on sale of business, net of tax — 140.2 — 894,528 141.2 6.33Discontinued operations before gain on sale of business — 140.2 — 29,216 141.2 0.21
$ 41,580 140.2 $ 0.30 $ 709,931 141.2 $ 5.03Stock options(i) 1.5 —Diluted
Continuing operations $ 41,580 141.7 $ 0.29 $ (213,813) 141.2 $ (1.51)Gain on sale of business — 141.7 — 894,528 141.2 6.33Discontinued operations before gain on sale of business — 141.7 — 29,216 141.2 0.21
$ 41,580 141.7 $ 0.29 $ 709,931 141.2 $ 5.03(i) Excludes the effect of approximately 4.0 million options to purchase common shares and performance share units (2014:
4.8 million) that are anti-dilutive. (ii) In millions.
24. SHARE-BASED PAYMENTUnder the Maple Leaf Foods Share Incentive Plan in effect as at December 31, 2015, the Company may grant options to itsemployees and employees of its subsidiaries to purchase shares of common stock and may grant Restricted Share Units(“RSUs”) and Performance Share Units (“PSUs”) entitling employees to receive common shares or cash at the Company’soption. Options, RSUs, and PSUs are granted from time to time by the Board of Directors on the recommendation of theHuman Resources Compensation Committee. The vesting conditions are specified by the Board of Directors and may include
NOTES TO THE CONSOLIDATED FINANCIAL STATEMENTS | 2015 | MAPLE LEAF FOODS INC.
75
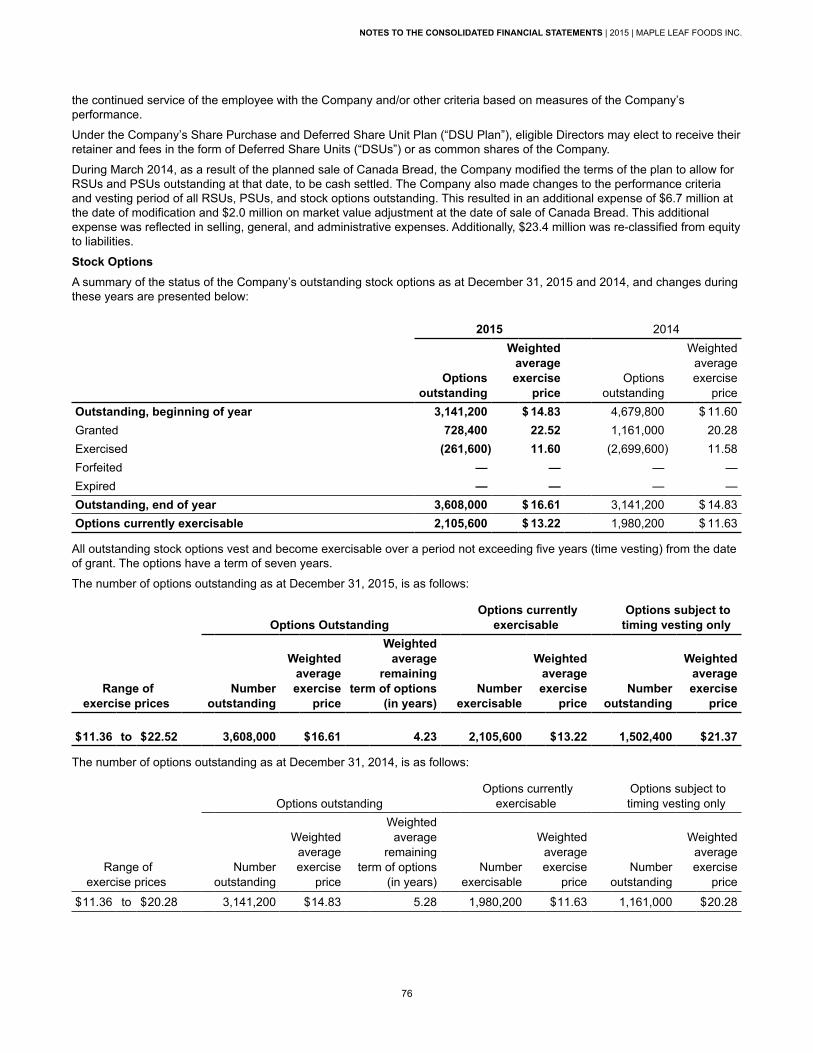
the continued service of the employee with the Company and/or other criteria based on measures of the Company’sperformance.
Under the Company’s Share Purchase and Deferred Share Unit Plan (“DSU Plan”), eligible Directors may elect to receive theirretainer and fees in the form of Deferred Share Units (“DSUs”) or as common shares of the Company.
During March 2014, as a result of the planned sale of Canada Bread, the Company modified the terms of the plan to allow forRSUs and PSUs outstanding at that date, to be cash settled. The Company also made changes to the performance criteriaand vesting period of all RSUs, PSUs, and stock options outstanding. This resulted in an additional expense of $6.7 million atthe date of modification and $2.0 million on market value adjustment at the date of sale of Canada Bread. This additionalexpense was reflected in selling, general, and administrative expenses. Additionally, $23.4 million was re-classified from equityto liabilities.
Stock Options A summary of the status of the Company’s outstanding stock options as at December 31, 2015 and 2014, and changes duringthese years are presented below:
2015 2014
Options outstanding
Weighted average exercise
priceOptions
outstanding
Weighted average exercise
priceOutstanding, beginning of year 3,141,200 $ 14.83 4,679,800 $ 11.60Granted 728,400 22.52 1,161,000 20.28Exercised (261,600) 11.60 (2,699,600) 11.58Forfeited — — — —Expired — — — —Outstanding, end of year 3,608,000 $ 16.61 3,141,200 $ 14.83Options currently exercisable 2,105,600 $ 13.22 1,980,200 $ 11.63
All outstanding stock options vest and become exercisable over a period not exceeding five years (time vesting) from the dateof grant. The options have a term of seven years.
The number of options outstanding as at December 31, 2015, is as follows:
Options Outstanding Options currently
exercisable Options subject totiming vesting only
Range ofexercise prices
Numberoutstanding
Weightedaverageexercise
price
Weightedaverage
remainingterm of options
(in years) Number
exercisable
Weightedaverageexercise
price Number
outstanding
Weightedaverageexercise
price
$11.36 to $22.52 3,608,000 $16.61 4.23 2,105,600 $13.22 1,502,400 $21.37
The number of options outstanding as at December 31, 2014, is as follows:
Options outstanding Options currently
exercisable Options subject totiming vesting only
Range of exercise prices
Numberoutstanding
Weightedaverageexercise
price
Weightedaverage
remainingterm of options
(in years) Number
exercisable
Weightedaverageexercise
price Number
outstanding
Weightedaverageexercise
price
$11.36 to $20.28 3,141,200 $14.83 5.28 1,980,200 $11.63 1,161,000 $20.28
NOTES TO THE CONSOLIDATED FINANCIAL STATEMENTS | 2015 | MAPLE LEAF FOODS INC.
76
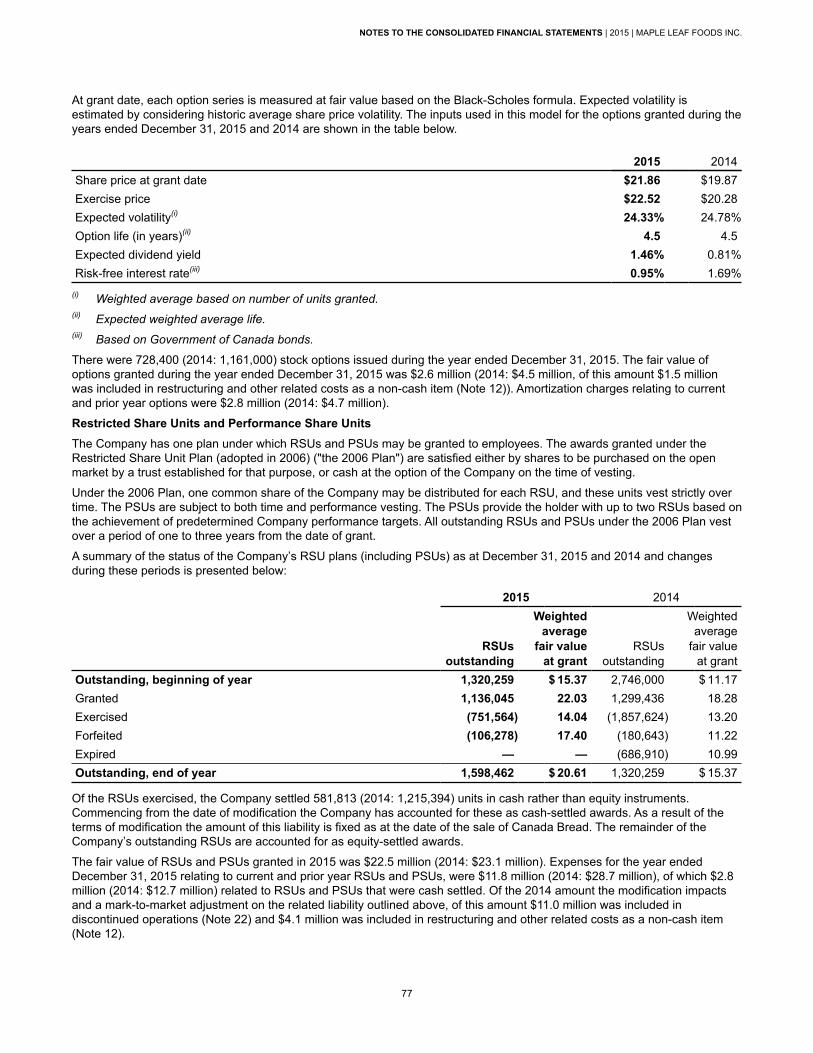
At grant date, each option series is measured at fair value based on the Black-Scholes formula. Expected volatility isestimated by considering historic average share price volatility. The inputs used in this model for the options granted during theyears ended December 31, 2015 and 2014 are shown in the table below.
2015 2014Share price at grant date $21.86 $19.87Exercise price $22.52 $20.28Expected volatility(i) 24.33% 24.78%Option life (in years)(ii) 4.5 4.5Expected dividend yield 1.46% 0.81%Risk-free interest rate(iii) 0.95% 1.69%
(i) Weighted average based on number of units granted. (ii) Expected weighted average life. (iii) Based on Government of Canada bonds.
There were 728,400 (2014: 1,161,000) stock options issued during the year ended December 31, 2015. The fair value ofoptions granted during the year ended December 31, 2015 was $2.6 million (2014: $4.5 million, of this amount $1.5 millionwas included in restructuring and other related costs as a non-cash item (Note 12)). Amortization charges relating to currentand prior year options were $2.8 million (2014: $4.7 million).
Restricted Share Units and Performance Share UnitsThe Company has one plan under which RSUs and PSUs may be granted to employees. The awards granted under theRestricted Share Unit Plan (adopted in 2006) ("the 2006 Plan") are satisfied either by shares to be purchased on the openmarket by a trust established for that purpose, or cash at the option of the Company on the time of vesting.
Under the 2006 Plan, one common share of the Company may be distributed for each RSU, and these units vest strictly overtime. The PSUs are subject to both time and performance vesting. The PSUs provide the holder with up to two RSUs based onthe achievement of predetermined Company performance targets. All outstanding RSUs and PSUs under the 2006 Plan vestover a period of one to three years from the date of grant.
A summary of the status of the Company’s RSU plans (including PSUs) as at December 31, 2015 and 2014 and changesduring these periods is presented below:
2015 2014
RSUs outstanding
Weighted average
fair value at grant
RSUs outstanding
Weighted average
fair value at grant
Outstanding, beginning of year 1,320,259 $ 15.37 2,746,000 $ 11.17Granted 1,136,045 22.03 1,299,436 18.28Exercised (751,564) 14.04 (1,857,624) 13.20Forfeited (106,278) 17.40 (180,643) 11.22Expired — — (686,910) 10.99Outstanding, end of year 1,598,462 $ 20.61 1,320,259 $ 15.37
Of the RSUs exercised, the Company settled 581,813 (2014: 1,215,394) units in cash rather than equity instruments.Commencing from the date of modification the Company has accounted for these as cash-settled awards. As a result of theterms of modification the amount of this liability is fixed as at the date of the sale of Canada Bread. The remainder of theCompany’s outstanding RSUs are accounted for as equity-settled awards.
The fair value of RSUs and PSUs granted in 2015 was $22.5 million (2014: $23.1 million). Expenses for the year endedDecember 31, 2015 relating to current and prior year RSUs and PSUs, were $11.8 million (2014: $28.7 million), of which $2.8million (2014: $12.7 million) related to RSUs and PSUs that were cash settled. Of the 2014 amount the modification impactsand a mark-to-market adjustment on the related liability outlined above, of this amount $11.0 million was included indiscontinued operations (Note 22) and $4.1 million was included in restructuring and other related costs as a non-cash item(Note 12).
NOTES TO THE CONSOLIDATED FINANCIAL STATEMENTS | 2015 | MAPLE LEAF FOODS INC.
77

The key assumptions used in the valuation of fair value of RSUs granted during the year are shown in the table below(i).
2015 2014Expected RSU life (in years) 1.78 1.60Forfeiture rate 10.3% 2.5%Risk-free discount rate 0.5% 1.1%
(i) Weighted average based on number of units granted.
Director Share Units If an eligible Director elects to receive his or her retainer and fees as common shares of the Corporation, the Companypurchases shares at market rates on behalf of the participating Directors.
Prior to 2013, if an eligible Director elected to receive his or her fees and retainer in the form of DSUs, each DSU had a valueequal to the market value of one common share of the Company at the time the DSU is credited to the Director. DSUs attractdividends in the form of additional DSUs at the same rate as dividends on common shares of the Company. The value of eachDSU is measured at each reporting date and is equivalent to the market value of a common share of the Company at thereporting date.
In 2013, the Company adopted a new Share Purchase and Deferred Share Unit Plan (the “2013 DSU Plan”), which replacedthe Company’s existing Share Purchase and Deferred Share Unit Plan (the “2002 DSU Plan”). The 2002 DSU Plan only allowsfor DSUs to be satisfied in cash, whereas the 2013 DSU Plan allows the Company, at its discretion, the flexibility to satisfyDSUs in common shares, either issued from treasury or purchased by the Company on the open market. DSUs outstandingunder the 2002 DSU Plan will be governed by the terms of the 2002 DSU Plan, unless a participant elected in writing that hisor her DSUs outstanding under the 2002 DSU Plan are to be governed by the 2013 DSU Plan.
The fair value of director share units expensed during the year ended December 31, 2015 was $1.1 million (2014: $1.3million).
A summary of the status of the Company’s outstanding DSUs as at December 31, 2015 and 2014, and changes during theseyears is presented below:
2015 2014Units Outstanding 2013 DSU plan 2002 DSU plan 2013 DSU plan 2002 DSU planOutstanding, beginning of year 396,926 18,893 326,900 18,725Additions: granted 48,327 — 66,757 —Additions: dividends reinvested 5,033 276 3,269 168Exercised (157,052) — — —Outstanding, end of year 293,234 19,169 396,926 18,893Value of liability at December 31(i) $ — $ 462 $ — $ 373
(i) Value of liability is only applicable to 2002 plan.
25. COMPOSITION OF THE COMPANY
SubsidiaryOn May 23, 2014, Grupo Bimbo, S.A.B. de C.V. of Mexico (“Grupo Bimbo”) acquired the 90.0% of issued and outstandingshares of Canada Bread owned by the Company, by way of a statutory plan of arrangement under the Business CorporationsAct (Ontario) (the “Arrangement”). Upon the sale of the business, the net assets of Canada Bread were de-recognized. For theyear ended December 31, 2014, the Canada Bread operations were classified as discontinued operations on the ConsolidatedStatements of Net Earnings (Note 22), and were presented as part of Bakery Products Group for segmented reporting (Note29).
NOTES TO THE CONSOLIDATED FINANCIAL STATEMENTS | 2015 | MAPLE LEAF FOODS INC.
78

The financial information before inter-company eliminations of Canada Bread is provided below:
Year ended December 31, 2014Sales from continuing operations $ 567,861Net earnings from continuing operations $ 19,751Net loss from discontinued operations —Net earnings $ 19,751Other comprehensive income (loss) (569)Total comprehensive income $ 19,182Attributed to non-controlling interest:Net earnings $ 1,975Total comprehensive income 1,918
Year ended December 31, 2014Operating activities $ (41,219)Financing activities (246,583)Investing activities (9,841)Increase (decrease) in cash and equivalents $ (297,643)
The following is a continuity of non-controlling interests:
Canada Bread and other minority interestsBalance at December 31, 2013 $ 60,863Net earnings 1,975Other comprehensive income (loss) (244)Dividends declared (3,017)Disposal of business (59,577)Balance at December 31, 2014 $ —
Unconsolidated Structured EntityThe Company has sold certain of its trade accounts receivable to an unconsolidated structured entity owned by a financialinstitution, under revolving securitization programs. The Company retains servicing responsibilities for these receivables. Thestructured entity finances the purchase of these receivables by issuing senior debt instruments to the financial institution,short-term mezzanine notes back to the Company, and an equity interest held by the financial institution.
As at December 31, 2015, trade accounts receivable being serviced under these programs amounted to $192.6 million (2014:$156.6 million). In return for the sale of its trade receivables, the Company will receive cash of $88.9 million (2014: $46.4million) and notes receivable in the amount of $103.7 million (2014: $110.2 million). The notes receivable are non-interestbearing and are adjusted on the settlement dates of the securitized accounts receivable. Due to the timing of receipts anddisbursements, the Company may, from time to time, also record a receivable or payable related to the securitization facility.As at December 31, 2015, the Company recorded a net payable amount of $2.9 million (2014: $30.4 million net payable) inaccounts payable and accruals.
The Company’s maximum exposure to loss due to its involvement with a structured entity is equal to the current carrying valueof the interest in the notes receivable due from the structured entity. The maximum potential loss that could be borne bysubordinated interests in the structured entity is a $1.5 million equity interest. The Company has not recognized any income orlosses with its interest in an unconsolidated structured entity for the year ended December 31, 2015 or 2014.
During the year ended December 31, 2014, the securitization agreements were renewed with substantially the same termsand conditions, with an expiry date of September 2016.
26. COMMITMENTS AND CONTINGENCIES
(a) The Company has been named as a defendant in several legal actions and is subject to various risks and contingenciesarising in the normal course of business. Management is of the opinion that the outcome of these uncertainties will nothave a material adverse effect on the Company’s financial position.
NOTES TO THE CONSOLIDATED FINANCIAL STATEMENTS | 2015 | MAPLE LEAF FOODS INC.
79
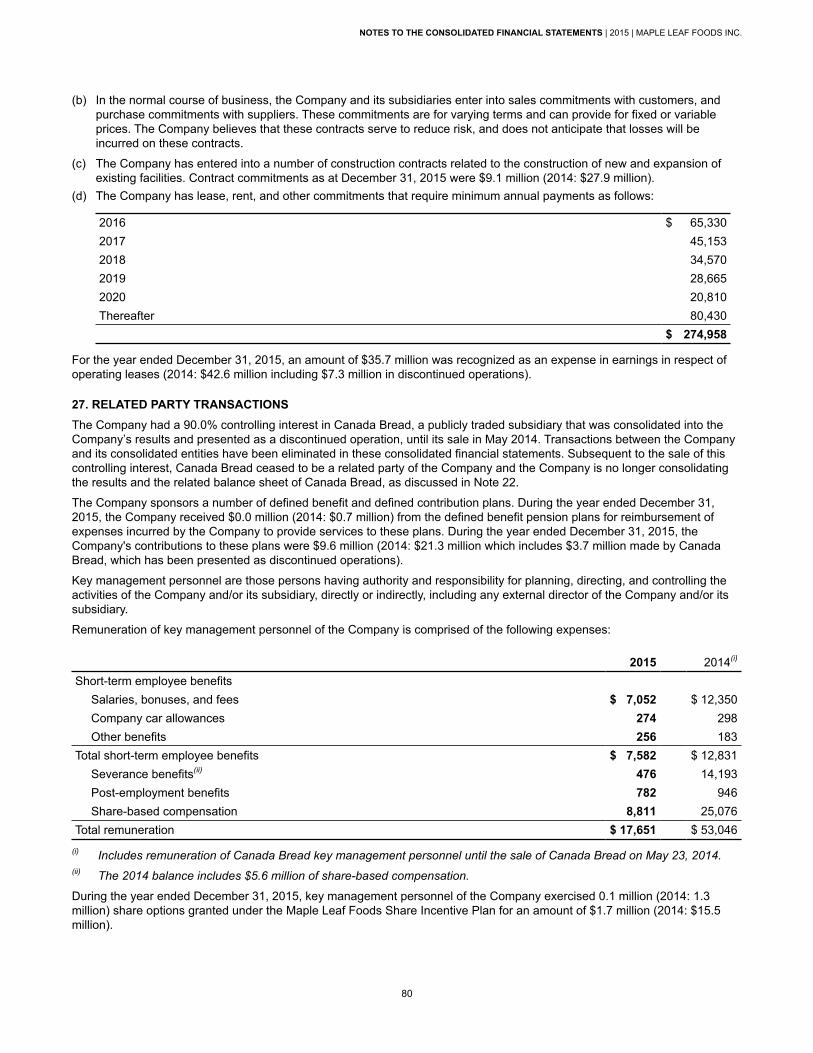
(b) In the normal course of business, the Company and its subsidiaries enter into sales commitments with customers, andpurchase commitments with suppliers. These commitments are for varying terms and can provide for fixed or variableprices. The Company believes that these contracts serve to reduce risk, and does not anticipate that losses will beincurred on these contracts.
(c) The Company has entered into a number of construction contracts related to the construction of new and expansion ofexisting facilities. Contract commitments as at December 31, 2015 were $9.1 million (2014: $27.9 million).
(d) The Company has lease, rent, and other commitments that require minimum annual payments as follows:
2016 $ 65,3302017 45,1532018 34,5702019 28,6652020 20,810Thereafter 80,430
$ 274,958
For the year ended December 31, 2015, an amount of $35.7 million was recognized as an expense in earnings in respect ofoperating leases (2014: $42.6 million including $7.3 million in discontinued operations).
27. RELATED PARTY TRANSACTIONSThe Company had a 90.0% controlling interest in Canada Bread, a publicly traded subsidiary that was consolidated into theCompany’s results and presented as a discontinued operation, until its sale in May 2014. Transactions between the Companyand its consolidated entities have been eliminated in these consolidated financial statements. Subsequent to the sale of thiscontrolling interest, Canada Bread ceased to be a related party of the Company and the Company is no longer consolidatingthe results and the related balance sheet of Canada Bread, as discussed in Note 22.
The Company sponsors a number of defined benefit and defined contribution plans. During the year ended December 31,2015, the Company received $0.0 million (2014: $0.7 million) from the defined benefit pension plans for reimbursement ofexpenses incurred by the Company to provide services to these plans. During the year ended December 31, 2015, theCompany's contributions to these plans were $9.6 million (2014: $21.3 million which includes $3.7 million made by CanadaBread, which has been presented as discontinued operations).
Key management personnel are those persons having authority and responsibility for planning, directing, and controlling theactivities of the Company and/or its subsidiary, directly or indirectly, including any external director of the Company and/or itssubsidiary.
Remuneration of key management personnel of the Company is comprised of the following expenses:
2015 2014(i)
Short-term employee benefitsSalaries, bonuses, and fees $ 7,052 $ 12,350Company car allowances 274 298Other benefits 256 183
Total short-term employee benefits $ 7,582 $ 12,831Severance benefits(ii) 476 14,193Post-employment benefits 782 946Share-based compensation 8,811 25,076
Total remuneration $ 17,651 $ 53,046(i) Includes remuneration of Canada Bread key management personnel until the sale of Canada Bread on May 23, 2014.(ii) The 2014 balance includes $5.6 million of share-based compensation.
During the year ended December 31, 2015, key management personnel of the Company exercised 0.1 million (2014: 1.3million) share options granted under the Maple Leaf Foods Share Incentive Plan for an amount of $1.7 million (2014: $15.5million).
NOTES TO THE CONSOLIDATED FINANCIAL STATEMENTS | 2015 | MAPLE LEAF FOODS INC.
80

The Company’s largest shareholder is McCain Capital Inc. (“MCI”) which is beneficially owned and controlled by Mr. MichaelH. McCain, Chief Executive Officer and President of the Company. For the year ended December 31, 2015, the Companyincurred expenses of $0.4 million, which represents the market value of the transactions with MCI. As at December 31, 2015,$0.0 million was owing to MCI relating to these transactions.
During the year ended December 31, 2015, the Company agreed to sublease office space to McCain Financial AdvisoryServices ("MFAS"), an entity jointly controlled by Mr. Michael H. McCain, for cost equal to the amount that the Company isobligated to pay under its lease. For the year ended December 31, 2015, the Company recorded $0.1 million of subleaseincome from MFAS and as at December 31, 2015, $0.1 million was owing from MFAS.
28. GOVERNMENT INCENTIVES For the year ended December 31, 2015, the Company recorded government incentives as a reduction in the cost of relatedassets totalling $0.4 million (2014: $1.3 million). Additionally, the Company recorded other incentives in earnings totalling $0.1million (2014: $0.2 million).
During the year ended December 31, 2014, the Company recorded a $5.0 million interest-free loan from the Canadiangovernment to support the upgrade of the Company's prepared meats manufacturing network and supply chain. The loan isrepayable over a period of 10 years beginning in 2015.
29. SEGMENTED FINANCIAL INFORMATION Reportable Segmented Information The Company has three reportable segments, as described below, which are groupings of the Company’s CGUs. Thesesegments offer different products and have separate management structures. The Company’s Management regularly reviewsinternal reports for these segments. The following describes the operations of each segment:
(a) The Meat Products Group is comprised of value-added processed packaged meat, chilled meal entrées and lunch kits,and primary pork and poultry processing.
(b) The Agribusiness Group is comprised of the Company’s hog production operations that primarily supply the MeatProducts Group with livestock as well as toll feed sales.
(c) The Bakery Products Group was comprised of the Company’s 90.0% ownership in Canada Bread Company, Limited; aproducer of fresh and frozen par-baked bakery products including breads, rolls, bagels, and artisan goods. During theyear ended December 31, 2014, the Company sold its 90.0% ownership interest in Canada Bread. As a result, the BakeryProducts Group has been classified as discontinued operations as at and for the year ended December 31, 2014. Refer toNote 22 for further details on the disposal activity of the Bakery Products Group.
(d) Non-allocated costs are comprised of expenses not separately identifiable to business segment groups and are not part ofthe measures used by the Company when assessing the segment’s operating results. These costs include generalexpenses related to the bakery business, changes in fair value of biological assets, unrealized gains or losses oncommodity contracts, and realized gains on commodity contracts that relate to delivery in future periods.
Non-allocated assets are comprised of corporate assets not separately identifiable to business segment groups. Theseinclude, but are not limited to, corporate property and equipment, software, investment properties, and tax balances.
NOTES TO THE CONSOLIDATED FINANCIAL STATEMENTS | 2015 | MAPLE LEAF FOODS INC.
81
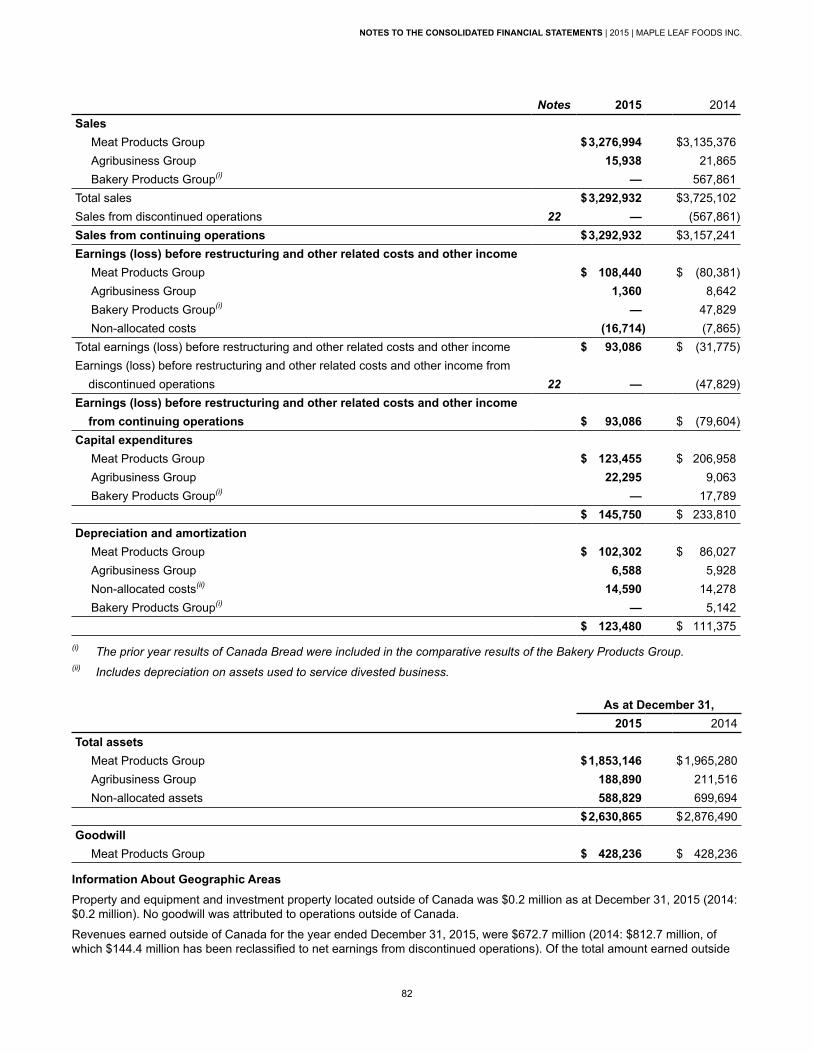
Notes 2015 2014Sales
Meat Products Group $3,276,994 $3,135,376Agribusiness Group 15,938 21,865Bakery Products Group(i) — 567,861
Total sales $3,292,932 $3,725,102Sales from discontinued operations 22 — (567,861)Sales from continuing operations $3,292,932 $3,157,241Earnings (loss) before restructuring and other related costs and other income
Meat Products Group $ 108,440 $ (80,381)Agribusiness Group 1,360 8,642Bakery Products Group(i) — 47,829Non-allocated costs (16,714) (7,865)
Total earnings (loss) before restructuring and other related costs and other income $ 93,086 $ (31,775)Earnings (loss) before restructuring and other related costs and other income from discontinued operations 22 — (47,829)Earnings (loss) before restructuring and other related costs and other income from continuing operations $ 93,086 $ (79,604)Capital expenditures
Meat Products Group $ 123,455 $ 206,958Agribusiness Group 22,295 9,063Bakery Products Group(i) — 17,789
$ 145,750 $ 233,810Depreciation and amortization
Meat Products Group $ 102,302 $ 86,027Agribusiness Group 6,588 5,928Non-allocated costs(ii) 14,590 14,278Bakery Products Group(i) — 5,142
$ 123,480 $ 111,375(i) The prior year results of Canada Bread were included in the comparative results of the Bakery Products Group.(ii) Includes depreciation on assets used to service divested business.
As at December 31,2015 2014
Total assetsMeat Products Group $1,853,146 $1,965,280Agribusiness Group 188,890 211,516Non-allocated assets 588,829 699,694
$2,630,865 $2,876,490Goodwill
Meat Products Group $ 428,236 $ 428,236
Information About Geographic AreasProperty and equipment and investment property located outside of Canada was $0.2 million as at December 31, 2015 (2014:$0.2 million). No goodwill was attributed to operations outside of Canada.
Revenues earned outside of Canada for the year ended December 31, 2015, were $672.7 million (2014: $812.7 million, ofwhich $144.4 million has been reclassified to net earnings from discontinued operations). Of the total amount earned outside
NOTES TO THE CONSOLIDATED FINANCIAL STATEMENTS | 2015 | MAPLE LEAF FOODS INC.
82
of Canada, $211.6 million (2014: $324.6 million) was earned in the U.S., $282.7 million (2014: $275.5 million) was earned inJapan, and $0.0 million (2014: $56.4 million) was earned in the U.K. Revenue by geographic area is determined based on theshipping location.
Information About Major CustomersFor the year ended December 31, 2015, the Company reported sales to one customer representing 14.0% of total sales.These revenues were reported in the Meat Products Group. No other sales were made to any one customer that representedin excess of 10% of total sales.
For the year ended December 31, 2014, the Company reported sales to two customers representing 13.9% and 12.4% of totalsales before adjustments for discontinued operations. These revenues were reported in both the Meat Products Group andBakery Products Group. The Company reported sales to two customers representing 15.5% and 11.1% of total sales fromcontinuing operations. No other sales were made to any one customer that represented in excess of 10% of total sales.
NOTES TO THE CONSOLIDATED FINANCIAL STATEMENTS | 2015 | MAPLE LEAF FOODS INC.
83
CORPORATE INFORMATION
Capital StockThe Company’s authorized capital consists of an unlimited number of voting common shares, an unlimited number of non-voting common shares and an unlimited number of preferred shares issuable in series. At December 31, 2015, 135,120,789 voting common shares were issued and outstanding. There were 732 shareholders of record of which 696 were registered in Canada, holding 98.8% of the issued voting shares.
OwnershipAs at December 31, 2015, the Company’s largest shareholder is McCain Capital Inc., holding 46,788,658 voting shares representing 34.6% of the total issued and outstanding shares. Michael H. McCain beneficially owns andcontrols 100% of McCain CapitalInc. and has beneficial ownership orcontrol of 46,788,658 common sharesor 34.6% of the common shares.The remainder of the issued andoutstanding shares are publicly held.
Corporate OfficeMaple Leaf Foods Inc. 6985 Financial Drive Mississauga, Ontario L5N 0A1 Canada Tel: (905) 285-5000 Fax: (905) 285-6000 www.mapleleaffoods.com
Annual MeetingThe annual meeting of shareholders of Maple Leaf Foods Inc. will be held on Wednesday, May 4, 2016, at 11:00 a.m. at Maple Leaf FoodsThinkFOOD!6897 Financial DriveMississauga, OntarioCanada
DividendsThe declaration and payment of quarterly dividends are made at the discretion of the Board of Directors. Anticipated payment dates in 2016: March 31, June 30, September 30 and December 30.
Shareholder InquiriesInquiries regarding dividends, change of address, transfer requirements or lost certificates should be directed to the Company’s transfer agent:
Computershare Investor Services Inc.100 University Avenue 8th Floor, North Tower Toronto, Ontario M5J 2Y1 Canada Tel: (514) 982-7555 or 1-800-564-6253 (toll-free North America) or [email protected]
Company InformationFor Investor Relations, please call (905) 285-5898.
For copies of annual and quarterly reports, the annual information form and other disclosure documents, please contact our Senior Vice-President and Corporate Secretary at (905) 285-5000.
Transfer Agent and RegistrarComputershare Investor Services Inc. 100 University Avenue 8th Floor, North Tower Toronto, Ontario M5J 2Y1 Canada Tel: (514) 982-7555 or 1-800-564-6253 (toll-free North America) or [email protected]
AuditorsKPMG LLPToronto, Ontario, Canada
Stock Exchange Listings and Stock SymbolThe Company’s voting common shares are listed on the Toronto Stock Exchange and trade under the symbol “MFI”.
Co
nce
pt
and
Des
ign
: TH
E W
OR
KS
DE
SIG
N C
OM
MU
NIC
AT
ION
S LT
D. w
ww
.wo
rksd
esig
n.co
m
Maple Leaf Foods Inc. 6985 Financial Drive Mississauga, Ontario L5N 0A1 Canada mapleleaffoods.com
At Maple Leaf Foods, we want to be a force for positive change, creating economic value through addressing environmental and societal needs.
To learn more about our sustainability initiatives, please visitmapleleafsustainability.ca
For more investor information, please visitmapleleaffoods.com/investors
Map
le Leaf Foo
ds Inc. 20
15 AN
NU
AL R
EP
OR
T