map-based tests on controls of anabranch river …
TRANSCRIPT

MAP-BASED TESTS ON CONTROLS OF ANABRANCH RIVER CHARACTER ON
THE LOWER YELLOWSTONE RIVER
by
Patricia Ann Jenkins
A thesis submitted in partial fulfillment of the requirements for the degree
of
Master of Science
in
Earth Sciences
MONTANA STATE UNIVERSITY Bozeman, Montana
November 2007

© COPYRIGHT
by
Patricia Ann Jenkins
2007
All Rights Reserved

- ii -
APPROVAL
of a thesis submitted by
Patricia Ann Jenkins
This thesis has been read by each member of the thesis committee and has been found to be satisfactory regarding content, English usage, format, citations, bibliographic style, and consistency, and is ready for submission to the Division of Graduate Education.
Dr. Stephan G. Custer
Approved for the Department of Earth Sciences
Dr. Stephan G. Custer
Approved for the Division of Graduate Education
Dr. Carl A. Fox

- iii -
STATEMENT OF PERMISSION TO USE
In presenting this thesis in partial fulfillment of the requirements for a master’s
degree at Montana State University, I agree that the library shall make it available to
borrowers under rules of the library.
If I have indicated my intention to copyright this thesis paper by including a
copyright notice page, copying is allowable only for scholarly purposes, consistent with
“fair use” as prescribed by the U.S. Copyright Law. Requests for permission for
extended quotation from or reproduction of this thesis in whole or parts may be granted
only by the copyright holder.
Patricia Ann Jenkins
November 2007

- iv -
ACKNOWLEDGMENTS
I wish to thank my main advisor, Dr. Stephan Custer, for his perpetual enthusiasm
and encouragement. I also wish to express appreciation for my committee members, Dr.
Brian McGlynn and Dr. Mark Skidmore, for their constructive guidance and support.
Many thanks to Karin Boyd of Applied Geomorphology, Inc., and James Robinson,
Water Resources Specialist of the Department of Natural Resources and Conservation,
for sound advice and suggestions during the earliest research phases. This study drew
upon the data collected for the Geomorphic Reconnaissance and GIS Development
Yellowstone River, Montana report, prepared by Applied Geomorphology, Inc. and DTM
Consulting, Inc., without which this project would not have been possible. Much thanks
to my fellow graduate students for many stimulating dialogues and their consistent,
fervent friendship. And finally, most importantly, I would like to thank my exceptional,
wonderful family for tremendous, unwavering support and continual encouragement
throughout my education.

- v -
LIST OF TABLES
Table Page
1. Stratigraphy of rock units exposed in the lower Yellowstone River valley............................................................................17
2. Tributary drainage basin characteristics ................................................................41
3. Yellowstone River stream power data table ..........................................................44
4. Tributary stream power data table .........................................................................45
5. Ratio of tributary stream power to Yellowstone River stream power ...................47
6. Bedrock lithology and erosion resistance of the lower Yellowstone River...........50
7. Statistics on valley width and anabranch intensity ................................................58

- vi -
LIST OF FIGURES
Figure Page
1. Flow chart of possible responsible controls and associated influencing mechanisms of anabranch river systems.......................................................3 2. Plot of number of channels vs distance downstream;
from Tooth and Nanson, 1999 ......................................................................5
3. Map of Montana and the Yellowstone River Basin...............................................14
4. USGS stream gage station locations on lower Yellowstone River and tributaries.............................................................................................15
5. Cities along the lower Yellowstone River, tectonic features, and bedrock erosion resistance .......................................................................................16
6. Reference towns and glacial features along lower Yellowstone River corridor .............................................................20 7. Irrigation withdrawal dams on lower Yellowstone River and tributary dams......................................................................................21 8. Climograph for Billings, MT .................................................................................22 9. Hydrograph for the Yellowstone River monthly mean discharge .........................23 10. Hydrographs for gaged tributaries to lower Yellowstone River, mean monthly discharge ...........................................................................24 11. Air photos of Yellowstone River in Stillwater County .......................................25 12. Air photos of Yellowstone River at Rosebud Creek confluence .........................26 13. Air photos of Yellowstone River in Dawson County ..........................................27

- vii -
LIST OF FIGURES - CONTINUED
Figure Page
14. Anabranching reach of the Yellowstone River between river mile 213 and 214...................................................................33
15. A. Slope of the Yellowstone River
B. Change in slope on the Yellowstone River ............................................35
16. Comparison of elevation values collected from LIDAR data and topographic maps ............................................................37
17. Frequency of anabranch intensity on lower Yellowstone River...........................38
18. Cumulative frequency distribution of tributary basin area ...................................39
19. Relative drainage basin area of tributaries to the lower Yellowstone River.........41
20. Flood frequency curves for gage sites along the Yellowstone River.....................42
21. Flood frequency curves for major tributaries to the lower Yellowstone River ....43
22. Profiles of anabranch intensity at tributary junctions along the lower Yellowstone River ............................................................................48
23. Stream power ratio vs change in anabranch intensity at a confluence ..................49
24. Distribution of valley width along the lower Yellowstone River ..........................52
25. A. Distribution of valley width relative to bedrock
B. Normalized distribution...........................................................................53 26. Bedrock hardness and valley width along the lower Yellowstone River ..............54
27. Correlation of bedrock and valley width downstream...........................................55

- viii -
LIST OF FIGURES - CONTINUED
Figure Page
28. Frequency and cumulative percent of anabranch character and bedrock hardness.................................................................................56 29. Correlation of bedrock and anabranch intensity downstream................................57
30. Valley width and anabranch intensity on lower Yellowstone River......................57
31. Scatter plot of valley width and anabranch intensity
on the lower Yellowstone River ...............................................................59 32. Correlation of valley width and number of channels downstream ........................59
33. Summary figure of geomorphic properties of the lower Yellowstone River.........61
34. Hypothesized anabranch system at tributary junctions .........................................67

- ix -
TABLE OF CONTENTS
1. INTRODUCTION ...................................................................................................1
2. STUDY REACH....................................................................................................13
3. METHODS ............................................................................................................28
Methods for Tributary Junction Test .....................................................................28 Methods for Valley Width Test .............................................................................32 Methods for Bedrock Test .....................................................................................33
4. RESULTS ..............................................................................................................35 Yellowstone River Channel Character...................................................................35 Tributary Junction Influence on Anabranch Character..........................................38 Bedrock and Valley Width Influence on Anabranch Character ............................49
5. DISCUSSION........................................................................................................62 Tributary Junction Analysis...................................................................................62 Bedrock and Valley Width Analysis......................................................................73 Complexity and Causality......................................................................................78 Conclusions............................................................................................................79
6. CONCLUSION......................................................................................................80 REFERENCES CITED................................................................................................82
APPENDICES .............................................................................................................92
APPENDIX A: Geomorphic Measurements ............................................93 APPENDIX B: Data on Tributary Basins...............................................116 APPENDIX C: Yellowstone River Channel Elevation ..........................120

- x -
ABSTRACT
Processes responsible for the formation of anabranched river systems are poorly understood. The Yellowstone River, Montana, is a major unimpounded river with over 800 km of anabranched channel. There are from one to seven channels per reach. Current literature identifies at least seven variables that may influence anabranch river character: tributary junctions, bedrock lithology, vegetation, sediment pulses, debris/ice jams, water loss from stream (to groundwater or irrigation withdrawal) and tectonism. Two variables, tributary junctions, bedrock lithology (measured by relative bedrock hardness and valley width), were tested on the Yellowstone River using aerial infrared photographs, and geologic and topographic maps. Relationships between anabranch character and tributary junction, valley width, and bedrock lithology were analyzed at 0.5-1km intervals along the lower 770 km reach. A weak relationship is found between tributary junctions and anabranches on the lower Yellowstone River (R2=0.38). Increased anabranching occurs downstream from tributary confluences with high tributary stream power relative to Yellowstone River stream power (ωt / ωY >1). Valley width is correlated with bedrock geology at a coarse scale. Neither valley width, nor bedrock resistance to erosion, appeared to have a perceptible control on number of anabranches (R2=0.0014).

- 1 -
CHAPTER ONE
INTRODUCTION
A multiple channel, or anabranched, river system occurs where a channel splits
around a stable island that is large relative to the size of the channels (Nanson and
Knighton, 1996). Islands are generally longer than three times the channel width.
Anabranched islands are considered permanent channel features which support woody,
perennial vegetation and are roughly at the same elevation as the surrounding floodplain.
The individual channels in combination have a substantially lower width to depth ratio
than if the same discharge were to occupy a single channel (Nanson and Huang, 1999).
Anabranching occurs in diverse environments with a variety of hydraulic and
physiographic conditions (Knighton, 1998), and the factors controlling this stream system
character remain unresolved.
Anabranch systems are classified differently than single-channel patterns. Single-
channel patterns have been widely studied and classified (Leopold et al., 1964;Schumm,
1985; Rosgen, 1994; Knighton, 1998; Montgomery and Buffington, 1998), though a
universally accepted classification system has yet to be developed. Conventional
classification includes straight, meandering and braided patterns, variations of these
three, intermediate forms, and anastamosing rivers (Knighton, 1998). Straight rivers
have a sinuosity (ratio of channel length to down valley distance) below 1.5, meandering
rivers have sinuosity of 1.5 or greater (Leopold et al., 1964). A braided stream channel is

- 2 -
separated into several channels by bars at low flow that are often submerged and
rearranged at high flow. The term anabranched refers to a system with multiple channels,
whereas braided describes the pattern of a single channel reach (Richards et al., 1993).
Anastamosed rivers generally form in fine-grained sediments, low-energy environments
and represent only one sub-type of anabranching river systems (Smith and Smith, 1980;
Smith and Putnam, 1980; Rust, 1981; King and Martini, 1984; Nanson et al., 1986;
Smith, 1986; Schumann, 1989; Miller, 1991; Harwood and Brown, 1993; Nanson and
Huang, 1999). Often ignored by traditional single channel classification, anabranching
represents a wide range of multiple channel systems that develop under different
hydraulic conditions.
Processes responsible for the formation of anabranching river systems are poorly
understood. Multiple channels produced by anabranched rivers are caused by avulsion
processes and accretion processes, and may more efficiently carry water and sediment
(Nanson and Knighton, 1996). Rather than flow in a single wide channel, flow divided in
several narrow, deep channels increases specific stream power and bed shear stress
without increasing slope (Chang, 1979; Nanson and Knighton, 1996; Nanson and Huang,
1999). Channel avulsion is generally thought to result from a highly variable flow
regime within a constrained channel (Schumann, 1989; Nanson and Knighton, 1996).
Other mechanisms may also be instrumental in displaced flow, or avulsion, and multi-
channel development. There are at least seven factors that have been suggested to
control multi-channel development and anabranch river character: tributary junction,
bedrock control, vegetation, sediment pulse, debris/ice jam, variations in flow, and

- 3 -
tectonics (Nanson and Huang, 1999; Osterkamp, 1998; Nanson and Knighton, 1996).
There are several controls and associated processes that influence development of an
anabranched river system (Fig. 1).
Figure 1. Flow chart of possible controls and associated influencing mechanisms of anabranch river systems.
One possible influence on anabranch river systems is valley width (Fig.1). Valley
constrictions may lead to confining flow into a single channel. Wende and Nanson
(1998) report higher intensity anabranching in areas where the valley width is greatest,
but provided little detailed analysis. Jansen and Nanson (2004) also suggest that valley
width influences anabranch river character. Wider valley sections, with extensive

- 4 -
floodplain development (Osterkamp, 1998; Croil, 2002) and less cohesive bedrock
lithology (Tooth and McCarthy, 2004), may promote multiple-channel reaches. Desloges
and Church (1989) have shown increased anabranching immediately upstream from
valley constrictions. Valley width and anabranch character have also been reported to be
associated with local bedrock lithology and resistance to erosion (Carson, 1984a; Croil,
2002; Tooth and McCarthy, 2004) . More readily erodable rock units can provide more
sediment to the channel, and therefore correlate with wider valley sections exhibiting
higher level anabranching. Valley lithology may also control channel slope, and slope is
often considered a dominant control on channel pattern (Schumm and Khan, 1972;
Watson et al., 1984; Ferguson and Ashworth, 1991).
Another possible cause of anabranch river systems is sediment delivery from
tributaries (Fig.1). An increase in sediment load (Church, 1983; Macklin and Lewin,
1989; Knighton and Nanson, 1994; Osterkamp, 1998) or a change in sediment particle
size distribution at the junction (Smith and Smith, 1980; Knighton and Nanson, 1993) can
induce anabranching. For instance, ponding or hydraulic jamming may occur with
increased sediment load at a tributary junction. Some large rivers alternate from single
thread to anabranching in response to the confluence of a major tributary (Tooth and
Nanson, 1999). Data presented for the Sandover-Bundey River, in northern Australia,
suggests that the number of channels increases for a short distance downstream from
tributary junctions (Tooth and Nanson, 1999) (Fig.2). In the Sandover-Bundey River the
effect appears to last approximately 5 km.

- 5 -
Figure 2. Plot of number of channels versus distance down stream. Arrows indicate tributary junctions. Note that the number of anabranches increases at tributary junctions and declines down stream of the junctions (Tooth and Nanson, 1999, p. 219).
Pulses of sediment from banks and hillslopes of upstream reaches that accumulate
as mid channel bars and are subsequently stabilized by vegetation may also generate an
anabranched river system (Nanson and Knighton, 1996; Murray and Paola, 2003) (Fig.1).
Increased bedload supply, delivered from nearby dune fields is reported to influence
channel widening and the formation of islands on the lower William River, Alberta,
Canada (Smith and Smith, 1980). The establishment of woody vegetation promotes
further deposition of sediment by increasing roughness and decreasing flow velocity
(Birkeland, 1996; Shields et al., 2000; Gurnell and Petts, 2002; Murray and Paola, 2003)
(Fig.1). Pulses of sediment can produce bars which are subsequently stabilized by
vegetation.
Tectonism could also contribute to development of anabranch reaches (Fig.1). As
channel and valley gradient increase due to upstream areas of uplift, channel sediment
- 6 -
loads increase. Elevated sediment loads, due to tectonic activity, can form channel bars
which develop into islands or trigger channel avulsion of neighboring flood plain areas
(Coleman, 1969; Mike, 1975; McDougall, 1989; Blair and McPherson, 1994; Dumont,
1994; Harbor et al., 1994). Tectonism can produce anabranched channel patterns through
gradient changes or increased sediment yield.
River morphology has been used to identify faults and areas of uplift (Burnett and
Schumm, 1983; Ouchi, 1985; Rhea, 1989; Marple and Talwani, 1993; Gupta, 1997).
Tectonics influence channel pattern largely by controlling channel gradient and base
level. For instance, meandering channels in South Carolina were found to flood
frequently and develop into multiple channel systems immediately upstream of an uplift
axis (Marple and Talwani, 1993). A slight decrease in gradient upstream from a domed
uplift axis has been shown to correspond to the transition of a meandering channel to a
multiple channel system (Watson et al., 1984; Miller, 1991). Channel forms and
processes are a reflection of variable channel gradients related to the underlying geologic
structures or lithologies (Miller, 1991; Wende and Nanson, 1998; Tooth and McCarthy,
2004).
Variations in flow within the channel system, such as seasonal flooding or loss of
water from the channel to irrigation withdrawal or groundwater, may influence channel
pattern (Fig.1). Anabranch channel pattern has been attributed to channel avulsion as a
result of a seasonal or highly variable flow regime (Nanson and Knighton, 1996; Tooth
and McCarthy, 2004). Flooding can lead to anabranched channels through channel
avulsion, or excision from the continuous floodplain. Conversely, lower discharge or

- 7 -
water loss due to irrigation withdrawal or an upstream dam may lower carrying capacity
and initiate deposition of sediment and island formation.
Finally, anabranching has been attributed to log jams or ice jams (Nanson and
Knighton, 1996; Ettema and Muste, 2001) (Fig.1). A high volume of debris delivered to
the channel may divert flow and instigate avulsion or block flow of water behind a dam,
causing deposition of sediment within the channel (Williams and Wolman, 1984; Benda,
1990; Wohl and Pearthree, 1991). Avulsion caused by jams of various types or by jam-
induced deposition can lead to islands and an anabranched plan form.
Anabranch stream systems occur in a variety of environmental settings (Nanson
and Knighton, 1996). Despite this, there is a general lack of detailed investigation and
quantitative data regarding anabranched river systems. Several factors have been
identified as primary drivers of anabranch river character, including tributary junctions,
bedrock lithology/valley width, bank and bar stabilization by vegetation, sediment pulses,
debris/ice jams, variable flow or water loss from the stream (to groundwater or irrigation
withdrawal), and tectonism (Nanson and Knighton, 1996). Despite the prevalence of
anabranching stream systems throughout Montana, geomorphic study of local anabranch
river character is sparse (Applied Geomorphology Inc. and DTM Consulting Inc., 2004).
The lower Yellowstone River is an anabranched system throughout its course to
the Missouri River. There are several tributaries of various magnitudes that join the
reach. The river crosses rock units of varying resistance to erosion. Thus, the
Yellowstone River is a potentially good site to further test some of the factors that
influence the character of anabranch river systems.

- 8 -
Tributary junctions and lithologic controls, relative bedrock hardness and valley
width, were chosen for consideration in this study because they are testable variables.
Nanson and Knighton (1996) suggested several other possible controlling factors for
anabranch river character, including variable flow, bank collapse/ sediment pulse,
tectonics, vegetation, and debris jams or ice jams. These were not considered in this
study for the following reasons.
First, variable flow, whether it be loss of water from the channel or extreme,
flashy floods, has been suggested to result in anabranch river character (Nanson and
Knighton, 1996; Tooth and McCarthy, 2004). The Yellowstone River was chosen for
this study, in part, because it is the longest unimpounded reach in the conterminous
United States. Being unimpounded, the Yellowstone River is subject to natural variations
in flow which may influence the anabranch system. Annual streamflow regime is
controlled by snowmelt runoff from tributary valleys; increasing in discharge by a factor
of seven during the spring and early summer months. Although the extreme variations in
stream flow may influence channel pattern, there are insufficient records of flood events
and associated channel change along the reach to adequately test this idea.
Loss of water from the channel may also be influencing the anabranch system.
There are several diversion dams along the reach which withdrawal overflow for
irrigation purposes. Because the dams are selectively built at single channel reaches,
their influence on the upstream and downstream channel character is not testable.
Furthermore, there is little record of channel morphology prior to dam construction for
channel change analysis. With consideration of the spatial and temporal scale of channel

- 9 -
change and flow variations, measurements of flood events, water withdrawal rates and
associated channel avulsion and deposition were not testable.
Investigation of anabranch character in response to sediment input to the channel
through bank collapse and sediment pulses was also ultimately withheld from this study.
There are not sufficient historical records of bank collapse along the 800 km reach length.
This study examined a very long reach of river. Examination of bank collapse over such
a long river was too large a project for a Master of Science study. There are also
limitations associated with conducting a strictly map-based investigation. An obvious
limitation is that channel pattern depends on the balance between flow strength and bank
strength. However, a map-based study provides little detail on bank sediment
composition and strength (beyond relative stability recognized by vegetation growth on
aerial photographs), and is therefore impractical in testing bank collapse.
Because many large tributary valleys to the lower Yellowstone River are
glaciated, anabranch pattern as a result of glacial sediment pulse was initially considered.
However, according to terrace analysis of tributary basins within the Yellowstone River
Basin, glacial sediment from the last glacial maximum has not yet reached the lower
Yellowstone River (Locke, 2005). Therefore, glacial sediment slugs were ultimately not
considered as a possible responsible variable for channel pattern.
Likewise, debris jams and ice jams were not considered in this study because
there are nearly no consistent records of debris or ice jams on the Yellowstone River.
While there are news accounts of ice jams and extensive flooding on the lower
Yellowstone River, these records are not consistent and maps of channel response are not

- 10 -
available. Furthermore, areas subject to extreme flooding and severe ice jams are difficult
to identify on aerial photographs (Kellerhals et al., 1976). Aerial photographs are
available for a limited number of years and are rarely taken in the winter. With this in
consideration, testing ice jam or debris jam as a control on anabranch character of the
lower Yellowstone River is impractical.
Tectonic control was also not included in this study. The full extent of lithologic
displacement as a result of the Yellowstone Volcanic Center Uplift is uncertain (Pierce,
2006, personal communication). This study did not include tectonic mechanisms for
anabranch development because there is little reported recent tectonic activity in the
lower Yellowstone River Basin that might be influencing channel character.
Furthermore, anabranched character extends far past areas of potential uplift such as the
Beartooth Front (Foose et al., 1961; Personius, 1982). In Eastern Montana, active
tectonism generally is not recognized. Due to the large scale of the study and the
difficulty of spatially isolating the variable and response, tectonic mechanisms were not
analyzed.
Finally, potential control of anabranch development by vegetation was not
considered due to the logistics of adequately measuring vegetation distribution over such
great spatial area (river reach length of nearly 800 km). Furthermore, testing vegetation
control on channel pattern meets difficulty when attempting to determine the initial
driver: does vegetation become established, promoting subsequent deposition of
sediment? Or, conversely, does sediment accumulate within the channel during
consecutive years of low flow, then providing area for vegetation to establish? Although

- 11 -
this investigation does not test all proposed controls on anabranch development, several
(tributary junction, valley width and bedrock erosion resistance) can be tested. The
outcome of the tests can be used either to demonstrate relationships or constraints for
future studies of controls on anabranch channel pattern. This study also provides a more
rigorous test of the relationship of the effect of tributary juctinos and valley width than
has, to date, been attempted anywhere else in the world.
Despite the fact that several of the factors the literature suggests are important
cannot be examined easily here, there are some that can be. Analysis of these contribute
to the body of knowledge regarding processes that are thought to contribute to the
development of anabranch planform in general and the factors that influence anabranch
planform on the Yellowstone River in particular. Tooth and Nanson suggest that
tributary junctions act as a control on anabranch river character(1999). Other research
suggests that anabranch river character responds to variation in valley width (Carson,
1984a; Osterkamp, 1998; Wende and Nanson, 1998; Jansen and Nanson, 2004; Tooth
and McCarthy, 2004). This investigation tests several controls on anabranch character,
including tributary junctions, valley width, and bedrock erosion resistance.
The Yellowstone River provides an ideal location to test hypotheses regarding
anabranched river system character, because it flows unimpounded and alternates
between anabranched and single-channel reaches for over 800km. Several major
tributaries join the lower Yellowstone River and the valley corridor transects bedrock
lithologies of varying resistance to erosion. The Yellowstone River is a good

- 12 -
environment in which to test tributary junction, bedrock erosion resistance and valley
width and associated influence on anabranch river character.
The objective of this study was to ascertain possible controls on anabranch river
character. Specifically, this study concentrates on the influence of bedrock erosion
resistance, valley width and tributary junction on anabranch river character. To address
this objective, I addressed the following questions:
▪ Does tributary junction, measured by relative stream power, influence
downstream anabranch character of the lower Yellowstone River?
▪ Does valley width influence anabranch character of the lower Yellowstone
River?
▪ Does relative resistance to erosion of local bedrock lithology influence
anabranch character of the lower Yellowstone River?

- 13 -
CHAPTER TWO
STUDY REACH
The Yellowstone River Basin drains several physiographic provinces, including
parts of the Great Plains, Middle Rocky Mountains, Wyoming Basin, and Northern
Rocky Mountains (Fenneman and Johnson, 1946). The highest elevations in the basin
reach approximately 4,200 m in the peaks of the Wind River Range. The Yellowstone
River flows in a generally northeast direction across southern Montana, from headwaters
in Yellowstone National Park, Wyoming, to its confluence with the Missouri River just
east of the Montana-North Dakota border. The river drains a total area of 178,980 km2
with a mean annual flow (averaged over 30 years) of 359 cumecs (Zelt et al., 1999).
The study reach includes the lower 767.7 river km of the Yellowstone River (Fig.
3). The study area extends from approximately Springdale, Montana to the river’s
confluence with the Missouri River in North Dakota. Elevations along the lower
Yellowstone River study reach range between 564 m at the confluence with the Missouri
River and approximately 1,200 m near Springdale, Montana. The lower Yellowstone
River valley topography is generally flat and terraced, with some gently rolling hills. The
terraces are thought to be a result of fluvial erosion of the ancient outwash plain that
extended eastward from the Rocky Mountains; these surfaces have an average slope,
from west to east, of 0.0019 (Howard and Williams, 1972). Although most tributaries to

- 14 -
the study reach drain from the mountain regions to the south, the lower Yellowstone
River lies entirely within the Great Plains Province
Figure 3. Map of Montana and the Yellowstone River Basin including major tributaries. Bolded channel is study reach. Dotted lines are approximate drainage divides for major tributaries.
The major tributaries of the lower Yellowstone River are the Stillwater, Clark’s
Fork, Bighorn, Tongue, and Powder Rivers and O’Fallon and Rosebud Creeks (Fig. 3).
There are USGS steam gage stations on each tributary (Fig. 4). Seven tributary stream
gages and four gages along the Yellowstone River between Springdale, MT and the
Missouri River confluence are mapped in Figure 4. The gaged tributaries enter from the
south and have head waters in the Absaroka, Bighorn, Wind River, and Beartooth
Mountains of Montana and Wyoming (Fig. 5).

- 15 -
Figure 4. USGS stream gage locations on Yellowstone River and tributaries (NRIS,1990; Applied Geomorphology Inc., and DTM Consulting, Inc., 2004).
The lower Yellowstone River valley is underlain predominantly by Cretaceous
and Tertiary age sedimentary rock composed of alternating beds of sandstone and shale
(Applied Geomorphology Inc. and DTM Consulting Inc., 2004) (Table 1; Fig. 5;
Appendix A). At the upstream end of the study area, between Springdale and Columbus,
the Yellowstone River valley transects the Hell Creek Formation sandstones and shales,
as it flows through the southern Crazy Mountains Basin (Fig. 5). From Columbus to Park
City the valley cuts through sandstones and shales of the Judith River Formation. At
Park City, the river flows through fine-grained shale and siltstones of the Claggett and

- 16 -
Telegraph Creek Formations. The steep sandstone valley walls at Billings are Cretaceous
Eagle sandstone. Also exposed in the Billings area are the Bell Fourche Shale and Judith
River Formation. Downstream from Billings, the valley transects relatively flat lying
sedimentary rocks. The valley cuts through Cretaceous sandstone and shale between
Billings and Forsyth. Further downstream, between Myers and Forsyth, Cretaceous
Bearpaw Shale is exposed as the river crosses the Porcupine Dome (Fig. 5) in the valley
floor (Applied Geomorphology Inc. and DTM Consulting Inc., 2004).
Figure 5. Cities along lower Yellowstone River, tectonic features, and bedrock lithology. Predominantly sandstone units along river valley are indicated as speckled area. Unshaded areas are predominantly shale units (Zelt et al., 1999; Applied Geomorphology Inc., and DTM Consulting, Inc., 2004; Appendix A).

- 17 -
CENOZOIC MESOZOIC Tertiary Cretaceous Paleocene Late Cretaceous
Fort
Uni
on
Form
atio
n /
Ludo
w
Fox
Hill
s
Eas
tern
Mon
tana
/
Nor
th D
akot
aa,c
Tong
ue
Riv
er
Mem
ber
Lebo
M
embe
r
Tullo
ck
Mem
ber
Hel
l Cre
ek
Col
gate
Mem
ber
Tim
ber
Lake
M
embe
r
Trai
l City
M
embe
r
Pie
rre
Sha
le
Pie
rre
Sha
le
Fort
Uni
on
Form
atio
n /
Ludl
ow
Fox
Hill
s
Eas
tern
Mon
tana
a
Tong
ue
Riv
er
Mem
ber
Lebo
M
embe
r
Tullo
ck
Mem
ber
Hel
l Cre
ek
Col
gate
Mem
ber
Tim
ber
Lake
M
embe
r
Trai
l City
M
embe
r
Pie
rre
Sha
le
Bea
rpaw
Sha
le
Fort
Uni
on
Form
atio
n /
Ludl
ow
Fox
Hill
s
Rou
ndup
USG
S
Qua
dran
gle
(nor
th o
f B
illing
s)b
Tong
ue
Riv
er
Mem
ber
Lebo
M
embe
r
Tullo
ck
Mem
ber
Lanc
e Fo
rmat
ion
Tim
ber
Lake
M
embe
r
Trai
l City
M
embe
r
Pie
rre
Sha
le
Bea
rpaw
For
mat
ion
Fort
U
nion
/ Lu
dlow
Sou
thce
ntra
l M
onta
naa,
c
Lebo
M
embe
r
Tullo
ck
Mem
ber
Hel
l Cre
ek
Fox
Hill
s S
ands
tone
Bea
rpaw
Sha
le
Cra
zy
Mou
ntai
ns
Bas
in, M
onta
nac
Fort
Uni
on
Form
atio
n /
Ludl
ow
Livi
ngst
on
Gro
up
volc
anic
last
ics
Hel
l Cre
ek
Form
atio
n
Lenn
ep
Form
atio
n
Bea
rpaw
Fo
rmat
ion
Tabl
e 1.
Stra
tigra
phy
of ro
ck u
nits
exp
osed
in th
e lo
wer
Yel
low
ston
e R
iver
val
ley.

- 18 -
MESOZOIC Cretaceous
Late
Cretaceous E
aste
rn M
onta
na /
Nor
th D
akot
aa,c
Pie
rre
Sha
le
Nio
brar
a Fo
rmat
ion
Car
lile S
hale
Bel
le F
ourc
he
Mow
ry S
hale
Eas
tern
M
onta
naa
Judi
th R
iver
Fo
rmat
ion
Nio
brar
a Fo
rmat
ion
Car
lile S
hale
Bel
le F
ourc
he
Mow
ry S
hale
Rou
ndup
USG
S
Qua
dran
gle
(nor
th o
f B
illing
s)b
Judi
th R
iver
Fo
rmat
ion
Cla
gget
t Sha
le
Eag
le S
ands
tone
Tele
grap
h C
reek
Nio
brar
a Fo
rmat
ion
Car
lile S
hale
Sou
thce
ntra
l M
onta
naa,
c
Judi
th R
iver
Fo
rmat
ion
Cla
gett
Sha
le
Eag
le
San
dsto
ne
Tele
grap
h C
reek
Nio
brar
a Fo
rmat
ion
Car
lile S
hale
Bel
le F
ourc
he
Mow
ry S
hale
Tabl
e 1
- con
tinue
d
Cra
zy M
ount
ains
B
asin
, Mon
tana
c
Judi
th R
iver
Fo
rmat
ion
Cla
gget
t Sha
le
Eag
le S
ands
tone
Tele
grap
h C
reek
Mow
ry S
hale
Modified from: a. (Flight, 2004 p.14 fig.4); b. (Wilde and Porter, 2000); c. (Zelt et al., 1999 p.18, fig.8)

- 19 -
Tertiary-age Fort Union Formation dominates bedrock downstream from the town
of Rosebud (Fig.5). Valley walls are interbedded sandstone, shale, coal, and red clinker
beds. Between Miles City and Glendive, the river cuts though the Tullock
(predominantly sandstone) and Lebo (predominantly shale) Members of the Fort Union
Formation. At Miles City, the valley walls are interbedded sandstone and shale of the
Tullock Member of the Fort Union Formation. The Cedar Creek Anticline crosses the
river at a high angle between Fallon and Glendive, exposing Cretaceous sandstone and
shale. The Ludlow/Fort Union Formation re-appears downstream. From Savage to the
confluence with the Missouri River, the Yellowstone River cuts through the Tongue
River Member of the Fort Union Formation (Womack and Associates, Inc., 2001).
The bedrock geology is overlain by glacial and fluvial materials in the
northeastern part of the study reach (Freers, 1970; Fig.6). The southern limit of the
continental glacier and approximate lake limits for Glacial Lake Glendive are mapped in
Figure 6. The damming of the river and the formation of glacial Lake Glendive is
suggested by the prevalence of glaciolacustrine deposits in this section (Fig. 6). Alden
(1932) identifies four terraces preserved in the Yellowstone River drainage: the Cypress
Plain and Benches 1-3. The Oligocene-Miocene Cypress Plain is the dominant erosional
surface (Collier and Thom, 1918). Bench 1, the Flaxville Gravel, is a Miocene-Pliocene
fluvial deposit. Benches 2-3, the Cartwright and Crane Creek Gravels respectively, were
deposited by the Yellowstone River as outwash deposits from the Yellowstone ice cap
outlet glaciers during the Pliestocene (Howard, 1960; Koch et al., 1977). The lower

- 20 -
terraces (benches 2-3), represent successive cycles of local aggredation within a more
regional pattern of degradation (Alden, 1932).
Figure 6. Reference towns and limit of continental glacier (dashed line) and glacial lake limits (grey area) along the lower Yellowstone River corridor (Freers, 1970; Applied Geomorphology Inc., and DTM Consulting, Inc., 2004). The lower Yellowstone River valley floor landuse today is predominantly
agricultural (Miller et al., 2005). About 98% of surface water use in the Yellowstone
River Basin is dedicated to irrigation (Peterson et al., 2004). There are six diversion
dams on the lower Yellowstone River downstream from Billings, MT. The locations of
diversion dams on the lower Yellowstone River are mapped in Figure 7. The dams are

- 21 -
three to eight feet tall concrete or rock structures across the main channel and are used to
divert water for irrigation, but do not create impoundments, or reservoirs, on the river.
Figure 7. Irrigation withdrawal dams on the lower Yellowstone River and tributary basin dams (Applied Geomorphology Inc. and DTM Consulting Inc., 2004; NRIS, 2006).
Climate data has been collected from the National Climatic Data Center
weather station in Billings, MT, because it is most centrally located to the study site
along the lower Yellowstone River. Average daily temperatures in Billings, MT, range
from 22.5ºC in July to -5.1ºC in January. Precipitation peaks during May, which
averages 6.3 cm, and is lowest during February with only 1.4 cm (Fig. 8).

- 22 -
Figure 8. Climograph for Billings, MT generated with monthly data averaged over 30 years (1 is January, 12 is December) (NOAA, 2002).
Heavy rains in the spring, before ice melt along the river, have caused ice jams
and extensive backwater flooding. Icejams and associated flooding may influence
channel pattern. Ice jams on the Yellowstone River have been well documented over
past hundred years (Patterson, 1966; White, 1996; Earnes, 1998). Because the river
valley is becoming more populated, ice jams and related damage are of particular
concern. Between 1894 and 1997, there were reports of 88 ice jams on the Yellowstone
River (Earnes, 1998). There are records for 22 ice jam related floods since 1900 on the
Yellowstone River in Glendive, Montana alone. The record is limited in historical length
and there are likely unreported icejams.
Climate characteristics influence vegetation, which may, in turn, influence
channel pattern. Primm et al. (2001) describes the lower Yellowstone River as part of the
“northern short grasslands” ecoregion, in the temperate grasslands, savannas and shrub
lands biome. The northern short grassland ecoregion covers nearly 640,000 km2 from
southeastern Alberta through to western North and South Dakota and northeastern

- 23 -
Wyoming. This area is uniquely characterized by four major features: “the harsh winter
climate, with much of the precipitation falling as snow; short growing season; periodic,
severe, droughts; and (grassy) vegetation” (Primm et al., 2001). Riparian vegetation
along the lower Yellowstone River is Northern Floodplains Deciduous Forest, dominated
by cottonwood, ash, box elder and willows (Kuchler, 1975;Zelt et al., 1999).
Stream flow, another prominent control on channel pattern, also reflects local
climate trends. A hydrograph of the Yellowstone River at Billings, MT, shows the mean
monthly stream flow ranges from roughly 75 cumecs in the fall and winter to just over
700 cumecs in June (Fig. 9). Although most precipitation in the lower Yellowstone River
basin falls as rain during the summer months, the Yellowstone River flow regime is
dominated by snow melt runoff from tributary valleys. Figure 10 shows mean monthly
flow of tributaries to the lower Yellowstone River, where available from USGS stream
gage records. The greatest flow volume occurs in the spring and early summer months in
response to the melting of the winter snow pack.
Figure 9. Hydrograph for Yellowstone River monthly mean discharge, at Billings, MT. Data averaged over 75 years (1 is January, 12 is December) (U.S.Geological Survey, 2006c).

- 24 -
Figure 10. Hydrographs for gaged tributaries to the lower Yellowstone River, mean monthly discharge (1 is January, 12 is December) (U.S.Geological Survey, 2006a).
Change in channel pattern is influenced by regional climate trends and stream
flow patterns. The lower Yellowstone River is an anabranched system throughout its
course to the Missouri River. Photos of the river channel pattern in Stillwater, Rosebud,
and Dawson Counties over time are presented in Figures 11-13. River mile markers along
the channel centerline, established by Applied Geomorphology, Inc. and DTM
Consulting, Inc., are displayed for reference (2001). Air photos of the river channel over

- 25 -
fifty years, 1950, 1976, and 2004, show the temporal consistency of the anabranched
islands.
Figure 11. Aerial photos of Yellowstone River in Stillwater County, river miles 414-411 (1950, 1976, 2001) (Applied Geomorphology Inc., and DTM Consulting, Inc., 2004; NRIS, 2006).

- 26 -
Figure 12. Aerial photos of Yellowstone River at Rosebud Creek Confluence, river miles 230-222 (1950, 1976, 2001) (Applied Geomorphology Inc., and DTM Consulting, Inc., 2004; NRIS, 2006).

- 27 -
Figure 13. Aerial photos of Yellowstone River in Dawson County, river miles 100-106 (1950, 1976, 2001) (Applied Geomorphology Inc., and DTM Consulting, Inc., 2004; (NRIS, 2006).

- 28 -
CHAPTER THREE
METHODS
Color infrared photography layers (1:24000 scale) were obtained from the lower
Yellowstone River corridor digital orthophotography and physical feature inventory data
set developed for the Geomorphic Reconnaissance and GIS Development: Yellowstone
River, Montana Report (Applied Geomorphology Inc. and DTM Consulting Inc., 2004).
All layers were projected in NAD 1983 Stateplane coordinates. River mile markers were
used to delineate measurement points along the river centerline. The markers were
established on 2001 1:24000 scale color infrared photographs by Applied
Geomorphology Inc. and DTM Consulting Inc. (2004) for the Montana Natural
Resources Information System (NRIS). Map-based measurements were made on
projected orthophoto mosaics of color infrared photography and associated topographic
layers from NRIS with ArcView 9.0 digital tools and spatial analyst. Data analysis was
conducted using Microsoft Office Excel.
Methods for Tributary Junction Test
Tributaries with large drainage basin area are expected to have higher discharge,
more sediment yield, and a large potential impact on the Yellowstone River. Applied
Geomorphology Inc. and DTM Consulting Inc. identified large tributary basins (2004). I
measured drainage area of these basins using 1:250000 scale topographic map projected

- 29 -
in ArcView 9.0 with spatial analyst. To check measurement accuracy, these values were
compared to USGS reported drainage areas and are presented in the Results section. The
USGS reports drainage area for several of the larger tributaries (e.g. Boulder, Stillwater,
Bighorn, and Tongue); the reported drainage areas were used for these tributaries
(U.S.Geological Survey, 2006b). Estimates of error were based on the difference between
the measured drainage area from the 1:24000 scale topographic maps and the observed
USGS station data and are reported in the Results section.
Tributary junctions were identified by the Geomorphic Reconnaissance and GIS
Development Yellowstone River, Montana project (Applied Geomorphology Inc. and
DTM Consulting Inc., 2004). Tributaries were ranked by unit stream power to assess
tributary junction effects. Tributaries included in the stream power analysis are the
Stillwater, Clark’s Fork, Bighorn, Tongue, and Powder Rivers and Rosebud and O’Fallon
Creeks. Stream power represents the rate of work done in transporting water and
sediment in the channel (Robert, 2003). Unit stream power is predominantly a function of
slope and discharge; specifically defined as
ω = ρgSQ/w (Equation 1)
where ρ is density of water, g is gravitational acceleration, S is slope, Q is discharge and
w is channel width. For this analysis, ρ and g are considered constant.
Slope (S) was interpolated between contour lines on USGS 1:24000 scale
topographic maps. Slope of the Yellowstone River channel centerline was interpolated
between contour lines along a reach length of 4 km (roughly 20 times channel width)
upstream from each confluence. Tributary channel slope was interpolated between

- 30 -
contour lines over a reach length approximately equal to 20 channel widths immediately
upstream from the confluence. The USGS 1:24000 scale topographic map contour
intervals used to derive slope were 20 ft (~ six m) in western and central Montana, and 10
ft (~three m) in easternmost Montana.
Topographic map-based slope may be too general and obscure important detail.
Twenty foot contours are often as much as seven miles apart. There is 2.5 m resolution
LIDAR data (with 0.2 m vertical accuracy) available for parts of the lower Yellowstone
River corridor which allow a test of topographic map-based slope. A visual comparison
of LIDAR and topographic map slope measurement methods in the lower Yellowstone at
Stillwater, western Yellowstone, and Dawson counties was made to assess the error in
this estimate. Elevation measurements were made at approximately 800 m (half river
mile) increments along sections of Yellowstone River between river mile markers 434-
391 (Stillwater County), 390-344 (western Yellowstone County), and 117-70 (Dawson
County). Topographic map measurements along the same reach sections were made using
1:24000 scale maps, with 20 ft or 10 ft (~ six m and three m) contour intervals. These
data were used to test the validity of using topographic map measurements of slope for
stream power estimations throughout the study area, and are reported in the Results
section.
Channel width (w) was measured from digital orthophoto mosaics of 1:24000
scale color infrared aerial photographs taken in 2001. An average width was calculated
from four single channel width measurements made at 1.6 km (one mile) spacing
upstream from each confluence. Channel width was measured between bankfull edges of

- 31 -
single channel reaches identified based on the visual identification of boundary between
dense vegetation and sparse vegetation visible on aerial photographs.
In addition to slope and width, three discharges, Q1.5, Q2.33, and Q25, were
estimated to compute stream power. Q1.5 is an estimate for bankfull discharge and is
understood to be roughly equal to effective discharge, or that discharge which does most
work on the channel (Andrews, 1980; Andrews and Nankervis, 1995; Simon et al., 2004).
Gage station analyses throughout the United States has shown that the bankfull discharge
has an average return interval of 1.5 years or 66% annual exceedence probability
(Leopold, 1994; Dunne and Leopold, 1978). Q2.33 is an estimate for mean annual flood.
Flow with a recurrence interval of 2.33 years, Q2.33, is a magnitude flow which has a 43%
chance of occurring or being exceeded in any given year. Q25 represents a high flow-
level that has a 4% chance of occurring or being exceeded in any given year. Recurrence
interval Q25 was chosen in order to test stream power at higher discharge values. Three
discharge magnitudes are included in the test, because there is no clear answer in the
literature as to which discharge controls stream power and channel pattern (Nash, 1994;
Goodwin, 2004; Doyle et al., 2007).
Each discharge was estimated from exceedence probability curves for sites along
the Yellowstone River and for each tributary. Values for Q1.5, Q2.33, and Q25 were
estimated from USGS annual peak discharge flood exceedence probability curves
(U.S.Geological Survey, 2006a). Flood-frequency data are based on recorded annual peak
discharges through 1998. Peak discharges for specified frequencies (exceedence
probabilities) were determined from published a log-Pearson Type 3 probability

- 32 -
distribution fitted to base 10 logarithms of recorded annual peak discharges as reported
and described by the Interagency Advisory Committee on Water Data (1982).
Methods for Valley Width Test
Valley width was determined using drainage area on both topographic maps and
aerial infrared photographs. Valley width was measured at intervals of approximately 1.6
km (at every river mile marker). For this study, valley width is defined by the break in
slope between fluvial dominated and hill slope dominated landforms. The valley
boundary was identified as the break in slope at the base of the steep bedrock valley
walls. All terraces were included in the width of the valley.
The number of anabranched channels was counted at cross section intervals of
approximately 800 m (every half river mile marker). An anabranched channel is defined
as any channel contiguous with the Yellowstone River with water at up to bankfull flows.
On aerial photographs, channels which contained flows up to bankfull were identified as
either having water in them or being covered by recently deposited bedload and no
vegetation.
For example, the Yellowstone River is anabranched between River Mile Markers
213 and 214 (Fig. 14). Figure 14 is an aerial photograph of an anabranched reach of the
Yellowstone River channel, near Sweeney Creek, downstream from the Rosebud Creek
confluence. The 800 m (half river mile) interval transects are shown. Flow direction is
from west to east. The cross section at River Mile Marker 214 intersects two
anabranched channels. The cross section midway between River Mile Markers 213 and

- 33 -
214 intersects one channel. The mid-channel bar at this cross section is not considered an
anabranched island, because it does not support dense, woody vegetation, and therefore is
likely submerged at high flows. The cross section immediately downstream intersects
two anabranched channels, separated by a densely vegetated island.
Figure 14. Anabranching reach of Yellowstone River between River Mile Markers 213 and 214, downstream from Sweeney Creek confluence in Rosebud County.
Methods for Bedrock Test
Local channel bedrock was also cataloged along each channel reach. The local
bedrock geology along the corridor was identified from the USGS Geology of Montana,
1:500000 scale map (Ross et al., 1955). Lithologic descriptions from Balster (1980) were
used to determine relative resistance to erosion. Predominantly shale units were classified
as non-resistant; predominantly sandstone units were classified as resistant to erosion.
The predominately shale/non resistant rock formations are: Telegraph Creek, Claggett,

- 34 -
Bearpaw, Pierre Shale, Lebo and Sentinal Butte Members of Fort Union Formation, Belle
Fourche, Carlile, Mowry, and Niobrara. The predominantly sandstone units/resistant
rock formations are: Eagle, Judith River, Foxhills, Tullock, and Tongue River Members
of Fort Union Formation, Slide Rock Mountain, Ludlow, Timber Lake and Trail City,
and Colgate formations.

- 35 -
CHAPTER FOUR
RESULTS
Yellowstone River Channel Character
Channel slope and anabranch geometry were quantified along the Yellowstone
River in order to test for possible controls. Although there are local variations in channel
gradient, the longitudinal profile, as a whole, is concave up (Fig. 15-A). The
Yellowstone River descends approximately 636 meters along the study reach. Slope
generally decreases at a rate of 0.0025 to 0.0005 in a downstream direction (Fig.15-B).
The change in slope is calculated by applying a three mile moving window to the
difference in slope data obtained from topographic maps.
Figure 15. A) Slope of the Yellowstone River channel from Springdale, MT to the confluence with Missouri River in North Dakota, as measured on 1:24000 scale topographic maps; B) Change in slope, calculated by applying a moving window to slope difference data.

- 36 -
Channel slope used in the stream power analysis was determined by interpolating
between contour lines on topographic maps. Because this is a crude method of
generating slope, elevation values from topographic maps were compared to elevation
values from high resolution LIDAR data in order to test for relative accuracy. Elevation
data from 2.5 m resolution LIDAR and interpolated between contour lines on 1:24000
scale topographic maps are broadly similar (Fig. 16). Error between LIDAR and
topographic elevations of Stillwater County ranges between 0.0018 and 0.45 percent.
Error between LIDAR and topographic elevations of western Yellowstone County ranges
between 0.0019 and 0.53 percent. Error between LIDAR and topographic elevations of
Dawson County ranges between 0.0044 and 0.39 percent. ANOVA (Student’s t-test)
results for elevation data at Stillwater, western Yellowstone, and Dawson Counties
suggest differences in elevation and resolution are not significant (p = 0.898, 0.628, 0.906
respectively).

- 37 -
Figure 16. Comparison of elevation values collected from LIDAR data and topographic maps. Note axis for Dawson County slope data is at a larger scale.
The lower Yellowstone is a predominantly multiple channeled system; 64% of
cross sections measured are anabranched, or roughly 491 km. Approximately one third
of the river is single channel (276 km), and almost as frequently, it exhibits anabranch

- 38 -
character by occupying two channels (269 km). The river has predominantly one and two
channels, 36% and 35% of its distance, respectively (Fig. 17).
Figure 17. Frequency of anabranch intensity (number of channels) on the lower Yellowstone River.
Tributary Junction Influence on Anabranch Character
Tooth and Nanson (1999) suggested that some large rivers alternate from single
thread to anabranching in response to the confluence of a major tributary. I hypothesized
that the Yellowstone River would show an increase in number of anabranched channels
downstream of confluences with major tributaries. Major tributaries drain a large area
and carry substantial flow such that it may influence the flow of the Yellowstone River.
Increased anabranch intensity was hypothesized to be associated with a high tributary to
main channel stream power ratio, therefore the largest tributary basins were chosen for
the stream power analysis.

- 39 -
Tributary drainage basins were delineated on topographic maps in order to select
tributaries for the stream power analysis. Sixty tributary basins to the lower Yellowstone
River were delineated. Drainage basins range in size from nearly 60,000 km2 to less than
27 km2; the median of tributary drainage basin area is 500 km2 (Fig.18). The first and
third quartiles are approximately 300 km2 and 1000 km2, respectively.
Figure 18. Cumulative frequency distribution of tributary drainage basin area, dashed line is the median.
The largest tributaries included in the stream power analysis were selected by
drainage basin area. Distribution of tributary basin sizes is log normal (Fig.18).
Tributaries within the uppermost 20th percentile of the log distribution of drainage basin
area were selected for study. These drainages have potential to influence the
Yellowstone River channel pattern. This criterion included all basins greater than 1500

- 40 -
km2. Drainage basin area threshold was chosen to include all basins which are much
larger than the mode shown in Figure 18. Small drainage basins (small tributary
discharge) are not expected to deliver enough sediment to influence the much larger
Yellowstone River. I selected the top 20% of the log-normally distributed drainage basin
area (Fig. 18) to make the sample population manageable and the potential for influence
high. The tributaries used in this study and their relative drainage basin size are indicated
in Figure 19 and Table 2: Stillwater, A; Clark’s Fork, B; Bighorn, C; Rosebud, D;
Tongue, E; Powder, F; and O’Fallon, G. Although the Boulder River has a USGS gage,
the drainage basin area is only 1349 km2, therefore it was excluded from the study.
General characteristics of the seven largest tributaries are presented in Table 2.
The selected basins range in size from the Bighorn drainage (nearly 60,000 km2)
to the Stillwater drainage (approximately 2500 km2). Figure 19 illustrates relative
drainage basin area of all sixty delineated tributary basins to the lower Yellowstone
River. Dot size, in Figure 19, is proportional to drainage area. Fifty percent of the
basins contributing to the study reach are between 300 - 1000 km2 (Fig. 18).

- 41 -
Figure 19. Relative drainage basin area of tributaries to the lower Yellowstone River. Stillwater, A; Clark’s Fork, B; Bighorn, C; Rosebud, D; Tongue, E; Powder, F; and O’Fallon, G.
Table 2. Tributary drainage basin characteristics
Drainage Basin Figure 20 ID
Drainage Basin Area
(km2)
River Mile
Marker
USGS stream gage ID
Stillwater A 2525 416 06205000 Clark's Fork B 2989 383 06208500
Bighorn C 59272 297 06294500 Rosebud D 3402 225 06296000 Tongue E 13978 184 06308500 Powder F 34159 148 06326500 O'Fallon G 4148 128 06326600

- 42 -
Unit stream power was calculated with equation 1 for discharges at three
recurrence intervals. The discharges were read from US Geological Survey flood
frequency curves (Fig. 20 and 21). The values of slope, width and discharge used to
calculate unit stream power are shown in Table 2 with stream power. Three different
stream power values were calculated for three recurrence interval discharge estimates
(Q1.5, Q2.33 and Q25). The slope values, discharge estimates, and calculated stream power
values are presented in Tables 3 and 4.
Figure 20. Flood frequency curves for gage sites along the Yellowstone River. Data from USGS stream gages (U.S.Geological Survey, 2006a).

- 43 -
Figure 21. Flood frequency curves for major tributaries to the lower Yellowstone River. Data from USGS stream gages (U.S. Geological Survey, 2006a).

- 44 -
Stil
lwat
er
1.69
E-0
3
216.
84
991.
1
1204
1917
7.70
E-0
3
9.35
E-0
3
1.49
E-0
2
Cla
rk's
For
k
2.02
E-0
3
227.
01
1038
1265
2125
9.24
E-0
3
1.13
E-0
2
1.89
E-0
2
Big
horn
1.05
E-0
3
381.
89
1086
1326
2332
2.99
E-0
3
3.66
E-0
3
6.43
E-0
3
Ros
ebud
5.25
E-0
4
211.
42
1133
1388
2540
2.81
E-0
3
3.44
E-0
3
6.30
E-0
3
Tong
ue
6.42
E-0
4
299.
06
1204
1487
2466
2.59
E-0
3
3.19
E-0
3
5.30
E-0
3
Pow
der
1.38
E-0
3
217.
04
1279
1562
3288
8.12
E-0
3
9.92
E-0
3
2.09
E-0
2
O'F
allo
n
5.45
E-0
4
209.
02
1428
1711
3622
3.72
E-0
3
4.46
E-0
3
9.45
E-0
3
Q 1
.5
Q 2
.33
Q 2
5
Q 1
.5
Q 2
.33
Q 2
5 Tabl
e 3.
Yel
low
ston
e R
iver
stre
am p
ower
dat
a ta
ble
Stu
dy re
ach
Slo
pe
Wid
th (m
)
Dis
char
ge
( m3 s-1
)
Uni
t Stre
am
Pow
er
(kg
s-3)

- 45 -
Stil
lwat
er
5.08
E-0
3
43.8
9
164.
2
198.
2
334.
1
1.90
E-0
2
2.29
E-0
2
3.87
E-0
2
Cla
rk's
For
k
8.32
E-0
4
65.2
9
192.
6
229.
4
337
2.45
E-0
3
2.92
E-0
3
4.29
E-0
3
Big
horn
4.42
E-0
4
83.0
4
181.
2
243.
5
501.
2
9.65
E-0
4
1.30
E-0
3
2.67
E-0
3
Ros
ebud
5.51
E-0
3
11.1
7
7.1
11.3
53.5
3.49
E-0
3
5.59
E-0
3
2.64
E-0
2
Tong
ue
4.03
E-0
3
44.9
75.3
118.
9
258.
2
6.76
E-0
3
1.07
E-0
2
2.32
E-0
2
Pow
der
2.55
E-0
3
104.
12
148.
7
257.
7
821.
2
3.64
E-0
3
6.32
E-0
3
2.01
E-0
2
O'F
allo
n
5.53
E-0
4
24.0
2
14.2
31.1
150.
1
3.26
E-0
4
7.17
E-0
4
3.46
E-0
3
Q 1
.5
Q 2
.33
Q 2
5
Q 1
.5
Q 2
.33
Q 2
5
Tabl
e 4.
Trib
utar
y st
ream
pow
er d
ata
tabl
e
Trib
utar
y
Slo
pe
Wid
th (m
)
Dis
char
ge
( m3 s-1
)
Uni
t Stre
am
Pow
er
(kg
s-3)

- 46 -
Ratios of unit stream power for tributaries divided by unit stream power of the
Yellowstone River are presented in Table 5. Stream power ratios calculated at the
Stillwater, Rosebud, and Tongue River confluences were greater than one. Stream power
ratios calculated at Clark’s Fork, Bighorn, Powder, and O’Fallon confluences were less
than one. A graphic summary of anabranch behavior on the Yellowstone River at each
tributary junction is presented in Figure 22. Anabranch character at major tributary
junctions has a high degree of variability. A Student’s t-test analysis, comparing
anabranch character immediately downstream from all seven tributary junctions show a
high degree of variability (p = 0.000293). In this analysis, the number of anabranch
channels downstream from each tributary junction was compared to the number of
anabranch channels at all other tributaries. There is high variability between anabranch
characteristics downstream from each of the seven tributary junction.
Variance analysis was also conducted on anabranch character downstream from
tributaries with high stream power ratios (Stillwater, Rosebud and Tongue). In this
analysis, only anabranch character downstream from the Stillwater, Rosebud and Tongue
River confluences were compared. This analysis shows a low degree of variability (p =
0.4608). The low degree of variability between number of channels downstream from
the Stillwater, Rosebud and Tongue River confluences suggests no significant difference
in the anabranch character of these reaches.
The correlation between stream power ratio and change in anabranch intensity
within 1,600 m downstream from the tributary junction had an R2 value of 0.38 (Fig. 23).
Change in anabranch intensity is the difference in number of channels measured at the

- 47 -
tributary confluence and at a cross section 1.6 km downstream from the confluence. For
example, number of channels at the Stillwater River confluence increases from one to
four within 1.6 km downstream; the change in anabranch intensity is three.
Autocorrelation analysis of number of channels along the Yellowstone River indicates
correlation for a range of 1.6 km (one river mile) downstream. Beyond 1.6 km, there is no
longer correlation between number of channels at cross sections. Although the
correlation is positive, the linear model explains less than 40% of the variance.
Table 5. Ratio of tributary stream power to Yellowstone River stream power Unit Stream Power Ratio
Tributary/Yellowstone Figure 20 ID
Drainage Basin Area
(km2)
Tributary Q 1.5 Q 2.33 Q 25
A 2525 Stillwater 2.47 2.45 2.6 B 2989 Clark's Fork 0.27 0.26 0.23 C 59272 Bighorn 0.32 0.35 0.41 D 3402 Rosebud 1.24 1.62 4.19 E 13978 Tongue 2.61 3.34 4.37 F 34159 Powder 0.45 0.64 0.96 G 4148 O'Fallon 0.09 0.16 0.37

- 48 -
Figure 22. Profiles of anabranch intensity at tributary junctions along the lower Yellowstone River. Tributary junction location marked by cross, ratio of tributary stream power to Yellowstone River stream power referenced at tributary confluence.
- 49 -
.
Figure 23. Ratio of tributary stream power to Yellowstone River steam power as versus change in anabranch intensity at a confluence (R2=0.38).
Bedrock and Valley Width Influence on Anabranch Character
Bedrock geology of valley walls and valley width were identified and measured in
order to test for possible controls. The Yellowstone River intersects 20 different
stratigraphic units, mainly sandstones and shales. Stratigraphy of rock units exposed in
the lower Yellowstone River valley and description of bedrock lithology are presented in
Tables 1 and 6. The river valley width in the study reach varies from approximately 1 to
just over 11 km (Fig. 24). I hypothesized that bedrock resistance to erosion is correlated
with valley width, and that valley width is correlated to number of anabranched channels.

- 50 -
Lith
olog
y (B
alst
er, 1
980)
Unc
onso
lidat
ed w
hite
to b
uff c
alca
reou
s sa
ndst
one
and
gray
sh
ale,
muc
h lig
nite
.
Yel
low
san
dsto
ne, b
uff s
andy
sha
le, c
arbo
nace
ous
shal
e, c
oal
and
clin
ker.
Gen
eral
ly d
ark
shal
e
A se
quen
ce o
f yel
low
san
dsto
ne, s
andy
sha
le, c
arbo
nace
ous
shal
e an
d nu
mer
ous
thin
, im
pure
coa
ls.
Vol
cani
clas
tic c
ongl
omer
ate,
san
dsto
ne a
nd m
udst
one.
Vol
cani
c flo
ws,
sills
, tuf
fs a
nd b
recc
ia (R
ober
ts, 1
972)
.
Inte
rbed
ded
sand
ston
e, s
iltst
one
and
shal
e, s
ever
al c
oal a
nd
ligni
te b
eds.
Alte
rnat
ing
beds
of s
ands
tone
and
cla
ysto
ne (s
hale
, som
e lig
nite
).
Gra
y to
whi
te, f
ine-
to m
ediu
m-g
rain
ed, n
on-c
alca
rious
san
dsto
ne.
Par
tly a
rgill
aceo
us w
ith s
ome
pink
and
bla
ck a
cces
sory
min
eral
s.
San
dsto
ne y
ello
wis
h to
bro
wni
sh w
hen
wea
ther
ed.
Whi
te to
yel
low
ish
(wea
ther
ed),
fine-
to m
ediu
m-g
rain
ed, p
orou
s sa
ndst
one.
Gra
y to
whi
te, f
ine-
to m
ediu
m-g
rain
ed, n
on-c
alca
rious
san
dsto
ne.
Par
tly a
rgill
aceo
us w
ith s
ome
pink
and
bla
ck a
cces
sory
min
eral
s.
San
dsto
ne y
ello
wis
h to
bro
wni
sh w
hen
wea
ther
ed.
Res
ista
nt/
N
on-re
sist
ant
R
R
N
R
R
R
R
R
R
R
Geo
logi
c ab
brev
iatio
n
Tfld
Tftr
Tfle
Tft
Klsr
Kl
Khc
Kfh
Kfc
Kftt
Tabl
e 6.
Bed
rock
lith
olog
y an
d er
osio
n re
sist
ance
of l
ower
Yel
low
ston
e R
iver
Geo
logi
c Fo
rmat
ion
Ludl
ow /
Fort
Uni
on F
orm
atio
n
Tong
ue R
iver
Mem
ber (
of F
ort
Uni
on F
orm
atio
n)
Lebo
Mem
ber (
of F
ort U
nion
Fo
rmat
ion)
Tullo
ck M
embe
r (of
For
t Uni
on
Form
atio
n)
Slid
e R
ock
Mou
ntai
n Fo
rmat
ion
(vol
cani
clas
tics
of L
ivin
gsto
n G
roup
)
Lanc
e Fo
rmat
ion
Hel
l Cre
ek F
orm
atio
n
Foxh
ills S
ands
tone
For
mat
ion
Col
gate
Mem
ber o
f Fox
Hills
Fo
rmat
ion
Tim
ber L
ake
and
Trai
l City
M
embe
rs, u
ndiv
ided
Tim
ber L
ake
Mem
ber (
Fox
Hills
For
mat
ion)

- 51 -
Dar
k gr
ay, p
artly
silt
y to
san
dy s
hale
. Abu
ndan
t ben
toni
te b
eds
and
scat
tere
d co
ncre
tions
.
Dar
k cl
ay s
hale
, fis
sle
and
foss
ilifer
ous,
with
man
y ca
lcar
eous
con
cret
ions
.
Buf
f to
tan,
mas
sive
san
dsto
ne (o
utcr
op),
buff
to w
hite
(sub
surfa
ce) f
ine-
to
coar
se-g
rain
ed, p
artly
sal
t-and
-pep
per.
Indi
vidu
al b
eds
5 to
50
feet
thic
k.
Inte
rbed
s of
gra
y to
bla
ck, o
ften
carb
onac
eous
, sha
le a
nd s
ilty
shal
e. S
ome
ligni
te
and
coal
sea
ms.
Dar
k gr
ay to
gra
y sh
ale.
Upp
er p
art m
ay c
onta
in th
in, g
ray
sand
ston
e la
min
ae
and
beds
. Lo
wer
par
ts o
ften
cont
ain
light
gra
y, c
alca
rious
(fos
silif
erou
s)
conc
retio
ns.
Sand
ston
e, w
hite
, fin
e- to
med
ium
-gra
ined
, ind
ivid
ual c
liff-f
orm
ing
beds
up
to 5
0 fe
et th
ick.
Muc
h gr
ay s
andy
sha
le a
nd s
ome
inte
rbed
ded
ligni
te a
nd c
oal s
eam
s.
Yel
low
(out
crop
) to
gray
-whi
te (s
ubsu
rface
), pa
rty s
haly
san
dsto
ne a
nd s
andy
sh
ale
and
gray
sha
le. U
sual
ly th
in b
edde
d.
Gra
y to
dar
k gr
ay m
arly
sha
le, w
eath
ers
whi
tish;
loca
lly a
lmos
t a s
haly
lim
esto
ne.
Dar
k gr
ay, p
artly
silt
y to
san
dy to
ben
toni
tic s
hale
in s
ubsu
rface
. In
out
crop
ofte
n lig
hter
col
or a
nd w
ith c
alca
reou
s co
ncre
tions
, ben
toni
te a
nd s
ome
iron-
stai
ned
conc
retio
ns.
Gra
y to
bla
ck s
hale
, iro
nsto
ne c
oncr
etio
ns, n
umer
ous
bent
onite
bed
s.
Sur
face
; lig
ht g
ray
to s
ilver
-gra
y, p
late
y to
blo
cky
shal
e an
d th
in-b
edde
d gr
ay s
iltst
one
or
very
fine
gra
y sa
ndst
one
lam
inae
or b
eds;
ben
toni
te v
arie
s fro
m c
omm
on to
abu
ndan
t.
Sub
surfa
ce; d
ark-
brow
n to
bla
ck, h
ard,
blo
cky
shal
e w
ith th
in la
min
ae a
nd in
terb
eds
of g
ray-
whi
te s
ilice
ous
silts
tone
and
ver
y fin
e-gr
aine
d, o
ften
mic
aceo
us to
gla
ucon
itic
sand
ston
e.
Ben
toni
te b
eds.
Fis
h sc
ales
.
N
N
R
N
R
N
N
N
N
N
Kp
Kb
Kjr
Kcl
Ke
Ktc
Kn
Kca
Kbf
Km
Tabl
e 6
– C
ontin
ued
Pie
rre
Sha
le F
orm
atio
n
Bea
rpaw
Sha
le
Form
atio
n
Judi
th R
iver
For
mat
ion
Cla
gget
t Sha
le F
orm
atio
n
Eag
le S
ands
tone
Fo
rmat
ion
Tele
grap
h C
reek
Fo
rmat
ion
Nio
brar
a Fo
rmat
ion
Car
lile S
hale
For
mat
ion
Bel
le F
ourc
he S
hale
Fo
rmat
ion
Mow
ry S
hale
For
mat
ion

- 52 -
Figure 24. Distribution of valley width along the lower Yellowstone River
Specifically, I hypothesized that valley walls with erosion-resistant rock would
correlate with narrow valley widths and valley walls with less erosion-resistant bedrock
would correspond with wider valleys. To test this hypothesis, each bedrock unit
intersecting the Yellowstone River valley was analyzed individually. A comparison was
made between valley width measurements along the river corridor and relative resistance
to erosion of the valley walls.
The mode of valley widths adjacent to erosion resistant bedrock is three km. The
mode of widths adjacent to non erosion-resistant bedrock is 6.5 km (Fig.25). A box and
whisker plot is used to show the distribution of valley width measurements through both
erosion-resistant rock units and non erosion-resistant to erosion rock units (Fig. 26). The
mean valley width in resistant bedrock areas was 3.56 km with a standard deviation of
1.60 (n = 719). The mean valley width in non-resistant bedrock reaches was 6.09 km with

- 53 -
a standard deviation of 1.77 (n = 234). The difference in means was 2.52 km, greater
than one standard deviation for either bedrock type.
Figure 25. A. Frequency of valley width relative to level of bedrock resistance to erosion. B. Normalized distribution of valley width relative to bedrock resistance to erosion (frequency normalized to total count in class).

- 54 -
Figure 26. Bedrock hardness (relative resistance to erosion) and valley width on the lower Yellowstone River. Plot represents maximum, 75%, median, 25%, and minimum values.
Results of an ANOVA (Student’s t-test) indicate that there is a statistically
significant difference between valley width through relatively resistant bedrock and
relatively non-resistant bedrock (p= 1.8E-33, at a 95% confidence level). Valleys are
wider through relatively non-resistant bedrock units (predominantly shale) and narrower
through more resistant bedrock units (predominantly sandstone). The relationship
between bedrock resistance to erosion and valley width is strongest within 3.2 km (two
miles) of the contact (correlation coefficient, γ = 0.532) (Fig. 27). Bedrock units which
are less resistant to erosion correlate with wider valley sections, and bedrock units which
are more resistant to erosion correlate with narrower valley sections within two

- 55 -
downstream river miles. Further than two miles downstream from a given bedrock unit,
valley width is less strongly correlated.
Figure 27. Correlation of bedrock resistance to erosion and valley width as a function of distance downstream.
Bedrock was hypothesized to control anabranch character of the Yellowstone
River. Bedrock units along the Yellowstone River valley are categorized according to
relative resistance to erosion: more resistant to erosion (predominantly sandstone) and
less resistant to erosion (predominantly shale). Cross sections through relatively non-
resistant bedrock units with low slopes and wide valleys were expected to have more
anabranch channels. Anabranch character was also considered in relation to relative
hardness of local bedrock lithology. The mean number of anabranch channels through
both resistant and non-resistant bedrock units was two; ranges for anabranch distribution
were nearly the same (Fig. 28). The mean number of channels in resistant bedrock areas
was 1.99 with a standard deviation of 1.01. The mean number of channels in non-
resistant rock was 2.21, with a standard deviation of 1.13. An ANOVA (Student’s t-test)

- 56 -
variance analysis test on the data yields a p-value of 0.000329, at a 95% confidence level
(statistically significant difference).
Frequency of Number of Anabranch Channels and Bedrock Erosion Resistance
Figure 28. Frequency and cumulative percent of anabranch pattern and bedrock hardness (relative resistance to erosion) on the lower Yellowstone River.
However, correlation analysis of bedrock resistance to erosion and number of
channels at distances downstream indicates negligible correlation (Fig. 29). Although
correlation is generally weak, as indicated by the variogram in Figure 29, the greatest
correlation between bedrock and anabranch character exists within two river miles (3.2

- 57 -
km) (γ= 0.122). Beyond two river miles (3.2 km), correlation between bedrock and
number of channels diminishes.
Figure 29. Correlation between bedrock resistance to erosion and number of channels downstream.
In order to test valley width as a control on anabranch river character, the number
of anabranched channels at cross sections were measured and compared to valley width
measurements at the same cross section (Fig. 30 and Table 7).
Figure 30. Valley width and anabranch intensity on the lower Yellowstone River. Plot represents maximum, 75%, median, 25%, and minimum values.

- 58 -
Table 7. Statistics on valley width and anabranch intensity
Number of Channels 1 2 3 4 5 6 7 n 346 340 176 70 17 4 1 Mean Valley Width (km) 4.08 4.19 4.27 4.31 4.43 4.55 3.01 Standard Deviation 1.73 1.95 2.18 2.43 2.31 1.54 n/a
Statistical analysis on valley width and anabranch intensity excludes reaches with
six and seven channels due to low n value (four and one respectively). The maximum
difference in means is 0.35, between one and five channels, which is less than the
minimum standard deviation, 1.54 (Table 7). ANOVA (Student’s t-test) results of
variance between valley width measurements of channel groups one through five yield a
p-value of 0.7620, at a 95% confidence level. Furthermore, a regression line applied to
the data had an R-squared value of 0.001427 (Fig. 31). Reach sections with the most
anabranch channels, six and seven channels, are predominantly in average to low valley
width sections (3 to 4 kms, respectively) (Figs. 26 and 31). Correlation between number
of channels and valley width is very low.
Spatial correlation analysis of valley width measurements and number of channels
suggest negligible correlation (γ < 0.04) (Fig. 32). Although correlation is on the whole
negligible, the greatest correlation exists within 1.5 downstream river miles (γ= 0.037).
Beyond four downstream miles, the relationship between valley width and number of
channels becomes negative.
- 59 -
Figure 31. Scatter plot of valley width and anabranch intensity on the lower Yellowstone River. R squared = 0.0014
Figure 32. Correlation between valley width and number of channels downstream.
I also conducted a spatial correlation analysis on valley width and associated
number of channels in an upstream direction. The zone of maximum influence is between
0 and three river miles. Valley width and number of channels are best correlated between

- 60 -
2 and 2.5 river miles lag upstream; that is, high intensity anabranching reaches tend to be
located between 2 and 2.5 river miles upstream from wide valley reaches. In general
however, spatial correlation between valley width and upstream anabranch activity is
negligible (γ= 0.045-0.046).
A summary of all the data collected from Springdale, MT to the Missouri River
confluence is presented in Figure 33. The black block is a place where alternation of
relative resistance to erosion is too frequent to plot clearly at the scale of the figure. As
statistics presented earlier in the results section show, there is a noticeable relationship
between erosion resistance of bedrock and valley width. However, it is difficult to see
any relationship between number of channels and valley width, bedrock, or location of
tributaries (Fig. 33). Details will be examined in the Discussion.

- 61 -
Figu
re 3
3. S
umm
ary
figur
e of
geo
mor
phic
pro
perti
es o
f low
er Y
ello
wst
one
Riv
er

- 62 -
CHAPTER FIVE
DISCUSSION
Tributary Junction Analysis
Tributary junctions have been identified as factors which influence anabranch
intensity (Tooth and Nanson, 1999), but the relationship has not been rigorously tested.
Only some tributaries would be expected to produce increased anabranch frequency.
Tributary streams with high stream power relative to the main stem and which have high
bedload transport would be expected to have the potential to increase anabranch intensity.
Important variables that potentially affect anabranching related to tributary junctions are
shown in Equation 1. Slope represents one of these important factors.
Analysis of slope data from three, approximately 80 km, reaches where both
LIDAR and topographic map data is available indicated no substantial difference
between slope values derived from 1:24000 scale topographic maps and slope values
from LIDAR data (Fig. 16). LIDAR data availability for the Yellowstone River corridor
is limited, therefore topographic maps were used to derive slope. The similarity between
these methods supports the validity of using 1:24000 scale topographic maps for deriving
slope for stream power calculations.
Slope is often considered a driver of channel pattern (Rosgen, 1994; Montgomery
and Buffington, 1998). At the scale measured, slope does not appear to control channel
pattern (Fig. 33). Change in slope of the lower Yellowstone River generally decreases

- 63 -
toward the confluence with the Missouri River and does not appear to correlate with
changes in channel anabranch character (Fig. 33). A spike in the change in slope curve
may suggest a local base level, knick point, or change in sediment caliber or hydraulic
geometry (Ferguson and Ashworth, 1991). The peaks in change in slope between River
Mile Markers 150-175 (approximately 225-300 km upstream from the confluence with
the Missouri River) and the predominantly single channel reach between River Mile
Markers 125-175 (approximately 200-250 km upstream from the confluence with the
Missouri River) coincide with a series of bedrock grade controls related to the Fort Union
Formation between Miles City and Glendive, MT. The Tullock Member of the Fort
Union Formation, a predominantly sandstone unit, is classified as relatively resistant to
erosion. The channel pattern may be single channel through this reach as a result of
localized incision and down cutting. However, at the scale measured, neither slope nor
change in slope appear to control anabranch pattern on the lower Yellowstone River
(Fig.33).
Although slope derived from topographic maps was comparable to high resolution
LIDAR data, topographic map data is far coarser than field data, and therefore can not be
considered entirely conclusive. It has been suggested that in order to secure
independence of control variables, valley (not channel) gradient should be used to
determine stream power (Carson, 1984b; Ferguson, 1984). However, for the purposes of
this study, conventional methods, using channel slope, were followed. Error associated
with using channel slope in place of valley gradient may have influenced the outcome.
Another possible source of error rests in the uncertainty of averaging slope of an

- 64 -
anabranched river system by measuring only the slope of the dominant channel (channel
centerline established by Applied Geomorphology Inc. and DTM Consulting Inc., 2004).
Anabranched channels can have many slopes in a reach, consequently selection of the
main channel may have been inappropriate.
Temporal variability of sediment delivered from tributaries is another variable
which has not been thoroughly considered in this investigation. Due to the considerable
spatial scale of the Yellowstone River drainage basin, tributaries often experience
discharges that are not achieved at the same time in the main channel. For example,
mean monthly discharge trends for the Bighorn, Powder and Tongue Rivers all show
initial increases in flow in March, while the Yellowstone River remains at low flow
levels (Figs. 9 and 10). Pulses of sediment may result from landslide and/or local
extreme rainfall events within tributary basins that are reworked and delivered to the
main stem. If a single tributary recently experienced a 50-year event or a large debris
flow, it might have added a sediment slug that requires reduction, resulting in increased
anabranching near the confluence. If the Yellowstone River headwaters have
experienced a high effective discharge more recently than the tributary, such a slug might
have been transported some great distance downstream. With this limited analysis, it
remains uncertain as to whether a zone of increased anabranching is attributable to the
influence of a tributary.
Sediment delivery from tributaries is influenced by dams within the tributary
catchment. Two tributaries to the lower Yellowstone River have dams: the Tongue River
Dam, on the Tongue River, and Yellowtail Dam, on the Bighorn River. The Tongue

- 65 -
River Dam was constructed in 1940, and the Yellowtail Dam was constructed in 1967.
These impoundments may be limiting delivery of sediments to the Yellowstone by
regulating flows and impeding sediment transport (Fig.7). Anabranched islands appear to
be consistent over time (since 1950; Figs. 11-13), therefore effects of these
impoundments are unlikely to have had a significant influence on the anabranch system
of the lower Yellowstone River.
Effective discharge is another important variable used in calculating stream power
(Equation 1), and is defined as the increment of water that transports the most bedload
(Andrews, 1980). The anabranched islands of the Yellowstone River consist of bedload
material, predominantly cobbly gravel clasts (Zelt et al., 1999). With this in
consideration, calculations for stream power included effective discharge. Wolman and
Miller (1960) suggest that channel geometries are formed by discharges with recurrence
intervals on the order of one year and correspond roughly to bankfull discharge.
However, Ashmore and Day (1988) suggest that there is no generally applicable
recurrence interval for effective discharge. Nash (1994) observes that the recurrence
interval of the effective discharge is highly variable, ranging from one week to several
decades (>37 years). Due to this discrepancy, stream power was calculated at several
discharge magnitudes, Q1.5, Q2.33, and Q25.
Effective discharge was estimated in order to calculate stream power (Equation 1;
Table 3) and thereby determine the ability of a tributary to transport sediment relative to
the Yellowstone River at a confluence. An explanation for the selection of discharge
magnitudes is presented in the Methods section. Q1.5 estimates for sites along the

- 66 -
Yellowstone River range from 991.9 to 1428 cumecs, Q2.33 estimates range from 1204 to
1711 cumecs, and Q25 estimates range from 1917 to 3622 cumecs (Table 3). Effective
discharge estimates for sites on the Yellowstone River are consistently higher than
effective discharge estimates of nearby tributaries. For example, estimate Q2.33 for the
Bighorn River is 243.5 cumecs, and estimate for the Yellowstone River at the Bighorn
River confluence is 1326 cumecs. Most bedload transport in the Yellowstone River
occurs at much higher flows than does most transport in the major tributaries. Q2.33 was
selected as an index for analysis because the various discharge classes are analogous and
it is the discharge estimate most commonly used by the U.S. Geological Survey.
Stream power reflects the ability of the channel to transport sediment load
(Bagnold, 1966; Ferguson, 1981; Knighton, 1999). The ratio of tributary stream power to
Yellowstone River stream power was used to indicate the relative magnitude of the two
converging flows. A stream power ratio less than one indicates that at the confluence, the
stream power of the Yellowstone River is higher than the stream power of the tributary.
A stream power ratio less than one implies a transport dominated system, therefore less
potential for sediment storage. Fewer anabranched channels are expected at these
confluences (Fig. 34a). Conversely, a stream power ratio greater than one indicates that,
at the confluence, the tributary has a higher stream power and the capacity to transport
more sediment, than the Yellowstone River at the confluence. A stream power ratio
greater than one implies a supply dominated system. I hypothesized that, at these
confluences, the Yellowstone River is less capable of sediment transport than the

- 67 -
tributary, and as a result more sediment will accumulate thus increasing the number of
channels downstream (Fig. 34b).
Figure 34. Hypothesized anabranch system at tributary junctions according to relative stream power of tributary and Yellowstone River. Arrows indicate relative stream power magnitude. a.transport dominated system (ωt/ωY <1), b. supply dominated system (ωt/ωY >1).
The largest tributaries included in the stream power analysis were selected by
drainage basin area. Distribution of tributary basin sizes is log normal (Fig.18). The
tributary basins selected for study are the uppermost 20th percentile of the log normal
distribution of drainage area, or basins greater than 1,500 km2. The largest basins were
selected because they have the largest potential to influence channel geometry of the
Yellowstone River. The tributaries included in the stream power analysis are the
Stillwater River, Clark’s Fork River, Bighorn River, Rosebud Creek, Tongue River,
Powder River, and O’Fallon Creek.
The stream power ratio is potentially geomorphologically significant in that a
tributary with a high stream power ratio may deliver sediment into the main channel
which cannot easily be transported downstream. I hypothesized that increased sediment
load in the main channel (high stream power ratio) may, in turn, result in an increased
- 68 -
number of anabranch channels. Confluences, at the Tongue, Rosebud, and Stillwater
Rivers have the highest stream power ratios (Table 5); the ratios are greater than one, and
therefore the tributaries are expected to have the most geomorphic influence on the
Yellowstone River channel pattern.
Analysis was conducted in order to test for a pattern between relative stream
power of tributary to main stem and the level of anabranching downstream from the
confluence. Detailed investigation indicated that channel pattern is unique at each
tributary junction (Fig. 22). Behavior of channel pattern at each tributary confluence is
discussed in order of increasing value of stream power ratio. The Bighorn and O’Fallon
Rivers have stream power ratios less than one and therefore were hypothesized to be less
likely to impact the sediment load and deposition in the Yellowstone River. Channel
pattern near the Bighorn River junction is anabranching (between 2-5 channels). Channel
pattern upstream and downstream of the O’Fallon River junction is single thread.
Channel pattern upstream shows little to no difference from the channel pattern
downstream of these tributary junctions. These two tributaries have little discernable
influence on the level of anabranching downstream from their confluence with the
Yellowstone River.
The Yellowstone River pattern also exhibits little change at the Powder River
confluence, where the stream power ratio is less than one. The channel briefly alternates
from one to two channels both upstream and downstream from the confluence. Due to
the low stream power ratio value and the low D50 (low median particle size) of the
Powder River, channel pattern of the Yellowstone is probably not strongly influenced by

- 69 -
input at this confluence (Lambing and Cleasby, 2006). The Powder River is a unique
tributary in that, although it is a substantial source of sediment to the main stem (Miller et
al., 2005), it delivers mostly suspended sediment (approximately 2-3 million metric tons
per year) (Moody and Meade, 1990). As the anabranch islands of the lower Yellowstone
River are predominantly bedload material (Zelt et al., 1999), high suspended sediment
yield from the Powder River basin is not considered a dominant driver of channel pattern.
Clark’s Fork River also has a stream power ratio less than one, and was therefore
hypothesized to have little control on channel pattern of the Yellowstone River. Despite
this, the Yellowstone River displays unique behavior where the Clark’s Fork River
enters: a sudden and brief switch from multiple channel system to single thread
approximately five km downstream from the confluence. The channel remains single
thread for a short reach before becoming progressively more anabranched downstream.
Multiple-channel pattern decreases to single thread at five km downstream from the
tributary junction. This change is probably not due to change in bedrock lithology as the
Yellowstone River, both upstream and downstream from the confluence, flows through
three predominantly shale units: Niobrara Formation, Mowry Shale, and Belle Fourche
Shale (Appendix A). Predominantly shale valley lithology is not resistant to erosion and
is not likely to drive confinement of flow into one channel. The single channel reach
may be related to local scour at the confluence creating a deeper, narrower channel with
higher stream power and greater ability to transport sediment, as suggested by Robert
(2003). The single channel reach could also be a result of a wad of sediment which was

- 70 -
delivered by a tributary, deposited, subsequently cut by the Yellowstone River, leaving a
terrace which confines flow into a single channel.
Conversely, I hypothesized that anabranch character immediately downstream
from the Rosebud, Stillwater and Tongue confluences would be more developed because
the stream power ratios are greater than one. Although Rosebud Creek has a low Q2.33, it
is a narrow channel that enters the Yellowstone River at a fairly steep gradient (5.51E-03)
and thus has a relatively high stream power relative to the Yellowstone River. The
Stillwater and Tongue Rivers also have relatively steep gradients and moderate channel
width measurements. The Stillwater and Tongue Rivers have the highest stream power
ratios, and each exhibit increased levels of anabranching downstream from their
confluences.
There is a trend in the increase in anabranched channels downstream from the
Stillwater, Rosebud and Tongue confluences. These tributary basins may potentially
deliver high sediment loads to the Yellowstone River, which are subsequently being
deposited within the channel as islands, or contributing to channel avulsion, as
hypothesized. Although these confluences have high stream power ratios and
anabranching character of the Yellowstone at these confluences is similar, channel
pattern may be influenced by an alternate driving force.
Anabranch character of the Yellowstone at the Stillwater, Rosebud and Tongue
confluences is similar. The Yellowstone River, at these three tributary confluences,
exhibits a single-channel pattern. Also, at each confluence, the Yellowstone River valley
cuts through relatively erosion resistant bedrock units. The Yellowstone River

- 71 -
downstream from the Stillwater confluence increases to four channels within two km
(Fig. 22). Valley walls at the Stillwater and Yellowstone confluence are alternating beds
of sandstone and claystone of the Hell Creek Formation. The Yellowstone River
downstream from the Rosebud confluence increases to five channels within six km (Fig.
22). Valley walls at the Rosebud and Yellowstone confluence are also sandstones and
claystones of the Hell Creek Formation. The Yellowstone River downstream from the
Tongue confluence increases to four channels within 5 km, but maintains single-channel
pattern for two km downstream before developing into an anabranched system (Fig. 22).
Valley walls at the confluence of the Tongue and Yellowstone Rivers are predominantly
sandstone with interbedded shales of the Tullock Member of the Fort Union Formation.
The variation in anabranch development may be partially in response to local variations
in bedrock erosion resistance.
In summary, the anabranch profiles of the Yellowstone River at all seven studied
confluences are highly variable. There is no clear trend between channel pattern at the
Clark’s Fork, Bighorn, Powder and O’Fallon confluences. These tributary confluences
have stream power ratios less than one and have a high degree of variability (statistically
significant difference) in their downstream channel pattern. These tributaries have low
stream power relative to the Yellowstone, and therefore have less influence on channel
pattern. On the other hand, tributaries with stream power ratios greater than one may be
influencing anabranch channel system of the lower Yellowstone River. There is a trend
in increased number of anabranched channels downstream from the Stillwater, Rosebud,
and Tongue River confluences; these tributaries all have high stream power relative to the

- 72 -
Yellowstone and therefore have more influence on channel pattern. Overall, there is
limited correlation between the stream power ratio and change in anabranch intensity
downstream (r 2 = 0.38, Fig. 23).
The profiles in Figure 22 exhibit anabranch variation in upstream and downstream
reaches and some display distinct single channel character immediately at the tributary
junction. Channel incision due to increased flow at the confluence may explain this trend
(Robert, 2003). Contrary to my hypothesis, the tributary junctions may explain the local
absence of multiple-channel pattern more so than the presence of anabranch character.
There is likely a suite of driving forces that influence channel system behavior.
This study could be expanded to include further analysis on long-term channel incision
rates, sediment transport, anabranch island morphology, and island composition.
Furthermore, samples of bedload material from sites along the Yellowstone River and
each major tributary could be used in conjunction with stream power calculations to
develop a better understanding of sediment transport at these confluence systems. An
investigation of mean particle size between the Yellowstone River and the entering
tributaries could also benefit the study by explaining the relative amount and caliber of
sediment being delivered to the Yellowstone. Finally, applying this study to other natural
anabranching fluvial systems could potentially aid in our understanding of anabranching
systems character and development.

- 73 -
Bedrock and Valley Width Analysis
A description of the geologic units exposed along the lower Yellowstone River
valley and their relative resistance to erosion is given in Table 2. Bedrock is classified as
erosion resistant or non erosion resistant based on lithologic descriptions given by Balster
(1980) (Table 6). Different rock types have variable resistance to erosion depending on
mineralogy, chemistry, climate and weathering regime. For this study, predominantly
shale units are classified as relatively non-resistant to erosion and predominantly
sandstone units are classified as relatively resistant to erosion. Mudstones and shales are
less resistant to erosion than sandstones, in part because smaller grain size requires less
stream power for transport. Furthermore, sandstones tend to be cemented, and are
therefore more resistant to erosion. Rock structure also plays a role in susceptibility to
erosion. Fractures, faults, and joints are preferred zones of erosional weakness, where
fluvial erosion and other surface processes can act to carve the landscape. This analysis
does not incorporate variable erosion potentials due to mountain belts and uplifted areas
with folded rock structure. Geologic units along the lower Yellowstone River are
predominantly Cretaceous and Tertiary age sandstones and shales.
I hypothesized that bedrock resistance to erosion controls valley width. In order to
test this, valley width measurements and local bedrock lithology were analyzed for
correlation. Valley width is generally correlated with local bedrock lithology. There is a
significant difference between valley width in resistant and non-resistant bedrock reaches
(p= 1.8E-33). The data confirmed the hypothesis that valley width tends to be greater
through less resistant bedrock than through resistant bedrock. Predominantly shale
- 74 -
bedrock units are less erosion resistant and more frequently have wider valleys than do
predominantly sandstone units.
Valley width patterns are distinctly different in the upper and lower sections of
the study reach. In the upper section of the study reach, (River Mile Marker 477 to 238)
relatively resistant bedrock formations correspond with narrow sections of the valley,
whereas relatively non-resistant bedrock formations correspond with wide valley sections
(Fig. 33). Valley walls composed of relatively erosion-resistant bedrock, like sandstone,
tend to be narrower and thereby constrict the flood plain area. Conversely, valley walls
composed of relatively non-resistant bedrock, like shale, tend to be wider, with greater
alluvial surface area (Figs. 25, 26, 27). Bedrock resistance to erosion exhibits less control
on valley width in the lower section of the study reach, as demonstrated by River Mile
Markers 148 to 0 (Fig. 33). This could be due to general widening of the river channel
and valley in the downstream direction, or perhaps related valley widening as a result of
Glacial Lake Glendive (Fig. 6).
Relatively non-resistant bedrock generally corresponds with greater valley width,
which suggests increased erosion of valley walls and less valley-wall constriction of the
river channel. The relationship between bedrock erosion resistance to valley width is
strongest within 3.2 km (two miles) of the contact (correlation coefficient, γ =0.53; Fig.
27). For example an erosion-resistant bedrock section may correlate directly with a
narrow valley and the valley section up to 3.2 km (two miles) downstream from the
erosion-resistant bedrock unit. Farther than 3.2 km (two miles) from contact, the
correlation diminishes with increasing distance downstream (Fig. 27).

- 75 -
The decline in correlation could be a reflection of the assessment and
categorization of erosion-resistant vs non erosion-resistant bedrock lithologies. I sub-
divided bedrock units into two groups: erosion-resistant and non erosion-resistant, based
on lithologic descriptions (Balster, 1980). Bedrock units were sorted according to
dominant lithology. However, most units consist of a combination of rock types with
various levels of erosion resistance. For instance, the Lance Formation is described as an
interbedded sandstone, siltstone, and shale, and is categorized as erosion-resistant.
Analysis of all cross sections through sections of the Lance Formation are classified as
erosion-resistant bedrock, yet any specific cross-section within that unit may be through a
siltstone or shale bed (non erosion-resistant). By lumping bedrock into two groups,
details of lithologies are lost.
Although there is a strong relationship between relative erosion resistance and
valley width, the data suggested that erosion resistance only moderately influences
anabranch intensity on the lower Yellowstone River. I hypothesized that bedrock
resistance to erosion controls anabranch river system. I expected to find that cross
sections with more anabranched channels correlate with less erosion resistant bedrock
units, and that cross sections with fewer channels correlate with erosion resistant bedrock
units.
The data suggest a weak correlation between bedrock erosion resistance and
anabranch river pattern. The mean number of anabranch channels through both resistant
and non-resistant bedrock units is near two (1.99 and 2.21 respectively) (Fig. 28).
ANOVA (Student’s t-test) results indicate a difference between the number of channels

- 76 -
occupied by the river through bedrock units of different resistance to erosion (p=
0.000329). According to the analysis of variance test, greater numbers of anabranched
channels occur more frequently in non erosion resistant bedrock valley sections than in
erosion resistant bedrock valley sections. However, correlation analysis of bedrock and
number of channels (Fig. 29) suggests a low to negligible correlation, and only within
two downstream river miles (γ < 0.125). The correlation does not exist beyond two river
miles. There exists a relationship between bedrock erosion resistance and number of
channels, however it is nearly insignificant.
I hypothesized that valley width controls anabranch river character. I expected to
find more anabranched channels in wider valley sections and fewer anabranched channels
in narrow valley sections. Statistical analysis on valley width and anabranch character
suggests there is negligible correlation. The ANOVA results suggest that, although
single channel reaches tend to correlate with more narrow valley sections, there is no
significant difference between valley widths at single channel cross sections and valley
widths at cross sections with multiple channels (p= 0.7620). Similarly, spatial correlation
analysis (Fig.32) indicates low spatial correlation between valley width and number of
channels downstream, and only within 3.2 km (two miles) (γ = 0.038). Narrow valley
width sections sometimes have fewer anabranched channels than do wide valley sections,
though not statistically more frequently. A regression line applied to the data had an R-
squared value of 0.0014, which suggests that roughly only 0.14% of the variation in
anabranch intensity can be explained by valley width (Fig. 31). Reach sections with the
most anabranch channels, six and seven channels, are predominantly located in average

- 77 -
to narrow valley width sections (between 3 and 4.5 km). According to the data, valley
width does not control anabranch river character.
The data indicate no correlation between valley width and expression of
anabranch intensity. A possible consideration for future research is to test control of
proximity to valley wall on channel pattern. Koch et al. (1977) proposes that the river
may tend to be single thread while flowing directly near a valley wall and alternate into
an anabranching system when flowing across the valley center, from one side of the
valley to the other.
Results suggest erosion resistant bedrock units tend to have more narrow valleys,
and, at times, exhibit fewer anabranched channels (though not statistically correlated).
Fewer anabranched channels through these sections may be a result of less available
lateral space. An increased gradient through the resistant bedrock valley section may
induce channel incision, also resulting in fewer anabranched channels. However, the
river system does not characteristically exhibit single channel behavior through resistant
bedrock units. Distribution of valley widths across cross sections of varying anabranch
intensity (number of channels) is fairly constant (Fig. 30).
Non-resistant bedrock units tend to have wider valleys and, at times, exhibit more
anabranched channels (though not statistically correlated). Through these sections, the
river system has more lateral space available for avulsion. Increased bedload deposition
might be associated with decreased gradient through non-resistant bedrock units,
resulting in channel avulsion at high flows. Due to scale of measurement, change in
channel gradient as a control on channel pattern was not tested. Gradient controls,

- 78 -
relative to bedrock resistance to erosion, on channel pattern might be tested with higher
resolution elevation data on the reach.
Complexity and Causality
There likely exists a complex network of forces controlling channel
character of the lower Yellowstone River. Anabranch drivers could depend on location.
For instance, anabranch intensity at one reach could be predominantly driven by one
factor, where as anabranch channel pattern in another reach may be a result of a different
driver. For instance, a stream reach that is influenced by tectonically-forced decrease in
gradient in one reach section and a large tributary in another reach section could exhibit
seemingly continuous anabranch system character. However, the causes of channel
character along the reach are spatially discrete.
Anabranching on the Yellowstone River could be an example of what Schumm
(1991) describes as the problem of convergence, or equifinality. Where varying causes or
processes result in similar effects, it can be difficult to infer the process or cause by
investigating the result. In the case of anabranch channel pattern, there are at least seven
different processes that could be responsible. Anabranch channel pattern can be
influenced by channel width/bedrock controls, tributary junctions, vegetation, sediment
pulses, ice jams/ debris jams, variable discharge, and tectonics. It can be difficult to
identify the true process, or processes, responsible for channel pattern, especially through
map-based interpretation alone.

- 79 -
As anabranched channels are indeed complex systems, it is conceivable that there
exist multiple causes or processes acting together to create anabranch pattern. With the
problem of multiplicity, as Schumm (1991) describes, partial explanations of various
processes must be combined to achieve a complete explanation of a natural phenomena,
such as anabranch channel pattern. The anabranch system of the Yellowstone River
could be a response to a combination of variables or to a single parameter not analyzed.
The influence of tributary junctions, valley width and bedrock resistance to
erosion on anabranch river character has been tested on the lower Yellowstone River.
Neither valley width nor bedrock erosion resistance significantly influence anabranch
channel pattern. Major tributaries with high stream power relative to the main stem do
appear to influence anabranch river pattern. Yet anabranching is not solely regulated by
tributary control, as anabranched river pattern also occurs without the influence of a
major tributary. The amount of sediment transported in at tributary junctions may not be
large enough to influence planform on the lower Yellowstone River. Results of this
investigation have identified one expected control and limited the other potential controls
on anabranch river character.

- 80 -
CHAPTER SIX
CONCLUSIONS
This investigation gives important insight to anabranch channel character and
proposed controls. The literature suggests several possible controls for anabranch river
character. In this study, select variables are tested for influence on channel pattern:
tributary junction, valley width, and bedrock resistance to erosion. The data suggest that
bedrock resistance to erosion and valley width are correlated. Erosion resistant bedrock
reaches tend to correlate with narrow valley sections; non erosion resistant bedrock
reaches tend to correlate with wide valley sections. Results reject the hypothesis that
valley width and bedrock resistance to erosion influence anabranch river character.
Variations in valley width, and likewise bedrock resistance to erosion, are only slightly
correlated with changes in anabranch river character. ANOVA results indicate a little
correlation between lithologic and valley width controls and anabranch system character,
however variograms of the data suggest low spatial correlation. Although tributary
junctions in general do not appear to influence channel pattern, major tributaries with
high stream power relative to the Yellowstone River do have some influence on
anabranch character. At confluences with tributaries of relatively high stream power,
channel pattern is characteristically single thread. Furthermore, there is a similar trend in
increased number of anabranched channels downstream from confluences with stream
power ratio greater than one.

- 81 -
More detailed investigation is suggested. Lithologic controls and valley width
proved to not be factors in anabranch river system development, therefore they can be
eliminated from further consideration when trying to understand the anabranch character
of the lower Yellowstone River. Future studies of anabranch river character development
should not focus on lithologic controls or valley width, but rather on tributary junctions
and associated stream flow variables. I would propose collection of more detailed and
precise field measurements of variables for stream power calculations, also expanding
research to other anabranch river systems. The results of this study suggest there are
multiple factors influencing channel pattern on the lower Yellowstone River. In order to
best understand the anabranched system, we must look at the combined influence of all
variables.

- 82 -
REFERENCES CITED

- 83 -
Alden, W.C., 1932, Physiography and glacial geology of eastern Montana and adjacent areas: U.S.Geological Survey Professional Paper 174, 133 p. Andrews, E.D., 1980, Effective and bankfull discharge of streams in the Yamps River Basin, Colorado and Wyoming: Journal of Hydrology, v. 46, p. 311-330. Andrews, E.D. and Nankervis, J.M., 1995, Effective discharge and the design of channel
maintenance flow for gravel-bed rivers, in Costa, J.E., et al., eds., Natural and Anthropogenic Influences in Fluvial Geomorphology, Geophysical Monograph 89: Washington D.C., American Geophysical Union, p. 151-164.
Applied Geomorphology Inc. and DTM Consulting Inc., 2004, Geomorphic
Reconnaissance and GIS Development Yellowstone River, Montana: Miles City, Custer County Conservation District, 108 p.
Ashmore, P.E. and Day, T.J., 1988, Effective discharge for suspended sediment transport in streams of the Saskatchewan River basin: Water Resources Research, v. 24, p. 864-870. Bagnold, R.A., 1966, An approach to the sediment transport problem from general physics: Geological Survey Professional Paper, v. 422, p. 11-137. Balster, C., 1980, Stratigraphic Nomenclature chart for Montana and adjacent areas, Montana Bureau of Mines and Geology: Geologic Map 8, 1 sheet. Benda, L., 1990, The influence of debris flows on channels and valley floors in the Oregon coast range, U.S.A.: Earth Surface Processes and Landforms, v. 15, p. 457-466. Birkeland, G.H., 1996, Riparian vegetation and sandbar morphology along the lower Little Colorado River, Arizona: Physical Geography, v. 17, p. 534-553. Blair, T.C. and McPherson, J.G., 1994, Historical adjustments by Walker River to lake- level fall over a tectonically tilted half-graben floor, Walker Lake Basin, Nevada: Sedimentary Geology, v. 92, p. 7-16. Burnett, A.W. and Schumm, S.A., 1983, Active tectonics and river response in Louisiana and Mississippi: Science, v. 222, p. 49-50. Carson, M.A., 1984a, Observations on the meandering-braided river transition, the Canterbury Plains, New Zealand: Part I and II: New Zealand Geographer, p. 12- 99.

- 84 -
Carson, M.A., 1984b, The meandering-braided river threshold: a reappraisal: Journal of Hydrology, v. 73, p. 315-334. Chang, H.H., 1979, Geometry of rivers in regime: Journal of the Hydraulics Division, American Society of Civil Engineers, v. 105, p. 691-706. Church, M., 1983, Pattern of instability in a wandering gravel bed channel, in Collinson, J.D. and Lewin, J., eds., Modern and Ancient Fluvial Systems: IAS University Press, Cambridge, p. 169-180. Coleman, J.D., 1969, Brahmaputra River: channel process and sedimentation: Sedimentary Geology, v. 3, p. 131-239. Collier, A.J. and Thom, W.T.Jr., 1918, The Flaxville Gravel and its relation to other terrace gravels of the northern Great Plains: U.S.Geological Survey Professional Paper 108-J, p. 179-184. Croil, J.S., 2002, Channel pattern alternation, anabranch development and floodplain evolution of the lower Grand River [Master’s thesis]: Ontario, University of Toronto, 198 p. Desloges, J.R. and Church, M.A., 1989, Canadian landform examples -13: The Canadian Geographer, v. 33, p. 360-364. Doyle, M.W., Shields, D., Boyd, K.F., Skidmore, P.B., and Dominick, D., 2007, Channel-Forming Discharge Selection in River Restoration Design: Journal of Hydraulic Engineering, v. 133, p. 831-837. Dumont, J.F., 1994, Neotectonics and rivers of the Amazon headwaters, in Schumm, S.A. and Winkley, B.R., eds., The Variability of Large Alluvial Rivers: New York, American Society of Civil Engineers Press, p. 103-113. Dunne, T. and Leopold, L.B., 1978, Water in Environmental Planning: San Francisco, W.H.Freeman Co., 818p. Earnes, H.J., 1998, Ice Engineering: Ice Jams in Montana: Ice Engineering Information Exchange Bulletin, v. 19, p. 1-6. Ettema, R. and Muste, M., 2001, Laboratory observations of ice jams in channel confluences: Journal of Cold Regions Engineering, v. 15, p. 34-58. Fenneman, N.M. and Johnson, J.W., 1946, Physical Divisions of the United States: U.S. Geological Survey, scale 1:7,000,000, 1 sheet.

- 85 -
Ferguson, R. and Ashworth, P., 1991, Slope induced changes in channel character along a gravel-bed stream: The Allt Dubhaig, Scotland: Earth Surface Processes and Landforms, v. 16, p. 65-82. Ferguson, R.I., 1981, Channel forms and channel changes, in Lewin, J., ed., British Rivers: London, G. Allen and Unwin, p. 90-125. Ferguson, R.I., 1984, The threshold between meandering and braiding: Channels and Channel Control Structures, v. 6, p. 15-29. Flight, J.N., 2004, Sequence stratigraphic analysis of the Fox Hills and Hell Creek Formations (Maastrichtian), Eastern Montana and its relationship to dinosaur paleontology [Master’s thesis]: Bozeman, MSU, 149 p. Foose, R.M., Wise, D.U., and Garbarini, G.S., 1961, Structural geology of the Beartooth Mountains, Montana and Wyoming: Geological Society of America Bulletin, v. 72, p. 1143-1172. Freers, T.F., 1970, Geology and ground water resources Williams County, North Dakota: Part 1 – Geology: North Dakota Geological Survey, Bulletin 48, p. 37-49. Goodwin, P., 2004, Analytical Solutions for Estimating Effective Discharge: Journal of Hydraulic Engineering, v. 130, p. 729-738. Gupta, S., 1997, Himalayan drainage patterns and the origin of fluvial megafans in the Ganges foreland basin: Geology, v. 25, p. 11-14. Gurnell, A.M. and Petts, G.E., 2002, Island-dominated landscapes of large floodplain rivers, a European perspective: Freshwater Biology, v. 47, p. 581-600. Harbor, D.J., Schumm, S.A., and Harvey, M.D., 1994, Tectonic control of the Indus River in Sindh, Pakistan, in Schumm, S.A. and Winkley, B.R., eds., The
Variability of Large Alluvial Rivers: New York, American Society of Civil Engineers Press, p. 161-175.
Harwood, K. and Brown, A.G., 1993, Fluvial processes in a forested anastamosing river: flood partitioning and changing flow patterns: Earth Surface Processes and Landforms, v. 18, p. 741-748. Howard, A.D., 1960, Cenozoic history of notheastern Montana and northwestern North Dakota with emphasis on the Pleistocene: U.S. Geological Survey Professional Paper 326, 108 p.

- 86 -
Howard, A.D. and Williams, J.W., 1972, Physiography, in Mallory, W.W., ed., Geologic Atlas of the Rocky Mountain Region: Denver, Rocky Mountain Association of Geologists, p. 29-31. Jansen, J.D. and Nanson, G.C., 2004, Anabranching and maximum flow efficiency in Magela Creek, northern Australia: Water Resources Research, v. 40, p. 1-12. Kellerhals, R., Church, M., and Bray, D.I., 1976, Classification and Analysis of River Processes: Journal of the Hydraulics Division, v. 102, p. 813-829. King, W.A. and Martini, I.P., 1984, Morphology and recent sediments of the lower anastamosing reaches of the Attawapiskat River, James Bay, Ontario, Canada: Sedimentary Geology, v. 37, p. 295-320. Knighton, A.D., 1998, Fluvial Forms and Processes, A New Perspective: New York, Oxford University Press Inc. 400 p. Knighton, A.D., 1999, Downstream variations in stream power: Geomorphology, v. 29, p. 293-306. Knighton, A.D. and Nanson, G.C., 1993, Anastamosis and the continuum of channel pattern: Earth Surface Processes and Landforms, v. 18, p. 613-625. Knighton, A.D. and Nanson, G.C., 1994, Waterholes and their significance in the anastamosing channel system of Cooper Creek, Australia: Geomorphology, v. 9, p. 311-324. Koch, R., Curry, R., and Weber, M., 1977, The effect of altered streamflow on the hydrology and geomorphology of the Yellowstone River Basin, Montana: Helena, Montana Department of Natural Resources and Conservation, Technical Report 2, 163 p. Kuchler, A.W., 1975, Potential natural vegetation of the conterminous United States:
Special Publication No.36, 2nd ed., scale 1:3,168,000, 1 sheet. Lambing, J.H. and Cleasby, T.E., 2006, Water-Quality Characteristics of Montana Streams in a Statewide Monitoring Network, 1999-2003: Reston, Montana Department of Environmental Quality and U.S. Geological Survey, p. 1-149. Leopold, L.B., 1994, A view of the river: Cambridge, Harvard University Press, 312 p. Leopold, L.B., Wolman, M.G., and Miller, J.P., 1964, Fluvial processes in geomorphology: New York, Dover Publications, 535 p.

- 87 -
Locke, W., 2005, Clogging the Mississippi? Glacial bedload from the Rockies to the Gulf, in North-Central Geological Society of America Meeting, 39th, Minneapolis: Geological Society of America. Macklin, M.G. and Lewin, J., 1989, Sediment transfer and transformation of an alluvial valley floor: the River South Tyne, Northumbria, U.K.: Earth Surface Processes and Landforms, v. 14, p. 233-246. Marple, R.T. and Talwani, P., 1993, Evidence of possible tectonic upwarping along the South Carolina coastal plain from an examination of river morphology and elevation data: Geology, v. 21, p. 651-654. McDougall, J.W., 1989, Tectonically induced diversion of the Indus River west of the Salt Range, Pakistan: Palaeography, Palaeoclimatology, Palaeoecology, v. 71, p. 301-307. Mike, K., 1975, Utilization of the analysis of ancient river beds for the detection of Holocene crustal movements: Tectonophysics, v. 29, p. 359-368. Miller, J.R., 1991, Development of anastamosing channels in south-central Indiana: Geomorphology, v. 4, p. 221-229. Miller, K.A., Clark, M.L., and Wright, P.R., 2005, Water-Quality Assessment of the Yellowstone River Basin, Montana and Wyoming - Water Quality of Fixed Sites, 1999-2001: Reston, U.S. Geological Survey, p. 1-84. Montgomery, D.R. and Buffington, J.M., 1998, Channel Processes, Classification and Response, in Naiman, R. and Brierley, G.J., eds., River Ecology and Management: New York, Springer-Verlag, Inc., p. 13-42. Moody, J.A. and Meade, R.H., 1990, Channel changes at cross sections of the Powder River between Moorhead and Broadus, Montana, 1975-88: U.S.Geological Survey Open-File Report, p. 89-407. Murray, A.B. and Paola, C., 2003, Modelling the effect of vegetation on cannel pattern in bedload rivers: Earth Surface Processes and Landforms, v. 28, p. 131-143. Nanson, G.C. and Huang, H.Q., 1999, Anabranching Rivers: Divided Efficiency Leading to Fluvial Diversity, in Miller, A.J. and Gupta, A., eds., Varieties in Fluvial Form: New York, John Wiley and Sons, p. 477-494. Nanson, G.C. and Knighton, A.D., 1996, Anabranching rivers: their cause, character and classification: Earth Surface Processes and Landforms, v. 21, p. 217-239.

- 88 -
Nanson, G.C., Rust, B.R., and Taylor, G., 1986, Coexistant mud braids and anastamosing channels in an arid-zone river: Cooper Creek, central Australia: Geology, v. 14, p. 175-178. Nash, D.B., 1994, Effective sediment-transporting discharge from magnitude-frequency analysis: Journal of Geology, v. 102, p. 79-95. NOAA, 2002, Monthly Station Normals of Temperature, Precipitation, and Heating and Cooling Degree Days 1971-2000, Asheville, NC, National Climatic Data Center/NESDIS/NOAA, p. 9,19. NRIS, 2006, NRIS GIS Data List, Washington, DC, U.S. Census Bureau. Osterkamp, W.R., 1998, Processes of fluvial island formation, with examples from Plum Creek, Colorado and Snake River, Idaho: Wetlands, v. 18, p. 530-545. Ouchi, S., 1985, Response of alluvial rivers to slow active tectonic movement: Geological Society of America Bulletin, v. 96, p. 504-515. Patterson, J.L., 1966, Magnitude and frequency of floods in the United States. Part 6-1: Missouri River Basin above Sioux City, Iowa: USGS Water Supply Paper, v. 1679. Personius, S.F., 1982, Geologic setting and geomorphic analysis of Quaternary fault scarps along the Deep Creek fault, upper Yellowstone Valley, south-central Montana [M.S.Thesis]: Bozeman, Montana State University, 77 p. Peterson, D.A., Miller, K.A., Bartos, T.T., Clark, M.L., Porter, S.D., and Quinn, T.L., 2004, Water Quality in the Yellowstone River Basin, Wyoming, Montana and North Dakota, Reston, VA, U.S. Department of the Interior, U.S. Geological Survey, p. 1-34. Pierce, K., 2006, MSU Earth Science Department Seminar, Bozeman, Montana. Primm, S., 2001, Northern Short Grasslands (NA0811). World Wildlife Fund. [Online]: http://www.nationalgeographic.com/wildworld/profiles/terrestrial/na/na8011_full. html [accessed on November 27, 2006]. Rhea, S., 1989, Evidence of uplift near Charleston, South Carolina: Geology, v. 17, p. 311-315.

- 89 -
Richards, K., Chandra, S., and Friend, P., 1993, Avulsive channel systems: characteristics and examples, in Sambrook Smith, G.H. et al., eds., Braided Rivers: Process, Deposits, Ecology and Management: London, International Association of Sedimentlogists, 203 p. Robert, A., 2003, River Processes, An Introduction to Fluvial Dynamics: New York, Oxford University Press Inc., 240 p. Rosgen, D.L., 1994, A classification of natural rivers: Catena, v. 22, p. 169-199. Ross, P.R., Andrews, D.A., and Witkind, I.J., 1955, Geologic Map of Montana: U.S. Geological Survey Special Geologic Map, scale 1:500,000, 2 sheets. Rust, B.R., 1981, Sedimentation in an arid-zone anastamosing fluvial system: Cooper Creek, central Australia: Journal of Sedimentary Petrology, v. 51, p. 745-755. Schumann, R., 1989, Morphology of Red Creek, Wyoming, an arid-region anastamosing channel system: Earth Surface Processes and Landforms, v. 14, p. 277-288. Schumm, S.A., 1985, Patterns of alluvial rivers: Annual Review of Earth and Planetary Sciences, v. 13, p. 5-27. Schumm, S.A., 1991, To Interpret the Earth: Ten Ways to be Wrong: New York, Cambridge University Press, 143 p. Schumm, S.A. and Khan, H.R., 1972, Experimental Study of Channel Patterns: Geological Society of America Bulletin, v. 83, p. 1755-1770. Shields, F.D., Knight, S.S., and Copper, C.M., 2000, Cyclic perturbation of lowland river channels and ecological response: Regulated Rivers, v. 16, p. 307-325. Simon, A., Dickerson, W., and Heins, A., 2004, Suspended-sediment transport rates at the 1.5-year recurrence interval for ecoregions of the United States: transport conditions at the bankfull and effective discharge?: Geomorphology, v. 58, p. 243-262. Smith, D.G., 1986, Anastamosing fluvial deposits, sedimentation rates and basin subsidence, Magdalena River, northwestern Colombia, South America: Sedimentary Geology, v. 46, p. 177-196. Smith, D.G. and Putnam, P.E., 1980, Anastamosed river deposits; modern and ancient examples in Alberta, Canada: Canadian Journal of Earth Science, v. 17, p. 1396- 1406.

- 90 -
Smith, D.G. and Smith, N.D., 1980, Sedimentation in anastamosed river systems: examples from alluvial valleys near Banff, Alberta: Journal of Sedimentary Petrology, v. 50, p. 157-164. Tooth, S. and McCarthy, T.S., 2004, Anabranching in mixed bedrock-alluvial rivers: the example of the Orange River above Augrabies Falls, Northern Cape Province, South Africa: Geomorphology, v. 57, p. 235-262. Tooth, S. and Nanson, G.C., 1999, Anabranching rivers on the Northern Plains of arid central Australia: Geomorphology, v. 29, p. 211-233. U.S.Geological Survey, 2006a, Montana Flood-Frequency and Basin-Characteristic Data [Online]: http://mt.water.usgs.gov/freq?page_type=table [accessed on November 13, 2006]. U.S.Geological Survey, 2006b, Surface-Water for the Nation, [Online]: http://waterdata.usgs.gov/usa/nwis/sw [accessed on November 7, 2006]. U.S.Geological Survey, 2006c, U.S. Geological Survey Surface-Water Monthly Statistics for the Nation: USGS 06214500 Yellowstone River at Billings, MT, [Online]: http://waterdata.usgs.gov/nwis/monthly[accessed on November 13, 2006]. Watson, C.C., Schumm, S.A., and Harvey, M.D., 1984, Neotectonic effects on river pattern, in Elliot, C.M., ed., River Meandering: New York, American Society of Civil Engineers, p. 55-66. Wende, R. and Nanson, G.C., 1998, Anabranching rivers: ridge-form alluvial channels in tropical northern Australia: Geomorphology, v. 22, p. 205-224. White, K.D., 1996, A new Ice Jam Database: Journal of the American Water Resources Association, v. 32, p. 341-348. Wilde, E.M. and Porter, K.W., 2000, Geologic map of the Roundup 30' x 60' quadrangle, Central Montana: Montana Bureau of Mines and Geology Open File No. 404, scale 1:100,000, 4 sheets. Williams, G.P. and Wolman, M.G., 1984, Downstream effects of dams on alluvial rivers: U.S. Geological Survey Professional Paper 1286, 83 p. Wohl, E.E. and Pearthree, P.P., 1991, Debris flows as geomorphic agents in the Huachuca Mountains of southeastern Arizona: Geomorphology, v. 4, p. 273-292. Wolman, M.G. and Miller, J.P., 1960, Magnitude and frequency of forces in geomorphic processes: Journal of Geology, v. 68, p. 54-74.

- 91 -
Womack and Associates, Inc., Boyd, K., and Perkins, R., 2001, BNSF Bank Stabilization Projects: Lower Yellowstone River, Montana Impacts Assessment, Billings, p. 19-61. Zelt, R.B., Boughton, G., Miller, K.A., Mason, J.P., and Gianakos, L.M., 1999, Environmental setting of the Yellowstone River Basin, Montana, North Dakota, and Wyoming: Water Recourses Investigations Report 98-4269, U.S. Geological Survey, 120 p.

- 92 -
APPENDICES

- 93 -
APPENDIX A
GEOMORPHIC MEASUREMENTS

- 94 -
Geomorphic measurements from cross sections of the lower Yellowstone River
River Mile Marker
Distance from mouth
(km)
Valley width (km)
Number of anabranched
channels Formation
Resistant(1), Non-
resistant(0)
477 767.66 2.54 2 1 476.5 766.85 3 1 476 766.05 2.61 3 1
475.5 765.24 2 1 475 764.44 2.19 3 1
474.5 763.63 2 1 474 762.83 2.44 1 1
473.5 762.02 2 1 473 761.22 2.37 1 1
472.5 760.42 2 1 472 759.61 2.09 1 1
471.5 758.81 3 1 471 758.00 2.38 2 1
470.5 757.20 1 1 470 756.39 2.64 2 1
469.5 755.59 2 1 469 754.78 2.75 1 1
468.5 753.98 1 1 468 753.17 2.66 1 1
467.5 752.37 3 1 467 751.56 2.48 1 1
466.5 750.76 2 1 466 749.95 2.48 2 1
465.5 749.15 3 1 465 748.34 2.87 3 1
464.5 747.54 4 1 464 746.74 3.01 2 1
463.5 745.93 2 1 463 745.13 2.93 2 1
462.5 744.32 1 1 462 743.52 3.01 2 1
461.5 742.71 2 1 461 741.91 3.28 3 1
460.5 741.10 4 1 460 740.30 3.25 1 1
459.5 739.49 1 1 459 738.69 3.19 2 1
458.5 737.88 1 1 458 737.08 2.91 2 1
457.5 736.27 1
Khc
1

- 95 -
457 735.47 2.78 2 1 456.5 734.67 1 1 456 733.86 3.30 1 1
455.5 733.06 1 1 455 732.25 3.87 1 1
454.5 731.45 2 1 454 730.64 3.16 2 1
453.5 729.84 2 1 453 729.03 1.98 1 1
452.5 728.23 1 1 452 727.42 1.94 1 1
451.5 726.62 1 1 451 725.81 1.67 2 1
450.5 725.01 1 1 450 724.20 1.93 1 1
449.5 723.40 1 1 449 722.60 2.48 1 1
448.5 721.79 2 1 448 720.99 2.46 1 1
447.5 720.18 2 1 447 719.38 2.38 2 1
446.5 718.57 2 1 446 717.77 3.44 2 1
445.5 716.96 3 1 445 716.16 1.76 1 1
444.5 715.35 2
Klsr
1 444 714.55 2.16 2 1
443.5 713.74 2 1 443 712.94 2.23 2 1
442.5 712.13 2 1 442 711.33 2.88 3 1
441.5 710.53 3 1 441 709.72 2.36 2 1
440.5 708.92 2 1 440 708.11 2.09 1 1
439.5 707.31 1 1 439 706.50 2.08 1 1
438.5 705.70 2 1 438 704.89 1.93 1 1
437.5 704.09 2 1 437 703.28 1.75 2 1
436.5 702.48 4 1 436 701.67 1.77 2 1
435.5 700.87 3 1 435 700.06 1.66 4
Khc
1

- 96 -
434.5 699.26 2 1 434 698.46 1.68 1 1
433.5 697.65 1 1 433 696.85 1.40 2 1
432.5 696.04 1 1 432 695.24 1.47 1 1
431.5 694.43 2 1 431 693.63 1.58 1 1
430.5 692.82 1 1 430 692.02 1.34 2 1
429.5 691.21 2 1 429 690.41 1.32 1 1
428.5 689.60 3 1 428 688.80 1.32 2 1
427.5 687.99 2 1 427 687.19 1.16 1 1
426.5 686.39 1 1 426 685.58 1.26 4 1
425.5 684.78 1 1 425 683.97 1.14 3 1
424.5 683.17 3 1 424 682.36 1.98 2 1
423.5 681.56 2 1 423 680.75 1.53 3 1
422.5 679.95 2 1 422 679.14 1.30 1 1
421.5 678.34 3 1 421 677.53 1.82 1 1
420.5 676.73 2 1 420 675.92 1.72 2 1
419.5 675.12 4 1 419 674.32 1.60 1 1
418.5 673.51 1 1 418 672.71 1.44 1 1
417.5 671.90 5 1 417 671.10 1.80 4 1
416.5 670.29 2 1 416 669.49 2.79 1 1
415.5 668.68 3 1 415 667.88 2.63 4 1
414.5 667.07 2 1 414 666.27 2.57 2 0
413.5 665.46 1 Kb
0 413 664.66 2.80 2 1
412.5 663.85 1 Kjr
1

- 97 -
412 663.05 3.23 3 1 411.5 662.25 3 1 411 661.44 3.23 1 1
410.5 660.64 2 1 410 659.83 3.15 3 1
409.5 659.03 3 1 409 658.22 4.04 1 1
408.5 657.42 3 1 408 656.61 1.98 3 1
407.5 655.81 5 1 407 655.00 1.99 2 1
406.5 654.20 2 1 406 653.39 2.03 1 1
405.5 652.59 1 1 405 651.78 2.20 2 1
404.5 650.98 2 1 404 650.17 2.17 2 1
403.5 649.37 1 1 403 648.57 2.32 2 1
402.5 647.76 3 1 402 646.96 2.09 1 1
401.5 646.15 1 1 401 645.35 2.16 1 1
400.5 644.54 2 1 400 643.74 2.08 3 1
399.5 642.93 2 1 399 642.13 2.81 2 0
398.5 641.32 1 Kcl
0 398 640.52 2.03 1 1
397.5 639.71 3 Ke
1 397 638.91 2.43 1 0
396.5 638.10 2 0 396 637.30 3.58 2 0
395.5 636.50 4
Ktc
0 395 635.69 5.31 3 0
394.5 634.89 4 0 394 634.08 5.95 2 0
393.5 633.28 2
Kn
0 393 632.47 6.30 3 0
392.5 631.67 3 Kca
0 392 630.86 7.86 4 0
391.5 630.06 3 0 391 629.25 7.82 2 0
390.5 628.45 3
Kn
0

- 98 -
390 627.64 10.15 3 0 389.5 626.84 4 0 389 626.03 9.23 2 0
388.5 625.23 2 0 388 624.43 9.28 3 0
387.5 623.62 1 0 387 622.82 7.16 3 0
386.5 622.01 3 0 386 621.21 7.40 2 0
385.5 620.40 2 0 385 619.60 7.64 2 0
384.5 618.79 1 0 384 617.99 7.59 2 0
383.5 617.18 4 0 383 616.38 7.67 3 0
382.5 615.57 3 0 382 614.77 7.58 4 0
381.5 613.96 2
Km
0 381 613.16 7.66 1 0
380.5 612.36 1 0 380 611.55 8.24 3 0
379.5 610.75 3 0 379 609.94 8.42 4 0
378.5 609.14 5 0 378 608.33 9.07 4 0
377.5 607.53 5 0 377 606.72 9.40 2 0
376.5 605.92 3 0 376 605.11 9.66 4 0
375.5 604.31 3 0 375 603.50 9.77 2 0
374.5 602.70 3 0 374 601.89 10.28 4 0
373.5 601.09 4 0 373 600.29 11.15 3 0
372.5 599.48 1 0 372 598.68 10.49 2 0
371.5 597.87 1 0 371 597.07 9.35 2 0
370.5 596.26 2 0 370 595.46 8.62 1 0
369.5 594.65 3
Kbf
0 369 593.85 7.26 5 0
368.5 593.04 3 Kca
0

- 99 -
368 592.24 6.39 3 0 367.5 591.43 2 0 367 590.63 5.84 1 0
366.5 589.82 2 0 366 589.02 5.08 2 0
365.5 588.22 2
Kn
0 365 587.41 4.66 2 1
364.5 586.61 3 1 364 585.80 2.04 1 1
363.5 585.00 1 1 363 584.19 1.58 1 1
362.5 583.39 2
Ke
1 362 582.58 2.97 3 0
361.5 581.78 3 0 361 580.97 2.87 1 0
360.5 580.17 3 0 360 579.36 3.84 2 0
359.5 578.56 3 0 359 577.75 3.46 3 0
358.5 576.95 2 0 358 576.15 2.24 4 0
357.5 575.34 4
Kcl
0 357 574.54 2.15 3 1
356.5 573.73 1 1 356 572.93 1.67 2 1
355.5 572.12 2 1 355 571.32 1.65 2 1
354.5 570.51 3 1 354 569.71 3.25 1 1
353.5 568.90 3
Kjr
1 353 568.10 2.40 2 0
352.5 567.29 4 0 352 566.49 2.54 2 0
351.5 565.68 2 0 351 564.88 3.67 3 0
350.5 564.08 6 0 350 563.27 4.44 5 0
349.5 562.47 3 0 349 561.66 5.26 3 0
348.5 560.86 3 0 348 560.05 5.93 3 0
347.5 559.25 1 0 347 558.44 5.99 2 0
346.5 557.64 2
Kb
0
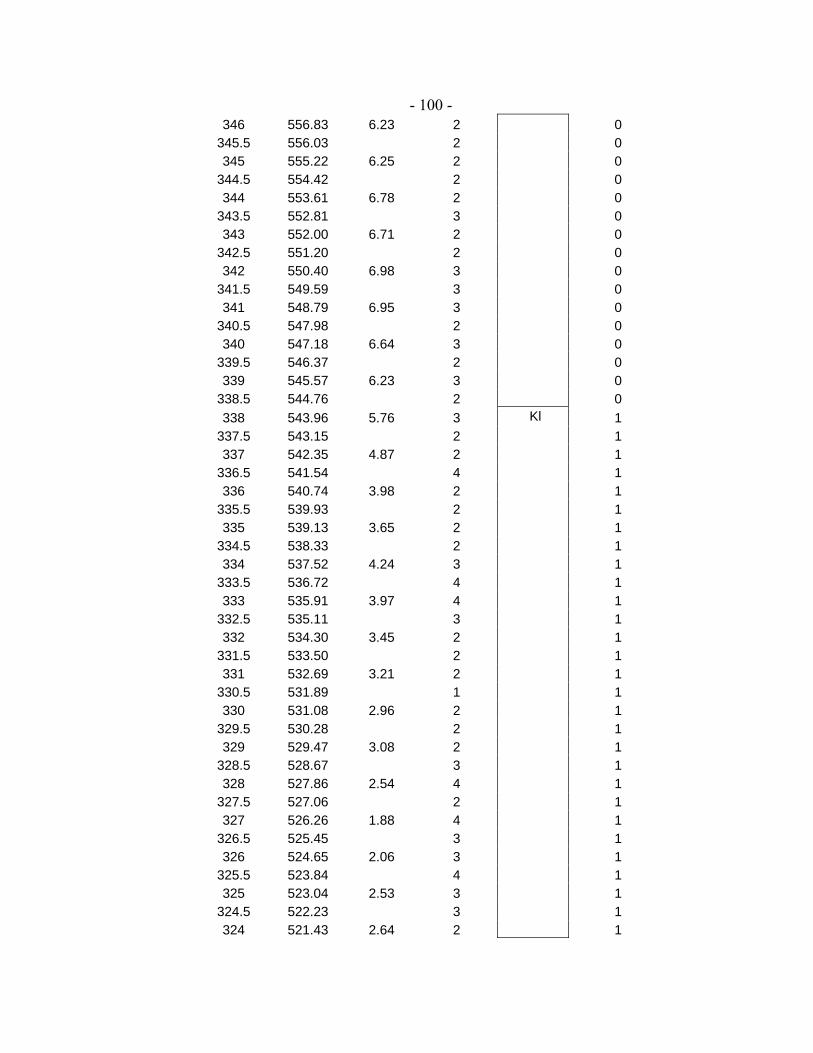
- 100 -
346 556.83 6.23 2 0 345.5 556.03 2 0 345 555.22 6.25 2 0
344.5 554.42 2 0 344 553.61 6.78 2 0
343.5 552.81 3 0 343 552.00 6.71 2 0
342.5 551.20 2 0 342 550.40 6.98 3 0
341.5 549.59 3 0 341 548.79 6.95 3 0
340.5 547.98 2 0 340 547.18 6.64 3 0
339.5 546.37 2 0 339 545.57 6.23 3 0
338.5 544.76 2 0 338 543.96 5.76 3 1
337.5 543.15 2 1 337 542.35 4.87 2 1
336.5 541.54 4 1 336 540.74 3.98 2 1
335.5 539.93 2 1 335 539.13 3.65 2 1
334.5 538.33 2 1 334 537.52 4.24 3 1
333.5 536.72 4 1 333 535.91 3.97 4 1
332.5 535.11 3 1 332 534.30 3.45 2 1
331.5 533.50 2 1 331 532.69 3.21 2 1
330.5 531.89 1 1 330 531.08 2.96 2 1
329.5 530.28 2 1 329 529.47 3.08 2 1
328.5 528.67 3 1 328 527.86 2.54 4 1
327.5 527.06 2 1 327 526.26 1.88 4 1
326.5 525.45 3 1 326 524.65 2.06 3 1
325.5 523.84 4 1 325 523.04 2.53 3 1
324.5 522.23 3 1 324 521.43 2.64 2
Kl
1
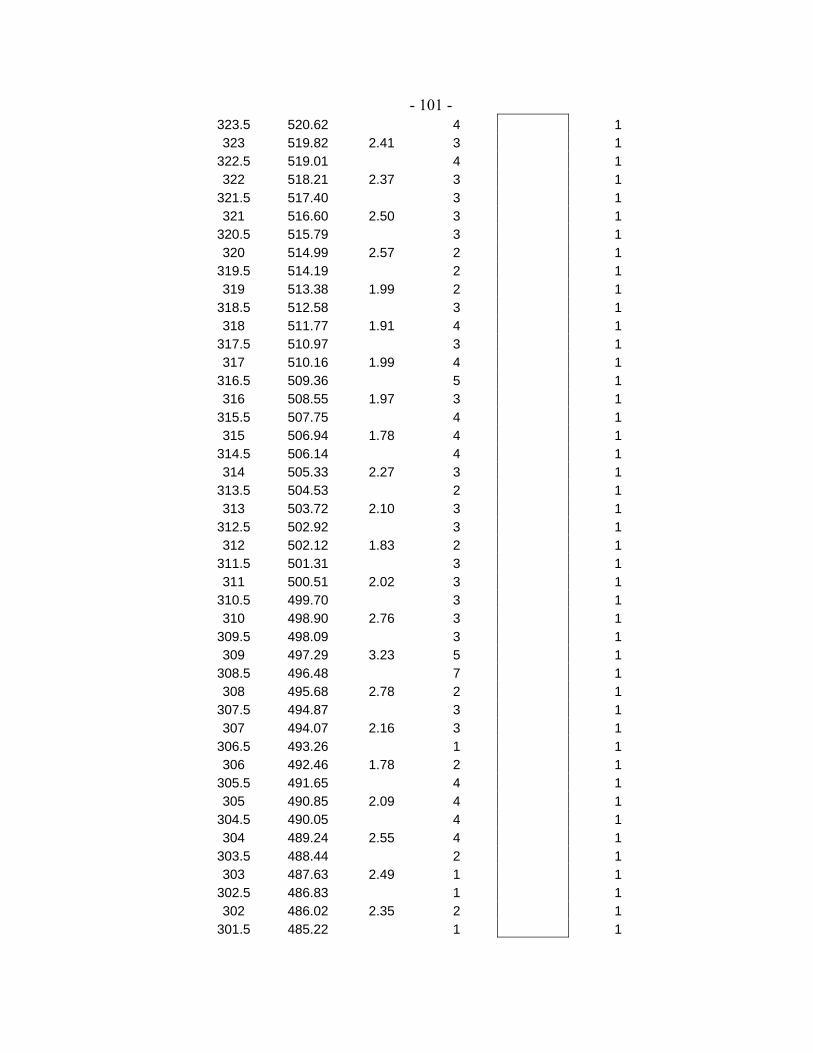
- 101 -
323.5 520.62 4 1 323 519.82 2.41 3 1
322.5 519.01 4 1 322 518.21 2.37 3 1
321.5 517.40 3 1 321 516.60 2.50 3 1
320.5 515.79 3 1 320 514.99 2.57 2 1
319.5 514.19 2 1 319 513.38 1.99 2 1
318.5 512.58 3 1 318 511.77 1.91 4 1
317.5 510.97 3 1 317 510.16 1.99 4 1
316.5 509.36 5 1 316 508.55 1.97 3 1
315.5 507.75 4 1 315 506.94 1.78 4 1
314.5 506.14 4 1 314 505.33 2.27 3 1
313.5 504.53 2 1 313 503.72 2.10 3 1
312.5 502.92 3 1 312 502.12 1.83 2 1
311.5 501.31 3 1 311 500.51 2.02 3 1
310.5 499.70 3 1 310 498.90 2.76 3 1
309.5 498.09 3 1 309 497.29 3.23 5 1
308.5 496.48 7 1 308 495.68 2.78 2 1
307.5 494.87 3 1 307 494.07 2.16 3 1
306.5 493.26 1 1 306 492.46 1.78 2 1
305.5 491.65 4 1 305 490.85 2.09 4 1
304.5 490.05 4 1 304 489.24 2.55 4 1
303.5 488.44 2 1 303 487.63 2.49 1 1
302.5 486.83 1 1 302 486.02 2.35 2 1
301.5 485.22 1 1
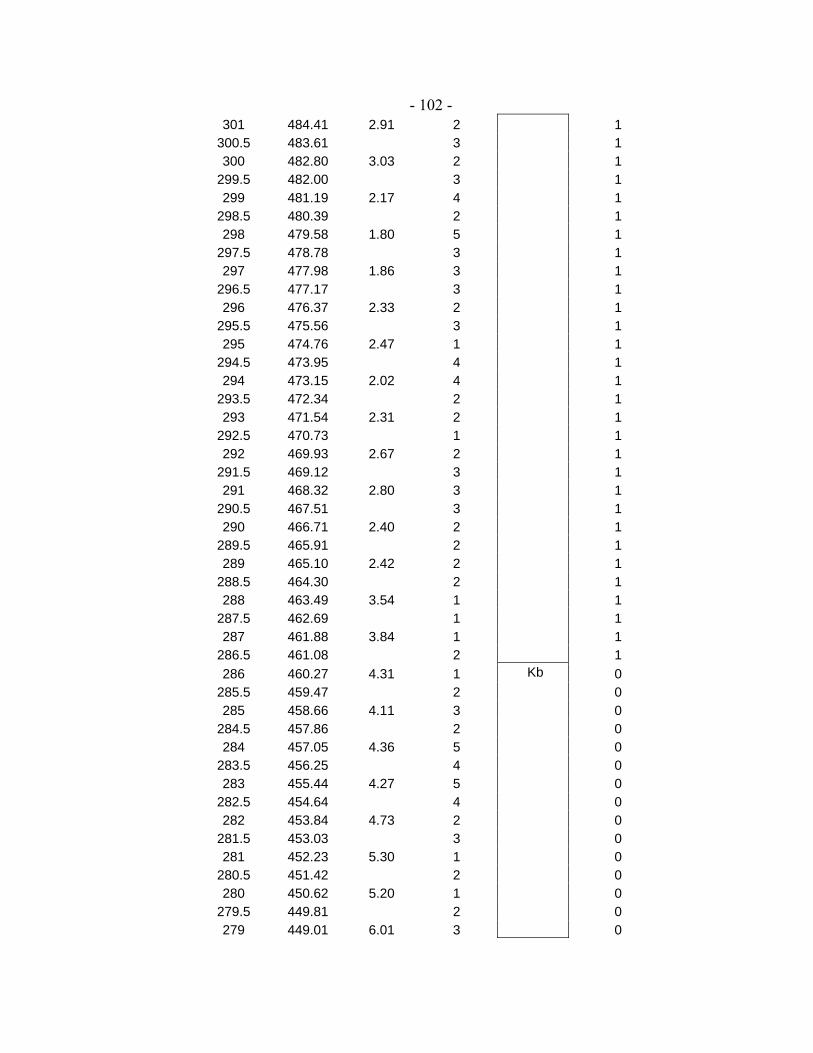
- 102 -
301 484.41 2.91 2 1 300.5 483.61 3 1 300 482.80 3.03 2 1
299.5 482.00 3 1 299 481.19 2.17 4 1
298.5 480.39 2 1 298 479.58 1.80 5 1
297.5 478.78 3 1 297 477.98 1.86 3 1
296.5 477.17 3 1 296 476.37 2.33 2 1
295.5 475.56 3 1 295 474.76 2.47 1 1
294.5 473.95 4 1 294 473.15 2.02 4 1
293.5 472.34 2 1 293 471.54 2.31 2 1
292.5 470.73 1 1 292 469.93 2.67 2 1
291.5 469.12 3 1 291 468.32 2.80 3 1
290.5 467.51 3 1 290 466.71 2.40 2 1
289.5 465.91 2 1 289 465.10 2.42 2 1
288.5 464.30 2 1 288 463.49 3.54 1 1
287.5 462.69 1 1 287 461.88 3.84 1 1
286.5 461.08 2 1 286 460.27 4.31 1 0
285.5 459.47 2 0 285 458.66 4.11 3 0
284.5 457.86 2 0 284 457.05 4.36 5 0
283.5 456.25 4 0 283 455.44 4.27 5 0
282.5 454.64 4 0 282 453.84 4.73 2 0
281.5 453.03 3 0 281 452.23 5.30 1 0
280.5 451.42 2 0 280 450.62 5.20 1 0
279.5 449.81 2 0 279 449.01 6.01 3
Kb
0

- 103 -
278.5 448.20 2 0 278 447.40 6.05 2 0
277.5 446.59 2 0 277 445.79 6.14 1 0
276.5 444.98 1 0 276 444.18 6.34 2 0
275.5 443.37 1 0 275 442.57 6.20 2 0
274.5 441.76 3 0 274 440.96 5.97 1 0
273.5 440.16 2 0 273 439.35 6.14 2 0
272.5 438.55 2 0 272 437.74 6.26 2 0
271.5 436.94 2 0 271 436.13 6.21 1 0
270.5 435.33 2 0 270 434.52 6.51 3 0
269.5 433.72 6 0 269 432.91 7.18 3 0
268.5 432.11 2 0 268 431.30 7.15 2 0
267.5 430.50 4 0 267 429.69 6.86 1 0
266.5 428.89 1 0 266 428.09 6.76 1 0
265.5 427.28 2 0 265 426.48 6.76 2 0
264.5 425.67 2 0 264 424.87 6.14 4 0
263.5 424.06 5 0 263 423.26 6.12 3 0
262.5 422.45 3 0 262 421.65 5.52 2 0
261.5 420.84 4 0 261 420.04 4.71 4 0
260.5 419.23 3 0 260 418.43 1.75 2 1
259.5 417.62 2 1 259 416.82 2.26 1 1
258.5 416.02 2 1 258 415.21 2.59 1 1
257.5 414.41 2 1 257 413.60 2.52 3 1
256.5 412.80 2
Kjr
1

- 104 -
256 411.99 3.10 3 1 255.5 411.19 1 1 255 410.38 3.25 1 1
254.5 409.58 2 1 254 408.77 3.03 2 0
253.5 407.97 1 0 253 407.16 2.92 1 0
252.5 406.36 1 0 252 405.55 4.62 3 0
251.5 404.75 2 0 251 403.95 6.32 3 0
250.5 403.14 3 0 250 402.34 6.59 2 0
249.5 401.53 2 0 249 400.73 6.47 4 0
248.5 399.92 4 0 248 399.12 6.41 3 0
247.5 398.31 4 0 247 397.51 7.12 4 0
246.5 396.70 3 0 246 395.90 6.24 2 0
245.5 395.09 3 0 245 394.29 4.84 1 0
244.5 393.48 4 0 244 392.68 4.32 3 0
243.5 391.88 2
Kb
0 243 391.07 4.42 2 1
242.5 390.27 3 Kfh
1 242 389.46 3.18 1 1
241.5 388.66 1 1 241 387.85 3.10 1 1
240.5 387.05 1 1 240 386.24 2.74 2 1
239.5 385.44 3 1 239 384.63 2.87 1 1
238.5 383.83 1 1 238 383.02 2.60 1 1
237.5 382.22 2 1 237 381.41 2.33 1 1
236.5 380.61 2 1 236 379.81 1.95 2 1
235.5 379.00 1 1 235 378.20 2.45 1 1
234.5 377.39 1
Kl
1

- 105 -
234 376.59 2.96 2 1 233.5 375.78 1 1 233 374.98 2.49 2 1
232.5 374.17 2 1 232 373.37 3.60 1 1
231.5 372.56 1 1 231 371.76 4.40 1 1
230.5 370.95 1 1 230 370.15 4.45 1 1
229.5 369.34 1 1 229 368.54 3.21 2 1
228.5 367.74 3 1 228 366.93 2.93 4 1
227.5 366.13 5 1 227 365.32 2.93 3 1
226.5 364.52 2 1 226 363.71 2.72 2 1
225.5 362.91 2 1 225 362.10 3.13 2 1
224.5 361.30 2 1 224 360.49 2.51 1 1
223.5 359.69 2 1 223 358.88 4.04 3 1
222.5 358.08 2 1 222 357.27 3.21 1 1
221.5 356.47 3 1 221 355.67 3.11 2 1
220.5 354.86 5
Khc
1 220 354.06 3.16 3 1
219.5 353.25 1 1 219 352.45 3.24 2 1
218.5 351.64 4 1 218 350.84 3.16 2 1
217.5 350.03 2 1 217 349.23 3.63 1 1
216.5 348.42 1 1 216 347.62 3.95 2 1
215.5 346.81 3 1 215 346.01 4.00 2 1
214.5 345.20 2 1 214 344.40 3.70 2 1
213.5 343.59 2 1 213 342.79 4.86 2 1
212.5 341.99 2 1 212 341.18 3.60 1
Tft
1

- 106 -
211.5 340.38 3 1 211 339.57 3.35 3 1
210.5 338.77 3 1 210 337.96 3.25 4 1
209.5 337.16 3 1 209 336.35 3.58 3 1
208.5 335.55 2 1 208 334.74 3.79 1 1
207.5 333.94 2 1 207 333.13 3.74 2 1
206.5 332.33 2 1 206 331.52 2.85 1 1
205.5 330.72 2 1 205 329.92 3.13 2 1
204.5 329.11 1 1 204 328.31 3.07 1 1
203.5 327.50 1 1 203 326.70 3.26 2 1
202.5 325.89 2 1 202 325.09 3.02 2 1
201.5 324.28 2 1 201 323.48 2.70 2 1
200.5 322.67 1 1 200 321.87 4.59 2 1
199.5 321.06 2 1 199 320.26 5.15 2 1
198.5 319.45 2 1 198 318.65 3.67 2 1
197.5 317.85 1 1 197 317.04 3.96 2 1
196.5 316.24 1 1 196 315.43 3.85 1 1
195.5 314.63 2 1 195 313.82 4.41 2 1
194.5 313.02 1 1 194 312.21 4.34 2 1
193.5 311.41 1 1 193 310.60 4.02 1 1
192.5 309.80 1 1 192 308.99 4.24 1 1
191.5 308.19 1 1 191 307.38 4.29 1 1
190.5 306.58 2 1 190 305.78 3.79 6 1
189.5 304.97 6 1

- 107 -
189 304.17 3.27 1 1 188.5 303.36 1 1 188 302.56 3.91 1 1
187.5 301.75 1 1 187 300.95 3.72 3 1
186.5 300.14 2 1 186 299.34 4.10 1 1
185.5 298.53 1 1 185 297.73 3.71 1 1
184.5 296.92 2 1 184 296.12 4.45 2 1
183.5 295.31 1 1 183 294.51 4.59 1 1
182.5 293.71 1 1 182 292.90 4.40 1 1
181.5 292.10 2 1 181 291.29 3.65 2 1
180.5 290.49 4 1 180 289.68 3.39 3 1
179.5 288.88 1 1 179 288.07 3.82 2 1
178.5 287.27 1 1 178 286.46 3.88 1 1
177.5 285.66 1 1 177 284.85 3.99 1 1
176.5 284.05 1 1 176 283.24 4.00 1 1
175.5 282.44 2 1 175 281.64 3.44 1 1
174.5 280.83 1 1 174 280.03 2.76 2 1
173.5 279.22 1 1 173 278.42 3.06 1 1
172.5 277.61 1 1 172 276.81 3.02 1 1
171.5 276.00 1 1 171 275.20 3.17 1 1
170.5 274.39 1 1 170 273.59 3.33 1 1
169.5 272.78 1 1 169 271.98 3.76 1 1
168.5 271.17 1 1 168 270.37 4.18 1 1
167.5 269.57 1 1 167 268.76 4.26 1 1

- 108 -
166.5 267.96 1 1 166 267.15 4.24 1 1
165.5 266.35 1 1 165 265.54 3.60 1 1
164.5 264.74 1 1 164 263.93 2.41 1 1
163.5 263.13 1 1 163 262.32 2.39 3 1
162.5 261.52 1 1 162 260.71 2.58 1 1
161.5 259.91 1 1 161 259.10 3.78 1 1
160.5 258.30 1 1 160 257.50 2.84 1 1
159.5 256.69 1 1 159 255.89 3.20 1 1
158.5 255.08 1 1 158 254.28 3.07 1 1
157.5 253.47 1 1 157 252.67 2.57 1 1
156.5 251.86 1 1 156 251.06 2.54 2 1
155.5 250.25 2 1 155 249.45 2.70 1 1
154.5 248.64 1 1 154 247.84 2.43 1 1
153.5 247.03 1 1 153 246.23 2.98 1 1
152.5 245.42 1 1 152 244.62 3.10 1 1
151.5 243.82 1 1 151 243.01 2.88 1 1
150.5 242.21 1 1 150 241.40 2.38 1 1
149.5 240.60 2 1 149 239.79 2.69 1 1
148.5 238.99 2 1 148 238.18 3.97 1 1
147.5 237.38 1 1 147 236.57 3.61 1 1
146.5 235.77 2 1 146 234.96 3.66 2 0
145.5 234.16 1 0 145 233.35 3.47 1 0
144.5 232.55 1
Tfle
0

- 109 -
144 231.75 6.36 1 0 143.5 230.94 1 0 143 230.14 6.86 1 0
142.5 229.33 1 0 142 228.53 6.86 1 0
141.5 227.72 1 0 141 226.92 6.18 1 0
140.5 226.11 2 0 140 225.31 5.66 1 0
139.5 224.50 1 0 139 223.70 5.15 1 0
138.5 222.89 1 0 138 222.09 4.75 1 0
137.5 221.28 1 0 137 220.48 4.84 1 0
136.5 219.68 1 0 136 218.87 4.74 1 0
135.5 218.07 1 0 135 217.26 4.08 1 0
134.5 216.46 1 0 134 215.65 3.66 1 0
133.5 214.85 1 0 133 214.04 4.87 1 0
132.5 213.24 1 0 132 212.43 5.23 1 0
131.5 211.63 1 0 131 210.82 5.08 1 0
130.5 210.02 1 0 130 209.21 5.23 1 0
129.5 208.41 1 0 129 207.61 5.14 1 0
128.5 206.80 1 0 128 206.00 5.11 1 0
127.5 205.19 1 0 127 204.39 4.80 1 0
126.5 203.58 1 0 126 202.78 5.30 1 0
125.5 201.97 1 0 125 201.17 4.37 1 0
124.5 200.36 1 0 124 199.56 3.39 1 0
123.5 198.75 1 0 123 197.95 4.29 1 0
122.5 197.14 1 0 122 196.34 4.97 4 Tfld 1
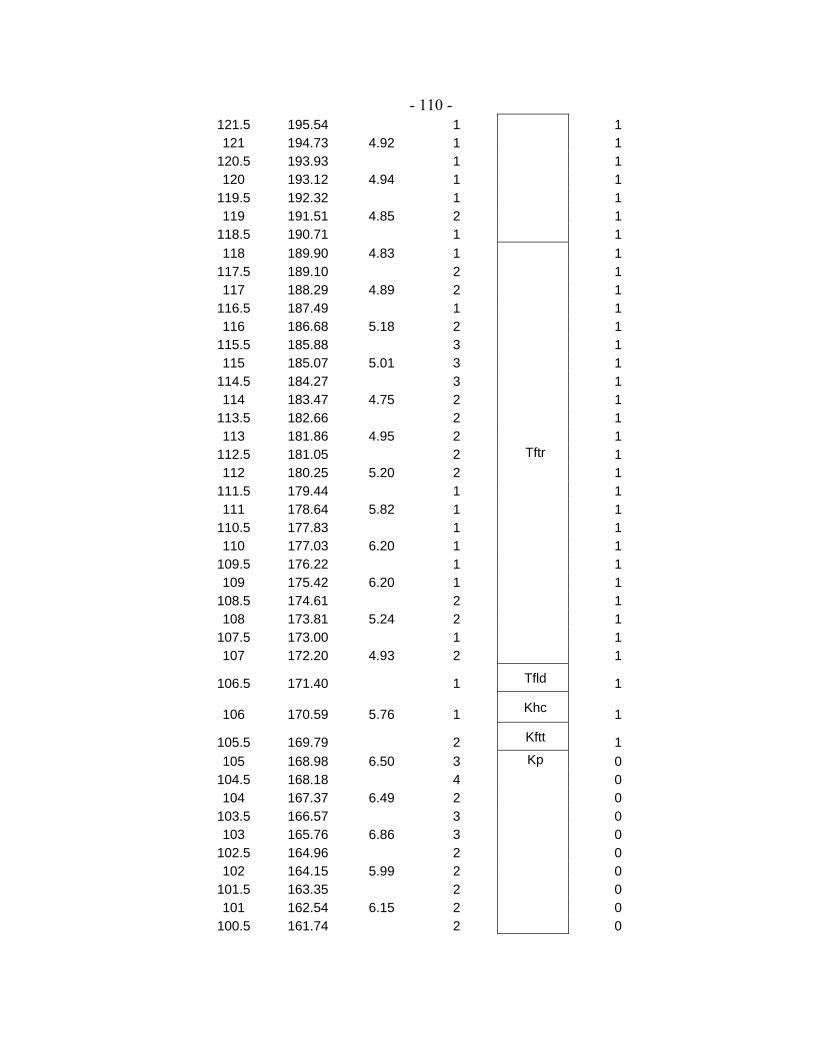
- 110 -
121.5 195.54 1 1 121 194.73 4.92 1 1
120.5 193.93 1 1 120 193.12 4.94 1 1
119.5 192.32 1 1 119 191.51 4.85 2 1
118.5 190.71 1 1 118 189.90 4.83 1 1
117.5 189.10 2 1 117 188.29 4.89 2 1
116.5 187.49 1 1 116 186.68 5.18 2 1
115.5 185.88 3 1 115 185.07 5.01 3 1
114.5 184.27 3 1 114 183.47 4.75 2 1
113.5 182.66 2 1 113 181.86 4.95 2 1
112.5 181.05 2 1 112 180.25 5.20 2 1
111.5 179.44 1 1 111 178.64 5.82 1 1
110.5 177.83 1 1 110 177.03 6.20 1 1
109.5 176.22 1 1 109 175.42 6.20 1 1
108.5 174.61 2 1 108 173.81 5.24 2 1
107.5 173.00 1 1 107 172.20 4.93 2
Tftr
1
106.5 171.40 1 Tfld 1
106 170.59 5.76 1 Khc 1
105.5 169.79 2 Kftt 1 105 168.98 6.50 3 0
104.5 168.18 4 0 104 167.37 6.49 2 0
103.5 166.57 3 0 103 165.76 6.86 3 0
102.5 164.96 2 0 102 164.15 5.99 2 0
101.5 163.35 2 0 101 162.54 6.15 2 0
100.5 161.74 2
Kp
0

- 111 -
100 160.93 6.03 1 0 99.5 160.13 2 0 99 159.33 6.01 2 1
98.5 158.52 2 1 98 157.72 5.39 1 1
97.5 156.91 2
Kftt
1 97 156.11 4.08 2 1
96.5 155.30 3 Kfc
1 96 154.50 4.36 2 1
95.5 153.69 3 1 95 152.89 4.07 4 1
94.5 152.08 1 1 94 151.28 4.76 1 1
93.5 150.47 1 1 93 149.67 3.93 1 1
92.5 148.86 1 1 92 148.06 2.94 1 1
91.5 147.25 1 1 91 146.45 2.42 1 1
90.5 145.65 2 1 90 144.84 3.19 2 1
89.5 144.04 2 1 89 143.23 4.37 1 1
88.5 142.43 2 1 88 141.62 4.62 1 1
87.5 140.82 3 1 87 140.01 4.82 2 1
86.5 139.21 2 1 86 138.40 4.51 2 1
85.5 137.60 2 1 85 136.79 3.47 1 1
84.5 135.99 1 1 84 135.18 3.41 2 1
83.5 134.38 1 1 83 133.58 4.31 4 1
82.5 132.77 2
Khc
1 82 131.97 3.94 2 1
81.5 131.16 1 1 81 130.36 4.13 1 1
80.5 129.55 2 1 80 128.75 5.37 1 1
79.5 127.94 1 1 79 127.14 4.92 1 1
78.5 126.33 2
Tfld
1

- 112 -
78 125.53 2.82 3 1 77.5 124.72 2 1 77 123.92 1.98 3 1
76.5 123.11 1 1 76 122.31 1.90 1 1
75.5 121.51 1 1 75 120.70 1.81 2 1
74.5 119.90 3 1 74 119.09 2.59 3 1
73.5 118.29 2 1 73 117.48 2.69 2 1
72.5 116.68 2 1 72 115.87 2.72 2 1
71.5 115.07 2 1 71 114.26 2.55 2 1
70.5 113.46 2 1 70 112.65 2.84 2 1
69.5 111.85 2 1 69 111.04 3.36 2 1
68.5 110.24 1 1 68 109.44 2.82 1 1
67.5 108.63 2 1 67 107.83 2.14 3 1
66.5 107.02 2 1 66 106.22 2.47 2 1
65.5 105.41 4 1 65 104.61 3.30 3 1
64.5 103.80 3 1 64 103.00 3.30 3 1
63.5 102.19 3 1 63 101.39 2.67 4 1
62.5 100.58 2 1 62 99.78 2.55 3 1
61.5 98.97 1 1 61 98.17 1.81 3 1
60.5 97.37 2 1 60 96.56 2.53 3 1
59.5 95.76 2 1 59 94.95 3.17 1 1
58.5 94.15 1 1 58 93.34 3.38 1 1
57.5 92.54 4 1 57 91.73 3.19 2 1
56.5 90.93 2 1 56 90.12 3.70 2
Tftr
1

- 113 -
55.5 89.32 2 1 55 88.51 3.91 2 1
54.5 87.71 4 1 54 86.90 5.18 5 1
53.5 86.10 3 1 53 85.30 6.06 2 1
52.5 84.49 1 1 52 83.69 6.65 4 1
51.5 82.88 4 1 51 82.08 6.79 3 1
50.5 81.27 3 1 50 80.47 6.37 1 1
49.5 79.66 2 1 49 78.86 5.75 2 1
48.5 78.05 4 1 48 77.25 5.58 3 1
47.5 76.44 3 1 47 75.64 5.98 1 1
46.5 74.83 1 1 46 74.03 5.79 2 1
45.5 73.23 2 1 45 72.42 5.06 3 1
44.5 71.62 2 1 44 70.81 4.52 2 1
43.5 70.01 4 1 43 69.20 4.49 3 1
42.5 68.40 5 1 42 67.59 5.22 3 1
41.5 66.79 3 1 41 65.98 5.21 3 1
40.5 65.18 2 1 40 64.37 4.86 1 1
39.5 63.57 2 1 39 62.76 4.95 3 1
38.5 61.96 3 1 38 61.16 4.75 2 1
37.5 60.35 2 1 37 59.55 4.78 2 1
36.5 58.74 1 1 36 57.94 5.56 1 1
35.5 57.13 3 1 35 56.33 5.96 2 1
34.5 55.52 4 1 34 54.72 4.09 5 1
33.5 53.91 3 1

- 114 -
33 53.11 4.10 1 1 32.5 52.30 1 1 32 51.50 6.21 1 1
31.5 50.69 1 1 31 49.89 6.51 1 1
30.5 49.08 1 1 30 48.28 6.72 1 1
29.5 47.48 2 1 29 46.67 7.61 2 1
28.5 45.87 3 1 28 45.06 8.66 2 1
27.5 44.26 2 1 27 43.45 8.30 2 1
26.5 42.65 1 1 26 41.84 7.03 1 1
25.5 41.04 1 1 25 40.23 6.38 1 1
24.5 39.43 1 1 24 38.62 6.62 1 1
23.5 37.82 2 1 23 37.01 6.57 2 1
22.5 36.21 1 1 22 35.41 7.40 1 1
21.5 34.60 1 1 21 33.80 6.93 3 1
20.5 32.99 3 1 20 32.19 6.46 2 1
19.5 31.38 2 1 19 30.58 6.63 2 1
18.5 29.77 2 1 18 28.97 6.56 1 1
17.5 28.16 1 1 17 27.36 6.56 1 1
16.5 26.55 1 1 16 25.75 6.68 1 1
15.5 24.94 1 1 15 24.14 6.55 1 1
14.5 23.34 1 1 14 22.53 6.53 2 1
13.5 21.73 1 1 13 20.92 7.08 1 1
12.5 20.12 1 1 12 19.31 7.47 2 1
11.5 18.51 2 1 11 17.70 7.54 2 1

- 115 -
10.5 16.90 3 1 10 16.09 7.95 2 1 9.5 15.29 2 1 9 14.48 7.53 1 1
8.5 13.68 2 1 8 12.87 6.86 2 1
7.5 12.07 1 1 7 11.27 6.96 2 1
6.5 10.46 2 1 6 9.66 7.89 1 1
5.5 8.85 2 1 5 8.05 8.08 1 1
4.5 7.24 2 1 4 6.44 7.35 3 1
3.5 5.63 2 1 3 4.83 6.82 1 1
2.5 4.02 2 1 2 3.22 9.13 2 1
1.5 2.41 1 1 1 1.61 11.32 1 1
0.5 0.80 2 1

- 116 -
APPENDIX B
DATA ON TRIBUTARY BASINS

- 117 -
Data on Tributary Basins of lower Yellowstone River Approximate location of confluence
River Mile Marker Distance from mouth (km) Tributary
Drainage Basin Area
(km2) 474.5 763.63 Duck Creek 221.41 465.25 748.75 Little Timber Creek 99.55 458.8 738.37 Big Timber creek 26.93 458.25 737.48 Boulder River 1349.38 457.75 736.68 Otter Creek 379.00 451.5 726.62 Upper Deer Creek 158.23 449.25 723.00 Sweetgrass Creek 913.53 440.75 709.32 Bridger Creek 187.22 431.25 694.03 White Beaver Creek 412.58 416.1 669.65 Stillwater River 2525.24 415.5 668.68 Keyser Creek 162.32 396.25 637.70 Valley Creek 241.85 382.4 615.41 Clarks Fork River 2988.85 373.5 601.09 Canyon Creek 1424.90 370.25 595.86 Blue Creek 169.79 363.15 584.43 Five Mile Creek 897.56 352.75 567.70 Pryor Creek 1550.27 347.9 559.89 Crooked Creek 458.89 346 556.83 Razor Creek 392.10
330.8 532.37 Pompey's Pillar Creek 293.23 328 527.86 Lost Boy Creek 764.91
326.4 525.29 Sand Creek 79.24 321.75 517.81 Cowgulch Creek 470.35 312.3 502.60 Hibbard Creek 764.91 304.85 490.61 Buffalo Creek 577.92
297 477.98 Bighorn River 59271.88 286.25 460.67 Alkali Creek 639.70 279.75 450.21 Muggins Creek 437.34 270.8 435.81 Froze to Death Creek 471.53 264.25 425.27 Sarpy Creek 1308.36 245.15 394.53 Big Porcupine Creek 2237.18 244.5 393.48 Armells Creek 942.81 230.65 371.20 Little Porcupine Creek 1565.86 229.45 369.26 Horse Creek 171.43 224.4 361.14 Rosebud Creek 3401.69 218.5 351.64 Sand Creek 275.77 214.1 344.56 Sweeney Creek 268.62 193.55 311.49 Moon Creek 222.21 183.85 295.88 Tongue River 13978.17
174 280.03 Sunday Creek 1900.27 167.9 270.21 Muster Creek 134.33 160.5 258.30 Cottonwood Creek 283.66 151.6 243.98 Custer Creek 414.80

- 118 -
148 238.18 Powder River 34159.35 133.5 214.85 Cherry Creek 983.94 128 206.00 O'Fallon Creek 4147.88
118.6 190.87 Bad Route Creek 405.10 111 178.64 Cabin Creek 999.56 106 170.59 Clear Creek 408.40
105.1 169.14 Cedar Creek 552.87 95.5 153.69 Upper Seven Mile Creek 423.17
90.65 145.89 Glendive Creek 769.77 86.35 138.97 Three Mile Creek 525.87
74 119.09 Thirteen Mile Creek 561.27 71.2 114.59 Box Elder Creek 354.37
66.25 106.62 Cottonwood Creek 325.20 62.25 100.18 Burns Creek 583.30 53.8 86.58 Smith Creek 459.81
33.75 54.32 Fox Creek 698.75 27.3 43.94 Bennie Peer Creek n/a 17 27.36 n/a 252.36
Flood Frequency Data at USGS Stream Gages
Stream Gage
Location Stil
lwat
er
Riv
er n
ear
Absa
roke
e
Cla
rk's
Fo
rk a
t E
dgar
Big
horn
R
iver
at
Tullo
ck
Ros
ebud
C
reek
at
Fors
yth
Tong
ue
Riv
er a
t M
iles
City
Pow
der
Riv
er n
ear
Loca
te
USGS Gage
Station Number 06
2050
00
0620
8500
0629
4500
0629
6000
0630
8500
0632
6500
Data
record 1911-1998
1922-1998
1982-1998
1948-1978
1938-1998
1938-1998
99.5 86.9 111.3 71.4 1.4 18.0 16.9 99 94.0 118.9 79.3 1.7 21.2 22.2 95 115.2 142.7 105.3 2.7 33.4 44.7 90 128.3 156.9 123.5 3.5 42.5 64.3 80 146.1 175.8 149.5 4.9 56.9 97.7 50 186.3 218.3 218.3 9.9 100.2 207.3 20 236.4 269.3 322.8 21.4 178.1 413.4 10 267.3 300.2 399.3 32.8 241.0 580.5 4 303.0 337.0 501.2 53.5 334.1 821.2 2 331.3 362.5 583.3 74.2 410.6 1016.6 1 356.8 385.1 668.3 100.5 498.4 1223.3
0.5 379.4 407.8 756.1 133.7 591.8 1441.3
Exc
eede
nce
prob
abili
ty --
Dis
char
ge
(cm
s)
0.2 413.4 438.9 883.5 190.6 733.4 1750.0

- 119 -
Stream Gage
Location
O'F
allo
n C
reek
nea
r Is
may
Yel
low
ston
e R
iver
nea
r Li
ving
ston
Yel
low
ston
e R
iver
at
Bill
ings
Yel
low
ston
e R
iver
at
Fors
yth
Yel
low
ston
e R
iver
at
Mile
s C
ity
Yel
low
ston
e R
iver
at
Sid
ney
USGS Gage
Station Number 06
3266
00
0619
2500
0621
4500
0629
5000
0630
9000
0632
9500
Data record
1962-1992
1897-1998
1904-1998
1921-1998
1923-1998
1911-1998
99.5 0.4 -- -- 580.5 557.8 498.4 99 0.6 -- -- 623.0 611.6 572.0 95 2.0 376.6 693.8 756.1 778.7 821.2 90 3.5 413.4 773.0 846.7 886.3 985.4 80 6.8 461.6 883.5 971.3 1033.6 1217.6 50 21.6 574.8 1135.5 1294.1 1379.0 1784.0 20 59.2 719.2 1461.1 1764.1 1829.3 2525.9 10 94.6 812.7 1667.9 2098.3 2115.3 3001.6 4 150.1 923.1 1917.1 2540.0 2466.4 3539.6 2 197.9 1005.2 2098.3 2888.3 2718.4 3936.0 1 250.3 1084.5 2276.7 3256.4 2973.3 4304.2
0.5 305.8 1163.8 2455.1 3624.6 3199.8 4672.3
Exc
eede
nce
prob
abili
ty –
Dis
char
ge
(cm
s)
0.2 387.9 1268.6 2687.3 4162.6 3539.6 5153.7

- 120 -
APPENDIX C
YELLOWSTONE RIVER CHANNEL CHARACTERISTICS

- 121 -
Yellowstone River Channel Elevation Data (collected from 1:24000 topographic maps)
River Mile Marker
Distance from mouth (km)
Elevation (km)
470.5 757.20 1.26 468.5 753.98 1.25
466.75 751.16 1.24 464.5 747.54 1.24 462.6 744.48 1.23
460.85 741.67 1.23 459 738.69 1.22
457.25 735.87 1.21 455.6 733.22 1.21 453.5 729.84 1.20
451.75 727.02 1.19 449.5 723.40 1.19 447.6 720.34 1.18 445.5 716.96 1.18
443.75 714.15 1.17 441.75 710.93 1.16
440 708.11 1.16 437.75 704.49 1.15 435.5 700.87 1.15 433.7 697.97 1.14 431.6 694.59 1.13 429.4 691.05 1.13 427 687.19 1.12
424.8 683.65 1.12 422.4 679.79 1.11 420.5 676.73 1.10 418 672.71 1.10
415.75 669.08 1.09 414.25 666.67 1.09 412.5 663.85 1.08
410.75 661.04 1.07 408.5 657.42 1.07
406.85 654.76 1.06 404.8 651.46 1.05 403 648.57 1.05
400.75 644.94 1.04 399.1 642.29 1.04
397.25 639.31 1.03 394.5 634.89 1.02 392.6 631.83 1.02
390.25 628.05 1.01 388.4 625.07 1.01
386.25 621.61 1.00 384.5 618.79 0.99 383 616.38 0.99

- 122 -
380.75 612.76 0.98 377.75 607.93 0.98 377.25 607.13 0.97 375.25 603.91 0.97
374 601.89 0.97 372.4 599.32 0.96
371.25 597.47 0.96 370.4 596.10 0.96 368.5 593.04 0.95 367.3 591.11 0.95 366.4 589.66 0.95
365.45 588.13 0.94 362.5 583.39 0.94
359.75 578.96 0.93 356.9 574.37 0.93 354.5 570.51 0.92 352.5 567.29 0.92 351 564.88 0.91
348.4 560.70 0.91 346.5 557.64 0.91
345.35 555.79 0.90 344 553.61 0.90
342.5 551.20 0.90 340.8 548.46 0.89 339 545.57 0.89
337.75 543.56 0.89 336.3 541.22 0.88 333.5 536.72 0.88 331.1 532.85 0.88 329 529.47 0.87
326.9 526.09 0.87 325.1 523.20 0.87 323.7 520.94 0.86 322.1 518.37 0.86
319.75 514.59 0.86 317.75 511.37 0.85 315.75 508.15 0.85 313.9 505.17 0.85
310.25 499.30 0.84 308.2 496.00 0.84 302.5 486.83 0.83
298.75 480.79 0.82 297.1 478.14 0.82 294 473.15 0.82
290.8 468.00 0.81 288.75 464.70 0.81 282.75 455.04 0.80 279.9 450.46 0.80 276.3 444.66 0.80
271.15 436.37 0.80

- 123 -
269.6 433.88 0.79 267.85 431.06 0.79 264.25 425.27 0.79 260.25 418.83 0.79 257.8 414.89 0.78 255 410.38 0.78
251.65 404.99 0.78 248 399.12 0.77
243.75 392.28 0.77 241.5 388.66 0.77
238.35 383.59 0.77 235.5 379.00 0.76 228.6 367.90 0.76 225 362.10 0.75
221.95 357.19 0.75 217.95 350.76 0.75
214 344.40 0.74 207.5 333.94 0.74 204.2 328.63 0.73 201 323.48 0.73
194.7 313.34 0.73 191.8 308.67 0.72 188.3 303.04 0.72
186.25 299.74 0.72 183.3 294.99 0.71 177.9 286.30 0.71 173 278.42 0.70
171.25 275.60 0.70 169.4 272.62 0.69 167.6 269.73 0.69 164.5 264.74 0.69
162.25 261.12 0.69 158.8 255.56 0.68
155.75 250.66 0.68 150.75 242.61 0.68
148 238.18 0.67 144.75 232.95 0.67 141.8 228.20 0.66
138.75 223.30 0.66 134.85 217.02 0.66 127.9 205.84 0.65 121 194.73 0.65 117 188.29 0.64
113.05 181.94 0.64 109.5 176.22 0.64 104.5 168.18 0.63 102.2 164.47 0.63 98.75 158.92 0.63 92.25 148.46 0.62 89.2 143.55 0.62

- 124 -
85.45 137.52 0.62 81.75 131.56 0.61 78.4 126.17 0.61 75 120.70 0.61
71.25 114.67 0.60 66.9 107.67 0.60 62.5 100.58 0.60 58.35 93.91 0.59 55.25 88.92 0.59
52 83.69 0.59 43.5 70.01 0.59 38.75 62.36 0.58 31.5 50.69 0.58 24.1 38.79 0.57

- 125 -
Elevation from LIDAR data and 1:24000 Topographic Map from Stillwater, West Yellowstone and Dawson Counties
River Mile
Marker
Distance from
mouth (km)
Elevation (km)
LIDAR data
Elevation (km)Topographic
Map (1:24000 scale)
Stillwater County 434.5 699.26 1.1420 434 698.46 1.1393
433.5 697.65 1.1349 1.14 433 696.85 1.1372
432.5 696.04 1.1353 432 695.24 1.1341
431.5 694.43 1.1323 1.13 431 693.63 1.1313
430.5 692.82 1.1315 430 692.02 1.1299
429.5 691.21 1.1276 1.13 429 690.41 1.1271
428.5 689.60 1.1261 428 688.80 1.1246
427.5 687.99 1.1234 427 687.19 1.1215 1.12
426.5 686.39 1.1192 426 685.58 1.1185
425.5 684.78 1.1156 425 683.97 1.1155 1.12
424.5 683.17 1.1140 424 682.36 1.1141
423.5 681.56 1.1127 423 680.75 1.1109
422.5 679.95 1.1086 1.11 422 679.14 1.1083
421.5 678.34 1.1056 421 677.53 1.1044
420.5 676.73 1.1031 1.10 420 675.92 1.1015
419.5 675.12 1.1000 419 674.32 1.0987
418.5 673.51 1.0984 1.10 418 672.71 1.0968
417.5 671.90 1.0957 417 671.10 1.0936
416.5 670.29 1.0916 416 669.49 1.0917 1.09
415.5 668.68 1.0894 415 667.88 1.0896 1.09
414.5 667.07 1.0841

- 126 -
414 666.27 1.0840 413.5 665.46 1.0815 413 664.66 1.0805
412.5 663.85 1.0787 1.08 412 663.05 1.0775
411.5 662.25 1.0750 411 661.44 1.0728 1.07
410.5 660.64 1.0713 410 659.83 1.0688
409.5 659.03 1.0686 409 658.22 1.0669
408.5 657.42 1.0634 1.07 408 656.61 1.0647
407.5 655.81 1.0618 407 655.00 1.0584 1.06
406.5 654.20 1.0582 406 653.39 1.0567
405.5 652.59 1.0550 405 651.78 1.0537 1.05
404.5 650.98 1.0521 404 650.17 1.0497
403.5 649.37 1.0488 403 648.57 1.0480 1.05
402.5 647.76 1.0467 402 646.96 1.0431
401.5 646.15 1.0414 401 645.35 1.0414 1.04
400.5 644.54 1.0372 400 643.74 1.0386
399.5 642.93 1.0372 399 642.13 1.0352 1.04
398.5 641.32 1.0341 398 640.52 1.0318
397.5 639.71 1.0302 397 638.91 1.0293 1.03
396.5 638.10 1.0273 396 637.30 1.0267
395.5 636.50 1.0228 395 635.69 1.0228
394.5 634.89 1.0239 1.02 394 634.08 1.0204
393.5 633.28 1.0199 393 632.47 1.0174
392.5 631.67 1.0151 1.02 392 630.86 1.0134
391.5 630.06 1.0130 391 629.25 1.0114
390.5 628.45 1.0107 1.01

- 127 -
West Yellowstone County 390 627.64 1.0079 1.01
389.5 626.84 1.0072 389 626.03 1.0054
388.5 625.23 1.0033 1.01 388 624.43 1.0021
387.5 623.62 1.0005 387 622.82 0.9999
386.5 622.01 0.9992 386 621.21 0.9974 1.00
385.5 620.40 0.9959 385 619.60 0.9942
384.5 618.79 0.9932 0.99 384 617.99 0.9915
383.5 617.18 0.9898 383 616.38 0.9874 0.99
382.5 615.57 0.9867 382 614.77 0.9849
381.5 613.96 0.9824 381 613.16 0.9806
380.5 612.36 0.9810 0.98 380 611.55 0.9805
379.5 610.75 0.9787 379 609.94 0.9764
378.5 609.14 0.9759 378 608.33 0.9747
377.5 607.53 0.9739 0.98 377 606.72 0.9709 0.97
376.5 605.92 0.9699 376 605.11 0.9696
375.5 604.31 0.9681 375 603.50 0.9666 0.97
374.5 602.70 0.9666 374 601.89 0.9641 0.97
373.5 601.09 0.9642 373 600.29 0.9611
372.5 599.48 0.9596 0.96 372 598.68 0.9600
371.5 597.87 0.9581 371 597.07 0.9566 0.96
370.5 596.26 0.9561 0.96 370 595.46 0.9557
369.5 594.65 0.9537 369 593.85 0.9523
368.5 593.04 0.9524 0.95 368 592.24 0.9502
367.5 591.43 0.9477 0.95 367 590.63 0.9478

- 128 -
366.5 589.82 0.9468
0.95 366 589.02 0.9464
365.5 588.22 0.9419 0.94 365 587.41 0.9404
364.5 586.61 0.9423 364 585.80 0.9402
363.5 585.00 0.9395 363 584.19 0.9386
362.5 583.39 0.9382 0.94 362 582.58 0.9364
361.5 581.78 0.9357 361 580.97 0.9342
360.5 580.17 0.9306 360 579.36 0.9311 0.93
359.5 578.56 0.9308 359 577.75 0.9296
358.5 576.95 0.9291 358 576.15 0.9270
357.5 575.34 0.9258 357 574.54 0.9235 0.93
356.5 573.73 0.9209 356 572.93 0.9222
355.5 572.12 0.9223 355 571.32 0.9204
354.5 570.51 0.9192 0.92 354 569.71 0.9180
353.5 568.90 0.9178 353 568.10 0.9155
352.5 567.29 0.9154 0.92 352 566.49 0.9130
351.5 565.68 0.9115 351 564.88 0.9122 0.91
350.5 564.08 0.9117 350 563.27 0.9094
349.5 562.47 0.9102 349 561.66 0.9078
348.5 560.86 0.9068 0.91 348 560.05 0.9063
347.5 559.25 0.9038 347 558.44 0.9029
346.5 557.64 0.9005 0.91 346 556.83 0.9024
345.5 556.03 0.9000 0.90 345 555.22 0.8998
344.5 554.42 0.8996 344 553.61 0.8970 0.90
343.5 552.81 0.8957

- 129 -
Dawson County 119 191.51 0.6445 118 189.90 0.6441 117 188.29 0.6434 0.64 116 186.68 0.6428 115 185.07 0.6421 114 183.47 0.6414 113 181.86 0.6406 0.64 112 180.25 0.6396 111 178.64 0.6386 110 177.03 0.6376 0.64 109 175.42 0.6371 108 173.81 0.6361 107 172.20 0.6351 106 170.59 0.6339 105 168.98 0.6315 0.63 104 167.37 0.6318 103 165.76 0.6305 102 164.15 0.6297 0.63 101 162.54 0.6279 100 160.93 0.6265 99 159.33 0.6269 0.63 98 157.72 0.6255 97 156.11 0.6237 96 154.50 0.6239 95 152.89 0.6220 94 151.28 0.6224 93 149.67 0.6217 92 148.06 0.6198 0.62 91 146.45 0.6188 90 144.84 0.6184 89 143.23 0.6181 0.62 88 141.62 0.6175 87 140.01 0.6161 86 138.40 0.6151 85 136.79 0.6139 0.62 84 135.18 0.6132 83 133.58 0.6123 82 131.97 0.6123 0.61 81 130.36 0.6115 80 128.75 0.6105 79 127.14 0.6098 78 125.53 0.6093 0.61 77 123.92 0.6086 76 122.31 0.6077 75 120.70 0.6072 0.61 74 119.09 0.6071 73 117.48 0.6057

- 130 -
72 115.87 0.6036 71 114.26 0.6029 0.60 70 112.65 0.6019 0.60 69 111.04 0.6006 68 109.44 0.6002 67 107.83 0.5995 66 106.22 0.5989 65 104.61 0.5981