manufacturing strategies in action: the case of electro ... · edson pinheiro de limab ... in his...
TRANSCRIPT
Brazilian Journal of Operations & Production ManagementVolume 7, Number 1, 2010, pp. 09-35
9
Manufacturing Strategies in Action: The Case of Electro-Electronic Domestic Appliances (EDA)
Oswaldo A. N. Borges de Menezesa
a Nogara Menezes Consultoria
Edson Pinheiro de Limab
b Universidade Tecnológica Federal do Paraná (UTFPR), Curitiba, Brazil
Sergio E. Gouvea da Costac
c Pontifícia Universidade Católica do Paraná (PUC-PR), Curitiba, Brazil
AbstractThe companies’ manufacturing strategies are frequently conceived at business
strategic levels and put into practice along their value chains. Based on a company’s position, mission, values and vision, strategic planning defines a trajectory, as well as the requirements for the company’s organizational and management processes. Often, there is a gap between the highest hierarchical level and the operational levels with respect to the implementation of strategies. Based upon a literature review, this paper proposes a model that integrates the production processes to the strategic management levels. This model is implemented as a Strategic Manufacturing Management System (SMMS), which establishes a coherent set of strategic management processes for the manufacture function. SMMS is fundamentally structured as a multileveled Balanced Scorecard (BSC) that creates rationalities to plan, implement and control strategies. The decision-making, communication and learning processes are carried out by means of the strategic management system. The management system is monitored and evolves according to a selected set of measurements that gives the final form to the strategic management system. The SMMS was tested in an electro-electronic appliances company and the results from the first year since its implementation are presented. The proposed model is guided by the BSC architecture, but it also uses specific techniques, procedures and tools that were customized for the company at issue. The final result is a guiding framework for the integration, design, implementation and management of a manufacturing strategy.
Keywords: Manufacturing strategy, Performance measurement, Balanced Scorecard, Case study
Brazilian Journal of Operations & Production ManagementVolume 7, Number 1, 2010, pp. 09-35
10
IntroductionThe conception of a strategy in a manufacturing company is generally
defined in a top-down approach, but it is executed at the value chain level. The business strategy defines a company’s choices, which include its mission, values and vision. Although they are absolutely relevant, these topics are instinctive and broad. On the other hand, when one mentions the value chain, the business strategies are only data, and must be figured out by all the employees involved, and must also be correctly executed, to assure that “all the involved forces” will go in the same direction (Hill, 2000).
Difficulties may be observed when employees with value chain activities try to think of and explain their conceptions about a business strategy’s contents, and try to identify their contribution so that this strategy may be achieved. Therefore, there is a gap between how a strategy is conceived in the highest hierarchical level and how it is understood in the value chain level (Widener, 2006; Decoene and Bruggeman, 2006; Daniels and Burns, 1997a; Daniels and Burns, 1997b; Skinner, 1985).
Until the beginning of the 1980s, in the United States, managers viewed manufacturing the same way they used to do a century before. The North-American manufacturing system, which emphasized mass production, also standardized designs, with interchangeable pieces, and revolutionized the manufacturing system in the first half of the 20th century. Through scientific management methods developed by Frederick Taylor and his disciples, and the impetus of large companies such as the Ford Motors Co., the United States became an industrial power circa 1920 (Voss, 1992).
Industries should produce in large scale, using dedicated equipment for each process and inventories as buffers between the different process stages. Those buffers should be capable of absorbing variations determined by unexpected behaviour of suppliers, customers and the industries’ own internal processes. Activities should be organized and conducted systematically and under strict supervision (Fleury, 1990).
In 1969, in his classic article ‘Manufacturing-Missing Link in Corporate Strategy‘, Skinner (1969) challenged Taylor’s statement in which the latter states that there is only one way to produce, when Skinner introduced the concept of manufacturing strategy. The basis for Skinner’s argument was: (a) companies have different strengths and weaknesses, and make options by differentiating themselves from their competitors in different ways; (b) different production systems have different operational characteristics and there is no such thing as a unique standard system for industrial production; (c) the real task of a company’s manufacturing organization is to set up a production system which, through a series of inter-related and internally consistent choices, will reflect the priorities and trade-offs that are implicit in its strategic and competitive position.
Several authors have dedicated themselves to study manufacturing strategies with respect to their structures (contents), as well as to the issues related to
Brazilian Journal of Operations & Production ManagementVolume 7, Number 1, 2010, pp. 09-35
11
their development and implementation, this is, the processes (Leong et al., 1990). To complete the structure model of strategic management, a performance measurement system is an important management tool to ensure the smooth progress of strategic actions (Neely et al., 1994). However, it is observed that many of the studies involving manufacturing strategies and performance measurements are ‘untied’ to real-world operations, or there are problems between the development of strategic management models and their implementation and use (Platts, 2001; Platts, 1993).
A gap has been observed between the knowledge that is conceived about models for management strategy and their implementation and use (Sousa et al., 2006). In many cases companies find difficulties to strategically manage their performance (Bourne et al., 2005; Franco-Santos and Bourne, 2003) because they do not adopt a systemic approach (Najmi et al., 2005). Particularly in manufacturing, it is important to understand the logic of performance, by defining its dimensions and its integration to strategy (Bond, 1999; Daniels and Burns, 1997a; Daniels and Burns, 1997b).
This paper intends to supply an aid for the understanding of procedures for the implementation of strategic manufacturing management systems, using a model that considers implementation aspects of the design stage (Wouters and Sportel, 2005; Tangen, 2005), aiming at the development of sustainable processes and continuous improvement (Bhuiyan and Baghel, 2005), in order to support strategy and performance multidimensional definitions (Takala et al., 2006; Koll et al., 2005; Gomes et al., 2004) and also, integrate market oriented approaches and manufacturing resources (Grossler and Grubner, 2006; Fink et al., 2005).
In order to suggest practical solutions to strategic production management, or to provide managers in the manufacturing area with a logical model based on processes and management techniques to improve performance, a model was developed for Strategic Manufacturing Management, deploying the business strategies within the manufacturing function, by formulating and implementing a manufacturing strategy and a performance measurement system, and taking as reference the Balanced Scorecard (BSC) model for strategic management. This paper presents the model that was developed, describes its operation and tests its use in a case study inside a company from the electro-electronic sector, using data from the period of one year from its implementation (from May 2004 to May 2005).
Research MethodologyThe research described in this paper has an exploratory approach, which
involves the development of a Strategic Manufacturing Management System (SMMS) prepared to identify, set out and make clear the links that exist between the strategic objectives developed by the higher hierarchical levels and the actions taken by the operational levels in a manufacturing company, managing the activities and initiatives by means of performance indicators.
This analysis was carried out by: (a) concepts regarding manufacturing strategy; (b) the Balanced Scorecard approach; (c) the Performance Dimensions

Brazilian Journal of Operations & Production ManagementVolume 7, Number 1, 2010, pp. 09-35
12
model (Neely et al., 1994); (d) the model for structuring the use of Performance Measurement Systems, proposed by Martins (1998) and adapted according to the framework Martins suggested, and (e) other concepts related to: performance measurement systems, competitive strategies, functional strategies, manufacture competitive criteria, process management and design, and the implementation of performance measurement systems critical aspects analysis.
This research was carried out through the use of action-research. This method is a social research with empirical bases that is conceived and implemented in narrow association with ‘intervening action’, being an essentially qualitative, participatory and cyclical process (Santos, 1999).
This research was developed in one of the manufacturing areas of a large-scale industrial company and includes basically four areas: Manufacturing Engineering, Plastic Injection, Assembly and Motor Manufacturing, each one of them under the responsibility of a multifunctional team.
Managers, supervisors and process team leaders initially composed the multifunctional teams. They were divided into four workgroups that would periodically meet to evaluate the results that were obtained, discuss the evolution of the project and other important issues, and evaluate future activities.
Once the research process was running and considering the obtained results, personnel from the Maintenance, Moulds, Quality and Product Engineering areas joined the workgroups. The results during the planning step were evaluated by checkpoints at the end of each step, with two possible actions: (C) Change or (F) Follow (Exhibit 1).
Exhibit 1 - Process checkpoints
Step Description Checkpoint
1 Establish the perceived vision and strategy
Are manufacturing objectives identified and distributed throughout the four BSC perspectives?
2 Define diagnostics and improvement programs
Are the individual measures identified and balanced according to the competitive manufacturing objectives?
3Design the performance management system based on BSC
Is the performance measurement system structured and based on BSC?
4 Organizing for action
Are the manufacturing strategic objectives translated into processes, as well as into understandable and measurable actions?
The main principle that guided this research was a discussion, in the industrial environment, of important ideas that surround the academic environment,

Brazilian Journal of Operations & Production ManagementVolume 7, Number 1, 2010, pp. 09-35
13
such as performance measurement, manufacturing strategy and industrial management, especially as to how they are applied.
This interaction allowed the elaboration of a consistent rationality based on ‘real state’ requirements, in order to conceive a typical performance management system for a manufacturing company.
The approach that was developed serves as practical means to mobilize users, stakeholders and strategies for manufacturing management, as well as the daily operational issues that arise from their interaction.
Data gathering was carried out through interviews, meetings, document analyses, direct observation and frequent interactions with the shop floor level.
Developing the Theoretical ModelAccording to Hofer and Schendel (1978), a typical organization must
consider three strategy levels: corporate strategy, business strategy and functional strategy. A corporate strategy describes the direction a company follows. A business strategy occurs at the business unit levels. A functional strategy refers to the development of skills that qualify the company or business unit to achieve a competitive advantage. These three strategies are not mutually excluding and should lead to the implementation of a particular strategy.
A manufacturing strategy refers to the way a company uses its manufacturing resources and effectively uses its strengths to complement the business strategy (Hayes and Wheelwright, 1984).
From the foregoing, it may be argued that the alignment between a business strategy and the manufacturing strategy can be seen from two different perspectives. On the one hand, a business strategy must be based on manufacturing capabilities, on the other, the manufacturing strategy must support the business strategy. Sun and Hong (2002) conducted a research involving more than 20 countries in order to verify if the alignment between the manufacturing and business strategies was able to contribute to the improvement of a company’s performance on issues related to quality, profitability and market share, among others. That study emphasizes that:
• Only when the manufacturing and business strategies are aligned, manufacturing will support the business. Accordingly, although the manufacturing performance is improved, the business’ performance may not. Ultimately, if there is no alignment, manufacturing efforts are simply lost.
• In addition to the alignment between the two strategies, there are many other factors that contribute to a company’s performance as a whole. However, in general, successful companies develop a manufacturing strategy that is coherent and consistent with the business strategy.
• Excluding manufacturing from a company’s strategic planning process
Brazilian Journal of Operations & Production ManagementVolume 7, Number 1, 2010, pp. 09-35
14
results is not considering the capabilities and manufacturing limitations regarding the decisions made.
• The internal alignment between manufacturing objectives, processes, technology, organization and human resources should also be considered. Investment and changes in the manufacturing processes should be aligned with the company’s objectives because, otherwise, manufacturing efforts, although efficient in the operational level, may imply only in losses.
• The study did not suggest that manufacturing is the only function that contributes to a company’s strategy. The process should include strategic marketing, manufacturing, R&D and human resources. It is necessary to develop processes, techniques and tools, and to consider a multifunctional perspective regarding the corporate strategy formulation.
The main objective with Balanced Scorecards (BSC) is to translate business strategies and a strategic vision into strategic objectives, which can be communicated and understood by all the operational levels. Therefore, the expected result is a clear and precise identification of the desired business performance, according to the targets set out in the planning process (Kaplan and Norton, 1996). A BSC promotes the alignment of strategic objectives with performance indicators, targets and action plans. Thus, it is possible to manage a strategy in an integrated manner and ensure that the organization’s efforts are directed towards realizing the strategy (Kaplan and Norton, 1993).
Despite the many criticisms that could be made to the implementation and use of BSC (Voelpel et al., 2006; Fink et al., 2005), it is still widely used and its applications and uses are improving rapidly, establishing a ‘consolidated’ technique to design and implement strategic management systems (Paranjape et al., 2006; Kaplan and Norton, 2006).
Applications of the strategic management framework proposed by a BSC in the functional levels are increasingly becoming common. This work is part of this set of initiatives and creates a model to integrate the business strategy and the manufacturing strategy levels (Garg and Deshmukh, 2006; Alsyouf, 2006).
According to Santos (2002), viewing the relationship that should exist between the strategic objectives (and the measures associated with them) and the implementation and dissemination of strategies by BSC allows everyone to understand what must be done to meet the goals and how people’s actions impact on the rest of a company. BSC is used, therefore, to fill the gap between the strategies designed by the highest levels in the hierarchy and the actions undertaken at the shop floor.
BSC applications have been developed for strategic management. Particularly, it could be applied to operations strategic management. In the operations management literature, we can point out articles by Vokurka and Fliedner (1995), who introduce works about designing systems to measure the performance of operations; by Fernandes et al. (2006) in the study of the implementation of BSC in small and

Brazilian Journal of Operations & Production ManagementVolume 7, Number 1, 2010, pp. 09-35
15
medium-sized manufacturing companies; by Fernandes et al. (2005) in multi-level and multi-functional analyses; in studies about the strategic alignment and implementation processes developed by Decoene and Bruggeman (2006), and by Ip and Koo (2004); studies related to strategic manufacturing and performance management by Paranjape et al. (2006).
Particularly in those texts related to manufacturing, the literature that deals with the implementation of BSC is clear in pointing out that this is a critical stage to reach the real benefits that this strategic management model can render (Paranjape et al., 2006; Sanger, 1998).
In his research about performance measurement systems (PMS) and how organizations use them, Martins (1998) discovered that, in general, companies that use PMSs had focus on control activities as their primary purpose. Organizations stopped using PMSs for improvement purposes. The author also identified that this occurred largely due to how they were organized. Improvement activities are usually delegated to the manufacturing companies’ operational levels and they need speed, agility and a higher updating frequency. The PMSs of the companies that were surveyed were not adequate for these requirements. In his work, Martins (1998) proposed a framework, which is reproduced in Figure 1, to structure the use of PMSs to eliminate that gap. According to Martins (1998), the information used as set points for performance measurement systems comes from setting goals and targets conceived in the planning activity. Therefore, those actions taken to achieve goals are controlled by standards and results, which are supplied by the performance measurement system. The control function, which is held soon after partial or total actions are completed, triggers three types of action.
The first one, which is not represented in Figure 1, is to continue the implementation of plans, provided no significant deviations are detected from what had been planned. The second activity is to immediately take a corrective action, adjusting the course of action so that no changes occur in the action that was planned. The third type of action is to accomplish reactive improvements in order to solve chronic performance problems, or other serious problems that had been temporarily corrected, which now demand a more detailed study. An arrow between those two activities represents this activity.
Finally, the information on performance is used in the proactive improvement activity, which does not necessarily precede the activities described above. The proactive improvement activity aims at concentrating the spontaneous efforts - not reactive approach - of people who especially try to anticipate themselves to the problems that may arise, by removing their causes. This type of activity has a strong connection with the use of people’s creativity.
The main advantage of using the method proposed by Martins (1998) is that it gives an emphasis to the use of information for reactive and proactive improvement, in order to improve a company’s overall performance.

Brazilian Journal of Operations & Production ManagementVolume 7, Number 1, 2010, pp. 09-35
16
Figure 1 - Model to structure the use of PMS information. [Source: Martins (1998)]
Given the theoretical elements set out in strategic manufacturing management and performance improvement context, one can propose a model for manufacturing strategic management.
Manufacturing Strategic ManagementThe development of a strategic management model is based on a
methodological approach that is generated to implement and use that model. It is supported by a changing process approach with the following characteristics: the manufacturing strategy formulating process developed by Platts (1994), the principles of adoption and implementation of organizational innovations by Linton (2002), the strategic management recommendations by Fernandes et al. (2006), the strategic learning based on an approach that integrates planning and execution, by Harrison and Boyle (2006), the management principles and participatory implementation proposed by Decoene and Bruggeman (2006), the development of private solutions and hybrid models recommended by Ip and Koo (2004), and the strategic manufacturing and performance management models developed by Chenhall (2005) and Paranjape et al. (2006).
From the conceptual framework that was presented, the proposal in this paper was developed by means of a Strategic Manufacturing Management System (SMMS) that considered issues involving its design, deployment and management. The purpose with this SMMS is to help managers to understand and translate the manufacturing objectives into executable actions on the shop floor level, for better performance. This improved performance should be represented by the evolution of those indicators related to the fulfilment of those goals set out by the deployment
Manufacturing
Strategy
Planning
Action
Objectives (targets)
Performance Measurement
System
Control
Corrective
Action
Reactive Improvement
Proactive Improvement

Brazilian Journal of Operations & Production ManagementVolume 7, Number 1, 2010, pp. 09-35
17
of business strategy, which will be defined by the SMMS. Thus, the Strategic Manufacturing Management System must:
• Improve the manufacturing performance through achievement or positive development of the most representative indicators, as defined by the business and manufacturing strategies.
• Align efforts for the development and achievement of the manufacturing objectives, creating synergies and avoiding (or reducing) the effects of the search for local results to the detriment of the whole.
• Communicate the strategies to employees at the operational level, allowing them to understand goals and up to what extent their actions may affect the entire company.
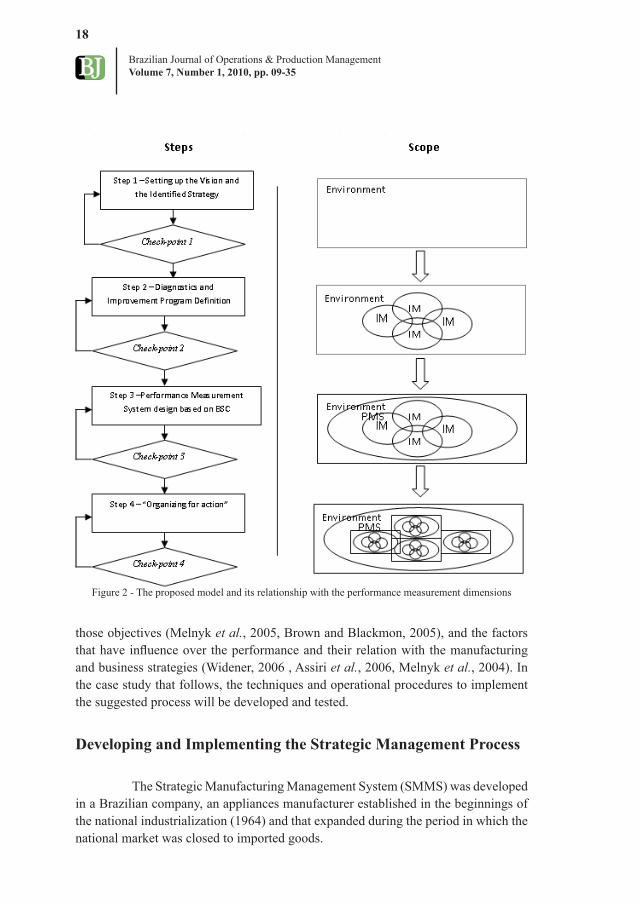
The model was developed through a process that comprises four stages, shown in Figure 2. At the end of each planning stage (Stages 1 to 4) checkpoints were established on which of two specific actions are possible: (C) Change or (F) Follow.
The steps are:
• Step 1 - Establish the Perceived Vision and Strategy – the manufacturing objectives are identified and distributed considering and throughout the four BSC perspectives. This step is executed considering the following factors: (a) the assessment of the environment where the performance management system will be inserted, (b) the objectives defined in the manufacturing strategic planning process, and (c) the manufacturing vision.
• Step 2 – Define the Diagnostics and Improvement Programs – the individual measures are evaluated, as well as the relationships they keep with the environment. They are balanced according to the manufacturing competitive dimensions (quality, time, cost and flexibility).
• Step 3 – Design the Performance Management System, based on BSC. This step is performed using the results of Steps 1 and 2. Its purpose is to define and confirm the corporate strategy, and the manufacturing goals and their relationship with the indicators established in the first and second steps.
• Step 4 – Organizing for Action. The goal is to translate the manufacturing strategic objectives into processes and into understandable and measurable actions that workers can take, as well as to establish a method for the management of measurements that the performance measurement system supplies.
By informing managers and professionals who work in the manufacturing areas what is the intention with creating a manufacturing management framework, they can understand: the deployment process and strategic integration in the different hierarchical levels and functions (Tapinos et al., 2005, Rusjan, 2005), the alignment between the business strategy and the manufacturing strategy by reaching between the
Brazilian Journal of Operations & Production ManagementVolume 7, Number 1, 2010, pp. 09-35
18
business strategy and the manufacturing strategy by reaching
Figure 2 - The proposed model and its relationship with the performance measurement dimensions
those objectives (Melnyk et al., 2005, Brown and Blackmon, 2005), and the factors that have influence over the performance and their relation with the manufacturing and business strategies (Widener, 2006 , Assiri et al., 2006, Melnyk et al., 2004). In the case study that follows, the techniques and operational procedures to implement the suggested process will be developed and tested.
Developing and Implementing the Strategic Management Process
The Strategic Manufacturing Management System (SMMS) was developed in a Brazilian company, an appliances manufacturer established in the beginnings of the national industrialization (1964) and that expanded during the period in which the national market was closed to imported goods.
Brazilian Journal of Operations & Production ManagementVolume 7, Number 1, 2010, pp. 09-35
19
When the economy’s opening process took place, new external competitors appeared, and the internal ones grew more competitive. From that point on, the company and its operation were redesigned giving a new solution for the industrial and administrative structures. The challenge this company faced was the need to continue increasing its productivity on the shop floor level.
By the time the SMMS was developed, the company had a formal strategic planning process, but had difficulties in running it successfully. It also had a results participation program connected to the achievement of proposed targets that generally were not related to the strategic objectives.
The company has currently two plants: one in the State of Paraná and the other in the State of Bahia. This process was applied from 2004, in Paraná’s industrial plant, whose group of employees added up 612 people, 426 of which were direct labour.
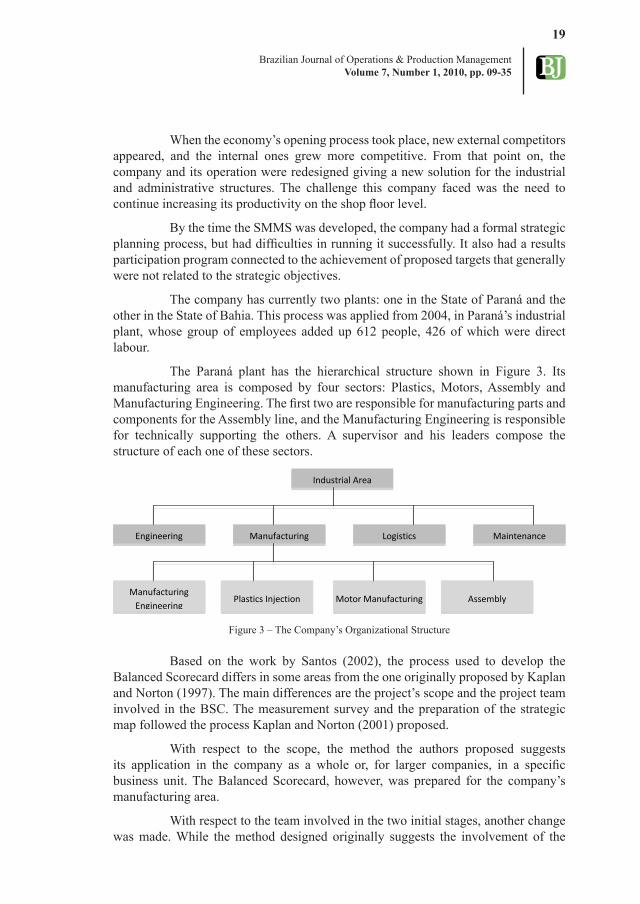
The Paraná plant has the hierarchical structure shown in Figure 3. Its manufacturing area is composed by four sectors: Plastics, Motors, Assembly and Manufacturing Engineering. The first two are responsible for manufacturing parts and components for the Assembly line, and the Manufacturing Engineering is responsible for technically supporting the others. A supervisor and his leaders compose the structure of each one of these sectors.
Figure 3 – The Company’s Organizational Structure
Based on the work by Santos (2002), the process used to develop the Balanced Scorecard differs in some areas from the one originally proposed by Kaplan and Norton (1997). The main differences are the project’s scope and the project team involved in the BSC. The measurement survey and the preparation of the strategic map followed the process Kaplan and Norton (2001) proposed.
With respect to the scope, the method the authors proposed suggests its application in the company as a whole or, for larger companies, in a specific business unit. The Balanced Scorecard, however, was prepared for the company’s manufacturing area.
With respect to the team involved in the two initial stages, another change was made. While the method designed originally suggests the involvement of the
Industrial Area
Engineering Manufacturing Logistics Maintenance
Manufacturing Engineering
Plastics Injection Motor Manufacturing Assembly

Brazilian Journal of Operations & Production ManagementVolume 7, Number 1, 2010, pp. 09-35
20
board’s first levels, the implementation of the suggested model included a team formed by managers from the manufacturing areas, the manufacturing manager and the industrial director.
Implementation of the SMMS
Stage 1: Setting up the Vision and the Identified Strategy
The development of the strategic manufacturing management model takes the form of the model illustrated in Figure 2. In its initial phase - Stage 1, the activities were organized in meetings that included the managers of the involved areas: Manufacturing Engineering, Plastics, Motor Manufacturing and Assembly. It was sought to identify the perceived vision about the company’s strategy and up to what degree this was aligned with the existing performance indicators. With this purpose, a formal strategic planning was used and an analysis of the strategic objectives set out by the company’s board for the manufacturing area was carried out. The results evidenced that:
• According to the team’s analysis, the following facts could be considered as causes of imperfections in the strategic planning implementation: a) operational workers could not understand the manufacturing strategy and how they could contribute to its execution; b) the strategy was not connected to the objectives of the participation in results program; c) managers did not systematically discuss the company’s strategies.
• A consensus on the Manufacturing Strategy was obtained. The following strategic objectives were identified: a) comply with the production volumes, b) comply with the quality levels defined by the products project specifications, c) delivery due dates, d) optimisation of production resources, e) produce with costs that are compatible with the market, f) reduce losses in the productive process, g) enable, motivate and engage the work force, and h) improve the integration between the two company’s plants.
Stage 2: Defining the Diagnostics and Improvement Programs
The purpose in this Stage was to identify the existing indicators and determine which of them managers considered the most important and whether they were for their specific areas or for the plant as a whole. Thus, the indicators that were surveyed were those that managers used for internal control in their areas, those that were employed to report performance to the upper levels in the plant hierarchy, those defined for performance measurement of business-oriented units, according to ISO 9001 and that were related to the Participation in Results Program and finally, the measurements used for management in each one of the manufacturing sectors. Once the information gathered in the meetings was available, the following step was to consolidate the indicators and to compare them with the plant’s leading or strategic

Brazilian Journal of Operations & Production ManagementVolume 7, Number 1, 2010, pp. 09-35
21
indicators. As a result of this Stage, the Manufacturing Strategy was summarized as being “To comply with the production volumes, with quality and productivity, and making optimum use of production resources”.
This broad and generic objective was translated by the developing team as being compliant to four objectives defined as:
a) “Compliance with the Production Volumes…”, which is defined as being the ratio between the volume production realized monthly and the production volume planned for that same period;
b) “Compliance with quality…”: the quality indicator is the rate of non-ok (NOK) products found during the quality audit in the finished products warehouse, defined as the ratio between NOK products and the total amount of inspected parts;
c) “Compliance with productivity…”: the productivity indicator was translated as being the ratio between the number of Equivalent Units (E.U.) produced and the number of men-day;
d) “Comply with the optimisation of production resources” - the optimisation of production resources was translated as the reduction in losses, and the corresponding indicator was defined as the ratio between the scrap’s financial value and the total financial value of the materials consumed during production.
Stage 3: Designing the Performance Management System, based on the BSC
In this Stage, three basic improvement programs were defined and associated to the BSC perspectives and then, they were linked to the strategic objectives managers identified in Stage 2, according to the first level strategic map, shown in Figure 4. Those programs were the Quality and Productivity Program, the Loss Reduction Program and the Competence Development Program.
During this Stage all the programs defined in the strategic map pictured in Figure 4 were deployed in processes and activities applied in each one of the manufacturing sectors, while the implementation of the project was being developed, thus generating the second level strategic map, as demonstrated in Figure 5.
Stage 4: Organizing for Action
In this Stage, adapting and structuring the performance measurement systems was used as a tool, as proposed by Martins (1998), whose overall vision is illustrated in Figure 1.
Activities were monitored periodically through presentations the functional teams developed and in which are assessed the indicators obtained and their evolution. The strategy used for this analysis was to use the corresponding strategic maps of each

Brazilian Journal of Operations & Production ManagementVolume 7, Number 1, 2010, pp. 09-35
22
Figure 4 - Stage 3: Level 1 Strategic Map
functional team, for each and every program. The period of time between presentations must be compatible with the actions to be executed, this is, neither too short so that discussions are not redundant, nor so long that it may cause a lack of focus and dispersion of the effort applied. During these presentations the functional groups assess and discuss each program separately. The functional groups’ presentations have fixed agendas that involve control activities, as well as discussion and improvement of actions.
Once the Strategic Manufacturing Management System is conceived and the criteria for its implementation are established, the discussion of results produced along a one-year period of use can then take place.
Analysing the Strategic Management Process ResultsFor the objectives defined in Stage 2, the following results are presented,
with the corresponding analysis.
With respect to the objective in ‘Compliance with the production volumes…’ the chart in Figure 6 shows the evolution related to this measurement.
Financial
Customers
Internal Processes
Learning and Growth
Profit
Achieve volumes with low costs, quality and resources
optimization
Loss Reduction Program
Quality and Productivity Program
Competence Development Program
Train, motivate and to commit
Reduce operational
costs
Reduce Processes’
Losses
Optimize productivity
Achieve quality
Products profitability
Ambiente
MISSION “Why we exist”
VALUES “What we believe in”
VISION “What we want to be”
STRATEGY “Our game plan”
MANUFACTURING OBJECTIVES “Quality, Cost, Production, Motivation and Safety”
BALANCED SCORECARD LEVEL 1 “Translation, Focus e Alignment”
PROCESSES PRIORIZATION “What we need to improve”
ORGANIZING FOR ACTION “Why and How to do”
STRATEGIC RESULTS
SHAREHOLDERS
Satisfied
CUSTOMERS Satisfied
PROCESSES Efficient and
Effective
PERSONNEL Motivated and
Prepared
BALANCED SCORECARD LEVEL 2 “Focus and Alignment of the developed action plans”

Brazilian Journal of Operations & Production ManagementVolume 7, Number 1, 2010, pp. 09-35
23
Figure 5 - Stage 3: Level 2 Strategic Map, specified for the application
Exhibit 2 shows the development of this objective, which is related to the production volume, and lists the action plans with those actions that rendered higher contributions for that production volume.
The ideal situation for the indicator presented in Figure 6, is that it achieves 100%, given that below this level the indication is a NOK to the stated planning program and, moreover, it implies in wasting resources due to over dimensioning. Hence, the way to reach maximum revenue is to quantify resources in the most accurate way (through the proper controls) and to prevent interferences that may lead to production losses due to the lack of components, machine downtimes or tool maintenance, quality issues, or any other reason.
Analysing Exhibit 2 with respect to the main actions those workgroups developed, the machine real time management software implementations that showed good results should be pointed out. These implementations were made in the plastics sector and they allowed an increase in productivity (by means of better control of process parameters) and in equipment availability (due to the machine and mould maintenance program). Also, by searching and using solutions to reduce the times for exchanging tools.
Financial
Customers
Internal Processes
Learning and Growth
Profit
Achieve volumes with low costs, quality and resources optimization
Loss Reduction Program
Quality and Productivity Program
Competence Development Program
Train, motivate and to commit
Reduce Operational
Costs
Reduce Processes’Losses
Optimize resources
Achieve quality
Products profitability
Ambiente
Quality and Productivity Program
Financial
Customers
Internal Processes
Learning and Growth
Ambiente
Profit
Achieve volumes with low costs, quality and resources optimization
Improve 5%on productivity
over last year
Achieve quality levels in finished products Audits
Actions related to internal processes to be developed by the Cost Center management team and approved by the senior management. Ex: operators individual
control, manufacturing cells etc.
Actions to support the internal processes to be developed by the Cost Center management team. Ex:
Trainings, Ergonomic analysis, Facilities etc.

Brazilian Journal of Operations & Production ManagementVolume 7, Number 1, 2010, pp. 09-35
24
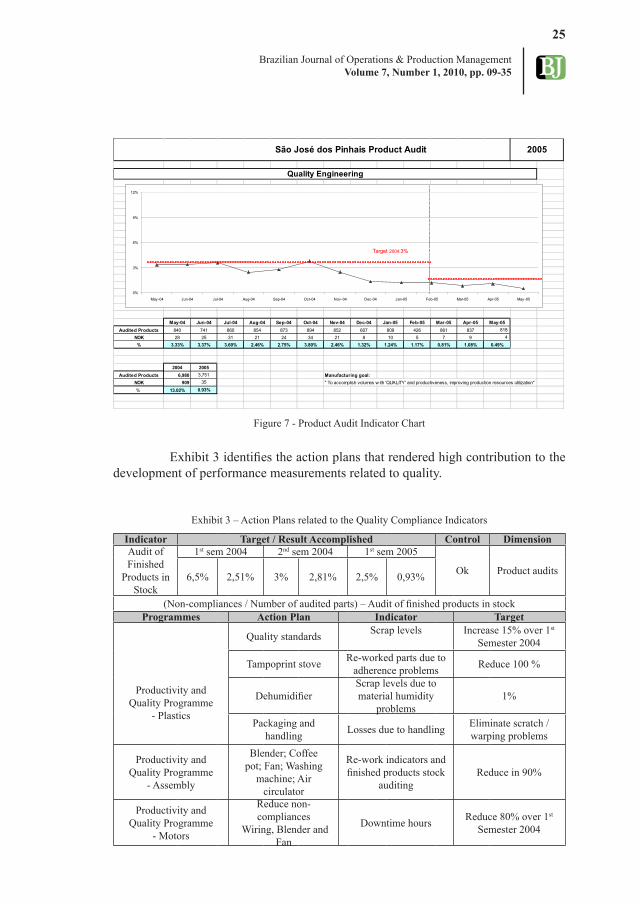
The objective ‘Compliance with quality… ‘, whose results are represented in Figure 7, can be studied and analysed throughout the one-year use of SMMS.
May-04 Jun-04 Jul-04 Aug-04 Sep-04 Oct-04 Nov-04 Dec-04 Jan-05 Feb-05 Mar-05 Apr-05 May-05Planned 167807 85476 132,610 141,834 182,970 193,971 202,821 79,839 121,757 68,275 113,599 127,316 106,871
Accomplished 165954 92589 136,805 144,471 175,979 190,072 203,336 79,457 122,125 69,148 115,550 127,757 107,904 % 98.90% 108.32% 103.16% 101.86% 96.18% 97.99% 100.25% 99.52% 100.30% 101.28% 101.72% 100.35% 100.97%
2004 2005Planned 1,836,734 537,818 Manufacturing goal:
Accomplished 1,849,969 542,484 " To accomplish 'VOLUMES' w ith quality and productiveness, improving production resources utilization"% 100.72% 100.87%
São José dos Pinhais Volumes Achievement 2005
Manufacturing Engineering
0 %
2 0 %
4 0 %
6 0 %
8 0 %
10 0 %
12 0 %
14 0 %
M a y-0 4 J u n -0 4 J u l-0 4 A u g -0 4 S e p -0 4 O c t -0 4 N o v -0 4 D e c -0 4 J a n -0 5 F e b -0 5 M a r -0 5 A p r -0 5 M a y-0 5
Target:100%
Figure 6 – Compliance with Production Volumes
Exhibit 2 - Action Plans related to the Compliance with Production Volumes
Indicator Target / Result Accomplished Control DimensionTrue
production versus
Programmed production
1st sem 2004 2nd sem 2004 1st sem 2005
Ok Volume100% 98,92% 100% 100,67% 100% 100,87%
Programmes Action Plan Indicator Target
Productivity and Quality Programme
- Plastics
Real time software for machine control
OEE – Overall Equipment
Effectiveness
Increase 15% over 1st Semester 2004
Mould Maintenance Overall downtime Reduce 15% due to Mould Maintenance
Retrofitting and Preventive Maintenance
Overall downtime Reduce 10% due to machine maintenance
Set-up -Standardisation
Overall downtime Reduce 10% due to set-up
Productivity and Quality Programme- Assembly
Improve software operation for
production reports
Number of non-read labels / day
Reduce 90% of non-read labels
Productivity and Quality Programme
- Motors
Reduce machine downtime rate
Overall downtime Reduce downtime in 40%
Brazilian Journal of Operations & Production ManagementVolume 7, Number 1, 2010, pp. 09-35
25
May-04 Jun-04 Jul-04 Aug-04 Sep-04 Oct-04 Nov-04 Dec-04 Jan-05 Feb-05 Mar-05 Apr-05 May-05Audited Products 840 741 860 854 873 894 852 607 809 426 861 837 818
NOK 28 25 31 21 24 34 21 8 10 5 7 9 4 % 3.33% 3.37% 3.60% 2.46% 2.75% 3.80% 2.46% 1.32% 1.24% 1.17% 0.81% 1.08% 0.49%
2004 2005Audited Products 6,980 3,751 Manufacturing goal:
NOK 909 35 " To accomplish volumes w ith 'QUALITY' and productiveness, improving production resources utilization"% 13.02% 0.93%
São José dos Pinhais Product Audit 2005
Quality Engineering
0%
3%
6%
9%
12%
May -04 Jun-04 Jul-04 Aug-04 Sep-04 Oct-04 Nov -04 Dec-04 Jan-05 Feb-05 Mar-05 Apr-05 May -05
Target 2004:3%
Figure 7 - Product Audit Indicator Chart
Exhibit 3 identifies the action plans that rendered high contribution to the development of performance measurements related to quality.
Exhibit 3 – Action Plans related to the Quality Compliance Indicators
Indicator Target / Result Accomplished Control DimensionAudit of Finished
Products in Stock
1st sem 2004 2nd sem 2004 1st sem 2005
Ok Product audits6,5% 2,51% 3% 2,81% 2,5% 0,93%
(Non-compliances / Number of audited parts) – Audit of finished products in stockProgrammes Action Plan Indicator Target
Productivity and Quality Programme
- Plastics
Quality standards Scrap levels Increase 15% over 1st Semester 2004
Tampoprint stove Re-worked parts due to adherence problems Reduce 100 %
DehumidifierScrap levels due to material humidity
problems1%
Packaging and handling Losses due to handling Eliminate scratch /
warping problems
Productivity and Quality Programme
- Assembly
Blender; Coffee pot; Fan; Washing
machine; Air circulator
Re-work indicators and finished products stock
auditingReduce in 90%
Productivity and Quality Programme
- Motors
Reduce non-compliances
Wiring, Blender and Fan
Downtime hours Reduce 80% over 1st Semester 2004

Brazilian Journal of Operations & Production ManagementVolume 7, Number 1, 2010, pp. 09-35
26
The synergy promoted by the multi-functional groups’ work led to the initiatives contained in the action plans in Exhibit 3, such as define areas for the evaluation of NOK parts, reuse of NOK parts and take corrective actions by means of the assembly team, with the other teams. This led to the identification, communication and on-job training of those operators who were sources of non-compliant parts due to their unfamiliarity with the consequences of problems in the assembly’s critical operations. Daily disclosure of daily indicators was developed during the work’s Stages 1 and 2, using visual management boards. This also contributed to the work.
As far as ‘Compliance with productivity…’ is concerned, the results of the evolution of this objective and the corresponding performance measurements are presented in Figure 8.
Exhibit 4 shows the actions related to the productivity performance dimension.
During the first six months of the implementation, there was a significant increase in the work force’s productivity (Figure 8). The result of the corrective actions was aligned to the main objective of “cleaning up the house”.
The target for the first semester 2005 was established 5% higher than the second semester of 2004 (17.99 E.U./nº of men-day to 18.99 E.U./nº of men-day), which was being regularly achieved. In order to better compare the amount of work done in different products and processes, an “Equivalent Unit (E.U.) of production” was developed, equivalent to the production time and effort of a specific product.
Mês May-04 Jun-04 Jul-04 Aug-04 Sep-04 Oct-04 Nov-04 Dec-04 Jan-05 Feb-05 Mar-05 Apr-05 May-05U.E. Prod./Worker 15.34 11.09 16.25 17.07 16.97 18.95 19.04 20.47 18.62 20.88 19.11 19.35 18.97E.U. Prod. 164,540 96,501 141,332 144,207 171,231 216,838 191,357 94,324 122,496 66,749 127,355 140,189 115,278N°WorkerXDay 10,725 8,700 8,697 8,448 10,089 11,440 10,050 4,609 6,579 3,197 6,666 7,245 6,077
Ano
Média 2°Semestr
e 2004
Média 1°Semestr
e 2005U.E. Prod./Worker 17.99 19.22E.U. Prod. 959,289 572,067N°WorkerXDay 53,333 29,764
SÃO JOSÉ DOS PINHAIS E.U. MONTHLY PRODUCTIVITY 2005
Manufacturing Engineering
MÉdia 16,6
E.U. Prod./Worker
0
5
10
15
20
25
May-04 Jun-04 Jul-04 Aug-04 Sep-04 Oct-04 Nov-04 Dec-04 Jan-05 Feb-05 Mar-05 Apr-05 May-05
Mês
Target:17,99Mean:17,99
Prodution = E.U.xProductivity
N°WorkersxDay
Target: 18,89Mean:19,22
Figure 8 - Productivity Indicators Chart
Brazilian Journal of Operations & Production ManagementVolume 7, Number 1, 2010, pp. 09-35
27
Exhibit 4 - Action Plans related to compliance with productivity indicators
Indicator Target / Result Accomplished Control DimensionNumber E.U. / num. of men-day
1st sem 2004 2nd sem 2004 1st sem 2005Partial Productivity17,99 16,70 17,99 17,99 18,89 19,22
Programmes Action Plan Indicator Target
Productivity and Quality Programme- Plastics
Plastics Additives Productivity of parts production
Increase 20% over 1st Semester 2004
Software for machine control
OEE – Overall Equipment Effectiveness
Increase 15% over 1st Semester 2004
Productivity and Quality Programme- Assembly
Assembly cells Assembly productivityIncrease 10% over 1st Semester 2004
Productivity and Quality Programme- Motors
Improve productivity Productivity Increase 5% over 1st Semester 2004
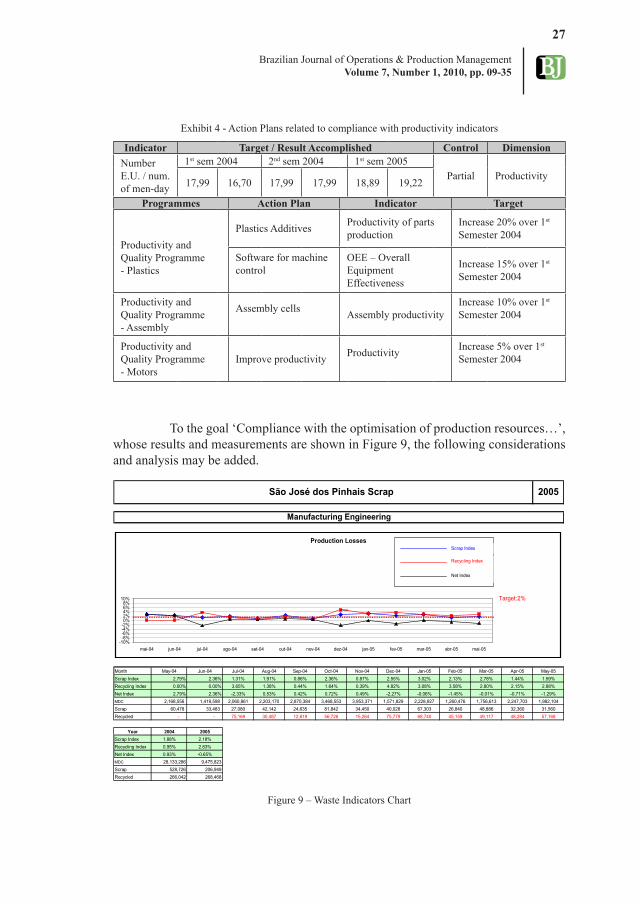
To the goal ‘Compliance with the optimisation of production resources…’, whose results and measurements are shown in Figure 9, the following considerations and analysis may be added.
Month May-04 Jun-04 Jul-04 Aug-04 Sep-04 Oct-04 Nov-04 Dec-04 Jan-05 Feb-05 Mar-05 Apr-05 May-05Scrap Index 2.79% 2.36% 1.31% 1.91% 0.86% 2.36% 0.87% 2.55% 3.02% 2.13% 2.78% 1.44% 1.59%Recycling Index 0.00% 0.00% 3.65% 1.38% 0.44% 1.64% 0.39% 4.82% 3.08% 3.58% 2.80% 2.15% 2.88%Net Index 2.79% 2.36% -2.33% 0.53% 0.42% 0.72% 0.49% -2.27% -0.06% -1.45% -0.01% -0.71% -1.29%MDC 2,168,556 1,419,598 2,060,861 2,203,170 2,870,384 3,468,553 3,953,371 1,571,829 2,228,927 1,260,476 1,756,613 2,247,703 1,982,104Scrap 60,478 33,483 27,080 42,142 24,635 81,842 34,450 40,028 67,303 26,840 48,886 32,360 31,560Recycled - - 75,169 30,487 12,619 56,726 15,264 75,779 68,740 45,159 49,117 48,284 57,168
Year 2004 2005Scrap Index 1.88% 2.18%Recycling Index 0.95% 2.83%Net Index 0.93% -0.65%MDC 28,133,286 9,475,823Scrap 528,726 206,949Recycled 266,042 268,468
São José dos Pinhais Scrap
Manufacturing Engineering
2005
Production Losses
-10%-8%-6%-4%-2%0%2%4%6%8%
10%
mai-04 jun-04 jul-04 ago-04 set-04 out-04 nov-04 dez-04 jan-05 fev-05 mar-05 abr-05 mai-05
tooo\
Scrap Index
Recycling Index
Net Index
Target:2%
Figure 9 – Waste Indicators Chart

Brazilian Journal of Operations & Production ManagementVolume 7, Number 1, 2010, pp. 09-35
28
Exhibit 5 shows the actions that correspond to the performance measurements related to the optimisation in the use of resources.
Exhibit 5 – Action Plans related to Compliance with the optimisation of production resources
Indicator Target / Result Accomplished Control Dimension
$ scrap / $ material
1st sem 2004 2nd sem 2004 1st sem 2005Ok Scrap1,5% 2,51% 2% 1,88% 2% 2,17%
(Scrap (R$) / Processed Material (R$) – does not take into account recycled materials)Programmes Action Plan Indicator Target
Productivity and Quality Programme- Plastics
Crushed materials $ scrap / waste
Reuse 100% PP (polypropylene) and SAN (styrene-acrylonitrile)
Changes in shift scheduling Waste indicator Reduce 70% over 2nd
Semester 2003Reduce energy consumption Energy demand Reduce 10% over 2nd
Semester 2003Productivity and Quality Programme- Assembly
Reduce assembly scraps
Scrap parts /Assembled parts
Reduce 20% over 2nd Semester 2003
Productivity and Quality Programme- Motors
Reduce Blender scraps Scrap parts /Assembled parts
Improve 40% over 2nd Semester 2003
Reduce Fan scraps Scrap parts /Assembled parts
Improve 70% over 2nd Semester 2003
Exhibit 5 includes actions such as changes in the number of work hours (negotiated with the corresponding unions) so as to eliminate machine downtimes and the consequent production of scrap, solutions to minimize energy consumption and the implementation of daily procedures to verify scrap materials and act upon the causes.
The initial presentation to launch the Strategic Manufacture Management System program, internally called IGM - Industrial Global Management, virtually called up the whole staff from the industrial areas. Workgroups would originally be formed by people from the manufacturing areas and by the company’s process analysts. During the presentation the managers of the Moulds and Maintenance areas suggested they should play a part in the program too. After 30 days and due to the good results obtained, workgroups were enriched with members of the Quality Engineering and Product Engineering areas. Due to the current composition, the industry’s functional areas (Manufacturing, Products, Quality, Procedures, Moulds and Maintenance) all work together within the multifunctional groups.
The alignment of activities, even though these were difficult to measure, comes from the mobilization generated by the use of standardized strategic maps with coherent objectives for all workgroups.
The activities within the dimension of the Learning and Growth Strategic Maps, served as a base to reach the objectives that refer to the internal processes.

Brazilian Journal of Operations & Production ManagementVolume 7, Number 1, 2010, pp. 09-35
29
All of the industrial area’s training programs were defined due to this program. Each activity within the strategic maps in each group was detailed in the action plans. All activities seemed to comply with the proposed objectives for the customer and financial dimensions, which were the same for the all the workgroups and intended to contribute to the achievement of the defined targets by the performance measurements defined in Stage 2 (and analysed above) that were, hence, delineated by the strategic goals.
The multifunctional groups developed their work in a capillary form. The action plans generated from the delineated activities affected virtually all workers in the operational level.
Communication is currently being made through indicators that are updated on a daily basis in the visual management boards. It is important to point out that each board holds the corresponding strategic maps designed by each group for each of the three improvement programs. Thus, it was possible to visualize the objectives of each training, or of each action developed in the shop floor level, and how these actions contributed to fulfil the strategy’s purposes.
It is also important to consider the implementation of a ‘Manufacturing School’, which consisted in a proper environment for theoretical and practical training. This Manufacturing School was equipped with workbenches and classrooms to train workers through practical activities.
Some theoretical and methodological elements deserve special attention in the case study, where an approach to conceive and implement the manufacturing strategy is based in projects and gives the necessary conditions to manage the changing processes. It is possible to think that the application of this management and organizational model in three levels: a) to design strategic manufacturing management systems (Sousa et al., 2005), b) to design performance measurement systems (Folan and Browne, 2005), and c) to implement changes and improvements for the development of a manufacturing strategy (Box and Platts, 2005). The development of strategies is focused on the development of an operational efficiency (Skinner, 1974) and it can also be observed inside the classical manufacturing strategy approach (Voss, 2005).
Once the analysis in this study was developed, it was possible to move ahead to synthesise it conclusively.
ConclusionAlthough the development group has used new concepts, the proposed
Strategic Manufacturing Management System (SMMS) was successfully applied, as shown herein. The performance measurements and the management system that were implemented supplied a guideline for the improvement efforts.
To obtain satisfactory results, it is essential that managers be committed with the processes and, also, they must support these processes consistently. Because
Brazilian Journal of Operations & Production ManagementVolume 7, Number 1, 2010, pp. 09-35
30
of this the implementation of SMMS becomes much easier.
Simplicity must be sought. According to this approach organizations, as a whole, can understand the tool that was suggested. Simplicity came from translating the manufacturing strategy into simple four strategic objectives (compliance with production volumes, productivity, quality and resource optimisation). Thus, they can be recommendations for the proposed performance measurements. The implementation of the BSC through strategic maps was also sought.
The benefits of the performance measurements may emerge even before they are employed. The fact that the manufacturing managers spent some time to analyse the corporate strategies made it possible to identify the causes of failure of former strategic implementations.
The partial use of the organizing for action model (Martins, 1998), proved to be feasible within the scope of the proposed rationality. Yet, the organizing for action model made it possible to identify existing needs that operational workers had and that had not been previously addressed.
In general, the pilot case study of a SMMS showed that by applying the proposed rationality, benefits were achieved by making a collective understanding easy, as well as by providing decision support and making organizational learning possible.
ReferencesAlsyouf, I. (2006), “Measuring maintenance performance using a balanced
scorecard approach”, Journal of Quality in Maintenance Engineering, Vol. 12, No. 2, pp. 133-149.
Assiri, A.; Zairi, M. and Eid, R. (2006), “How to profit from the balanced scorecard: an implementation roadmap”, Industrial Management and Data Systems, Vol. 106, No. 7, pp. 937-952.
Bhuiyan, N. and Baghel, A. (2005), “An overview of continuous improvement: from the past to the present”, Management Decision, Vol. 43, No. 5, pp. 761-771.
Bond, T. C. (1999), “The role of performance measurement in continuous improvement”, International Journal of Operations and Production Management, Vol. 19, No. 12, pp. 1318-1335.
Bourne, M.; Kennerley, M. and Franco-Santos, M. and (2005), “Managing through measures: a study of impact on performance”, Journal of Manufacturing Technology Management, Vol. 16, No. 4, pp. 373-395.
Box, S. and Platts, K. (2005), “Business process management: establishing and maintaining project alignment”, Business Process Management Journal, Vol. 11, No. 4, pp. 370-387.

Brazilian Journal of Operations & Production ManagementVolume 7, Number 1, 2010, pp. 09-35
31
Brown, S. and Blackmon, K. (2005), “Aligning manufacturing strategy and business-level competitive strategy in new competitive environments: the case for strategic resonance”, Journal of Management Studies, Vol. 42, No. 4, pp. 793-815.
Chenhall, R. (2005), “Integrative strategic performance measurement systems, strategic alignment of manufacturing, learning and strategic outcomes: an exploratory study”, Accounting, Organisations and Society, Vol. 30, No. 5, pp.395–422.
Daniels, R. C. and Burns, N. D. (1997a), “A framework for proactive performance measurement system introduction”, International Journal of Operations and Production Management, Vol. 17, No. 1, pp. 100-116.
Daniels, R. C. and Burns, N. D. (1997b), “Behavioural consequences of performance measures in cellular manufacturing” International Journal of Operations and Production Management, Vol. 17, No. 11, pp. 1066-1080.
Decoene, V. and Bruggeman, W. (2006), “Strategic alignment and middle-level managers’ motivation in a balanced scorecard setting”, International Journal of Operations and Production Management, Vol. 26, No. 4, pp. 429-448.
Fernandes, B.; Mills, J. and Fleury, M. (2005), “Resources that drive performance: an empirical investigation”, International Journal of Productivity and Performance Management, Vol. 54, No. 5/6, pp. 340-354.
Fernandes, K.; Raja, V. and Whalley, A. (2006), “Lessons from implementing the balanced scorecard in a small and medium size manufacturing organization”, Technovation, Vol. 26, No. 5/6, pp. 623-634.
Fink, A.; Marr, B.; Siebe, A. and Kuhle, J-P. (2005), “The future scorecard: combining external and internal scenarios to create strategic foresight”, Management Decision, Vol. 43, No. 3, pp. 360-381.
Fleury, A. (1990), Análise à nível de empresa dos impactos da automação sobre a organização da produção e do trabalho, In: Soares, R. (Ed.), Gestão da Empresa: Automação e Competitividade, Brasília: IPEA/IPLAN, pp. 11-26. (in Portuguese)
Folan, P. and Browne, J. (2005), “A review of performance measurement: towards performance management” Computers in Industry, Vol. 56, No. 7, pp.663-680.
Franco-Santos, M. and Bourne, M. (2003), “Factors that play a role in managing through measures”, Management Decision, Vol. 41, No. 8, pp.698–710.
Garg, A. and Deshmukh, S. (2006), “Maintenance management: literature review and directions”, Journal of Quality in Maintenance Engineering, Vol. 12, No. 3, pp. 205-238.
Gomes, C.; Yasin, M. and Lisboa, J. (2004), “A literature review of manufacturing performance measures and measurement in an organizational context: a framework and direction for future research”, Journal of Manufacturing Technology Management, Vol. 15, No. 6, pp.511-530.

Brazilian Journal of Operations & Production ManagementVolume 7, Number 1, 2010, pp. 09-35
32
Grossler, A. and Grubner, A. (2006), “An empirical model of the relationships between manufacturing capabilities”, International Journal of Operations and Production Management, Vol. 26, No. 5, pp. 458-485.
Harrison, J. and Boyle, E. (2006), “Falling into capability learning traps: the role of the firm’s predominant managerial mental models”, Management Decision, Vol. 44, No. 1, pp. 31-43.
Hayes, R. and Wheelwright, S. (1984), Restoring Our Competitive Edge: Competing through Manufacturing, New York: John Wiley and Sons.
Hill, T. (2000), Manufacturing Strategy: Texts and Cases, 2nd. ed. Basingstoke: Palgrave.
Hofer, C. H. and Schendel, D. (1978), Strategy formulation: analytical concepts, St. Paul: West Pub. Co.
Ip, Y. and Koo, L. (2004), “BSQ strategic formulation framework: a hybrid of balanced scorecard, SWOT analysis and quality function deployment”, Managerial Auditing Journal, Vol. 19, No. 4, pp. 533-543.
Kaplan, R. and Norton, D. (1993), “Putting the balanced scorecard to work”, Harvard Business Review, Vol. 71, No. 5, pp. 134-147.
Kaplan, R. and Norton, D. (1996), “Using the balanced scorecard as a strategic management system”, Harvard Business Review, Vol. 74, No. 1, pp. 75-85.
Kaplan, R. and Norton, D. (1997), A Estratégia em Ação: Balanced Scorecard, Rio de Janeiro: Campus. (in Portuguese)
Kaplan, R. and Norton, D. (2001), Organização Orientada para a Estratégia: Como as Organizações que Adotam o Balanced Scorecard Prosperam no Ambiente de Negócio, Rio de Janeiro: Campus. (in Portuguese)
Kaplan, R. and Norton, D. (2006), Response to S. Voelpel et al., “The tyranny of the Balanced Scorecard in the innovation economy”, Journal of Intellectual Capital, Vol. 7, No. 1, 2006, pp. 43-60. Journal of Intellectual Capital, Vol. 7, No. 3, pp. 421-428.
Koll, O.; Woodside, A. and Mühlbacher, H. (2005), “Balanced versus focused responsiveness to core constituencies and organizational effectiveness”, European Journal of Marketing, Vol. 39, No. 9/10, pp. 1166-1183.
Leong, G.; Snyder, D. and Ward, P. (1990), “Research in the process and contend of manufacturing strategy”, OMEGA, Vol. 18, No. 2, pp.109-122.
Linton, J. (2002), “Implementation research: state of the art and future directions”, Technovation, Vol. 22, No. 2, pp. 65-79.
Martins, R. (1998), Sistemas de medição de desempenho: um modelo para estruturação do uso, Tese (Doutorado em Engenharia), Escola Politécnica da Universidade de São Paulo. São Paulo. (in Portuguese)

Brazilian Journal of Operations & Production ManagementVolume 7, Number 1, 2010, pp. 09-35
33
Melnyk, S.; Calantone, R.; Luft, J.; Stewart, D.; Zsidisin, G.; Hanson, J. and Burns, L. (2005), “An empirical investigation of the metrics alignment process”, International Journal of Productivity and Performance Management, Vol. 54, No. 5/6, pp. 312-324.
Melnyk, S.; Stewart, D. and Swink, M. (2004), “Metrics and performance measurement in operations management: dealing with the metrics maze”, Journal of Operations Management, Vol. 22, No. 3, pp. 209-217.
Najmi, M.; Rigas, J. and Fan, I-S. (2005), “A framework to review performance measurement systems”, Business Process Management Journal, Vol. 11, No. 2, pp. 109-122.
Neely, A.; Mills, J.; Platts, K.; Gregory, M. and Richards, H. (1994), “Realizing strategy through measurement”, International Journal of Operations and Production Management, Vol.14, No. 3, pp. 140-152.
Paranjape, B.; Rossiter, M. and Pantano, V. (2006), “Insights from the Balanced Scorecard Performance measurement systems: successes, failures and future – a review”, Measuring Business Excellence, Vol. 10, No. 3, pp. 4-14.
Platts, K. (1993), “A process approach to researching manufacturing strategy”, International Journal of Operations and Production Management, Vol.13, No. 8, pp. 4-17.
Platts, K. (1994), “Characteristics of methodologies for manufacturing strategy formulation”, Computer Integrated Manufacturing Systems, Vol. 7, No. 2, pp. 93-99.
Platts, K. (2001), “Guest Editorial”, International Journal of Operations and Production Management, Vol.21, No. 8, pp. 1050-1052.
Rusjan, B. (2005), “Model for manufacturing strategic decision making”, International Journal of Operations and Production Management, Vol. 25, No. 8, pp. 740-761.
Sanger, M. (1998), “Supporting the balanced scorecard”, Work Study, Vol. 47, No. 6, pp. 197-200.
Santos, A. R. (1999), “Metodologia Científica: A construção do conhecimento”, Rio de Janeiro: DP&A. (in Portuguese)
Santos, B. (2002), “Implantando o Balanced Scorecard em uma empresa automobilística: obstáculos e resultados preliminares”, in: XXII Encontro Nacional de Engenharia de Produção, Anais... Curitiba: ABEPRO. (in Portuguese)
Skinner, W. (1969), “Manufacturing: missing link in corporate strategy”, Harvard Business Review, Vol. 47, No. 3, pp. 156-167.
Skinner, W. (1974), “The focused factory”, Harvard Business Review, Vol. 52, No. 3, pp.113-121.

Brazilian Journal of Operations & Production ManagementVolume 7, Number 1, 2010, pp. 09-35
34
Skinner, W. (1985), Manufacturing: The Formidable Competitive Weapon, New York: John Willey and Sons.
Sousa, G.; Carpinetti, L.; Groesbeck, R. and Van Aken, E. (2005), “Conceptual design of performance measurement and management systems using a structured engineering”, International Journal of Productivity and Performance Management, Vol. 54, No.5/6, pp. 385-399.
Sousa, S.; Aspinwall, E. and Rodrigues, A. (2006), “Performance measures in English small and medium enterprises: survey results”, Benchmarking: An International Journal, Vol. 13, No. 1/2, pp. 120-134.
Sun, H. and Hong, C. (2002), “The alignment between manufacturing and business strategies: its influence on business performance”, Technovation, Vol. 22, No. 11, pp.699-705.
Takala, J.; Leskinen, J.; Sivusuo, H.; Hirvela, J. and Kekale, T. (2006), “The sand cone model: illustrating multi-focused strategies”, Management Decision, Vol. 44, No. 3, pp. 335-345.
Tangen, S. (2005), “Insights from practice analysing the requirements of performance measurement systems”, Measuring Business Excellence, Vol. 9, No. 4, pp. 46-54.
Tapinos, E.; Dyson, R. and Meadows, M. (2005), “The impact of performance measurement in strategic planning”, International Journal of Productivity and Performance Management, Vol. 54, No. 5/6, pp. 370-384.
Voelpel, S.; Leibold, M. and Eckhoff, R. (2006), “The tyranny of the Balanced Scorecard in the innovation economy”, Journal of Intellectual Capital, Vol. 7, No. 1, pp. 43-60.
Vokurka, R. and Fliedner, G. (1995), “Measuring operating performance: a specific case study”, Production and Inventory Management Journal, Vol. 36, No. 1, pp. 38-43.
Voss, C. (1992), Manufacturing Strategy: Process and Content, London: Chapman and Hall.
Voss, C. (2005), “Paradigms of manufacturing strategy re-visited”, International Journal of Operations and Production Management, Vol. 25, No. 12, pp. 1223-1227.
Widener, S. (2006), “Associations between strategic resource importance and performance measure use: the impact on firm performance”, Management Accounting Research, Vol. 17, No. 4, pp. 433-457.
Wouters, M. and Sportel, M. (2005), “The role of existing measures in developing and implementing performance measurement systems”, International Journal of Operations and Production Management, Vol. 25, No. 11, pp. 1062-1082.
Brazilian Journal of Operations & Production ManagementVolume 7, Number 1, 2010, pp. 09-35
35
BiographyMr. Oswaldo A. Nogara Borges de Menezes holds a BSc Degree in
Electrical Engineering and a MSc Degree in Industrial and Systems Engineering. After 21 years in the electro-electronic domestic appliances industry, nowadays he works as a consultant in the field of Industrial Productivity and Management.Contact: [email protected]
Dr. Edson Pinheiro de Lima is a founder member of the Mechatronics and Industrial Engineering groups at the Pontifical Catholic University of Parana – PUCPR, and a faculty at the Department of Electrotechnics at Federal University of Technology – Parana, Brazil. He holds a BSc Degree in Electrical Engineering, a MSc Degree in Electrical Engineering (Automation) and a PhD in Industrial Engineering. His research and teaching are in operations strategy, performance management, strategic management and organizational design.Contact: [email protected]
Dr. Sergio E. Gouvea da Costa is a founder member of the Mechatronics and Industrial Engineering groups at the Pontifical Catholic University of Parana – PUCPR, and a faculty at the Department of Electrotechnics at Federal University of Technology – Parana, Brazil. He holds a BSc Degree in Electrical Engineering, a MSc Degree in Electrical Engineering (Automation) and a PhD in Industrial Engineering. His research and teaching are in manufacturing/operations strategy and performance area, AMT adoption and production planning and control.Contact: [email protected]
Article InfoReceived: June, 2009
Accepted: February, 2010