manufacturing priority agenda 2018 -...
TRANSCRIPT

MANUFACTURING PRIORITY AGENDA
2018
SPARKING KENYA’S INDUSTRIAL TRANSFORMATION FOR JOB CREATION

Sparking Kenya’s industrial transformation for job creation
• Contribution to Gross Domestic Product (GDP) from 9.2% in 2016 to 15% by 2022
• Increase value and volume of exports• Consumerbenefitsofmanufacturing• Economic and exports diversification
Competitiveness and level playing field
a) Reduce the cost of production for basic commodities b)Promoteaccesstoquality,affordableandreliableenergyc)Addressmultiplecharges,feesandleviesbycountiesd) Increase circulation of money in the economye)Reducetransportandlogisticscostsf)Availlongtermfinancingformanufacturersg)Fightillicittrade,contraband,substandardgoodsanddumping
Export driven manufacturing
a) Increase market access for Kenyan exports b) Incentivize and promote exportersc) Protect local and infant industriesd)Incentivizevalueadditionanddiversificationofexports
Pro-industry policy and institutional framework
a)Predictableandstableindustrialpoliciesdevelopedthrough industry consultations b) National policy and institutional coherence for the manufacturingsectorc)Manufacturingsectordeliveryunit
Government driven SMEs development
a)Facilitatebusinesscompliancewithregulationtoformalize the informal economyb)Accordpreferencetolocalcontentingovernment procurement c) Enhance credit and market access to SMEs
Securing the future of manufacturing industry
a)Greengrowthandsustainabledevelopmentb) Industry 4.0 c) Pro-industry skill developmentd) Enhance access to lande)Fitforpurposepublicservice f) Stable political environment
NAME OF THE PILLAR AGENDA
PILLAR
1
PILLAR
2
PILLAR
3
PILLAR
4
PILLAR
5

TABLE OF CONTENTS
ABBREVIATIONS ................................................................................................................................. iii
FOREWORD........................................................................................................................................ v
EXECUTIVE SUMMARY ...................................................................................................................... vii
INTRODUCTION ................................................................................................................................. 1
1.1 Backgroundinformation.......................................................................................................... 1
1.2 Overviewofthe2017MPA....................................................................................................... 2
GLOBAL, REGIONAL AND KENYA’s ECONOMIC OUTLOOK ...................................................... 5
2.1 Stateoftheglobaleconomy.................................................................................................... 5
2.2 Sub-Saharan Africa (SSA) ......................................................................................................... 6
2.3 Kenya’s economic outlook ....................................................................................................... 6
2.3.1GDPgrowthrate............................................................................................................... 6
2.3.2 Inflationrate................................................................................................................... 7
2.3.3 Exchangerate................................................................................................................ 8
2.3.4 Interest rates ................................................................................................................... 8
2.3.5 Access to credit .............................................................................................................. 9
2.3.6 Accesstocreditbythemanufacturingsector............................................................. 9
2.3.7 Lendingtothegovernment.......................................................................................... 10
2.3.8 Stock of public debt ...................................................................................................... 10
2.3.9 Oil prices ......................................................................................................................... 11
ANOVERVIEWOFMANUFACTURINGSECTORINKENYA......................................................... 13
3.1 Contribution to GDP.................................................................................................................. 13
3.2 Manufacturingsectorannualgrowthrate............................................................................... 13
3.3 Structureofmanufacturingsector........................................................................................... 14
3.4 Manufacturingsectoroutput................................................................................................... 14
3.5 Valueadditioninthemanufacturingsector............................................................................ 15
3.6 Contribution to exports ............................................................................................................ 16
3.7 Exportmarkets.......................................................................................................................... 17
3.8 Contribution to employment ................................................................................................... 17
3.9 Compensationtoemployeesinthemanufacturingsector.................................................... 18
3.10 Contributionofthemanufacturingsectortotaxes................................................................. 18
3.12 Economichealthinthemanufacturingsector......................................................................... 19
PILLARSTOSUPPORTSPARKINGKENYA’SINDUSTRIALTRANSFORMATIONFORJOB
CREATION ................................................................................................................................. 21
4.1 PILLARONE:COMPETITIVENESSANDLEVELPLAYINGFIELDFORKENYAN
MANUFACTURERS................................................................................................................... 21
MANUFACTURING PRIORITY AGENDA (MPA) i2018
Agendaforcompetitivenessandlevelplayingfieldformanufacturers........................................ 22
4.1.1 Reduce the cost of production of basic commodities .................................................. 22
4.1.2 Promote access to quality, affordable and reliable electricity ................................... 22
4.1.3Addressmultiplecharges,feesandleviesbycounties................................................. 23
4.1.4 Increase circulation of money in the economy ............................................................ 23
4.1.5 Reducetransportandlogisticscosts............................................................................ 23
4.1.6 Availlongtermfinancingtomanufacturers................................................................. 25
4.1.7 Fightillicittrade,contraband,substandardgoodsanddumping............................. 25
4.2PILLARTWO:EXPORTDRIVENMANUFACTURING.................................................................. 27
Agendatopromoteexportdrivenmanufacturing........................................................................... 27
4.2.1IncreasemarketaccessforKenyanexports.................................................................... 27
4.2.2 Incentivizeandpromoteexporters................................................................................ 27
4.2.3 Protect local and infant industries.................................................................................. 28
4.2.4 Incentivizevalueadditionanddiversificationofexports............................................. 29
4.3PILLARTHREE:PRO-INDUSTRYPOLICYANDINSTITUTIONALFRAMEWORK..................... 30
Agendatoensurepro-industrypolicyandinstitutionalframework................................................. 30
4.3.1 Predictableandstableindustrialpoliciesdevelopedthroughindustryconsultations.30
4.3.2 Nationalpolicyandinstitutionalcoherenceforthemanufacturingsector................ 30
4.3.3 Manufacturingsectordeliveryunit................................................................................ 33
4.4 PILLARFOUR:GOVERNMENTDRIVENSMESDEVELOPMENT........................................... 34
AgendatopromotegovernmentdrivenSMEsgrowthanddevelopment.................................... 34
4.4.1 Facilitatebusinesscompliancewithregulationstoformalizetheinformaleconomy 34
4.4.2 Accordpreferencetolocalcontentingovernmentprocurement.............................. 35
4.4.3 Enhance credit and market access to SMEs.................................................................. 36
4.5 PILLARFIVE:SECURINGTHEFUTUREOFMANUFACTURINGINDUSTRY....................... 37
AgendaforsecuringthefutureofManufacturingIndustryinKenya.............................................. 37
4.5.1 Greengrowthandsustainabledevelopment................................................................ 37
4.5.2 Industry 4.0....................................................................................................................... 37
4.5.3 Pro-industry skill development ...................................................................................... 38
4.5.4 Enhance access to land .................................................................................................. 39
4.5.5 Fit-for-purposepublicservice......................................................................................... 39
4.5.6 Stable political environment........................................................................................... 39
SUMMARY AND CONCLUSION........................................................................................................ 40
5.1 Summary......................................................................................................................................... 41
5.2 Conclusion ..................................................................................................................................... 42
ANNEXES.............................................................................................................................................. 43
Annex1:Summaryofpillars,agendaandactionsforMPA2018.................................................... 43
Annex 2: Kenyan balance of trade (Bot) 2010-2016 - Kshs. “000”.................................................... 48
Annex 3: Kenyan export and imports to and from Eac countries (2010-2016) - Kshs. “000”......... 49
MANUFACTURING PRIORITY AGENDA (MPA)ii 2018

ABBREVIATIONS
ACA AntiCounterfeitAgency
AFC AgriculturalFinanceCorporation
AfDB African Development Bank
AGOA AfricanGrowthandOpportunityAct
APPSBG All- Party Parliamentary Small Business Group
BKB Brand Kenya Board
BKBK Buy Kenya Build Kenya
BPD Barrels Per Day
CBK Central Bank of Kenya
CBR Central Bank Rates
CET Common External Tariff
CFTA ContinentalFreeTradeAreaAgreement
CPS Cyber-Physical System
CT CommunicationTechnology
EAC East African Community
EPA EconomicPartnershipAgreement
EPC Export Promotion Council
EPZ Export Promotion Zones
EPZA Export Promotion Zones Authority
ERC EnergyRegulatoryCommission
ERSP EconomicRecoveryandStrategyPaper
FDI ForeignDirectInvestment
FMCGs FastMovingConsumerGoods
GDP Gross Domestic Product
GoK Government of Kenya
ICMS IntegratedCustomsManagementSystems
ICT InformationandCommunicationTechnology
IDF ImportDeclarationFee
ILO InternationalLabourOrganization
IMF InternationalmonetaryFund
IPR IntellectualPropertyRights
ISIS ImportSubstitutionIndustrializationstrategy
IT InformationTechnology
KAM Kenya Association of Manufacturers
KEBS Kenya Bureau of Standards
KeNHA KenyaNationalHighwayAuthority
KIE Kenya Industrial Estate
KIPI Kenya Industrial Property Institute
MANUFACTURING PRIORITY AGENDA (MPA) iii2018

KIPPRA Kenya Institute for Public Policy Research and Analysis
KIRDI Kenya Industrial Research and Development Institute
KITP KenyaIndustrialTransformationProgramme
KNBS Kenya National Bureau of Statistics
KPLC KenyaPowerandLightingCompany
KRA Kenya Revenue Authority
KRB Kenya Road Board
KURA Kenya Urban Roads Authority
MDAs Ministries,DepartmentsandAgencies
MoDP MinistryofDevolutionandPlanning
MoITC Ministry of Industry, Trade and Cooperatives
MPA ManufacturingPriorityAgenda
MSEA Micro and Small Enterprise Authority
MTPs Medium-Term-Plans
NICs NewlyIndustrializedCountries
NSSF NationalSocialSecurityFund
NTB Non-Tariff Barriers
OECD OrganizationforEconomicCooperationandDevelopment
OPEC OrganizationofPetroleumExportingCountries
PDU President’s Delivery Unit
PMI PurchasingmanagersIndex
PPADA Public Procurement and Asset Disposal Act
RDL RailwayDevelopmentLevy
SEZ Special Economic Zones
SGR StandardGaugeRailway
SME Small Medium sized Enterprises
SSA Sub-Saharan Africa
STG SterlingPound
TFTA TripartiteFreeTradeAgreement
TTIs TechnicalTrainingInstitutions
TVET TechnicalandVocationalEducationandTraining
UAE United Arab Emirates
USD United States Dollar
VAT Value Added Tax
MANUFACTURING PRIORITY AGENDA (MPA)iv 2018

FOREWORD
Thisyearthegovernmenthasdeclaredmanufacturingas a top priority investment area for the country to drive economic growth. Hence this is the year forus to demystify the sector and make it everybody’s agenda.Itistheyeartoraisethetenorofdiscourseonindustrialization. Moreover, it is an opportune moment forustoshiftthesediscussionsfrombeingthepreserveof industrialists, and speak to the rest of the country onour conviction forwhywemustprioritizea strongmanufacturingbase.
Astrongmanufacturingbaseforanyeconomyisthefoundationupon which long-lasting economic frameworks are made. Veryfewdevelopedeconomiesaround theworldcanspeakof theirgrowthsuccesswithoutattributingitlargelytotheirmanufacturingsector.ForustoachievetheintendedgrowthofGDPcontributionfromthecurrent9.2%to15%by2025urgentstepsneedtobetaken,theresultsofwhichshouldbetangibleinthenextoneyear.Aclearcommitmenttowardscentralizingindustrializationineveryconversationaboutdevelopmentinthiscountryisneeded,rightfrom the policy makers to each and every citizen.
Aswe look into stemmingmanufacturing in all facetsofpolicydevelopmentinourcountry,weneedtobecognizantofglobaltrajectories on the fourth industrial revolution and sustainable development. The automation processes of many industries provide an opportunity for us to recalibrate our definition andvalue of work. Hence our contribution towards revamping ourproductionprocesses,andusing themascentersofexcellencetowardsskillsdevelopment in thecountrywillgoa longway incatapulting our local industry into global standards. Includingyoung people into the industrialization vision by equippingthemwithskillsandproviding themwith thespace to innovatethroughresearchandDevelopment,willmakethisasharedvisionin the country as it translates into job creation and economic empowerment.
Manufacturingistheonlyguaranteedwayforacountrytoincreasethe number of people earning substantial wages because ofstrongbackwardand forward linkageswithother sectors in theeconomy. The more people have reliable and stable jobs, the moretheycanaffordtheirbasicneeds.Athrivingindustryisalsoa great development partner for Government, as it increasesrevenueandenablesthegovernmenttoprovidesocialamenitiestoallcitizens.Inthelongrunthistranslatestoareducedpovertygapandincreaseinequalityinthesociety.
Industry’s intervention is strengthened by a predictableregulatoryenvironment,aswellasacommitmenttoenforcethe
adherence to the rule of lawfor all stakeholders. If this is actualized many hurdles that standinthewayofgrowingthesector, for example illicit trade, counterfeit goods, corruptpractices amongmany otherswillbeabated.
Lastly, manufacturing shouldnot be seen as one amongmany solutions towardsbuildinganinclusiveeconomicorder, but rather as the primary element from which all otherdevelopment solutions coagulate and take shape. Itshould be the focal point in our national vision towardscreating an inclusive politicaleconomy. Manufacturingshould underline discussions on nation building, equaldistribution of resources and poverty alleviation.
I look forward to workingwithallofour stakeholders inrealizing the potential of thesector towards uplifting ourgreatnation.
FloraMutahiChairlady, Kenya Association of Manufacturers
MANUFACTURING PRIORITY AGENDA (MPA) v2018

“InthefirstpillaroftheBig Four(foodsecurity,affordablehousing,manufacturingandaffordablehealthcareforall),wewillcreatejobsbyexpandingourmanufacturingsector.Manufacturingisaboutbelievingthatwe,asKenyans,canbecompetitiveandambitiousenough,tomakeproductsthatareasgoodasanyotherinthe
world.Lazima Tujiamini”
H.E President Uhuru Kenyatta, CGHPresidentandCommanderinChiefoftheDefenceForcesofthe
republic of Kenya
-12th December, 2017
MANUFACTURING PRIORITY AGENDA (MPA)vi 2018

EXECUTIVE SUMMARY The growth and development of any country isbanked on the ability of its industries to compete regionally and internationally. For Kenya, ourindustrial growth has stagnated with a GDPcontribution of 10 % over the last 10 years, and a further reported decline to 9.2 % in 2016. Hence the need to promote the competitiveness of local industries should be prioritized in our rejuvenated endeavourtofocusonthemanufacturingsectorasa country.
Last year, the Association launched its 10 point agenda whichis echoed in the recently announcedgovernment’s action planfor economic growth and the attainment of Vision 2030. Theagenda highlights priority areas in the quest to double jobs,double exports, increase foreign exchange earnings and raisemanufacturingshareofGDPto15percentby2020.
It is within this context that we have developed the 2018Manufacturing Priority Agenda which outlines the immediateactionthatwillyieldtangibleresultsintheshortterm,andworktowardstheaforementionedindustrygoals.Thiswillcatalyzethecompetitivenessoflocalindustrythatwillbealludedtoaswellasenable our local manufacturers to compete on an international platform.
Underthetheme‘SparklingKenya’sindustrialtransformationforjobcreation’,thisyear’sMPAhighlightstheneedtocreateasectorthathasamultipliereffectintheeconomythroughbackwardandforward linkages in the value chain and consequently, job andwealthcreation.
Firstly, theMPA outlines the need for a competitive and levelplayingfield for localmanufacturingandgrowthof SMEwhichcanbeachievedthroughsoundfiscalandnon-fiscalpolicies.Theagendaalsohighlightstheneedforpredictableandstableindustry policies which should be developed through industryconsultations and linked to the wider national policy makingprocess in order to promote the sector.
Wehavealsohighlightedtheneedtoprioritizetheprotectionoflocal infant industries in order to drive creativity and innovation therebycontinuallycreatingsustainableandproductivejobs.The diversification of export markets is also key as it centreson enabling localmanufacturers to access regional and globalmarketstherebyenhancingexportdrivenmanufacturing.
KAM has consistently championed the adoption of critical tenets of sustainable development and greengrowth towards actualizing agreen economy. In the samebreathe, a green economy isonly possible if theworkforcehave the relevant skills to operate industries effectively and sustainably. This is whyour advocacy for a continued revamp of technical skills under TVET continues to play a centre role in the need for pro-industry skills development.
The Association is committed towards the achievement ofthesegoals, andwewillworkclosely with both nationaland county governments anddevelopmentpartnerstowardsthe industrialization vision for Kenya.
PhyllisWakiagaCEO, Kenya Association of Manufacturers
MANUFACTURING PRIORITY AGENDA (MPA) vii2018


1.1 Background information
Every year, the Kenya Association of Manufacturers (KAM) sets out advocacy priorities in a publication titled “The Manufacturing Priority Agenda (MPA)”. This year’s MPA marks the fourth series since commencement of its production in 2015. The theme of the MPA 2018 is “Sparking Kenya’s Industrial Transformation for Job Creation”. It highlights an urgent need for Kenya to focus on the sector and to reignite its potential to achieve a multiplier effect on the economy, ultimately leading to more investments, expanding markets, job creation and better standards of living for all.
INTRODUCTION
Kenya has the highest unemployment rate in the East African Region and stood at 12.5% in 2015, with unemployment rate of 25% among the urban youths and 9% of the youths in the rural areas (KIPPRA, 2017). Interventions to uplift the manufacturing sector, will create backward and forward linkages that will in turn generate opportunities for innovation entrepreneurship, as well as, productive jobs.
Empirical evidence reveals that for all economic sectors, the manufacturing sector has the highest employment multiplier effect in an economy. For instance, empirical analysis by Bivens (2003) indicated that 100 jobs in the manufacturing sector supported 291 jobs in other sectors of the economy. Further, the latest report from Manufacturing Institute in the US revealed that $1 worth of manufactured product creates $1.34 in the rest of the economy6. This is the largest multiplier of any economic sector.
6 See: http://www.themanufacturinginstitute.org/Research/Facts-About-Manufacturing/Economy-and-Jobs/Multiplier/Multiplier.aspx.
This shows the enormity of economic development that a country can realize through a well-founded manufacturing base.
The Government’s renewed commitment to the sector through an announcement made by H.E The President of Kenya, on the 28th of November 2017, presents a great opportunity for the country to make leaps on critical economic goals set out in Vision 2030. It is the goal of the National Government to increase the contribution of
MANUFACTURING PRIORITY AGENDA (MPA) 12018

the manufacturing sector from the current 9.2% contribution to the gross domestic product (GDP) to 15% by 2022. A raft of policy strategies such as Vision 2030, Kenya Industrial Transformation Programme (KITP), National Trade Policy, Investment Policy and Buy Kenya Build Kenya (BKBK) have been devised to spur the manufacturing sector in Kenya. Further, in 2017, KAM published a ten point priorities agenda for transforming manufacturing sector and creating jobs in Kenya.
The MPA highlights current hurdles hampering Kenya’s industrial growth and articulates proposals on how these can be overcome. The 2018 MPA will be hinged on five pillars as follows: competitiveness and level playing field; export driven manufacturing; pro-industry policy and institutional framework; government driven SMEs development and securing the future of the manufacturing sector.
1.2 Overview of the 2017 MPA
The 2017 MPA was developed and launched on 30th January 2017 under the theme “Driving Industrial transformation for job creation and inclusive economic growth”. It was anchored on five pillars, namely: Policy, Legal and Regulatory Reforms, Level playing field for manufacturing in Kenya, Competitive Local Manufacturing Sector, Make Kenya a manufacturing hub for Exports and Securing the future of Industry.
ItinformedandshapedtheadvocacyworkforKAMduringtheperiodunderreviewandthefollowingaresomeofthekeywins:
• DevelopmentofDraftCountyOwnRevenueSourcingPolicywhichseekstostandardizeinstitutional,frameworkapplicableinallcountiesforcountygovernmentownsourcesofrevenueraisingmeasuresandenforcement.
• Development of the Public Participation Policy guidelines that seeks to guidestakeholder participation in the development of policies and bills at both levels of government.Nevertheless,thereisneedtopushitsadoptionandenactmentacrossallcountiesasonlyafewhavedoso.
• DevelopmentofadraftEastAfricanCommunity(EAC)Non-TariffBarriersRegulationthatseekstogiveeffecttotheEACEliminationofNon–TariffBarrierAct,2015.TheActaimsatremovingconditionsthataffectanddistorttradewithintheEAC,creatingaconduciveenvironmentfortradewithintheregion.
• DevelopmentofIndustrialCompetitivenessReport.Thestudyfindingscallforrenewedeffort toboost themanufacturing sector in the regionand inEACpartner’s states.It also calls for coordination of industrial policies and related instruments under the regionalaegisof theEAC,whileensuringtheirharmonizationwithotherpolicies inparticular trade.
• Development of draft E-Waste Regulations; it provides guidelines for handling,storageanddisposalofe-wasteinKenya.
a
Manufacturing Priority Agenda 2017
DRIVING INDUSTRIAL TRANSFORMATION FOR JOB CREATION AND INCLUSIVE ECONOMIC GROWTH
MANUFACTURING PRIORITY AGENDA (MPA)2 2018

• EstablishmentofClimateChangeCouncil inwhichKAMwasnominated to representprivatesector.TheCouncilshallpublishregulationondesignandproceduretoensureefficacyofpublicconsultation,toensurethattheymakeanimpactonthethresholdofdecisionmakingonclimatechangeatalllevelsofgovernment.
• Judicialprocessesautomationsuchascasefiling,casedateallocationandpayment.
• DevelopmentandlaunchoftheEACintellectualPropertyRights(IPR)studywhichaimstoenhanceregionalprotectionofIPRs,asacontributortoachievingtheindustrializationagenda.
• ThedevelopmentoftheEACTradeRemediesAct,2017thatseekstodealwithunfairtradepracticessuchasdumping,subsidizingandimportsurges.
• LaunchoftheBuyKenyaBuildKenyaStrategydrivenbyanoverridingobjectivethatitssuccessfulimplementationwillencouragetheconsumptionoflocallyproducedgoodsand services.
• Development and launch of National Trade Policy that seeks to unleash Kenya’s potential fortargetingdomestic,regionalandglobalmarkets;and
• DevelopmentofdraftNationalWaterPolicywhichseekstobringreformsinthewatersector in the country.
Someofthependingproposalsmadein2017MPAincludethefollowing:
• Elimination of ImportDeclaration FeeandRailwayDevelopmentLevy.
• Rationalize and harmonization of countylevies,chargesandfees.
• Development of national export and promotionstrategy.
• Establishmentaoflongtermfinancingmechanism for manufacturers.
• AdoptionoftheKenyadraftregulationfor Motorcycles.
• EnactmentoftheEnergyBill,2015.
• Creationofpromptpaymentlegislativeframework.
• ReviewofEACCommonExternalTarrif(CET).
• RatificationoftheEconomicPartnershipAgreement(EPA)byall5PartnerStates;and
• Creation of land banks for industrial investment.
It worthy to note that full implementationof the 2017 MPA proposals could not beachieved due several reasons includingbut not limited to: lack of prioritization of sector issues by government Ministries,Departments and Agencies (MDAs) andprolongedelectioneeringperiod.
MANUFACTURING PRIORITY AGENDA (MPA) 32018


2.1 State of the global economy
GLOBAL, REGIONAL AND KENYA’S ECONOMIC OUTLOOK
In2017,globaleconomicgrowthisestimatedtohavereached3%,asignificantaccelerationcomparedtogrowthofjust2.4%in2016;thehighestgrowthraterecordedsince2011(WorldBank,2018).Theimprovementinglobaleconomicconditionshavebeen largely attributed to improvedcommoditypricesandstableglobalmacroeconomicenvironment.Theworldeconomyisexpectedtogrowby3.1%in2018.Thisforecastwillbesupportedbyrecoveryininvestment,manufacturing and trade as exporting developing economies benefit fromrisingcommodityprices.Nevertheless,thegrowthcouldbefragile,withtheriskoffinancialstress,increasedprotectionismandrisinggeopoliticaltensionderailingtheexpansion.
Global conditions for investment have generally improvedamid low financial volatility, reduced banking sector fragilities,recovery in some commodity sectors and a more solid globalmacroeconomic outlook (World Bank, 2018). However, thisimprovement is relative to a low starting point following twoyearsofexceptionallyweakinvestmentgrowth,andaprolongedepisode of lackluster global investment overall. A firmer andbroader based rebound in investment activities may be deterred byelevatedlevelsoftradepolicyuncertaintyaswellasrisingdebtandabuildupoflongertermfinancialfragilities.
Theoilmarketisintheprocessofrebalancingasdemandgrowthsurpassessupplygrowth.Thisisexpectedtospreadthrough2018as the Organization of Petroleum Exporting Countries (OPEC)and non-OPEC oil exporters, including Azerbaijan, KazakhstanandtheRussianFederation,agreedtoimplementacoordinated
reduction in production from January 2017 to March 2018,amounting to 1.8 millionbarrels per day (bpd) in total6. In 2018, crude oil prices are expected to average US$60per barrel which will translateto higher cost of refined fuel.Speculative activities continue to remain influential, creating
shorttermpricefluctuations.
6 See: http://www.goldmansachs.com/our-thinking/pages/2018-global-economic-outlook-as-good-as-it-gets.html.
MANUFACTURING PRIORITY AGENDA (MPA) 52018
2.2 Sub-Saharan Africa (SSA)
TheoverallGDPgrowthforSSAisestimatedtobe2.4%for2017,areboundfrom1.3%in20167. The improvedgrowthratehasbeenattributedtorecoveryofcommodityprices,favorableandslowinginflationthatliftedhouseholddemand.Currentaccountdeficitsnarrowedbutremainedhigh,withthemediumcurrentaccountdeficitestimatedat7%ofGDP.Currenciesintheregionstabilizedinrealeffectterms.Exchangeratepressureforoilexporterseasedduetoimprovedoilprices,increasedoilproductionandaweakerdollar.HeadlineinflationdeclinedacrosstheSSAregion,reflectingtheconfluenceofstableexchangeratesandslowingfoodpriceinflation.Fiscaldeficitsdeclinedinnon-resource-intensivecountries,butremainedhigh,partlyduetoinfrastructureinvestments.
Economicgrowthisprojectedtoriseto3.2%in2018andtoanaverageof3.6%in2019ascommoditypricesriseanddomesticdemandcontinuetostrengthen,helpedbydeclininginflation.Downsideriskscontinuetopredominate, includingthepossibilitiesofweakcommodityprices, tightglobalfinancingconditionsandregionalpoliticaluncertaintyandsecuritytensionswillintensify.Conversely,astronger-than-expectedpickupinglobaleconomicactivitycouldfurtherboostexports,investment,andgrowth in SSA region. There is also considerable scope for boosting potential growthwithstructuralreforms,includingpoliciestoincreaseinvestmentandimprovehealth8.
IntheEasternAfricanregion,theEACPartnerStates,Tanzania,Ugandaand Rwanda are projected to grow at a rate of 6.8%,5.1% and 5.9%respectively(IMF,2018).Ethiopiaisexpectedtogrowby8.2%in2018.
2.3 Kenya’s economic outlook
2.3.1 GDP growth rate
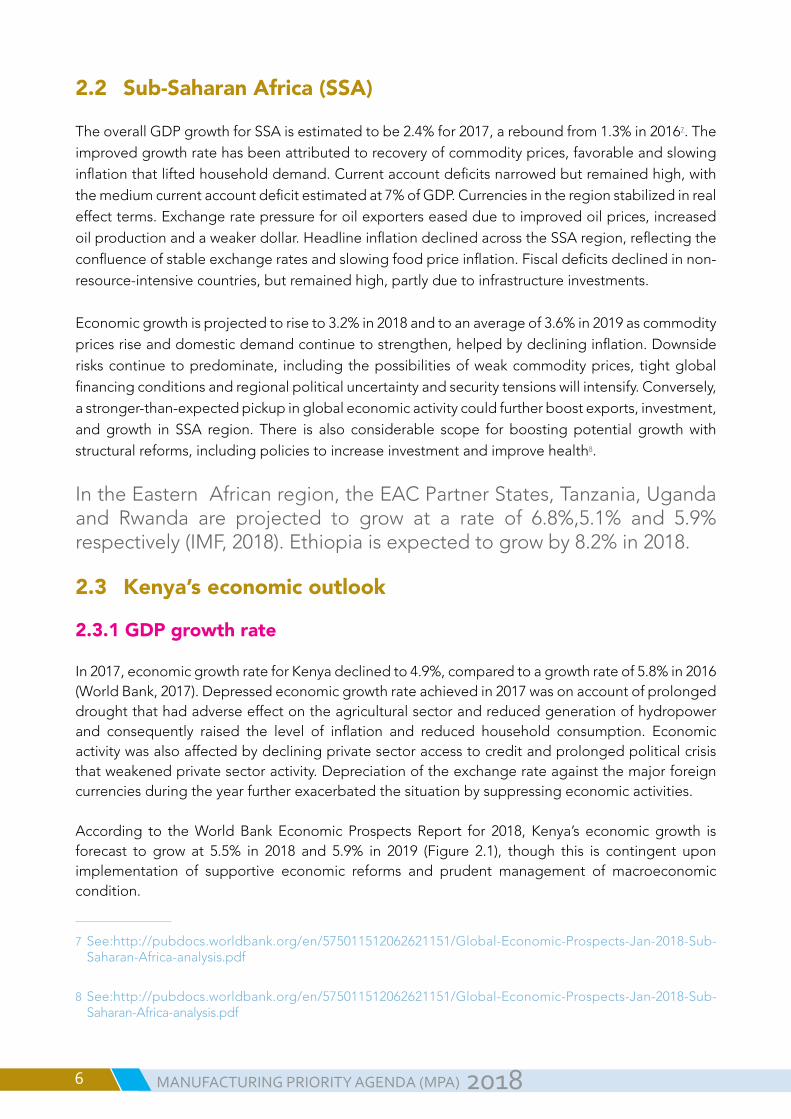
In2017,economicgrowthrateforKenyadeclinedto4.9%,comparedtoagrowthrateof5.8%in2016(WorldBank,2017).Depressedeconomicgrowthrateachievedin2017wasonaccountofprolongeddroughtthathadadverseeffectontheagriculturalsectorandreducedgenerationofhydropowerand consequently raised the level of inflation and reduced household consumption. Economicactivitywasalsoaffectedbydecliningprivatesectoraccesstocreditandprolongedpoliticalcrisisthatweakenedprivatesectoractivity.Depreciationoftheexchangerateagainstthemajorforeigncurrenciesduringtheyearfurtherexacerbatedthesituationbysuppressingeconomicactivities.
According to theWorldBankEconomic Prospects Report for 2018, Kenya’s economicgrowth isforecast to grow at 5.5% in 2018 and 5.9% in 2019 (Figure 2.1), though this is contingent uponimplementation of supportive economic reforms and prudent management of macroeconomiccondition.
7See:http://pubdocs.worldbank.org/en/575011512062621151/Global-Economic-Prospects-Jan-2018-Sub-Saharan-Africa-analysis.pdf
8 See:http://pubdocs.worldbank.org/en/575011512062621151/Global-Economic-Prospects-Jan-2018-Sub-Saharan-Africa-analysis.pdf
MANUFACTURING PRIORITY AGENDA (MPA)6 2018

Figure 2.1 GDP growth rate for Kenya (2010-2018)
Data source: World Bank (2018)
2.3.2Inflationrate
Theaverageinflationratein2017was8%,withMayrecordingthehighestrateat11.7%breachingthesingle-digitinflationtarget.Inflationratehoweverdeclinedto4.5%inDecember2017(Figure2.2).TheCentralBankofKenya(CBK)forecaststheinflationratetoremainwithinpolicylimitswhichtheWorldBankestimatesthatitwillaverage6.8%in2018.Themainthreattothemaintenanceofasingle-digitinflationrateisdrought,whosefrequencyhasincreased;occasioningincreaseinfoodprices.
Figure 2.2: Inflation rate trend in 2017
Data source: KNBS, 2017 (Monthly updates)
MANUFACTURING PRIORITY AGENDA (MPA) 72018

2.3.3 Exchange rate
The exchange rate against major international currencies portrayed mixed performance. TheShillingremainedrelativelystableagainsttheUSD,butweakenedmarginallyagainsttheEuroandtheSterlingPound(STG)(Figure2.3).Themainchallengeaffectingtheexchangerateisincreasedimportsoverexports.Theexchangerateisexpectedtostabilizein2018onaccountofstablepoliticalenvironment and sound monetary policies.
Figure 2.3: Exchange rates for Kenya against major currencies in 2017
Data source: CBK, 2017 (Monthly updates)
2.3.4 Interest rates
Banks’ lending rates inKenya dipped sharply from September2016toanaverageof 13.65% following theamendment of the BankingAct, which capped lendingrateswiththeaimtoencourageincreased consumption of credit. The law puts a ceilingon lending rates by banksand financial institutions at4% points above the Central BanksRate (CBR),withaflooron term-deposit rate equal to 70%of theCBR.Theaveragelending and deposit ratesand the CBR remained stable in 2017 after the law cappinginterest rates became effective (Figure 2.4). Further, the CBK
keptitsbenchmarkinterestrateunchangedat10%in2017,whichhasseenbanklendingratemaintainedat14%.
In 2018, the CBK is expected to retain the same rates in view of inflation expectations in the context of favorable weather conditions, sustained macroeconomic stability and the conclusion of a prolonged election period.
Figure 2.4: Interest rate in Kenya before and after the cap
Source: National Treasury, Kenya
MANUFACTURING PRIORITY AGENDA (MPA)8 2018

2.3.5 Access to credit
AccesstocreditparticularlytotheprivatesectorhassloweddownsignificantlyinKenyasince2014asaresultofaseriesofshocksinthesector(Figure2.5).Privatesectorcreditgrowthfellfromitspeakabout25%inmid-2014to1.6%inAugust2017;thelowestinthelasttenyears.AccordingtotheWorldBank’sKenyaEconomicUpdate2017,theslowdowncanbeattributedtoseveralfactorsincluding the impactof liquidity shock in2015/16; the impactof liquidationof threecommercialbanks;theimplementationoftheinterestratecap;inabilityofsmallbankstoborrowintheinterbankmarketandtherise innon-performingloan.Althoughthe interestratecapwasmeanttoreducethe cost of credit, therebymaking credit accessible to awider range of borrowers, after a yearofimplementation,weaknessinprivatesectorcreditgrowthremains9. The 2018 outlook for credit growthremainsunclear.
Figure 2.5: Growth in private sector credit in Kenya
Data source: National Treasury, Kenya
The interest ratecaphasnegativelyaffectedsmallborrowersandsmallandmediumenterprises(SME’s) as banks have shifted lending to corporate clients whenever possible impacting theallocationofcredittosmallerborrowers.Commercialbankshavealsoincreasedtheirlendingtothegovernment.Kenya’ssaversaccesstointerestbearingdepositaccountshasalsobeenaffectedasbanksarereclassifyinginterestbearingaccountstonon-interestbearingaccounts.
2.3.6 Access to credit by the manufacturing sector
Accesstofinanceisakeyissueforthemanufacturingsector.AccordingtoKNBS’EconomicSurvey2017,creditadvancementtothemanufacturingsectordecreasedforthefirsttimeinthelastfiveyearsfromKshs290.9billionin2015toKshs277.4billionin2016(Figure2.6).
9 See:https://openknowledge.worldbank.org/handle/10986/29033
MANUFACTURING PRIORITY AGENDA (MPA) 92018

Figure 2.6: Approved loans to the Manufacturing sector (2010-2016)
Source: KNBS, 2017
2.3.7 Lending to the government
Figure2.5showedthatlendingtotheprivatesectorbyCommercialBankshasbeenon adownward trendhowever, lending to theNationalGovernmenthasincreased(Figure2.7).TheCommercialBanks have re-allocated credit from private to the public sector sincetheintroductionoftheinterestcapsothatcreditgrowthtotheNationalGovernmentaveragedabout15%comparedtothe2.3%totheprivatesectorin2017.CommercialBankshavemovedto T-Bonds andBillswhich have hadbetter profitmargins andsecureunlikelendingtohigh-riskclients.
Figure 2.7: Access to credit by the National Government from the
Commercial Banks in Kenya
Source: National Treasury, Kenya
2.3.8 Stock of public debt
Kenya’spublicdebtaspercentofGDPincreasedby3.3%to57.7%ofGDPby June 2017 (Figure 2.8). Increase in the stock publicdebtwasattributedtotheincreaseinbothexternalanddomestic
debt,asgovernmentborrowedtofinancebudgetdeficit.Thestock of external and internal debtstoodat29.8%and27.4%of GDP respectively, in June2017.Aftertheintroductionofinterest rate cap, governmentsecurities are the most preferred investment options by the Commercial Banks and this tends to crowds-out theprivate sector in the domestic credit market. A sizeable amount of the government’scommercial debts will maturein 2019 and this will haveimplicationsonbudgetdeficitand consequently on the stock of debt especially in a situation where the government maybe forced to borrow to payoff some loans. The stock of public debt is expected to rise on account of unfinishedinfrastructure projects and government borrowing torefinance loans. Care has tobe taken by the governmenton borrowing to reduce thepossibility of running out offiscalspace.
MANUFACTURING PRIORITY AGENDA (MPA)10 2018
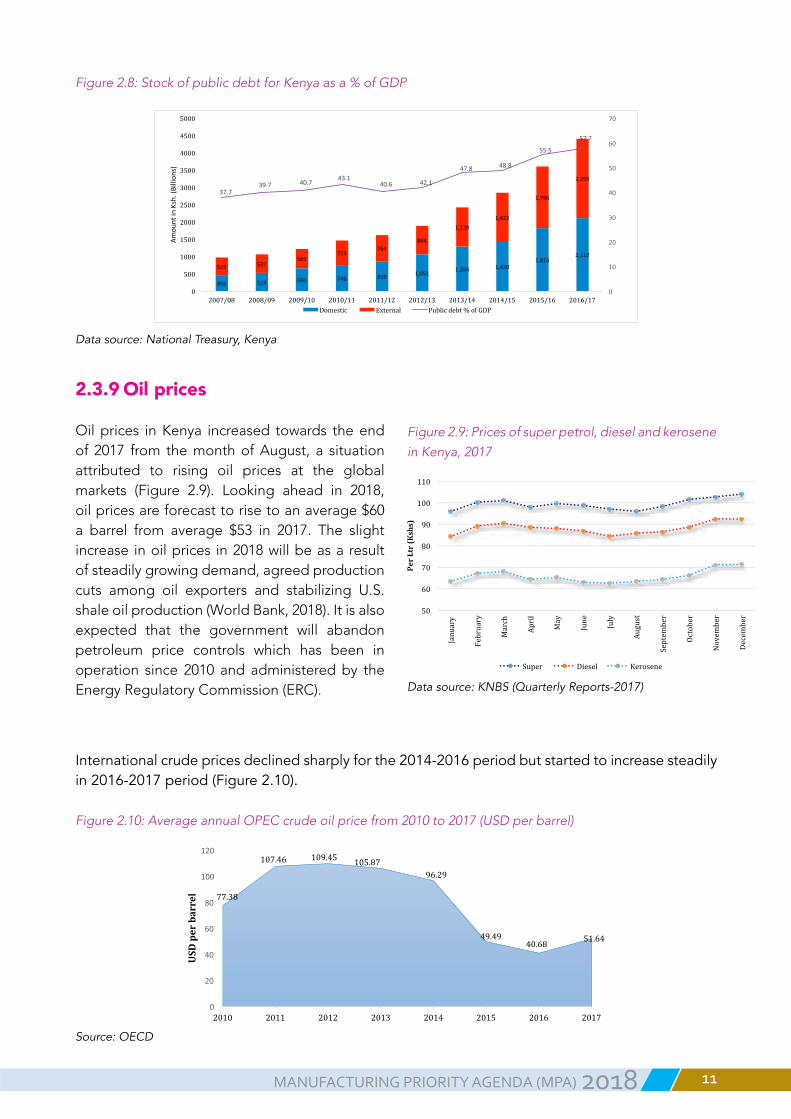
Figure 2.8: Stock of public debt for Kenya as a % of GDP
456 519 660 746 859 1,0511,284 1,420
1,8152,112
515 537565
723764
844
1,1391,423
1,796
2,295
37.739.7 40.7
43.140.6 42.1
47.8 48.8
55.5
57.7
0
10
20
30
40
50
60
70
0
500
1000
1500
2000
2500
3000
3500
4000
4500
5000
2007/08 2008/09 2009/10 2010/11 2011/12 2012/13 2013/14 2014/15 2015/16 2016/17
Amou
ntinKsh.(Billion
s)
Domestic External Publicdebt%ofGDP
Data source: National Treasury, Kenya
2.3.9 Oil prices
Oilprices inKenya increased towards theendof 2017 from themonthofAugust, a situationattributed to rising oil prices at the globalmarkets (Figure 2.9). Looking ahead in 2018,oilpricesareforecasttorisetoanaverage$60a barrel from average $53 in 2017. The slightincrease inoilprices in2018willbeasaresultofsteadilygrowingdemand,agreedproductioncuts among oil exporters and stabilizing U.S.shaleoilproduction(WorldBank,2018).Itisalsoexpected that the government will abandonpetroleum price controls which has been inoperation since 2010 and administered by the EnergyRegulatoryCommission(ERC).
Figure 2.9: Prices of super petrol, diesel and kerosene
in Kenya, 2017
Data source: KNBS (Quarterly Reports-2017)
International crude prices declined sharply for the 2014-2016 period but started to increase steadily in 2016-2017 period (Figure 2.10).
Figure 2.10: Average annual OPEC crude oil price from 2010 to 2017 (USD per barrel)
Source: OECD
MANUFACTURING PRIORITY AGENDA (MPA) 112018


3.1 Contribution to GDP
Manufacturing sector contribution toGDP has over the years stagnated ataround10%andstoodat9.2%in2016(KNBS,2017)(Figure3.1).Nevertheless,thegovernmentthroughtheKITPaspirestogrowthesharesofmanufacturingsector from 9.2% to 15% by the year 2022.
Figure 3.1: Manufacturing sector contribution to GDP in Kenya, 2010-2016
Data source: KNBS, 2017
3.2 Manufacturingsectorannualgrowthrate
Figure 3.2 illustrates annualgrowth ratesof themanufacturing sector for 2010-2016period. Thehighestgrowthratewasrecordedin2010with5.8%growthandthelowestin2012whenthesectorgrewby-0.6%.Thesegrowthratesarewaybelowtheanticipatedgrowthrateof10%asaspiredunder Vision 2030.
AN OVERVIEW OF MANUFACTURING SECTOR IN KENYA
MANUFACTURING PRIORITY AGENDA (MPA) 132018

Figure 3.2: Annual growth rate for the manufacturing sector in Kenya, 2010-2016
Data source: KNBS, 2017
3.3 Structure of manufacturing sector
Foodproductssub-sectoristhebiggestcontributingabout43%totheoverallmanufacturingsectorcontributiontoGDP.Underthecategoryof“others”,wehavesub-sectorsuchasleather,woodandfurniture, transport equipment, and Machinery.
Figure 3.3: Sub-sectors in the manufacturing sector and their contribution-2015
Data source: KNBS, 2016
3.4 Manufacturing sector output
Thenumberofmanufacturers inthecountryhasgrownovertheyearsandmanufacturingoutputgrewby69%since2010asshowninFigure3.4wherein2010,itstoodatKshs.1,258,527millionandKsh 2,132,259 million in 2016.
MANUFACTURING PRIORITY AGENDA (MPA)14 2018

Figure 3.4: Manufacturing output in Kenya, 2010-2016
Data source: KNBS, 2017
3.5 Value addition in the manufacturing sector
Thevalueaddedinthemanufacturingsectorincreasedby11.6%toKshs658.0billionin2016(Figure3.5)whichisalmostdoubleof2010.
Figure 3.5: Manufacturing value addition in Kenya, 2010-2016
Data source: KNBS, 2017
When compared with other sectors in economy, the manufacturing sector value addition lags far behind (Figure 3.6). There is need for structural changes to revive the manufacturing sector which tends to be labor-intensive and can therefore create jobs for the majority of the unemployed especially the youths.
MANUFACTURING PRIORITY AGENDA (MPA) 152018

Figure 3.6: Sectoral value addition in Kenya, 2010-2016
Data source: World Development Indicators of the World Bank (2017)
3.6 Contribution to exports
An estimated 18% of Kenyan manufactured goods are exported of which 6.1% exported to the EAC and 12% to the rest of world (KNBS, 2013).
Kenya’s export products are overwhelmingly primary in nature with tea alone constituting about 25% of total value of exports (Table 3.1). Other than being primary in nature, Kenyan exports are also low in technology component. Some of the manufactured exports include food products, on-metallic mineral products, chemical and chemical products, metals, pharmaceutical and botanical products, textiles and apparels. According to KNBS 2017 data, Food and beverage, the largest manufacturing sub-sector, dominated the category of export accounting for 45.2% of total domestic exports in 2016 while industrial supplies (non-food) accounted for 27%.
Table 3.1: Leading commodity exports for Kenya (% share), 2012-2016
Commodity 2012 2013 2014 2015 2016
Tea 21 23 20 25 25
Horticulture 17 2 21 20 22
Coffee, unroasted 5 4 4 4 4
Articlesofapparelandclothingaccessories 4 5 6 6 6
Tobacco and tobacco manufactures 3 3 4 3 3
Iron and steel 3 3 3 2 3
Essential oils 3 2 2 2 2
AnimalandVegetableoils 3 2 1 1 1
Articles of plastics 2 2 2 2 2
Soda ash 2 2 2 1 1
Medicinal and pharmaceutical products 2 2 2 2 3Data source: KNBS, 2017
MANUFACTURING PRIORITY AGENDA (MPA)16 2018

3.7 Export markets
Kenya’sexportmarketsarerelativelyconcentratedandinneedofdiversification.Ten(10)countriesaccountedfor61%exportsin2016.Fiveoutofthetoptenmarkets;andsevenoutoftoptwentymarkets in 2016 are inAfrica (Figure 3.7).Over 70%of Kenya’s total exports are destined to 12countriesglobally.Kenya’sexportsshareintheglobalmarketremainsdismalat0.03%oftotalglobaltrade.Kenyahasbeenexperiencingdeclinesandmarketlossesinkeytraditionalmarkets.
Figure 3.7: Leading export destinations for Kenya in 2016
Data source: KNBS, 2017
3.8 Contribution to employment
According to KNBS 2017, themanufacturing sector recorded employment growth rate of 1.8%(300,900people)of2.55millionwageemploymentin2016upfrom11.9%(295,500people)of2.48millionwageemploymentin2015(Figure3.8).Whileemploymentinthesectorhasbeenincreasinginabsoluteterms,itsshareinformalemploymenthasdeclinedmarginallyinrecentyears,asituationattributedtosluggishgrowthrateinthesector.
Figure 3.8: Number of persons employed in the manufacturing sector in Kenya, 2010-2016
Data source: KNBS, 2017
MANUFACTURING PRIORITY AGENDA (MPA) 172018

3.9 Compensation to employees in the manufacturing sector
Theemployeecompensationbymanufacturingsectorincreasedby7.2%toKsh.175.2billionin2016(Figure3.9).Overall,employeecompensationbythemanufacturingsectorhasdoubledsince2010,increasingby66%between2012and2016.
Figure 3.9: Compensation to employees in the manufacturing sector (2010-2016)
Data source: KNBS, 2017
3.10 Contribution of the manufacturing sector to taxes
Exciseduty,whichismainlycollectedfrommanufacturingentitieswithbeerandtobaccoasmaincontributorsofthetaxgrewby13.3%in2016/17FinancialYearcomparedtoannualaveragegrowthof14.0%inthelastfouryears.Revenuefromexcisedutyhasbeenonanincreasingtradefrom2012-2016(Figure3.10).
Corporationtaxshowedthestrongestperformanceinthelastfouryearsasitgrewby18.2%comparedtoannualaveragegrowthof13.7%.Further,giventheFigure3.9,itisclearthatthemanufacturingsectoralsomakesahugecontributiontothetaxrevenue in termsof incometaxrecipients fromemployees, social and security contributions.
Figure 3.10: Total Excise tax and Custom Duties collected (2012-16)
Data source: KNBS, (2017)
MANUFACTURING PRIORITY AGENDA (MPA)18 2018

3.11Consumerbenefitsofmanufacturing
Otherthancreationofjobs,manufacturingsectorinacountryalsomakesuseofavailablenaturalresources,resultingintolowerandaffordablepricestoconsumers.
Products and services that manufacturers produce avails to the consumers a basket of varieties from whichtochoosefrom.
Inthelongrun,boththevalueforrealmoneyheldbyconsumersandtheirpurchasingpowerincreases.Over 82% of Kenya manufactured products are consumed locally and the rest exported (KNB, 2013). Asmanufacturingadds value toproductsand rawmaterials (mainly fromagriculture sector), thesectormultipliereffectspillsovertoothersectorsasitisalsoaconsumeroftheirgoodsandservices.Manufacturingalsotendtoreducesbalanceoftradethroughexportsandlocalsourcing.
3.12 Economic health in the manufacturing sector
The Purchasing Managers Index (PMI) is an indicator used to gauge the economic health ofmanufacturingsectorandreportedinFigure3.11.InKenya,thePMIisreleasedonamonthlybasisbyCFCStanbicBankKenyaandreportedbyMarkitEconomics.ItmeasureschangesinactivitylevelacrossKenya’smanufacturingsectorfrommonthtothenext.ThePMIisbasedonfivemajorindicators:neworders,inventorylevel,production,supplierdeliveriesandtheemploymentenvironment.Theindicator ranges fromascoreof0 to100,with50declaredneutral.Anythingabove50 indicatesthattheactivitylevelimproved.In2017,thePMIroseto52pointsinJanuaryandfellto34.4pointsinOctober.ItrecordedasevenmonthsstraightcontractionfromApriltoOctober2017whichwasattributedtoheightenedpoliticalenvironmentinthecountry.
Figure 3.11: The Purchasing Managers’ Index for Kenya, 2017
Source: CFC Stanbic, Markit Economics
MANUFACTURING PRIORITY AGENDA (MPA) 192018


4.1 PILLAR ONE: COMPETITIVENESS AND LEVEL PLAYING FIELD FOR KENYAN MANUFACTURERS
There is increased integration of world economies through the forces ofglobalization.Therapidglobalization,technologicaladvancement,changingconsumer preference and evolving government policies are reshaping themanufacturing industry exponentially, accelerating the pace of competitionandcontinuallyraisingthebarontheperformanceofcompanies’acrosstheglobe.
Kenyanmanufacturersarenotanexception.While this is inevitable,oneofdeterminants for thesuccessorfailureofcountriesandcompaniesiswhethertheycanchangeinasimilarorevenfasterpacethantheglobalpace.Atnationallevel,thereisneedforsoundfiscalandnon-fiscalpoliciestoenablemanufacturerstocompetedomesticallyandinternationally.Thegovernmentshouldcreatealevelplayingfieldforallmanufacturerstoensureequalopportunitiesinordertoenhancefairtradeandcompetitivemanufacturinginthecountry.
PILLARS TO SUPPORT SPARKING KENYA’S INDUSTRIAL TRANSFORMATION FOR JOB CREATION
Figure 4.1: An illustration of key drivers of manufacturing sector competitiveness in Kenya
Source: Authors’ conceptualization
Aconducivepolicy,legal®ulatoryenvironmentisnecessaryfor industrial transformation
•Billofmaterials-shouldbeequalorlowertothoseatglobalmarket.
•Costofutilities-thisincludes,costofenergy,water,sewerageamongothersshouldbeminimum.
•Costandproductivityoflabour-Kenyaasoneofthehighestlabour cost.
• Accessandcostoffinance - ifmanufacturingsector is togrowitneedsaccesstomorefinanceatlowercost.
•Transport&logistics-effecientandeffectivetransportandlogistics is important tomove rawmaterials and finishedgoodsfromonepointtoanother.
• Margin - any form of business should earn returns oninvestiment
MANUFACTURING PRIORITY AGENDA (MPA) 212018

Agenda for competitiveness and level playing field for manufacturers
4.1.1 Reduce the cost of production of basic commodities
Over82%ofKenyanmanufacturedgoodsareconsumedlocallywhiletherestareexported(KNBS,2013).Thisunderscorestheimportanceofthemanufacturingindustryinthecountry.Thepricesoflocallymanufacturedgoodshavebeenonacontinuousincrease,asituationattributedtoincreasingcostofindustrialrawmaterials.
According to the third quarter Manufacturing Barometer 2017, 45% of manufacturers in Kenyaindicated that the cost of industrial input as one of the major concerns in the manufacturingindustrytoday.Thehighcostofinputsleadstohighpricesoflocallymanufacturedproductstherebylimitingtheircompetitivenessintheregionalandinternationalmarketsandhamperingthesector’scapacity utilization. In order to reduce the cost of basic commodities in the country and improve the competitivenessofmanufacturedgoodsespeciallyintheEACregion,thefollowingactionsshouldbe undertaken:
Zerorateimportdeclarationfee(IDF)forindustrialinputsforbonafidemanufacturers; Zeroraterailwaydevelopmentlevy(RDL)forbonafidemanufacturers; ClearoutstandingVATrefundsandensureVATrefundsprocessingandpaymentisundertakenwithin60daysfromthedateoflodgingapplicationinordertoensurecompanies’healthycashflow;and ExemptbonafidemanufacturersfromWithholdingVAT.
4.1.2 Promote access to quality, affordable and reliable electricity
Electricityisanimportantinputinthemanufacturingprocesses.Thecostofelectricity inthecountryhasbeenhighlyunstablewithbillsrisingbyatleast10%permonth.Onthesupplyside,the government has made tremendous efforts in improvingelectricitygenerationinthecountry.MajorattemptstodiversifyKenya’s sources of electricity especially towards wind andgeothermalsourcesareexpectedtoprovideasmuchas45%ofelectricity supply by 20226.
However, even if power is available, poor transmission anddistribution infrastructure leads to erratic power supply andoutages in the country (Were, 2016). Further, the quality ofelectricity supplied is also a major concern for high voltageandbulkconsumersasfluctuationinpowerandpoweroutageslowerproductivityasmachineshave tobe restartedandtheirlifetimeisshortened.Inordertoencourageaffordable,reliable,qualityandsustainableelectricityformanufacturingindustryinKenya,thefollowingactionshouldbeundertaken:
6 See:http://sbs.strathmore.edu/news/reducing-cost-electricity-kenya/
MANUFACTURING PRIORITY AGENDA (MPA)22 2018

Finalize the enactment of the Energy bill 2015which seeks to resolve energy relatedissuesinthecountrysuchaspowerquality,reliabilityanddistributionofelectricityamongothers; Establishautonomous regionalKenyaPower&LightingCompany (KPLC)branches toincreasecompetitionandreliabilityofpowersupply; Allowgeneratorsofelectricitytoselltobulkelectricityconsumerstoenhancethequalityandreliabilityofelectricity;and Reviewcontractsofthermalpowerproducersandpegthemonperformancetoensureaccesstoreliablepowerataffordablerates.
4.1.3 Address multiple charges, fees and levies by counties.
In2013,adevolvedsystemofgovernmentwasimplementedcomprisingNationalGovernmentand47CountyGovernments.TheConstitutionempowersthecountiestoraiseownsourceofrevenuebylevies,chargesandfees.Thishasnotonlyincreasedadministrativeandfinancialburdentomanufacturersbutalsocontinuetodiscourageinvestment.Further,theselevies,chargesandfeesarenotharmonizedacross the47counties in thecountry. Inter-countymovementofgoodsnowattract a feechargedbyeachcountyforgoodsthatpassthrough.Thishasresultedtodoubletaxationandconsequentlyincreasedthecostofdoingbusinessbetweenthecountiesandthecountryatlarge.Thechallengeofmultiplecharges,feesandleviesbycountiescanberemediedthroughthefollowingactions:
FasttrackfinalizationandimplementationofcountyownrevenueresourcepolicywhichseekstoprovideguidelinesonrevenuecollectionamongcountiesaspertheConstitution;and Developanational legislation toharmonizeand rationalizecountypoliciesand legislationonfees,chargesandlevies.
4.1.4 Increase circulation of money in the economy
The circulation of money in an economy is necessary to facilitate economic activities. This implies thatissuessuchaslatepaymentofsuppliersbyboththepublicandprivatesectorsreducescashflowoftheaffectedsuppliers.Forinstance,accordingtoAuditorGeneralReportforKenyain2016/17,pendingbills byCounties amounted toKsh. 35.8billion. In order to address the cultureof latepayment and the question of corporate governancewitnessed in the country’s retail sector, thefollowingoughttobeundertaken:
Enactmentofpromptpaymentandaccountabilitylegislation; EstablishmentofaRegulatoryAuthorityfortheretailsector; Set up a supplier portal so that suppliers electronically track status of orders, delivery schedules, potentialproductshortageandpaymentreceived;
Organization of business ethics and integrity compliance trainings for the private and publicsectors;and
DigitizationofpaymentsandrefundsbyGovernment.
4.1.5 Reduce transport and logistics costsTransport is required in the production procedures, frommanufacturing to delivery to the finalconsumersandreturns.Onlyagoodcoordinationbetweeneachcomponentwouldbringbenefitstomaximumtoeachparty.Accordingtothe2016logisticperformanceindexbyWorldBank,Kenyawasranked42ndout160countries,anindicationthata lotneedstobedonetoaddress logistic
MANUFACTURING PRIORITY AGENDA (MPA) 232018
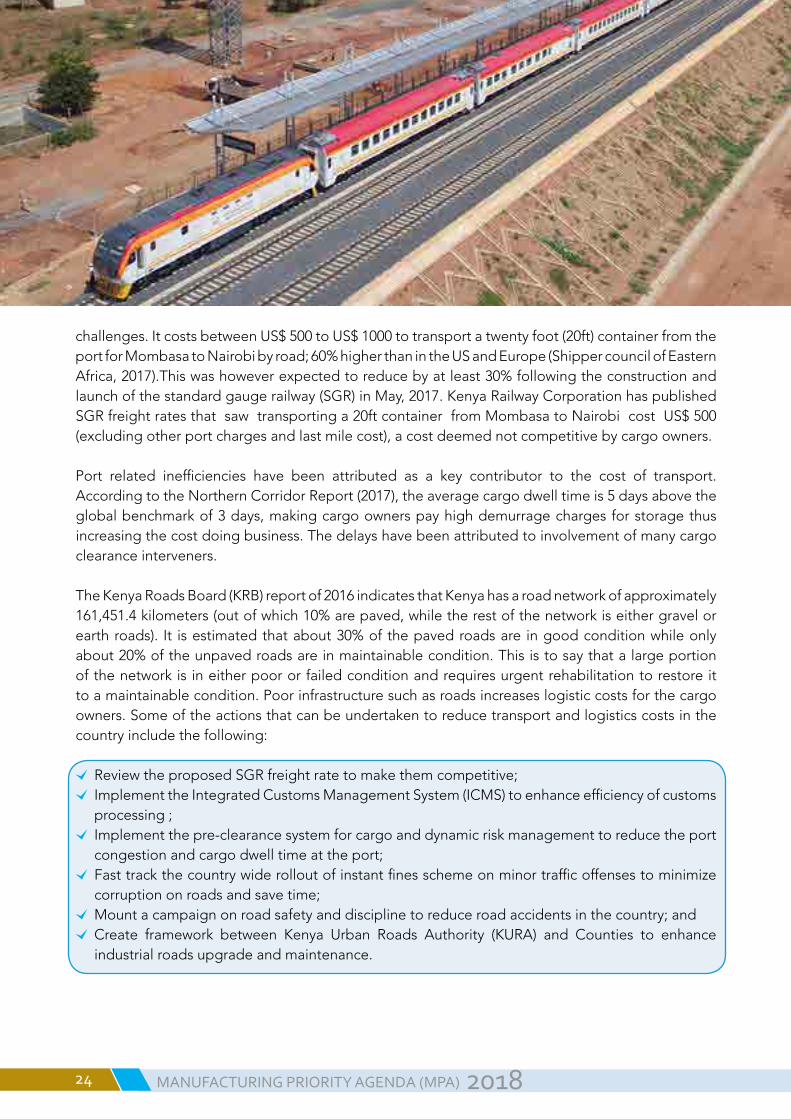
challenges.ItcostsbetweenUS$500toUS$1000totransportatwentyfoot(20ft)containerfromtheportforMombasatoNairobibyroad;60%higherthanintheUSandEurope(ShippercouncilofEasternAfrica,2017).Thiswashoweverexpectedtoreducebyatleast30%followingtheconstructionandlaunchofthestandardgaugerailway(SGR)inMay,2017.KenyaRailwayCorporationhaspublishedSGRfreightratesthatsawtransportinga20ftcontainerfromMombasatoNairobicostUS$500(excludingotherportchargesandlastmilecost),acostdeemednotcompetitivebycargoowners.
Port related inefficiencies have been attributed as a key contributor to the cost of transport.AccordingtotheNorthernCorridorReport(2017),theaveragecargodwelltimeis5daysabovetheglobalbenchmarkof3days,makingcargoownerspayhighdemurragechargesforstoragethusincreasingthecostdoingbusiness.Thedelayshavebeenattributedtoinvolvementofmanycargoclearance interveners.
TheKenyaRoadsBoard(KRB)reportof2016indicatesthatKenyahasaroadnetworkofapproximately161,451.4kilometers(outofwhich10%arepaved,whiletherestofthenetworkiseithergravelorearthroads). It isestimatedthatabout30%ofthepavedroadsare ingoodconditionwhileonlyabout20%oftheunpavedroadsareinmaintainablecondition.Thisistosaythatalargeportionofthenetworkis ineitherpoororfailedconditionandrequiresurgentrehabilitationtorestoreittoamaintainablecondition.Poorinfrastructuresuchasroadsincreaseslogisticcostsforthecargoowners.Someoftheactionsthatcanbeundertakentoreducetransportandlogisticscostsinthecountryincludethefollowing:
ReviewtheproposedSGRfreightratetomakethemcompetitive; ImplementtheIntegratedCustomsManagementSystem(ICMS)toenhanceefficiencyofcustomsprocessing; Implementthepre-clearancesystemforcargoanddynamicriskmanagementtoreducetheportcongestionandcargodwelltimeattheport; Fasttrackthecountrywiderolloutofinstantfinesschemeonminortrafficoffensestominimizecorruptiononroadsandsavetime; Mountacampaignonroadsafetyanddisciplinetoreduceroadaccidentsinthecountry;and Create framework between Kenya Urban Roads Authority (KURA) and Counties to enhanceindustrialroadsupgradeandmaintenance.
MANUFACTURING PRIORITY AGENDA (MPA)24 2018

4.1.6Availlongtermfinancingtomanufacturers
Accesstofinanceespeciallylongtermfinanceiskeyformanufacturersintermsofexpandingbusinessoperationandleveragingbusinessandinvestmentopportunitiesthatarisefromtimetotime.KenyalikeanyotherAfricancountryhasfounditchallengingtomobilizeresourcestoaddresstheneedforlongtermlendinginordertoprovidecapitalinvestmentinthemanufacturingsectorwhichoveryearshashadweak returnsandahighpercentageofnon-performing loans (Tyson,2015).Publicfinancial institutionsuchKenya IndustrialEstates (KIE)have limitedfinancial resources tosupportloandemandfromthemanufacturingsector.Further,whilecommercialbanksarethemostsought-aftersourcesoffinancetothemanufacturingsectoroutsidethefinancingfrompersonalsources,theyhaveunfavorableconditions.MostofcommercialbanksinKenyagiveshorttermloaninordertolimitriskexposureassociatedwithdoingbusiness inKenya.Theworkingcapitalcyclelastssixmonthsonaverage,demandingpatience
Domestic financing to themanufacturing sectordeclinedbetween 2015 and 2016 aftergrowingsteadily between 2006 and 2014. According to KNBS (2017), the total loans advance to themanufacturingsectordecreasefrom290.9billionin2015to277.4billionin2016 (Figure2.6).
Foreigndirectinvestment(FDI)intothesectorhasalsosloweddown.AccordingtoastudyonFDItoKenyaconductedin2015,16%ofFDIinflowwenttomanufacturingin2013.Kenya’schallengesinattractingFDIrangesfromdifficultiesinworkpermits,barriertoqualificationandpoorgovernmentincentives.
Somefinancingthatwouldbeofbenefittothemanufacturingsectordoesnotfinancethesectoritselfbutratherisaimedatimprovingthebusinessenvironmentandenablers.Forinstance,AfricanDevelopmentBank(AfDB)currentlydoesnotdirectlyfinancemanufacturingbutprovidessupporttolocalbanksthroughpartialguaranteefacilities,whichenhancethecapacityofbankstoprovidefinancingandincreaseopportunitiesforbusinessestoaccessfinancing.
Long termfinancing to themanufacturing sector shouldcome fromboth thepublicandprivatesectorthroughimplementationofthefollowingactions:
Incentivize saving institutions suchasNational Social Security Fund (NSSF) to invest in themanufacturingsector; Restructure the Industrial and Commercial Development Corporation, Agricultural FinanceCorporation(AFC)andKenyaIndustrialEstate(KIE)tocreateaKenyaDevelopmentBankwithanindustrialdevelopmentfundcommittedtomanufacturing; Operationalize theMovablePropertySecurityRightsAct, 2017 (theAct) thatprovides for thecreationofanelectroniccollateralregistryforusebyKenyanbanks;and IncentivizeInternationalFinanceCorporation(IFC)andEximbankstoprovidelongtermloanstothe manufacturers.
4.1.7 Fight illicit trade, contraband, substandard goods and dumping
Trade in illicit, substandardandcounterfeitproducts isamajorchallenge facingmanufactures inKenyatoday.AccordingtoastudyoncounterfeitsconductedbyKAMin2013,manufacturersloseupto 40% on market share, 50% on revenue and 10% on company reputation due to the proliferation ofcounterfeitsintheKenyanmarketwhilethegovernmentlosesaboutUS$80millioninpotential
MANUFACTURING PRIORITY AGENDA (MPA) 252018

tax revenue.Anenterprisesurveyconductedby theWorldBank in20137 established that one out of four private sector firms in Kenya considerinformalcompetitionasthebiggestobstacle.
Mostcounterfeitedgoods inKenyaare the fastmovingconsumergoods(FMCGs).Thisnotonlyhurts theeconomy,butalsoposeshealth risks toconsumersofthesegoods.Legitimatemanufacturersinvestinresearchanddevelopment,qualitymaterialandmanufacturingprocesses,andwork tomeet the conformity assessment schemes of the product markets. They also worktobuildbrandrecognitionandfostergoodwillwiththeirendusers.Counterfeiters,whoaredirectcompetitors,relyoninfringingbrandnamesandprofitingfromtheirgoodwillandreputationresultinginthedirectlossofsales,lossofgoodwillandtrademarkdilution.
Three institutions including the Kenya Revenue Authority (KRA), KenyaBureauofStandards(KEBS)andAnti-counterfeitAgency(ACA)arecrucialin thefightagainst illicitandcounterfeitproducts.However, there is lackof inter-agency collaboration, misinterpretations of law by enforcementofficersandfailureofcourtstoimposetoughpenalties.
Atregionallevel, lackofharmonizedpolicyandlegislationoncounterfeitsintheEACaffectsthecommonmarketdespitethefactthatallpartnerstate,exceptsouthSudan,aremembersoftheWorldIntellectualPropertyOrganization(WIPO).Thecurrentintellectualpropertyrights(IPR)frameworkwithinEAChinders thefightagainstcounterfeitsas the IPRsarecountryspecificandthere isnomutualrecognitionofIPRwithintheregionasthereisnoregionalpolicyonIP.Further,thereisnoformalmechanismofbringing together the IPofficersof theEACpartnerstates forpurposesofdiscussingcommonissuesofconcern.Thishasgreatlyaffectedenforcementagainstcounterfeitsandillicittradeacrossthebordersduetothefactthattherearebothchallengesoftransitgoodsaswellastheporousborderswhereillicitgoodscouldbesmuggledbackintoanyofthepartnerstates.Therefore, there is need to push for the harmonization of IPR in EAC and the creation of a centralized database for registeredtrademarks inorder tocurbthecounterfeitmenace.Tofight illicit trade,contraband,substandardgoodsanddumpinginKenyathefollowingactionscanbeconsidered:
ImplementthetraderemediesAct(2017)whichseektodeal withunfairtradepracticessuchasdumping,subsidizingand importsurges; Establishanoverarchinginstitutiontofightillicittradewhich mightincludechangingtheAnti-CounterfeitAuthority(ACA) intoAnti-IllicitTradeAuthority; HarmonizeEACIPRframeworkformutualrecognitionbyall partnerstates;and Fullenforcementofexistinglawstoensurefairtradepractices andlevelplayingfield
7See:http://documents.worldbank.org/curated/en/141781468048839839/pdf/923680WP0count000PUBLIC00Kenya02013.pdf
The protection of intellectual property
rights is a critical factor in supporting the
growth of our local manufacturing. Even
as we Buy Kenya and Build Kenya, we cannot enrich fraudsters who, masquerading as well-
known brands, produce dangerous fakes.
H.E President Uhuru Kenyatta, CGHPresident and
Commander in Chief of the Defence Forces of the republic of Kenya-12th December, 2017
MANUFACTURING PRIORITY AGENDA (MPA)26 2018

4.2 PILLAR TWO: EXPORT DRIVEN MANUFACTURING
Inthe1970’sthenewlyindustrializedcountries(NICs)adoptedanexport-ledindustrializationstrategywhere incentives were provided to promote non-traditional exports (World Bank, 1993). KenyanexportsarelargelyprimaryinnatureasindicatedinTable3.1.Thus,anexportdrivenmanufacturingstrategycanbeinterpretedtomeanthatnon-primaryproductsareencouragedandpromoted,inotherwords,exportdiversification isencouraged. It canalso involveupgradingprimaryand lowtechnologyprimarycommodityexports.ExportpromotionisemphasizedinVision2030,however,thereisnocoherentpolicyframeworktosupportexports(Page,2016).ThereisapossibilitythatthischallengecanbeovercomeintheNationalExportDevelopmentandPromotionStrategywhichisunderdevelopmentandaimstogrowexportsby20%by2022.
Agenda to promote export driven manufacturing
4.2.1 Increase market access for Kenyan exports
Thethirdquartermanufacturingbarometer2017revealedthatmostofthemanufactureroperateatabout53%capacity.Thissuggestthatcapacitycanbeenhancedforpurposesofexport.In2016,imports from China, India and United Arab Emirates (UAE) accounted for 23.6%, 14.4% and 6.4% respectively of total imports for Kenya or 44.4% (KNBS, 2017). Kenyan export markets are alsoshrinkingespeciallywithin theEAC,akeymarket forKenyanmanufacturedgoods (seeannex3).IncreasedmarketaccesstoregionalandinternationalmarketisnecessaryforKenyatoreducetradedeficit(seeannex2).SomeoftheactionsthatthegovernmentcantaketoincreasemarketaccessforKenyanexportsincludethefollowing:
Seek preferential treatment of Kenyan manufactured goods by countries with huge tradeimbalanceagainstKenyasuchasIndia,ChinaandUnitedArabEmirates; ExploreestablishmentofAfricanGrowthandOpportunityAct(AGOA)liketradeagreementwithCanada; FinalizethereviewtheEACCETandadopta4bandtariffstructurewithanupperlimitof35%topromotevalueadditionandindustrialization; FasttrackContinentalFreeTradeArea(CFTA)negotiationsanditsimplementationtoboostintra-Africatrade; Conclude Tripartite Free TradeArea (TFTA) negotiation and ratify the agreement to increasemarketforKenyanmanufacturedgoods; FinalizeandimplementtheEACEliminationofNon-TariffbarrierRegulation,2017thatseekstogiveeffecttotheEACEliminationofNon-TariffBarriersAct,2015; Undertaketrademissionstotargetspecificmarketsandspecificmanufacturedgoods;and Developaframeworkfordisseminatingmanufacturingmarket intelligencethroughtheKenyatrade portal.
4.2.2 Incentivize and promote exporters
Inordertosuccessfullypromoteanexportdrivenmanufacturing,anefficientandeffectiveincentivemechanismisrequired.Exportersneedconstantcashflowtofundtheiroperations.Taxincentiveswhereataxburdenonamanufacturercanbeeasedcanofbenefittothemanufacturers.Thereisneed to incentivize investors to invest in export-oriented projects or sectors. One of the factor that hasadverseeffectstomanufacturerswhoexportisthenewformulatodeterminetheamountduefor
MANUFACTURING PRIORITY AGENDA (MPA) 272018

VATrefund.ThenewformuladoesnotaddressthebacklogofVATrefundsandactsasdisincentivetoexportingmanufacturerswhohavebeeninVATrefundclaimposition.Manufacturerswhoexportalso lackexportfinance facilityandareaffectedbyexchangeratemovements.Exporterscanbeincentivizedthroughthefollowingactions:
RemovetheVATrefundformulaonexports; Offerexportfinancetolocalfirms;and Introducepreferentialforeignexchangepremiumformanufacturersdoingexport.
4.2.3 Protect local and infant industries
Thisagendacanappearlikeanti-freetradeinitiative.Infantindustriesrequireprotectionfromthegovernmentespeciallywherethereareunfairtradepractices.GovernmentschemessuchasSEZandEPZ provide various tax (Table 4.1) and non-tax incentives as stipulated in their respective Acts of establishmentandwhoseroleandmotiveiswidelyacknowledged.
Table 4.1: Tax incentives under the EPZ and SEZ schemes
TAX EPZ SEZ SchemeValue added tax(VAT)-16%
EPZ enterprises are exempt from VAT registration. The supply of taxable goods and services to EPZs is zero rated from VAT
The supply of taxable good and services to SEZs is zero rated from VAT.
Excise Duty – varying rates
Importation of goods and services exempt from excise duty
Importation of goods and services exempt from excise duty.
Income Tax – 30%
Exempt for the first 10 years from the date of first sale and at a rate of 25% for the next 10 years thereafter. 30% rate from the 21st year.
10% for the first 10 years of operation, and thereafter 15% subsequent years
Withholding Tax – 5% to 20%
Dividends and other payments to non-residents during the 10 year tax holiday.Subsequently, withholding tax for non-residents applies as follows:Interest: 15%Dividend: 10%Management&ProfessionalFees:20%Royalties: 20%
Payments to non-residents:Interest: 5%Dividend: 0%Management&ProfessionalFees:5%Royalties: 5%*
Investment Deductions
100%ofthecapitalexpenditureonbuildingandmachineryinthefirstyearofuse.
100% of capital expenditure on buildingandmachineryinthefirstyearofuse.
Import Declaration Fee–2%
Goods destined to EPZs are exempt from ImportDeclarationFees
Goods destined to SEZs are exempt from Import Declaration Fees
Stamp Duty –Nominalto4%
ExecutionofanyinstrumentrelatingtotheEPZ business.
Execution of in of any instrumentrelatingtotheSEZbusiness
RailwayDevelopment Levy–1.5%
Applicable on importation Applicable on importation
ExportLevy–ad valorem
Exports to EPZs are exempt from Export Levy Exports to SEZs are exempt from Export Levy
Data source: Authors’ analysis
MANUFACTURING PRIORITY AGENDA (MPA)28 2018

Oneofthenon-taxincentiveismarketaccess.FirmoperatingundertheEPZschemecanlegallysellup-to 20% of their annual output in the domestic market provided that all duties are paid to ensure alevelplayingfieldwithotherlocalmanufacturerswhoareoutsidetheEPZscheme.However,inamoveaimedatprovidingcheapernewclothingtoitscitizens,Kenyaappliedforastayofapplicationunder theEACthatallowedtheEPZfirms tosell to theKenyanmarket (only)duty freeandVATfree.ThiscreatesasituationwherefirmsundertheEPZschemehaveanupperhandovernon-EPZfirmsinthedomesticmarketgiventhefavorableincentivesthataccruetothem.Further,thishascomplicatedKenya’stradeintextilesintheEACastextilesaresubjectedtoarigorousverificationprocesstodeterminewhethertheyoriginatefromtheEPZs.Thisputsnon-EPZtextilemanufacturersatadisadvantagewhensellingintheEACmarket.UnliketheEPZs,firmsundertheSEZschemewithhave unlimited access to the domestic market in terms of quotas. Clearly, firmsoperatingunder the SEZ schemehave a competitive advantageover the non-SEZmanufacturers.
Manufacturing firms inKenya are heavily dependentof imports of food andnon-food industrialsupplies.Strengtheningofvaluechainsbyencouragingandpromotingsomeoftheimportedinputswillcreatebackwardandforwardlinkagesintheeconomy.AgoodexampleisedibleoilwherecrudeoilisimportedinKenyabutsunflowergrowingcanbeencouragedtoreducetheneedtoimport.Thus,valuechainanalysisofthosesectorsthatare likelytohavestronglinkages intheeconomyshouldbeidentifiedforpurposesofdevelopingthem.LocalandinfantindustriesinKenyacanbeprotectedinthefollowingways:
Level playing fieldbetweenSEZ, EPZ and local industryby rationalizing andharmonizing taxincentives to all Manufacturers. Createopportunitiesforlocalvaluechainwithforwardandbackwardlinkages;and Undertakevaluechainanalysisandoffersubsidiestostrategicsectorswithstronglinkages.
4.2.4IncentivizevalueadditionanddiversificationofexportsValue addition of export commodities such as coffee, tea and some horticultural products can increase Kenya’sforeignexchangeearnings.Thevalueadditionstrategycanalsobeanexportdiversificationstrategybecausenewproductscanbedeveloped.KenyacanexporteverythingbutarmsintheEUmarketundertheEPAandabout6,000productstotheUnitedStatesundertheAGOA;fullpotentialofthesemarketshasnotexploitedduetolownumberofexportableproducts.
TheGovernmentofKenyahasputemphasisonattractingForeignDirectInvestment(FDI)andhasadedicatedinstitution(KenyaInvestmentAuthority/KenInvest)todealwithFDIsandotherformsof investments. TheKenInvest should reconfigure its approach to attractingFDI, for instancebytargetingaspecificfirminagivencountry.Table4.2providesasummaryandactionstobetakeninordertorealizeanexportdrivenmanufacturingsectorinKenya.Thegovernmentcanincentivizevalueadditionanddiversificationofexportsbytakingthefollowingactions:
CreateKenyanbrandforsomeofthekeyexportcommoditiessuchasteaandcoffee; Targeted FDI campaigns in specific countries targeting specific manufacturers. For examplepursuingToyotaCompanyinJapantosetupanassemblyplantinKenya; HoldsensitizationseminarstopotentialexportersonmarketaccessandproductsthatcanbenefitfromtheAGOAandEPAtradeschemes;and Promote implementationof export oriented investments in SEZsespecially thosewith strongbackwardandforwardlinkageswiththeKenyaneconomy.
MANUFACTURING PRIORITY AGENDA (MPA) 292018

4.3 PILLAR THREE: PRO-INDUSTRY POLICY AND INSTITUTIONALFRAMEWORK
Private sector is a major economic actor in any economy and an important agent for poverty reduction and economic development. Business friendly environment in terms of policy, legal and institutional framework is necessary for the private sector activities to flourish and make it better able to further national economic goals. Agenda to ensure pro-industry policy and institutional framework
4.3.1 Predictable and stable industrial policies developed through industry consultations
Thegovernmentandaffiliated institutionsmakepolicypronouncementsondifferent issues fromtimetotimeandinsomeinstances,withoutstakeholderengagement.Inothercases,lawsarealsomadewithoutsupportingpolicies.Thismeansthattheoperatingenvironmentisnotcapturedandlawsarepreparedwithoutreflectiononwhatisonthegroundduetolackof impactassessment.Further,toooftenregulationsaredraftedorenforcedinahaphazardmannerwithtotaldisregardoftherealitiesofbusinesssectorhenceaffectingthemnegatively.Thisagendacanberealizedbytakingthefollowingactions:
Enactanationalpolicyonpublicparticipation; Ensureformulationofoverarchingpoliciesbeforeanenactmentoflaws.
4.3.2 National policy and institutional coherence for the manufacturing sector
National industrial policies
Overtheyears,theNationalGovernmenthascraftedaraftofpolicyinitiativesaimedatsupportingthemanufacturingtomakeKenyaanindustrializedcountry.ThemostrecentpolicydocumentsincludetheExportPromotionZones(EPZ)Act,1990;Kenya’sVision2030;KenyaIndustrialTransformationProgramme(KITP);BuyKenyaBuildKenya(BKBK)initiative;NationalTradePolicy(NTP);NationalExportDevelopmentandPromotionStrategy(NEDPS) and Special Economic Zones (SEZ) Act, 2015. EPZ: The International Labour Organization (ILO) defines EPZs as “industrial zones with special incentives set up to attract foreign investors, in which imported materials undergo some degree of processing before being exported again” (ILO, 2014; pg. 1). Some key featuresof theEPZsare that theyare situatedatdesignatedgeographical areas,have special incentivesand theentireproduction is exported. TheEPZ strategywasmeant tomake themanufacturingsectorinKenyatohaveanexportorientationotherthanbeinginwardlooking.Thisisafterimportsubstitutionindustrializationstrategy(ISIS)provedineffectiveinpromotingindustrialtransformationin the country.
MostofEPZsproductsespeciallytextilesandapparelsfindtheirwayintotheUnitedStatesthroughtheAGOAprogramme.
Vision 2030: In 2003, theNationalGovernment instituted theEconomicRecovery andStrategyPaper(ERSP)forthe2003-2007periodwiththeaimofspeedingeconomicrecoveryandgrowthafter
MANUFACTURING PRIORITY AGENDA (MPA)30 2018

decadesofeconomicstagnation.ThisERSPwascreditedwithdeliveringaneconomicgrowthrateof7.1%in2007;thehighestinseveraldecades.AfterthelapseofERSP,thegovernmentlaunchedVision2030in2008whoseoverallgoalwastotransformKenyaintoamiddle-incomecountryby2030.Vision2030seekstocreateamanufacturingsectorthatisrobust,diversifiedandcompetitiveundertheeconomicpillar(GovernmentofKenya,2008).ThedevelopmentofindustrialandmanufacturingzonesineightregionsandthedevelopmentofSmallandMedium-Enterprises(SME)industrialparksareidentifiedasthetwoflagshipprojectstosupportthemanufacturingsector.FiveyearMedium-Term-Plans(MTPs)areusedinitsimplementation.UnderVision2030,agro-processing,meatandfishprocess are emphasized.
KITP: RelatedtoVision2030istheKITPwhichwaslaunchedin2015bytheMinistryofIndustry,TradeandCooperatives(MoITC).TheKITPseekstotransformthemanufacturingsectorinKenyaforjobcreationandinclusivegrowth(GovernmentofKenya,2015).TheKITPobjectiveswillbeachievedthroughthefollowingfivestrategies:
• Launchsector-specificflagshipprojectsinagro-processing,textiles,leather,constructionservicesandmaterials,oilandgasandminingservicesandinformationtechnology(IT)relatedsectorsthatbuildonourcomparativeadvantages;
• DevelopKenyanSMEsbysupportingrisingstarsandbuildingcapabilitieswithmodelfactories;• Createanenablingenvironmenttoaccelerateindustrialdevelopmentthroughindustrialparks/zonesalonginfrastructurecorridors,technicalskills,supportinginfrastructureandeaseofdoingbusiness;
• Createanindustrialdevelopmentfund;and• DriveresultsthroughthenewlyformedMinisterialDeliveryUnit.
SEZs: TheconceptofSEZscameintobeinginKenyain2015whentheSEZActwasenacted.Baissac(2011)definesSEZsas“spatially delimited areas within an economy that function with administrative, regulatory, and often fiscal regimes that are different (typically more liberal) than those of the domestic economy” (Pg23).TheSEZisagenericconceptthatencompassesavarietyofzonesincludingtheEPZs(WorldBank,2008).
TheSEZAct,2015identifiestentypesofzones,namelyfreetradezones;industrialparks;freeports;information communication technology parks; science and technology parks; agricultural zones;touristandrecreationalzones;businessserviceparks;livestockzones;conventionandconferencefacilities.
BKBK: In 2017, theMoITC launched theBKBK strategywhose aim is to encourageKenyans toconsumelocallyproducedgoodsandservicesinordertosupportthedomesticeconomy.Fivekeyresultareasincludingpublicprocurement,marketaccess,marketaccess,advocacyandinstitutionalframeworkhavebeenidentifiedforpurposesofimplementingthestrategy(GovernmentofKenya,2017).
NTP: Launched in June, 2017 by MoITC alongside the BKBK and seeks to unleash Kenya’s potential targeting domestic, regional and globalmarket.The Trade Policy articulates provisionsthatpromoteefficiency in thegrowthofdomestic trade through transformationalmeasures thataddress the constraints impedingagainst thedevelopmentof thewholesale, retail and informalsectors.Strengtheningthecurrentsupplychainisapriorityforsustainabledevelopmentofthesetrade sectors
MANUFACTURING PRIORITY AGENDA (MPA) 312018

NEDPS: This isbeingdevelopedbyMoITCand it is in itsfinalstagesofcompletion. It isafive-year sector development planwith defined actions on issues that affect export development inthecountry.Itisexpectedtospecifically;Inducesynergiesforhigherproductioninspecificexportsectorstoenablebetterexportperformance;enhancemarketaccessandsustainedperformance;identifyandalignconstrainsintheexportsectorandproposemitigationmeasures;allocateresourcebased on prioritized objectives and streamline the export sector.
Prevailing institutional framework
ThereareahostofinstitutionsthataffecttheoperationsofthemanufacturingsectorinKenya.Forthepurposeofthiscurrentanalysis,focuswillbelimitedtothoseinstitutionsthatimplementpolicystrategiestopromoteindustrialmanufacturingandtheyincludethefollowing:
• MoITC: ThemissionofthisMinistryistocreateanenablingenvironmentforagloballycompetitive,sustainableIndustrial,enterpriseandco-operativesectorthroughappropriatepolicy,legalandregulatoryframework.TheKITPandBKBKstrategyarehostedinthisMinistry.
• Ministry of Devolution and Planning (MoDP): This Ministry spearheads the preparation of MTPsmeanttoactualizetherealizationofVision2030andisintheprocessoffinalizingthethirdMTPfortheperiod2018-2022.IntheMTP,thereisasectorplanforthemanufacturingsectorandprepared by MoITC.
• Kenya Vision 2030 Delivery Secretariat: ItwascreatedtospearheadtheimplementationofVision2030andMTPsbyprovidingleadershipandcoordination.
• Micro and Small Enterprise Authority (MSEA):ThisinstitutionwasestablishedundertheMicroandSmallEnterpriseAct,2012toformulateandcoordinatepoliciestointegrateandharmonizeboth public and private sector initiatives to enable the MSEs to become the key industries of tomorrow. It is instructive tonote that thedevelopmentofMSE industrialparks isoneof theflagshipprogrammeproposedunderVision2030.TheMSEAisundertheMoITC.
• Kenya Investment Authority (KenInvest): KenInvest was established in 2004 to promoteinvestments in Kenya and is under the National Treasury. In discharging its responsibilities,KenInvestoverseestheimplementationofnewinvestmentprojects,providesafter-careservicesfornewandexistinginvestmentsandorganizesinvestmentpromotionsinKenyaandabroad.
• Brand Kenya Board (BKB): Itwas created in 2008 tobuild andenhanceKenya’s imageandnationalidentityandrallyingKenyansbehindit.Oneofitsfunctionsisthatofpromotinglocalproductsandservicestoencourageeconomictransformation.TheBKBisundertheMoITC.
• Kenya Industrial Property Institute (KIPI):ItisagovernmentagencyundertheMoITChavingbeenestablishedin2002.Itsmissionistograntindustrialpropertyrightsandpromotesocialandeconomic development.
• Kenya Industrial Research and Development Institute (KIRDI): The KIRDI is under the MoITC and it is mandated to undertake multidisciplinary research and development in industrial and alliedtechnologies.
• Export Promotion Council (EPC):Itwasestablishedin1992withaviewtodevelopandpromoteexporttradeforthebenefitoflocallyproducedgoodsandservices.Thiswasmeanttogivetheeconomyanoutwardorientationwhichwaslargelyinwardlookingatthetime.TheEPCisunderthe MoITC.
MANUFACTURING PRIORITY AGENDA (MPA)32 2018

• Export Promotion Zones Authority (EPZA): Itwasestablished in 1990, it ismandatedwithattracting,andretainingexportorientedinvestmentsandtrade.ItisundertheMoITC.
• Special Economic Zones (SEZs) Authority: It was established in 2015 and it is under the MoITC. One of its responsibilities is to promote and market special economic zones to potential economic zone developers, operators or other investors.
• President’s Delivery Unit (PDU): It was established in February 2015 by the President to oversee the implementation of flagship projects. Flagship projects are scattered across 12 sector: information communication and technology (ICT); healthcare; lands; infrastructure; social inclusion; food security; energy; youth and women; security; ease of doing business; and Huduma Centers. It is apparent that there are no specific flagship projects for the manufacturing sector in Kenya.
Rationalizationofnationalpolicyandinstitutionalframeworkaffectingthemanufacturingsectorisnecessarytoensurecoherence.Thisisbyinstitutingactionsthatmightinclude:
Developandimplementanationalmanufacturingpolicy;and Review,andrationalizetherolesofvariousregulatorybodiesinthemanufacturingsector.
4.3.3 Manufacturing sector delivery unit
Itisapparentthattherearemultipleinstitutionswithdifferentmandatesanddrivingindifferentwaystheindustrializationagenda.Rationalizationoftheseinstitutionsis importanttoavoidduplicationandconfusionwithregardstoindustrializationinKenya.Vision2030DeliverySecretariatissupposedtomonitortheimplementationofVision2030flagshipprojectsandtheMTPs;PDUalsooverseestheimplementationofflagshipprojectsandtheMoITCundertheKITPhasproposedtheformationofMinisterialDeliveryUnit.Afundamentalquestioncanbeposed.WhichinstitutionshouldchampionindustrializationinKenya?Asastopgapmeasure,theKAMisoftheviewthatpolicyandinstitutionalcoordination be under the PDU. The PDU does not yet have flagship projects targeting themanufacturingsectorinKenya.ThisshouldchangebecausemanufacturingisoneofthefoursectorsthatHEPresidentUhuruKenyattawillprioritizeinthenextfiveyears.Inhisinauguralspeechon28thNovember,2017,thepresidentnoted“Over my term, we will grow and sustain this manufacturing sector, and raise its share of the national cake from 9 to 15 percent”.Forthemanufacturingsectordeliveryunittobeeffective,thefollowingactionisproposed:
Identification of manufacturing sector flagship projects guided by the proposed nationalmanufacturingpolicytobecoordinatedunderthePDU.
MANUFACTURING PRIORITY AGENDA (MPA) 332018

4.4 PILLAR FOUR: GOVERNMENT DRIVEN SMES DEVELOPMENT
The Vision 2030, underscores the importance of the Small and Medium Enterprises (SMEs) subsector in the country’s industrial transformation agenda.TheSMEshavebeenrecognizedfortheirroleinprovidinggoods and services, enhancing competition, fostering innovationandgeneratingemployment leading to alleviationof poverty. TheSMEs cut across all the sectors of the economy and provide one of themainsourcesofemploymentaswellasgeneratingwidespreadeconomicbenefits(GovernmentofKenya,2005).NationalEconomicSurveyreportbytheCentralBankofKenyaof2017,SMEsconstitute98% of all businesses in Kenya, create 30% of the jobs annually and contributes3%ofGDP.Whilethesectorcontinuestocreatenumerousjobsandboostthecountry’sGDP,itfacesamyriadofchallengesthathamperitsgrowth.
Thesechallengesrangefromproductdevelopment,marketaccess(both local and international), access to affordable finance, supplychain/rawmaterialmanagement,qualitystandardsandcertifications,access to technology, production innovation and patenting topolicy, regulatoryandbusinessenvironment problems. In fact, theKNBS 2016 study on the sector revealed that close to half a million small enterprises inKenyadie annually as thebusinessenvironment in the countrygetsbumpy.Furthermore, SME sub-sector has the highest informal sectors in the country with close to 5.58million unlicensed businesses (National Micro, Small and Medium Establishment Survey, 2016).
Agenda to promote government driven SMEs growth and development
4.4.1 Facilitate business compliance with regulations to formalize the informal economy
Unfriendlypoliciesandregulatoryregimesarekeyhindrancestoaconducivebusinessenvironment.Facilitation tobusiness compliance throughSMEsupportive regulationshasbeen seenas keyadriverinformalizingtheinformalbusinesses8.SMEsoperatepartlyorwhollyintheinformalsector,especiallywhenat start-up stages,due to thenatureofmarketswhich areoftenover-regulatedthrough licensingamongothers (AntonopoulosandMitra, 2009).TheNationalMicro,Small andMedium Establishment Survey by KNBS in 2016, established that there were about 1.56millionlicensedSMEsand5.85millionunlicensedbusinessesinthecountry.Challengessuchascomplexandtediousregistrationprocessesandprocedures,highfeesbysomeoftheindustryregulators,chargesandfeesonnewproductdevelopmentandtheirintroductiontomarket,highlocalauthoritiestrade licensing fees, competition from uncontrolled imports and lack of subsidies to supportSMEsexporters,uncleargovernmentpoliciesandregulationsandpoororlackofinfrastructureinproductionzoneshavebeencitedtocausethis.Inordertoaddressthesechallenges,thefollowingactions should be undertaken:
8
“Here in Kenya, the bulk of employment comes from
SMEs, which are an important contributor to our gross
domestic product (GDP). Our plan is to create an additional
1,000 SMEs focused on manufacturing: they will have access to affordable capital, skills and markets; and they will accelerate the growth in
manufacturing”.
H.E President Uhuru Kenyatta, CGH
President and Commander in Chief of the Defence Forces of
the republic of Kenya-12th December, 2017
MANUFACTURING PRIORITY AGENDA (MPA)34 2018

Promotesimplificationofbusinessstartupprocedures; EncourageinformalindustriesandassociationstoregisterwithMSEAandusethisbodytovoicetheconcernsandideasofthesub-sector;
EstablishincubationcentersforSMEsinall47countiesinordertoresolveissuessuchasproductdesign,accesstotechnology,productioninnovationandpatenting;
Provide trainings for SMEs on cash flowmanagement, marketing and exporting, intellectualpropertymanagementandcorporategovernance; Reducebarrierstoregistrationthroughformulationofapolicythatsimplifiesandspellsouttheregistrationprocess;and CorporateTaxreliefforstart-upSMEsforthefirstthreeyearsofoperation.
4.4.2 Accord preference to local content in government procurement
GovernmentinanycountryisthelargestconsumerofgoodsandservicesandthisimpliesthatitcanbeofgreatbenefittotheSMEsespeciallybyprocuringtheirproducts.Publicprocurementservesasawindowthroughwhichthepublicsectorcaninteractwiththeprivatesector.Howsuchinteractionismanagedisveryimportantinfosteringasenseoffairnessandwideningthebaseforparticipationbythe private sector in public procurement (All- Party Parliamentary Small Business Group (APPSBG), 2006).WhilethepublicprocurementmarketinKenya,likeothercountriesworldwide,dealswithwiderangesofsupplies,SMEshavebeensidelined(Afande,2015).SomecontractsarewithincapabilitiesofSMEsbuttheyareshelvedfromparticipatinginpublicprocurementdespitetheirqualification,sizesandlevelofproductionbecauseofamyriadofissuesrangingfromdocumentation,financials,tounfairprocesses.CreationoflinkagesbetweenlargeenterpriseandSMEsthroughsubcontractingisoneofthemaindeterminantsforthesuccessofSMEgrowthanddevelopment.Theinteractionhasimpactonknowledgeandskilltransferandenhancedtechnologicaladoption.Thegovernmentcouldalsofocusonimprovingtradefinancingwhichwillgoalongwayinimprovingthesector.Ingeneralterms,SMEscanbeaccordedpreferencethroughthefollowingactions:
FasttracktheimplementationofBKBKpolicy; CreatelinkagesbetweenlargeenterpriseandSMEthroughsubcontracting; Review,simplifyandpublishguidelinesofthePublicProcurementandAssetDisposalAct(PPADA),2015withstepbystepinstructionsandtipsonhowtorespondtopublictenderswithafocusonKenyangoodsandservices;and Review PPADA, 2015 to enforce the directive to reserve 40%of the procurement budget forlocallyproducedgoodsandservices.
MANUFACTURING PRIORITY AGENDA (MPA) 352018

4.4.3 Enhance credit and market access to SMEs
Understandingthemarketdynamisminboththedomesticandinternationalmarket,wherefinishedproductsaresold,iskeytothesuccessofanyfirm.MostofKenyanSMEsselltheirproductsandserviceinthedomesticmarket.Thedomesticmarketissmallformassproductionandtobenefitfromeconomiesofscale.HenceinabilityforSMEstoreduceunitcostofproductionandtheonlywaytoincreasetheirshareofmarketisbydevelopingnewandinnovativeproductswhichhassubstantialfinancial implication.On thehand, the country’s appetite for importedmanufacturedgoodshascontinued to rise and has had adverse effect on the SME sector in the county competition.
IftheSMEssub-sectorinmanufacturing,istogrow,thereisneedtoaccessmorefinancesandatalowercost.SeveralstudieshaveconsistentlycitedlackoffinancialaccessasamajorproblemamongSMEinthecountry.Accesstofinancialresourcesisconstrainedbybothinternalandexternalfactors.Internally,mostSMEslackcreditworthinessandmanagerialcapacity,sotheyhavetroublesecuringfundsfortheirbusinessactivitiessuchasprocuringrawmaterialsandproductsandinvestinginplantandequipment.Fromtheexternalperspective,SMEsareregardedasinsecureandcostlybusinessestodealwithbecausetheylackrequiredcollateralsandhavelowabsorptioncapacityoffunds.Theyarethereforerationedoutintheiraccesstocreditduetohighintermediatedcosts,includingcostofmonitoringandenforcementofloancontracts.
Further,achallengelinkedtoexpandingbanklendingistheinterestratescap,whichcappedlendingratesat4%abovetheCBKbaseratesinceAugust2016.TheinterestratecappinghasnegativelyaffectedtheSMEsasbankshaveturnedtoriskprofiling,amovewhichhasseentheSMEsfallunderthemostriskycategoryhencecrowdingthemout.AccordingtoavailabledatafromTheNationalTreasury,Privatesectorcreditgrowthfellfromitspeakofabout25percentinmid-2014to1.6%inAugust2017,thelowestintenyears(Figure2.5).Actionsthatcanbetakentoenhancecreditandmarketaccessincludethefollowing:
SetupastockexchangeforSMEsandimplementationofNSE’sframeworktoboosttheaccessofventurecapitalfundstosmallandmediumenterprises; Rethinkingandupdatingriskassessmenttools,especiallywhenassessingSMEs; OfferloanguaranteestoSMEs; Incentivize commercial banks to provide low interest rate loans targetingmanufacturers andSMEs;and EncourageKenyaCreditReferencebureaustoworkcloselywithmanufacturers indeterminingcreditworthiness.
MANUFACTURING PRIORITY AGENDA (MPA)36 2018

4.5 PILLAR FIVE: SECURING THE FUTURE OF MANUFACTURING INDUSTRY
Tosecurethefutureofthemanufacturingsector,itsoperationshastobeenvironmentallyfriendlyand sustainable, keep pace with the ever changing technological advances which necessitatescontinuousskilldevelopmentofthelabourforce.AlsoimportantisaccesstolandespeciallywiththecomingintobeingoftheCountyGovernments,anefficientpublicserviceandastablepoliticalenvironment.
Agenda for securing the future of Manufacturing Industry in Kenya
4.5.1 Green growth and sustainable development
According to the Organization for Economic Cooperation and Development (OECD, 2011),green growth can be seen as a way to pursue economic growth and development, whilepreventingenvironmentaldegradation,biodiversity loss,andunsustainablenatural resourceuse.Fordevelopment tobe sustainable, it has tomeet theneedsof the currentgenerationwithoutcompromisingtheabilitytomeettheneedsofthefuturegenerations.Thefollowingactionsneedtobetakentopromotegreengrowthandsustainabledevelopment:
Incentivizeindustriesexcellinginenergymanagementthroughanationalaward; Promoteself-regulationformanufactureronenvironmentalissues; Applyforthegreenclimatechangefund; FinalizeandenacttheNationalWasteManagementBill2017; SupportthefinalizationandimplementationoftheNationalWaterPolicy; Promoteindustrysymbiosistoencouragegreeneconomyandcreatenewcultureofeconomicgrowth;and Promoteandrecognizethecertificationmarkforresponsiblecare.
4.5.2 Industry 4.0
Industry 4.0 (4th industrial revolution) is a name for the current trend of automation and data exchange in manufacturing technologies. Industry 4.0 creates what has been called a “smart factory”. It includes cyber-physical systems, the Internet of things, cloud computing and cognitive computing Industry. Given that Industry 4.0 is still a very new concept, one of the action that can be implemented is stated as follows:
Developanationalpolicyframeworkandprogrammetoimplementindustry4.0withsectoralbias.
MANUFACTURING PRIORITY AGENDA (MPA) 372018

4.5.3 Pro-industry skill development
Constanttrainingofworkersiscriticalforthemanufacturingsectorbecausetechnologicaladvanceshaveensuredthattheskillgapscontinuetoincreaseandhencetheneedforcontinuoustraining.WhileoverthousandyouthgraduatesfromhighereducationentertheKenyajobmarketeveryyear,the2017 industrialcompetitivenessreportpointsoutdiresituation inskillsector inKenya.Therearegaps in thehumanskill,curriculumandtechnology thatdonotadequatelyaddress theeverchangingskillandtechnologyneedforthemanufacturingsector.
Thereisgrowingmismatchbetweenavailabletechnicalskillandthemarketdemandsduetoaweaklinkagebetween training institution and the industry at the three levels of training (Universities,TertiarycollegesandYouthpolytechnics).Generally,thelabourmarketinKenyaisinthedireneedforabridgingdialogueandstructuredwayforwardbetweentheskillneedbyindustryandtheratherlackingtrainingplaceintechnicaltraininginstitutions(TTIs).
There are various policy instrument and private sector initiatives that have been developed to addresschallenges.TheKAMis implementinga technicalandvocationaleducationandtraining(TVET)projectwithmaingoalofimprovingaccesstotechnicalandvocationaljobsandeconomicopportunities for youth inKenya. Someof thegovernmentpolicy and legal instrumentsgearedtowardsaddressingtrainingatthethreelevelsmentionedaboveinclude:EducationActCap211,SMESessionalPaperNo.2of2005,andTVETStrategy2008,TIVETAct,2013,IndustrialTrainingAct2012,EmploymentAct2007,MinistryofYouthAffairsandSports’CurriculumforYouthPolytechnics–beingpilotedin100YouthPolytechnics.TheNationGovernmentcaninitiateoneofthefollowingpolicy actions:
Introducesubsidizedapprenticeshipprogrammeandprovidetaxholidaysforcompaniestakingupinterns; DevelopmentandimplementationofSectorSkillsAdvisoryCommittees(SSACs)thatwillguideinthedevelopmentofoccupationstandardstoinfluencecurriculumdevelopment; Review thePublicServiceCommission InternshipPolicyandGuidelines for thePublicService(2016)toaccommodateTVETgraduatesinterns; PopularizeandstrengthenTVETeducationandtrainingthroughNationalTVETconferencesandskillsshows; Establishjobmatchingdatabasetolinktheemployersandemployees;and Strengthenthelinksbetweenindustryandacademicinstitutionsthroughresearch.
MANUFACTURING PRIORITY AGENDA (MPA)38 2018

4.5.4 Enhance access to land
Land is one of the basic factor of production and remain key to vast majority industries in Kenya. The costandownershipoflandinKenyaishighandtheissueoflandhasbeencomplicatedwiththeonsetofCountygovernmentswhichdonothavelandbanksdesignatedforindustrialdevelopment.Processingoftitledeedsistimeconsumingprimarilybecauseitisamanualprocess.Thefollowingactions can foster access to land in Kenya include:
ProactivelycreatelandbanksearmarkedforindustryatcountyandnationallevelsofgovernmentperhapsthroughinstitutionssuchasKIE; Advocateforspeedydigitizationoflandregistry;and PromptissuanceoftitledeedsincludingforSMEs.
4.5.5 Fit-for-purpose public service
Anefficient,responsiveandeffectivePublicadministrationisnecessaryifthemanufacturingsectoragendaandindeedifthecountrydevelops.Thus,effortstorevitalizepublicservicesdelivery,fightagainstcorruptionandreductionoflossofpublicfundsandenhancementoflabourproductivitywillgoalongwayincreatingafit-for-purposepublicservicedeliveryinKenya.Someoftheactionsthatcanbeimplementedtoachievethisobjectiveincludesthefollowing:
Replacecash-basedaccountingsystemwithaccrual-basedaccountingsysteminpublicfinance; Strengtheningperformancecontractingenhancepublicservicedelivery; InitiateanannualPresidentialeventtorecognizetopperformingpublicinstitutionsandpublicservants;and De-pegthepieceratefromminimumwagetoencouragelabourproductivity.
4.5.6 Stable political environment
For the private sector activity to flourish and realize its objective of satisfying the customers, employees and the society, a stable political environment is an important ingredient. For purpose of argument, a stable political environment is one that is devoid of violence or disruptive effects on business. In Kenya, most of elections are disruptive to business and leads to steep reduction in the rate of economic growth. There is need to find a permanent solution to the violence that often erupts during an election year. Some of the suggested actions include the following:
Addresstherootcauseofpoliticalcrisisthateruptsinanelectionyear;and National debate on political cohesion.
Let me emphasize that political stability and harmonious labour relations are the bedrockonwhichwewillachievearobustmanufacturingsector.
H.E President Uhuru Kenyatta, CGHPresidentandCommanderinChiefoftheDefenceForcesoftherepublicofKenya
-12th December, 2017
MANUFACTURING PRIORITY AGENDA (MPA) 392018

SUMMARY AND CONCLUSION

5.1 SummaryThe MPA 2018 themed, “Sparking Kenya’s industrial transformation for job creation” willdrivetheKAMadvocacyagendathisyear.Asparkin industrial manufacturing sector is requiredto increase its share to GDP from 9.2% to 15%, create employment for the unemployed majority ofwhomaretheyouthsandintheendbecometheenginethatdrivestheeconomyaswasthecase in the industrialized countries. Creation of the“spark” in themanufacturingsectorwillrevolvearoundfivepillars:competitivenessandlevelplayingfield;export-drivenmanufacturing;pro-industrypolicyandinstitutionalframework;SMEsdevelopment and securing the futureofmanufacturingindustry.
Manufacturers need to be competitive and producegoodsandservicesthatcancompeteregionally and internationally, given that tradebarriers have declined globally as a result ofmultilateral trade agreements and regionaltrade integration initiatives. Fairness, rules ofthe game, and incentives for all categoriesof manufacturing are necessary. Some of theimpediments towards a competitive and levelplaying field include levies such as IDF andRLD, VAT refunds and WVAT, expensive andunreliableelectricity,multiplecharges,feesandlevies by counties, liquidity constraints in the economy,expensivetransportandlogistics,lackof long-term finances to manufacturers; illicitand contraband trade.
A manufacturing sector that is export drivenis required to overcome limitations of small domestic markets. Challenges on access toregionalexportmarketshavetobesoughtandovercome. Disincentives to manufacturers such as VAT refund backlogs with KRA have to beaddressed, protect local and infant industries and incentive value addition and diversify exports.
For the manufacturing sector in Kenya toflourish,thereisneedforsupportivepolicyandinstitutionalframework.Thereisahostofpolicies
such as Vision 2030, KITP, BKBK and the NEDPS that can create confusion instead of clarity in termsofwhatthefocusshouldbeindevelopingand supporting the manufacturing sector inKenya. Responsibilities of implementing thesepolicies rests in many institutions such as Vision 2030 Secretariat, SEZ Authority, EPZA, and PDU among others. This suggest that there is nocentralized entity to harmonize and coordinate activities of these institutions. This needs to change
The importance of SMEs sector contribution to the overall growth of economy cannot beoveremphasized.Thereisneedforgovernmenttoputmorefocusonaddressingthechallengesin the SMEs sector in the country. Robust SMEs financing framework will go a longway in enhancing access to finance amongSMEs. Government need to simplify business registration process while promoting startup business through trainings that focus oncash flow management, intellectual propertymanagementproductdesignanddevelopment,marketaccess,andcorporategovernanceamongothers forSMEs.Promotionof sub-contractingbetweenlargeandSMEwillalsogoalongwayin promoting the subsector. Enforcement ofthe40%localsourcingrequirementwillalsobeinstrument in building the SMEs sector in theCountry.AwidespectrumsuchasthismayonlybetackledbymainstreamingSMEdevelopmentinnationalframeworks
The future of the manufacturing sector inKenya has to be secured. Natural environment iscontinuouslygettingdegradedasaresultofhumanactivity,skillsgapsareincreasingandlifeof skills already acquired shortening becauseof technological advances; land is Kenya is anissueofconcernformanufacturers;aneffectiveand effective public service and a stable political environmentisrequiredforeffectivefunctioningofthemanufacturingsector.
MANUFACTURING PRIORITY AGENDA (MPA) 412018

5.2 ConclusionKenyan manufactures need an outward orientation through increased exportsto regionaland internationalmarkets.Aparticular focusshouldbegiven to thosecountriesthatKenyacanhasaneverincreasingtradedeficitwithespeciallyChina,India andUAEand should review anyof the currentbilateral trade agreement toaddress this problem. Exporters need to be incentivized to export more for example throughavailabilityofaffordableexchangerateregime.Localandinfantindustriesrequire support especially those that have strong backward and forward linkagesin theeconomy.Targetedapproach toattract somespecific investors inparticularcountriescanbeusedasinnovativewaytoattractFDItofostervalueadditionanddiversificationofexports.
Policy and institutional coherence is required such that there is only one policy document to guide development and promotion of the manufacturing sector inKenya.Suchpoliciesshouldbepredictableandstableandinvolvingalltherelevantstakeholdersincourseoftheirdevelopment.Thiswillreduceconfusionand“manyvoices”talkingaboutthesamething.TheMPA2018proposesthedevelopmentofaNationalManufacturingPolicywhoseimplementationandcoordinationshouldbeunder the PDU.
A government driven SMEs development (while stakeholder involvement) will beinstrumental in turning around the sector. Government procurement should bepro-SMEsandwitheffectiveSMEsfinancing frameworkanda supportivebusinessfacilitationcompliancewhileencouragingSMEssubcontractingwithlargefirms.
Tosecurethe futureof themanufacturingsector inKenya,greengrowthpracticessuchefficiencyinenergyuse,industrysymbiosisandrecyclinghavetobepursued.Developmentofnationalpolicy frameworkandprogrammeto implement Industry4.0creatingneed-basedcurriculumisnecessarytokeeppacewiththeeverchangingtechnology.Effortstoincreaseefficiencyandroomforleakageofpublicfundssuchasimplementingaccrual-basedaccountingsysteminpublicfinanceandreinvigoratingperformance-basedmanagementsysteminpublicserviceiscrucial.AlastingsolutiontopoliticalcrisisthatKenyaexperiencesinanelectionyearhastobesought.
MANUFACTURING PRIORITY AGENDA (MPA)42 2018

AN
NE
XES
Anne
x 1: S
umm
ary o
f pilla
rs, a
gend
a and
actio
ns fo
r MPA
201
8
THEM
E: S
PARK
ING
KENY
A’S
INDU
STRI
AL T
RANS
FORM
ATIO
N FO
R JO
B CR
EATI
ON
S/N
NA
ME
OF
THE
PILL
AR
AG
END
AA
CTIO
NS
1.
Com
petit
iven
ess
and
levelplayingfield
a) R
educ
e th
e co
st o
f pr
oduc
tion
for
basi
c co
mm
oditi
es
1)Zerorateim
portdeclarationfee(IDF)forindustrialinputsforbonafidemanufacturers.
2)Zeroraterailwaydevelopmentlevy(RDL)forbonafidemanufacturers.
3)ClearoutstandingVATrefundsandensureVATrefundsprocessingandpaymentisundertaken
within60daysfromthedateoflodgingapplicationinorderensurecompanieshealthycash
flow.
4)Exem
ptbonafidemanufacturersfromWithholdingVAT.
b) P
rom
ote
acce
ss to
qu
ality
, aff
orda
ble
and
relia
ble
ener
gy
1)FinalizetheenactmentoftheEnergybill2015whichseekstoresolveenergyrelatedissues
inthecountrysuchaspowerquality,reliabilityanddistributionofelectricityamongothersin
Ken
ya.
2)EstablishautonomousregionalKPLCbranchestoincreasecompetitionandreliabilityofpower
sup
ply
3)Allowgeneratorsofelectricitytoselltobulkelectricityconsum
erstoreduceenhancethe
qua
lity
and
relia
bili
ty o
f ele
ctric
ity.
4)Reviewcontractsofthermalpowerproducersandpegthemonperformancetoensureaccess
toreliablepowerataffordablerates.
c) A
ddre
ss m
ultip
le
char
ges,
fees
and
le
vies
by
coun
ties
1)Fasttrackfinalizationandim
plementationofcountyownrevenueresourcepolicywhichseeks
provideguidelinesonrevenuecollectionam
ongcountiesaspertheconstitution..
2)Developanationallegislationtoharmonizeandrationalizecountypoliciesandlegislationon
fees,chargesandlevies.
d) I
ncre
ase
circ
ulat
ion
of m
oney
in th
e ec
onom
y
1)Enactmentofpromptpaymentandaccountabilitylegislation.
2)Establishm
entofaRegulatoryAuthorityfortheretailsector.
3)
Set
up s
upp
lier
po
rtal
so
tha
t su
pp
liers
can
ele
ctro
nica
lly t
rack
sta
tus
of
ord
ers,
del
iver
y schedules,potentialproductshortageandpaymentreceived.
4)Organizebusinessethicsandintegritycompliancetrainingsfortheprivatesector.
5)DigitizepaymentsandrefundsbyGovernment.
MANUFACTURING PRIORITY AGENDA (MPA) 432018

S/N
NA
ME
OF
THE
PILL
AR
AG
END
AA
CTIO
NS
e)
Red
uce
tran
spor
t and
lo
gist
ics
cost
s1)ReviewtheproposedSGRfreightratetomakecompetitive.
2)ImplementtheIntegratedCustomsManagem
entSystem
(ICMS)toenhanceefficiencyof
customsprocessing.
3)Implementthepre-clearancesystemforcargoanddynam
icriskmanagem
enttoreducethe
portcongestionandcargodwelltimeattheport.
4)HarmonizeKenya’sroadhum
pswithEACstandards.
5)Fasttrackthecountrywiderolloutofinstantfinesschemeonminortrafficoffensestominimize
corr
uptio
n o
n ro
ads
and
sav
e tim
e.6)Mountacam
paignonroadsafetyanddiscipline.
f) A
vail
long
term
financingfor
man
ufac
ture
rs
1)IncentivizesavinginstitutionssuchasNationalSocialSecurityFund(NSSF)toinvestinthe
manufacturingsector.
2)RestructuretheIndustrialandCommercialDevelopmentCorporation,AgriculturalFinance
Corporate(AFC),KenyaIndustrialEstate(KIE)tocreateaKenyaDevelopmentBankwithan
industrialdevelopmentfundcommittedtomanufacturing.
3)OperationalizetheMovablePropertySecurityRightsAct,2017(theAct)thatprovidesforthe
creationofelectroniccollateralRegistryforusebyKenyanbanks
4)IncentivizeInternationalFinanceCorporation(IFC)andEximbankstoprovidelongtermloans
to t
he m
anuf
actu
rers
g) F
ight
illic
it tr
ade,
co
ntra
band
, su
bsta
ndar
d go
ods
and
dum
ping
1)ImplementthetraderemediesAct(2017)whichseektodealwithunfairtradepracticessuchas
dum
ping,subsidizingandim
portsurges.
2)EstablishanoverarchinginstitutiontofightillicittradewhichmightincludechangingtheAnti-
Co
unte
rfei
t Aut
horit
y (A
CA
) int
o A
nti-I
llici
t Tra
de
Aut
horit
y.3)Fullenforcem
entofexistinglawstoensurefairtradepracticesandlevelplayingfield
4)HarmonizeEACintellectualpropertyright(IPR)frameworkformutualrecognitionam
byall
par
tner
sta
tes.
2.
Expo
rt d
riven
m
anuf
actu
ring
a) I
ncre
ase
mar
ket
acce
ss fo
r Ken
yan
expo
rts
1)SeekPreferentialTreatmentofKenyanmanufacturedgoodsbycountrieswithhugetrade
imbalanceagainstKenyasuchasIndia,ChinaandUnitedArabEmirates.
2)Exploreestablishm
entof“AGOA”liketradeagreem
entwithCanada.
3)FinalizetheReviewtheEACCETandadopta4bandtariffstructurewithanupperlimitof35%
to
pro
mo
te v
alue
ad
diti
on
and
ind
ustr
ializ
atio
n 4)FasttrackContinentalFreeTradeArea(CFTA)negotiationsanditsimplementationtoboost
intr
a-A
fric
a tr
ade.
5)ConcludeTripartiteFreeTradeArea(TFTA)negotiationandratifytheagreem
enttoincrease
marketforKenyanmanufacturedgoods.
6)FinalizeandimplementtheEACElim
inationofNon-TariffbarrierRegulation,2017thatseeksto
giveeffecttotheEastAfricanCommunityElim
inationofN
on-TariffBarriersAct,2015.
7)Undertaketrademissionstotargetspecificmarketsandspecificmanufacturedgoods.
8)DisseminatemanufacturingmarketintelligencethroughtheKenyatradeportal
MANUFACTURING PRIORITY AGENDA (MPA)44 2018

S/N
NA
ME
OF
THE
PILL
AR
AG
END
AA
CTIO
NS
b) I
ncen
tiviz
e an
d pr
omot
e ex
port
ers
1)
Rem
ove
the
VA
T Re
fund
form
ula
on
Exp
ort
s 2)Offerexportfinancetolocalfirms;and
3)IntroducepreferentialforeignexchangepremiumforM
anufacturersdoingexport.
c) P
rote
ct lo
cal a
nd
infa
nt in
dust
ries
1)LevelplayingfieldbetweenSEZ,EPZandlocalindustrybyrationingandharmonizingtax
ince
ntiv
es to
all
Man
ufac
ture
rs.
2)Createopportunitiesforlocalvaluechainwithforwardandbackwardlinkages
3)Undertakevaluechainanalysisandoffersubsidiestostrategicsectorswithstronglinkages.
4)EstablishaNationalAutomotiveCounciltodrivetheagendaforthesector.
d) I
ncen
tiviz
e va
lue
addi
tion
and
diversificationof
expo
rts
1)
Cre
ate
Ken
yan
bra
nd fo
r so
me
of t
he k
ey e
xpo
rt c
om
mo
diti
es s
uch
as te
a an
d c
offe
e.2)Targetedforeigndirectinvestment(FDI)campaignsinspecificcountriestargetingspecific
manufacturers.Forexam
plepursuingToyotaCompanyinJapantosetupanassemblyplantin
Ken
ya.
3)
Ho
ld s
ensi
tizat
ion
sem
inar
s to
po
tent
ial
exp
ort
ers
on
mar
ket
acce
ss a
nd p
rod
ucts
tha
t ca
n benefitfromtheAGOAandEPAtradeschemes.
4)Promoteim
plementationofexportorientedinvestmentsinSEZsespeciallythosewithstrong
backwardandforwardlinkageswiththeKenyaneconomy.
3.
Pro-
indu
stry
pol
icy
and
inst
itutio
nal f
ram
ewor
ka)
Pre
dict
able
and
sta
ble
indu
stria
l pol
icie
s de
velo
ped
thro
ugh
in
dust
ry c
onsu
ltatio
ns
1)
Enac
t a n
atio
nal p
olic
y o
n p
ublic
par
ticip
atio
n.2)Ensureformulationofoverarchingpoliciesbeforeanenactmentoflaws.
b) N
atio
nal p
olic
y an
d in
stitu
tiona
l coh
eren
ce
for t
he m
anuf
actu
ring
sect
or
1)Developandim
plementanationalm
anufacturingpolicy.
2)Review,andrationalizetherolesofvariousregulatorybodiesinthemanufacturingsector.
c) M
anuf
actu
ring
sect
or
deliv
ery
unit
1)Identificationofmanufacturingsectorflagshipprojectsguidedbytheproposednational
manufacturingpolicytobecoordinatedunderthePresidentialDeliveryUnit.
MANUFACTURING PRIORITY AGENDA (MPA) 452018
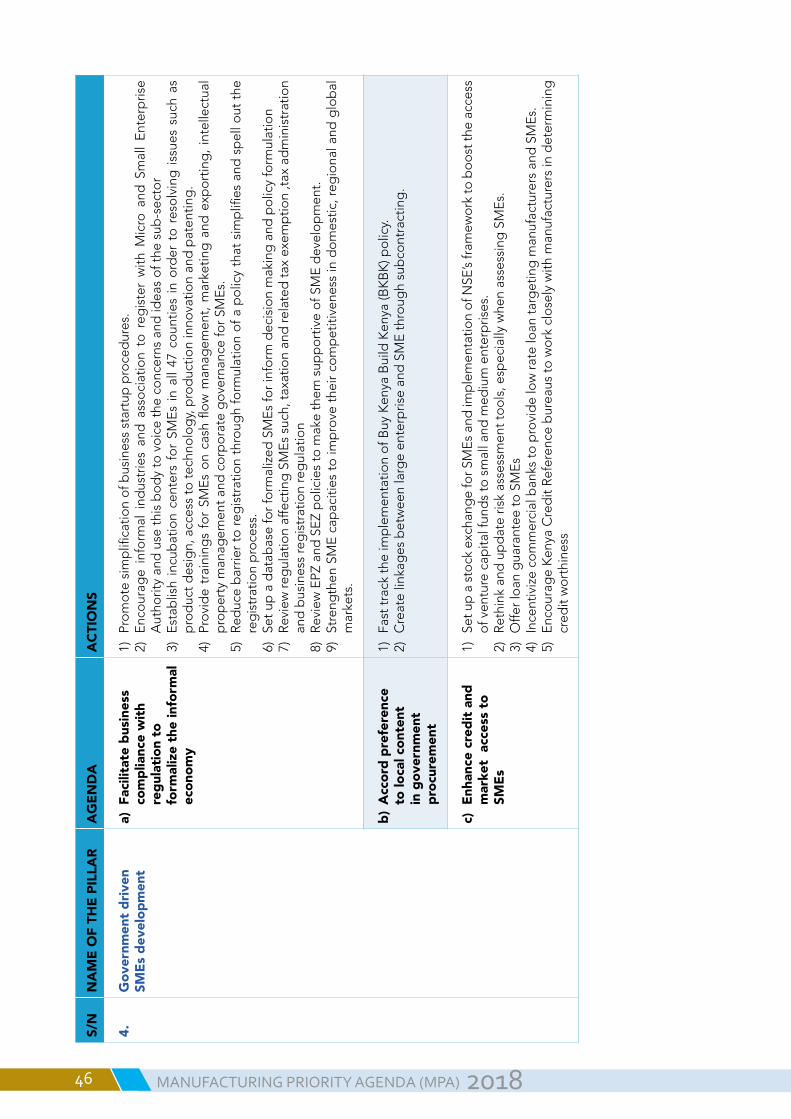
S/N
NA
ME
OF
THE
PILL
AR
AG
END
AA
CTIO
NS
4.
Gov
ernm
ent d
riven
SM
Es d
evel
opm
ent
a) F
acili
tate
bus
ines
s co
mpl
ianc
e w
ith
regu
latio
n to
fo
rmal
ize
the
info
rmal
ec
onom
y
1)Promotesimplificationofbusinessstartupprocedures.
2)EncourageinformalindustriesandassociationtoregisterwithM
icroandSmallEnterprise
Aut
horit
y an
d u
se t
his
bo
dy
to v
oic
e th
e co
ncer
ns a
nd id
eas
of t
he s
ub-s
ecto
r3)EstablishincubationcentersforSM
Esinall47countiesinordertoresolvingissuessuchas
productdesign,accesstotechnology,productioninnovationandpatenting.
4)ProvidetrainingsforSM
Esoncashflowmanagem
ent,marketingandexporting,intellectual
propertymanagem
entandcorporategovernanceforSMEs.
5)Reducebarriertoregistrationthroughformulationofapolicythatsimplifiesandspelloutthe
registrationprocess.
6)SetupadatabaseforformalizedSMEsforinformdecisionmakingandpolicyformulation
7)ReviewregulationaffectingSMEssuch,taxationandrelatedtaxexemption,taxadministration
andbusinessregistrationregulation
8)ReviewEPZandSEZpoliciestomakethem
supportiveofSMEdevelopment.
9)StrengthenSMEcapacitiestoim
provetheircompetitivenessindomestic,regionalandglobal
mar
kets
.
b) A
ccor
d pr
efer
ence
to
loca
l con
tent
in
gov
ernm
ent
proc
urem
ent
1)FasttracktheimplementationofBuyKenyaBuildKenya(BKBK)policy.
2)CreatelinkagesbetweenlargeenterpriseandSMEthroughsubcontracting.
c) E
nhan
ce c
redi
t and
m
arke
t ac
cess
to
SMEs
1)SetupastockexchangeforSMEsandimplementationofNSE’sfram
eworktoboosttheaccess
of v
entu
re c
apita
l fun
ds
to s
mal
l and
med
ium
ent
erp
rises
.2)Rethinkandupdateriskassessmenttools,especiallywhenassessingSMEs.
3)OfferloanguaranteetoSMEs
4)IncentivizecommercialbankstoprovidelowrateloantargetingmanufacturersandSMEs.
5)EncourageKenyaCreditReferencebureaustoworkcloselywithmanufacturersindetermining
creditworthiness
MANUFACTURING PRIORITY AGENDA (MPA)46 2018

S/N
NA
ME
OF
THE
PILL
AR
AG
END
AA
CTIO
NS
5.Se
curin
g th
e fu
ture
of
man
ufac
turin
g In
dust
rya)
Gre
en g
row
th
and
sust
aina
ble
deve
lopm
ent
1)Incentivizeindustriesexcellinginenergymanagem
entthroughnationalaward
2)Promoteself-regulationform
anufacturersonenvironm
entalissues
3)Applyforthegreenclim
atechangefund
4)FinalizeandenacttheNationalW
asteManagem
entBill2017
5)Supportthefinalizationandim
plementationoftheNationalW
aterPolicy
6)Promoteindustrysymbiosistoencouragegreeneconomyandcreatenewcultureofeconomic
growth
7)Promoteandrecognizethecertificationmarkforresponsiblecare
b) I
ndus
try
4.0
1)Developanationalpolicyframeworkandprogrammetoimplem
entindustry4.0withsectoralbias.
c) P
ro-in
dust
ry s
kill
deve
lopm
ent
1)Introducesubsidizedapprenticeshipprogrammeandprovidetaxholidaysforcompanies
takingupinterns.
2)DevelopmentandimplementationofSectorSkillsAdvisoryCommittees(SSACs)thatwillguide
inthedevelopmentofoccupationstandardstoinfluencecurriculum
development.
3)ReviewthePublicServiceCommissionInternshipPolicyandGuidelinesforthePublicService
(2016)toaccommodateTVETgraduatesinterns.
4)PopularizeandstrengthenTVETeducationandtrainingthroughNationalTVETconferences
andskillsshows.
5)Establishjobmatchingdatabasetolinktheemployersandemployees.
6)
Stre
ngth
en th
e lin
ks b
etw
een
indu
stry
and
aca
dem
ic in
stitu
tions
thro
ugh
rese
arch
.
d) E
nhan
ce a
cces
s to
la
nd1)Proactivelycreatelandbanksearmarkedforindustryatcountyandnationallevelsofgovernment
perhapsthroughinstitutionssuchasKIE.
2)Advocateforspeedydigitizationoflandregistry.
3)PromptissuanceoftitledeedsincludingforSMEs
.
e) F
it fo
r pur
pose
pub
lic
serv
ice
1)Replacecash-basedaccountingsystemwithaccrual-basedaccountingsysteminpublicfinance.
2)Strengtheningperformancecontractingenhancepublicservicedelivery.
3)InitiateanannualPresidentialeventtorecognizetopperformingpublicinstitutionsandpublic
serv
ants
. 4)De-pegthepieceratefromminimum
wagetoencouragelabourproductivity.
f) St
able
pol
itica
l en
viro
nmen
t1)
A
dd
ress
the
roo
t cau
se o
f po
litic
al c
risis
tha
t eru
pts
in a
n el
ectio
n ye
ar.
2)
Nat
iona
l deb
ate
on
po
litic
al c
ohe
sio
n
MANUFACTURING PRIORITY AGENDA (MPA) 472018

Anne
x 2: K
enya
n ba
lance
of t
rade
(Bot
) 201
0-20
16 -
Kshs
. “00
0”
20
1020
1120
1220
1320
1420
1520
16
Bala
nce
of T
rade
(537
,412
)(7
88,1
45)
(85
6,74
0)(9
11,0
29)
(1,
081,
085)
(996
,532
)(8
53,6
78)
Tota
l Exp
orts
40
9,79
451
2,60
45,
17,8
4750
2,28
753
7,23
658
1,04
5 5
78,0
67
Tota
l Im
port
s94
7,20
61,
300,
749
1,37
4,58
71,
413,
316
1,61
8,32
11,
577,
577
1,43
1,74
5
Cove
r rat
io (%
)43
.26
39.4
137.67
35.5
433
.20
36.8
340.37
Dat
a so
urce
: KN
BS,
201
7
MANUFACTURING PRIORITY AGENDA (MPA)48 2018

Anne
x 3: K
enya
n ex
port
and
impo
rts to
and
from
EAC
coun
tries
(201
0-20
16) -
Ksh
s. “0
00”
Cou
ntry
20
1020
1120
1220
1320
1420
1520
16
Tan
zani
a 33
,211
,132
41,743,395
46,0
36,1
63
40,4
96,4
93
42,724,911
33,6
63,3
96
34,796,571
Uganda
52,108,047
75,953,923
67,450,115
65,361,907
60,782,664
68,573,904
62,1
63,3
83
Rwanda
10,5
35,1
64
13,5
53,5
58
16,1
51,3
63
13,4
99,6
95
14,4
40,8
44
17,949,831
17,499,630
Bur
und
i 5,458,274
5,903,760
5,308,763
5,59
8,95
6 7,849,463
6,59
4,98
3 7,242,223
To
tal E
xpo
rt to
EA
C
101,312,617
137,154,636
134,
946,
404
124,957,051
125,797,882
126,782,114
121,701,807
Dat
a so
urce
: KN
BS,
201
7
MANUFACTURING PRIORITY AGENDA (MPA) 492018

REFERENCES
All-Party Parliamentary Small Business Group (2009). Report on SMEs access to public procurement. London: Prentice Hall Inc.
Antonopoulos et al, (2009), ‘ThehiddenenterpriseofbootleggingcigarettesoutofGreece: twoschemesofillegalentrepreneurship’,JournalofSmallBusinessandEntrepreneurship,22(1),1-8.
Baissac,C.(2011).BriefHistoryofSEZsandOverviewofPolicyDebates.In:Farole,T(Ed),SpecialEconomicZonesinAfrica:ComparingPerformanceandLearningfromGlobalExperience.TheWorld Bank, Washington DC. Available: https://openknowledge.worldbank.org/bitstream/handle/10986/2268/600590PUB0ID181onomic09780821386385.pdf?sequence=1.
Bivens,J.(2003).UpdatedemploymentmultipliersfortheUSeconomy.EconomicPolicyInstitute,WorkingPaperNo.268.
Ease of doing business report (2018). Available : http://www.doingbusiness.org/~/media/WBG/DoingBusiness/Documents/Annual-Reports/English/DB2018-Full-Report.pdf
EastAfricanCommunityGazette(30thJune,2017)
GovernmentofKenya(2017).BuyKenya-BuildKenyaStrategy.GovernmentPrinters,Nairobi,Kenya.
Government of Kenya (2005). Sessional paper No.2 of 2005 on Development of Micro and small enterprises forwealthandemploymentcreation forpoverty reduction.GovernmentprinterNairobi.
Isaya Maana et al, (2008). Domestic Debt and its Impact on the Economy: the Case of Kenya.
ILO(2014).TradeUnionManualonExportProcessingZones.Available:http://www.ilo.org/wcmsp5/groups/public/---ed_dialogue/---actrav/documents/publication/wcms_324632.pdf.
KAM(2017).TenpolicypriorityfortransformingmanufacturingandcreatingjobsinKenya.
KAM(2017).AstudyonintellectualpropertyrightsregimewithintheEastAfricanCommunityreport.
KAM(2013).AstudyontheimpactofcounterfeitinginKenya.
Kenya Community Land Act (2016).
KNBS(2017).EconomicSurvey,2017.
Kenya Roads Board (2016). Annual report.
Kenya Industrial Water Alliance (2016). Industrial water report.
KIPPRA (2017). Kenya Economic Report 2017: Sustaining Kenya’s economic development by deepening and expanding economic integration in the region.
National Land Policy (2009).
MANUFACTURING PRIORITY AGENDA (MPA)50 2018

Newman et al, (2016). Made in Africa: Learning to compete in industry. Washington, DC: Brookings Institution Press.
OECD (2011). OECD Work on Sustainable Development.
Afande, O (2015). Constraints to Small and micro enterprises’ participation in public procurement in Kenya
Page, J (2016). Transforming Kenyan industry: An issues paper. Supporting Economic Transformation.
Shipper Council of Eastern Africa (2015). The logistics performance survey.
Tyson J. (2015). Sub-Saharan Africa and international equity: policy approaches to enhancing its role in economic development. ODI working paper 424. London: Overseas Development Institute. (https:// www.odi.org/sites/odi.org.uk/files/odi-assets/publications-opinion-files/9880.pdf)
UNIDO (2009). Industrial Development Report, 2009. Vienna, Austria.
World Bank (2008). Special economic zones performance, lessons learned, and implications for zone development. The World Bank, Washington DC..
World Bank (2014). Enterprise surveys : Kenya country highlights 2013. Enterprise surveys country highlights. Washington, DC : World Bank Group. http://documents.worldbank.org/curated/en/141781468048839839/Enterprise-surveys-Kenya-country-highlights-2013
Were, A. (2016). Manufacturing in Kenya: Features, challenges and opportunities. A scoping exercise. Supporting Economic Transformation.
World Bank (1993). The East Asian miracle: Economic growth and public policy. New York: Oxford University Press.
World Bank (2017). Ease of doing business.
World Bank (2018). Global-Economic-Prospects Sub-Saharan-Africa-analysis.pdf
MANUFACTURING PRIORITY AGENDA (MPA) 512018

52

Who we areEstablishedin1959,KenyaAssociationofManufacturers(KAM)isthelargestmanufacturingassociationinKenyarepresentingsmallandlargemanufacturersalikeineveryindustrialsector.KAMistheconsistentvoiceofthesectorandtheleadingadvocateforapolicyagendathathelpsmanufacturerstocreatejobsandcompetebothwithinKenya,regionallyandglobally.
Our VisionTobeaworldclassbusinessmembershiporganisationeffectivelydeliveringservicestoitsmemberswherevertheyoperate
Our MissionTopromotecompetitivelocalmanufacturinginaliberalisedmarket
©2018.AllRightsReservedA publication of the Kenya Association of Manufacturers (KAM)

Kenya Association of Manufacturers15 Mwanzi Road, WestlandsBox 30225 – 00100, NairobiKenya
Phone: +254 (020)2324817,(20)2166657Fax: +254 (020)3200030www.kam.co.keTwitter: @KAM_kenyaFacebook: www.facebook.com/KenyaAssociationOfManufacturers