manufacturing outlook 2013 - uhy-us.com · • download a copy of the powerpoint presentation ......
TRANSCRIPT
MANUFACTURING OUTLOOK 2013

WELCOME
2
Opening commentary
AGENDA
3
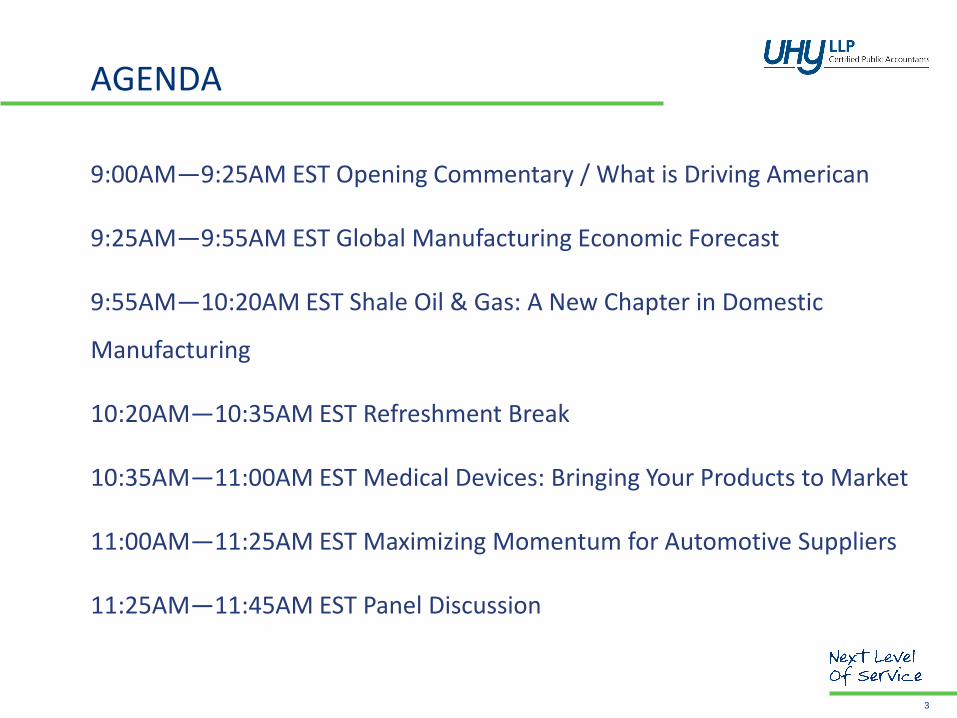
9:00AM—9:25AM EST Opening Commentary / What is Driving American
9:25AM—9:55AM EST Global Manufacturing Economic Forecast
9:55AM—10:20AM EST Shale Oil & Gas: A New Chapter in Domestic
Manufacturing
10:20AM—10:35AM EST Refreshment Break
10:35AM—11:00AM EST Medical Devices: Bringing Your Products to Market
11:00AM—11:25AM EST Maximizing Momentum for Automotive Suppliers
11:25AM—11:45AM EST Panel Discussion

ATTENDEE CHECKLIST
4
CPE materials • On-site: pick up at the registration desk (sign in, complete/return
evaluation form, pick up certificate) • On-line: email us
Feedback (forms in attendee booklet) Questions
• On-site: fill out question cards (we will collect later) • On-line: click the link to email your questions
Keep a look out for a post-event email
• Download a copy of the PowerPoint presentation • Link to view the webcast video
Pre-register for 2013 (2014 Outlook)
Get on our Manufacturing Insider mailing list

ABOUT UHY LLP
National Facts
• 15 offices across the U.S.
• More than 1,000 employees
• Ranked one of the Top 25 professional services firms by Accounting Today
• Reviewed by the PCAOB on a regular basis and received outstanding results
International Facts
• UHYI established in 1986 and based in London, UK
• Member firms in more than 250 cities in over 81 countries
• More than 6,800 member firm employees
• Ranked among the Top 25 largest international accounting and consultancy networks (by fee income)
Manufacturing Practice • Aerospace & Defence
• Automotive
• Consumer Products
• Distribution
• Industrials

U.S LOCATIONS
6
GEORGIA
ATLANTA
Five Concourse Parkway
Suite 2450
Atlanta, GA 30328
Telephone: 678-602-4400
Fax: 678-602-4300
ILLINOIS
CHICAGO
30 S. Wacker Dr.
Suite 1330
Chicago, IL 60606
Telephone: 312-578-9600
Fax: 312-346-6500
MARYLAND
COLUMBIA
6851 Oak Hall Lane
Suite 300
Columbia, MD 21045
Telephone: 410-720-5220
Fax: 410-381-2524
MICHIGAN
Metropolitan Detroit
FARMINGTON HILLS
27725 Stansbury Boulevard
Suite 200
Farmington Hills, MI 48334
Telephone: 248-355-1040
Fax: 248-355-1084
STERLING HEIGHTS
12900 Hall Road
Suite 500
Sterling Heights, MI 48313
Telephone: 586-254-1040
Fax: 586-254-1805
MISSOURI
ST. LOUIS
15 Sunnen Drive
Suite 100
St. Louis, MO 63143
Telephone: 314-615-1200
Fax: 314-647-8304
NEW JERSEY
OAKLAND
153 Bauer Drive
Oakland, NJ 07436
Telephone: 201-337-0009
Fax: 201-337-4462
NEW YORK
ALBANY
66 South Pearl Street
Suite 400
Albany, NY 12207
Telephone: 518-449-3166
Fax: 518-449-5832
NEW YORK
UHY Advisors NY, Inc.
19 West 44th Street
New York, NY 10036
Telephone: 212-381-4700
Fax: 212-354-6445
-and-
UHY Advisors FLVS, Inc.
19 West 44th Street
New York, NY 10036
Telephone: 646-746-1120
WHITE PLAINS
800 Westchester Avenue
Suite North 641
Rye Brook, NY 10573
Telephone: 914-697-4954
Fax: 914-697-7583
TEXAS
DALLAS
1717 Main, Suite 2400
Dallas, TX 75201
Telephone: 214-243-2900
Fax: 214-243-2929
HOUSTON
UHY Advisors TX, LLC
12 Greenway Plaza, Suite
200
Houston, TX 77046
Telephone: 713-960-1706
Toll-free: 800-949-1706
Fax: 713-960-9549
-and-
UHY Advisors SALT, LLC
3555 Timmons, Suite 1100
Houston, TX 77027
Telephone: 713-548-0900
Fax: 713-407-3760
WASHINGTON D.C.
WASHINGTON
1325 G Street NW
Suite 500
Washington, D.C. 20005
Telephone: 202-609-6100

GLOBAL NETWORK
7
Taiwan
Vietnam
Europe
Albania
Austria
Belarus
Belgium
Bulgaria
Czech Republic
Croatia
Cyprus
Denmark
Estonia
Finland
France
Germany
Greece
Guernsey
Hungary
Ireland
Isle of Man
Italy
Latvia
Lithuania
Luxembourg
Malta
Netherlands
Norway
Poland
Portugal
Romania
Russian Federation
Slovakia
Slovenia
Spain
Sweden
Switzerland
Turkey
Ukraine
United Kingdom
Middle East & Africa
Azerbaijan
Angola
Bahrain
Egypt
Israel
Jordan
Kenya
Republic of Kuwait
Lebanon
Mauritius
Morocco
Nigeria
South Africa
Tunisia
UAE
Americas
Argentina
Brazil
Canada
Chile
Colombia
Dominican Republic
Ecuador
El Salvador
Jamaica
Guatemala
Mexico
Peru
Puerto Rico
United States
Uruguay
Venezuela
Asia-Pacific
Australia
Bangladesh
China (inc Hong Kong)
India
Indonesia
Kazakhstan
Japan
Korea (Rep. of)
Malaysia
New Zealand
Pakistan
Singapore
UHY International
Member Offices

8
Every morning in the Savannah…
HUNTED

9
Every morning in the Savannah…
HUNTER

Highlights From UHY’s 2012 Outlook (November, 2011) Thomas Alongi Partner & National Manufacturing Practice Leader UHY LLP
MANUFACTURING OUTLOOK 2013
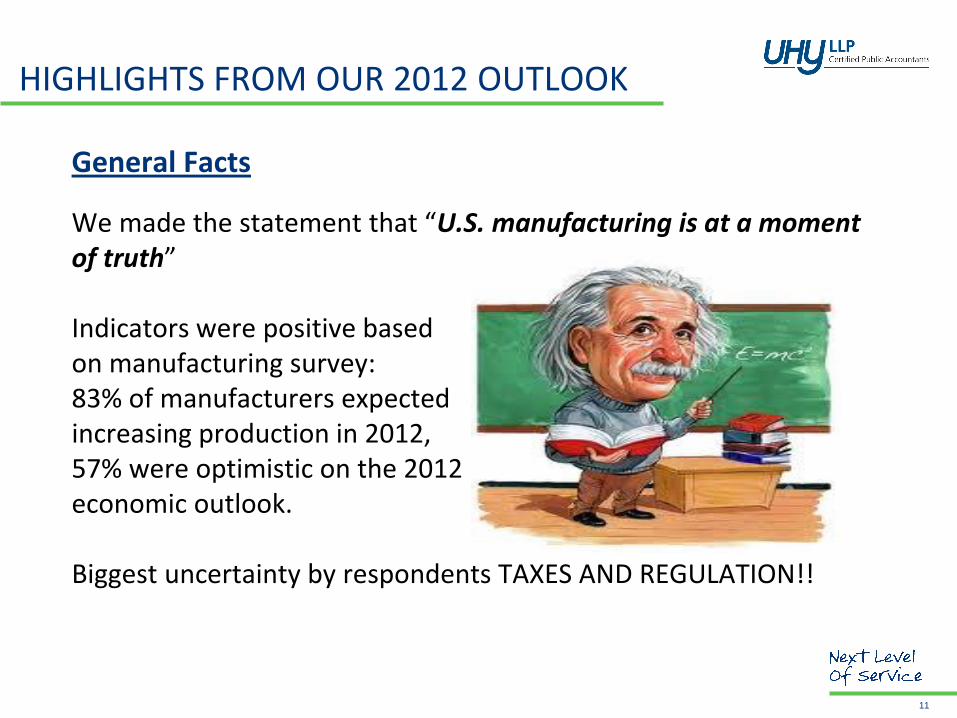
General Facts
We made the statement that “U.S. manufacturing is at a moment of truth” Indicators were positive based on manufacturing survey: 83% of manufacturers expected increasing production in 2012, 57% were optimistic on the 2012 economic outlook. Biggest uncertainty by respondents TAXES AND REGULATION!!
HIGHLIGHTS FROM OUR 2012 OUTLOOK
11

HIGHLIGHTS FROM OUR 2012 OUTLOOK
12
M&A “Market should continue to improve for sellers in 2012, even with the U.S. experiencing sluggish growth in the 3% range.”
- UHY November 2011
0
100
200
300
400
500
600
Q1 Q2 Q3 Q4 Q1 Q2 Q3 Q4 Q1 Q2 Q3 Q4 Q1 Q2
2009 2010 2011 2012
Number of Private Equity Deals
Source: The Private Equity 3Q 2012 Breakdown; PitchBook.com
Source: Thompson Financial
5.2
7.3 7.6 8.5
0.0
2.5
5.0
7.5
10.0
2009 2010 2011 2012
U.S. Middle Market Value to EBITDA Multiple (Less Then $500M)

HIGHLIGHTS FROM OUR 2012 OUTLOOK
13
M&A “Lots of cash on the sidelines that must be put to work in 2012.”
- UHY November 2011
$1,200
$1,300
$1,400
$1,500
$1,600
$1,700
$1,800
2007 2008 2009 2010 Q1 Q2 Q3 Q4 Q1 Q2
2011 2012
Sideline Cash (Billions of Dollars)
Source: Federal Reserve; federalreserve.gov

HIGHLIGHTS FROM OUR 2012 OUTLOOK
14
Global Markets “Opportunities abound in oversees markets with continued growth
in the BRIC countries.” - UHY November 2011
0.0%
2.0%
4.0%
6.0%
8.0%
10.0%
12.0%
Brazil Russia India China
Real GDP Forecast for BRIC Economies
2010 2011E 2012FSource: IBGE, Russian Federal State Statistics Service, Indian Central Statistical Organization, National Bureau of Statistics of China; estimates (E) and forecasts (F)

HIGHLIGHTS FROM OUR 2012 OUTLOOK
15
Automotive “Build where you sell” OEM directive will continue to help U.S.
suppliers.” - UHY November 2011
“Several years ago companies thought they could supply the whole world from facilities in China. Now, suppliers are being told by the Big Three automakers and original equipment manufacturers that they have to have operations in the United States if they want to be in the American marketplace.” - October 5, 2012 article Mellisa Anders

HIGHLIGHTS FROM OUR 2012 OUTLOOK
16
Automotive “Operational efficiency will become a greater concern with rising
production demand.” - UHY November 2011
Based on U.S. Federal Reserve data, suppliers are running at 78 percent capacity utilization as of August 2012. To meet production demand of approximately 14 million units many suppliers are running overtime, incurring shortages of materials and expedited freight costs.
78.5%
75.0%
64.6%
68.6%
72.5% 74.8%
78.0%
60%
65%
70%
75%
80%
85%
2008 2009 2010 2011 2012
Industrial Manufacturing Production and Capacity Utilization

What is Driving American Manufacturing? Thomas Alongi Partner & National Manufacturing Practice Leader UHY LLP
MANUFACTURING OUTLOOK 2013

WHY AMERICAN MANUFACTURING IS IMPORTANT?
18
• Difficult to balance trade - Manufacturing accounts for 86% of U.S. goods exported
• Manufacturing accounts for 72% of all R&D spending
• Manufacturing employs 63% of all domestic scientist and engineers
• Each manufacturing Job supports as an average 2.9 other jobs in the economy
• Vital to long term national security
Source: ITIF (information Technology & Innovation Foundation)

IN THE NEWS
19

WHAT’S DRIVING AMERICAN MANUFACTURING?
20
Currency Exchange
-20%
-10%
0%
10%
20%
30%
40%
50%
2008 2009 2010 2011 2012
BRIC Countries Percent Change in Exchange Rate to USD
Brazilian Real Russian Ruble Indian Rupee Chinese Yuan
-40%
-30%
-20%
-10%
0%
10%
20%
30%
2008 2009 2010 2011 2012
Euro and Yen Percent Change in Exchange Rate to USD
Euro Japanese Yen

WHAT’S DRIVING AMERICAN MANUFACTURING?
21
Rising Global Supply Chain Costs • Rising foreign labor costs
• Transportation costs
• Energy costs
• Carrying inventory really does cost money

WHAT’S DRIVING AMERICAN MANUFACTURING?
22
Developing Foreign Markets (BRIC)
• Increased demand = Increased production = Rising labor costs = Rising standard of living
• Manufacturing in foreign markets now is more strategic than just a means to export to developed markets like the U.S.

WHAT’S DRIVING AMERICAN MANUFACTURING?
23
Foreign Politics/Regulations

WHAT’S DRIVING AMERICAN MANUFACTURING?
24
Lower Cost of Capital and Investment • Currently a low interest rate environment • Depressed commercial real estate • State and local tax incentives

CHALLENGES TO SUSTAINING AMERICAN MANUFACTURING?
25
• Combating foreign currency manipulation
• Increasing U.S. regulations and related costs
• Keeping attention focused on manufacturing
• Foreign trade policies
• Training skilled labor for tomorrow’s manufacturing jobs

ACTION PLAN TO SUSTAINABLE AMERICAN MANUFACTURING
26
• Reduced corporate tax rate
• Government policies to support more fair free trade
• Fund low skilled and high skilled manufacturing labor programs
• Make R&D credit permanent
• Tax credits to support investments in new equipment
• Federal government must place a strategic focus
on the manufacturing sector

DEVELOPING A GROWTH STRATEGY
27
You Need to Establish A
Business Strategy To
Take Advantage of Reshoring/ Backshoring
Opportunities
#1 • Strategy – Product & Market Position
#2 • Understand the Market Landscape
#3 • Assess Your Operations
#4 • Understand Financial & Cost Constraints
#5 • Mobilize – Prepare Processes & Personnel
#6 • Launch and Form Strategic Relationships

DEVELOPING A GROWTH STRATEGY
28
Confirm your Business Direction, Purpose & Scope: • Where is our industry in the market growth curve and can we still make
a profit?
• What innovative changes have/are occurring in our industry?
• Which Customers and Products drive our economic engine?
• Which Customers and Products drive our bottom line expenses?
• What are the emerging industry sectors and what opportunities are there that fit our capabilities?

UNDERSTAND MARKET LANDSCAPE
29

MARKETING STRATEGIES
30
• There are a variety of methodologies, tools and approaches • The most successful approaches include the following:
1. Analysis of your business operations – SWOT
2. Analysis of VERTICAL and HORIZONTAL
market expansion strategies
3. CURRENT Market Analysis
4. COMPETITIVE Market Analysis
5. TARGET Market(s) Research and Analysis
6. Identification, development and introduction of INNOVATIVE Products/Solutions for Market Growth

RESOURCES
31
Identify online opportunities to introduce your company, your capabilities, strengthens, etc. Examples:
• On-Line Customer / Supplier Bid Sites for Manufacturing www.mfg.com/en/ www.custompartsonline.com/ www.tobidit.com/ www.contractauction.com/ www.sourceauthority.com/
• Aerospace Suppliers http://www.aerospacesuppliers.com/
• Economic and Area Development http://www.areadevelopment.com/BusinessGlobalization/directory2011/us-companies-reshoring-operations62239.shtml

CONTACT INFORMATION
32
Thomas Alongi, CMA, CPA Partner & National Manufacturing
Practice Leader UHY LLP
586 843 2581
Global Manufacturing Economic Outlook James F. Peters, Jr. Chief Executive Officer Tactical Allocation Group, LLC
MANUFACTURING OUTLOOK 2013

ABOUT TAG
34

WHAT WE DO
35
The founders of Tactical Allocations Group, LLC (“TAG”) began their Proactive Investment Management style for fixed income investments in 1988. TAG’s “total return” approach sought to capture the value added from fixed income principal changes. Today, TAG applies their proactive investment management across more than 30 asset classes globally in TAG’s Tactical Portfolios. TAG’s portfolios are built exclusively with asset class specific, exchange-traded products to capture the full impact of their tactical allocation decisions.

TACTICAL ASSET ALLOCATION
36
Price and value often diverge, creating opportunity. Tactical Asset Allocation is a dynamic investment management style that adjusts asset allocations to TAG’s forward view of the relative risks and returns of various asset classes. This is distinguished from Strategic Asset Allocation, a mechanical, passive process of rebalancing the portfolios back to their original allocations; the weakness of this approach is its failure to allow for new information.

A TACTICAL WORLD
37
BUSINESSES OPERATE IN A TACTICAL WORLD • Businesses are ever evolving
• Businesses adjust to benefit from new opportunities
• Portfolios must adjust to benefit from new opportunities

EUROPE GLOBAL DRAG
38

MASSIVE DEBT BURDEN
39
$10
$14
$15
$31
$122
$200
$204
$243
$279
$287
$419
$1,272
$2,176
Austria
Denmark
Netherlands
Cyprus
Belgium
Ireland
U.K
Greece
Portugal
Germany
France
Italy
Spain
Source: www.zerohedge.com, TAG
Data as of December 31, 2011
Debt (in Trillions)

MASSIVE DEBT BURDEN
40 Source: Bloomberg Finance, L.P., IMF, TAG
-5% 15% 35% 55% 75% 95% 115% 135% 155% 175%
Swiss
Netherlands
Cyprus
Spain
Austria
Germany
United Kingdom
France
Belgum
Ireland
Portugal
Italy
Greece
100%
82%
74%
66%
65%
52%
162%
120%
108%
105%
85%
85%
68%
Data as of December 31, 2011
Debt as Percent of GDP

REFINANCING CLIFF
41 Source: Bloomberg Finance, L.P., TAG
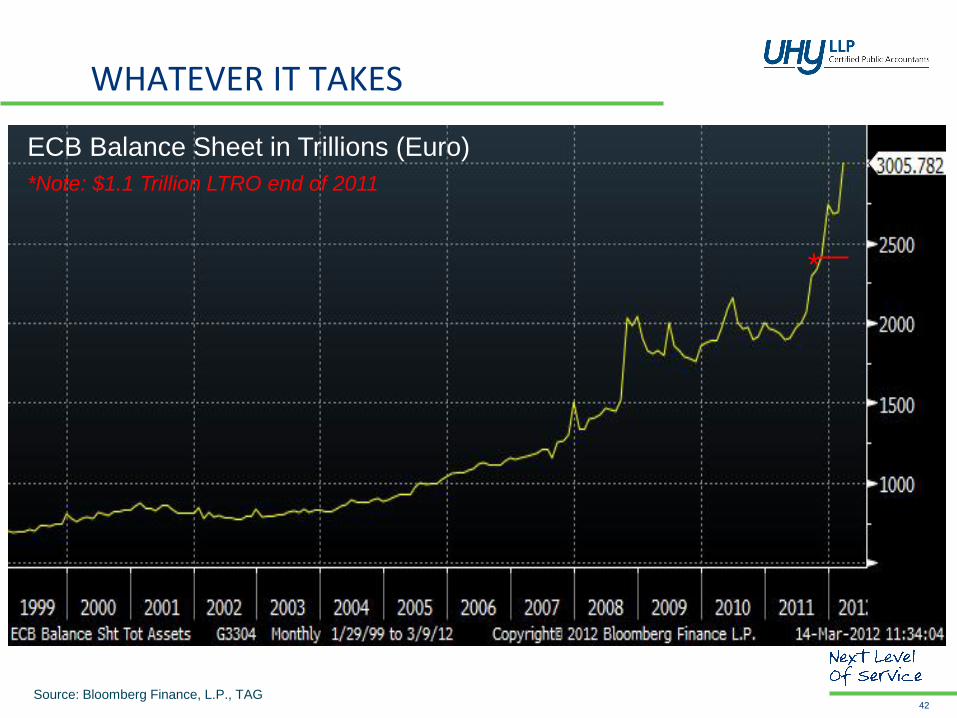
WHATEVER IT TAKES
42 Source: Bloomberg Finance, L.P., TAG
ECB Balance Sheet in Trillions (Euro)
*Note: $1.1 Trillion LTRO end of 2011
*

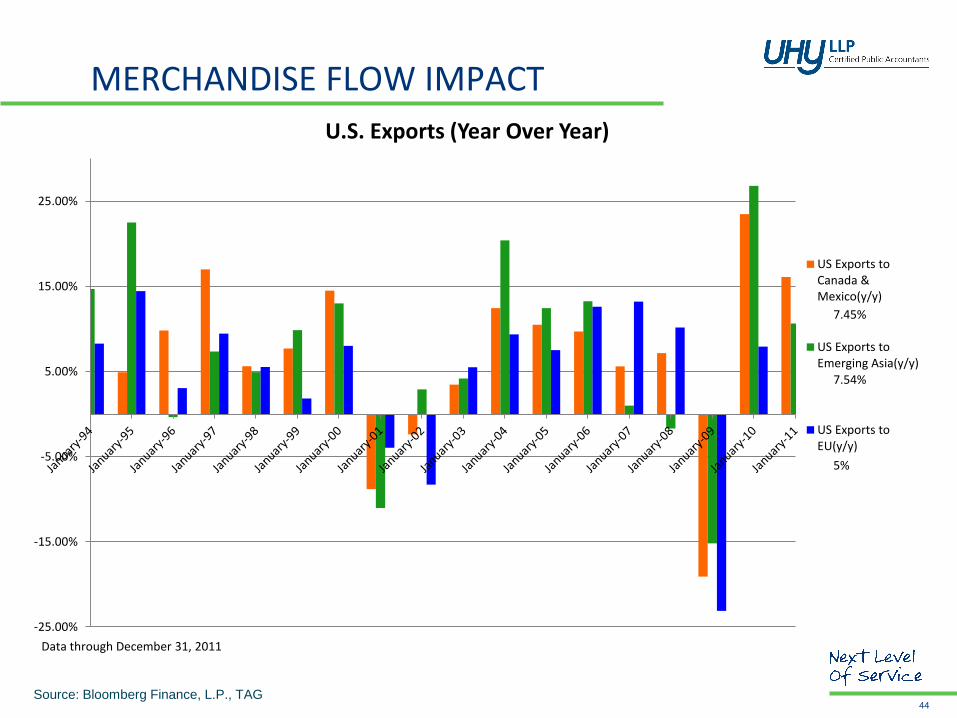
MERCHANDISE FLOW IMPACT
43 Source: Bloomberg Finance, L.P., TAG
5000
10000
15000
20000
25000
30000
35000
40000
45000
50000
US Exports toCanada &Mexico($m)
US Exports toEmerging Asia($m)
US Exports toEU($m)
22%
Data through August 31, 2012
23%
21%
U.S. Exports
In M
illio
ns
($)
MERCHANDISE FLOW IMPACT
44 Source: Bloomberg Finance, L.P., TAG
Data through December 31, 2011
-25.00%
-15.00%
-5.00%
5.00%
15.00%
25.00%
US Exports toCanada &Mexico(y/y)
US Exports toEmerging Asia(y/y)
US Exports toEU(y/y)
7.45%
5%
7.54%
U.S. Exports (Year Over Year)

CAPITAL FLOW IMPACT
45 Source: Bloomberg Finance, L.P., TAG
115,000.00
135,000.00
155,000.00
175,000.00
195,000.00
215,000.00
-40.00
-30.00
-20.00
-10.00
0.00
10.00
20.00
30.00
40.00
U.S. Capital Expenditures with Year Over Year Overlay
CapEx y/y (%) Capital Expenditures
y/y => "Negative"
y/y =>"Positive"

CAPITAL FLOW IMPACT
46 Source: Bloomberg Finance, L.P., TAG

CAPITAL FLOW IMPACT
47 Source: Bloomberg Finance, L.P., TAG

FOREIGN DIRECT INVESTMENT
48 Source: Bloomberg Finance, L.P., TAG

EMERGING EUROPE HOPE
49 Source: Bloomberg Finance, L.P., TAG
0
5000
10000
15000
20000
25000
30000
Russia FDI($m)
Turkey FDI($m)
Poland FDI ($m)
Czech FDI($m)
Foreign Direct Investment

GREAT CHINA DEBATE
50

GDP ACTUAL/PROJECTED
51 Source: CEIC, Xininua News, HSBC, TAG
0
2
4
6
8
10
12
14
16
2004 2005 2006 2007 2008 2009 2010 2011 2012e
Target
Actual
Perc
en
t
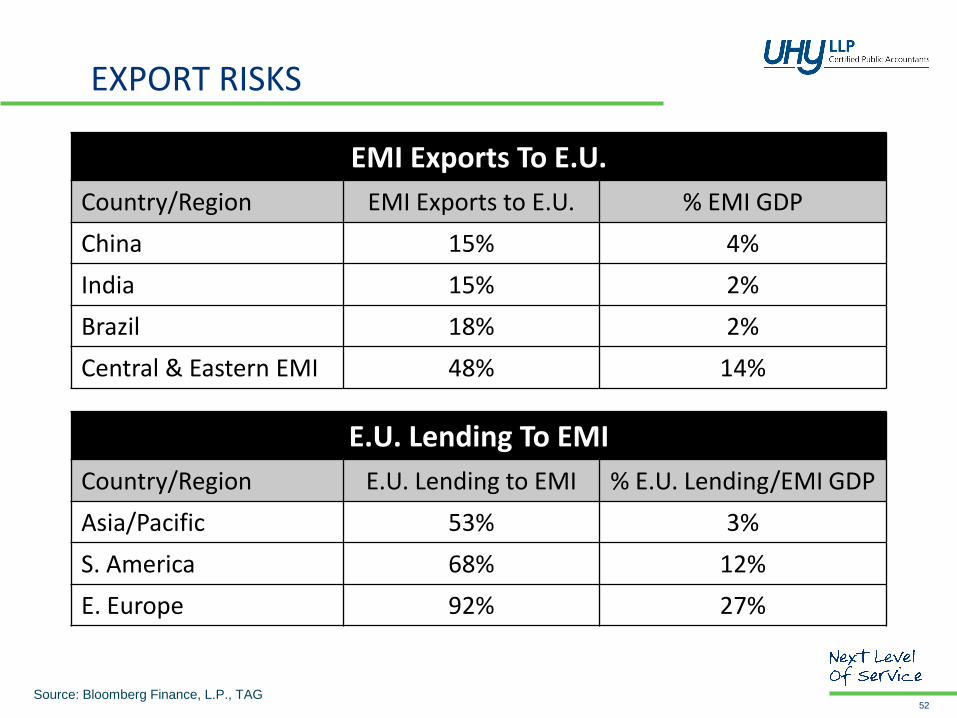
EXPORT RISKS
52 Source: Bloomberg Finance, L.P., TAG
EMI Exports To E.U.
Country/Region EMI Exports to E.U. % EMI GDP
China 15% 4%
India 15% 2%
Brazil 18% 2%
Central & Eastern EMI 48% 14%
E.U. Lending To EMI
Country/Region E.U. Lending to EMI % E.U. Lending/EMI GDP
Asia/Pacific 53% 3%
S. America 68% 12%
E. Europe 92% 27%

MONETARY EASING
53 Source: Bloomberg Finance, L.P., TAG
5
7
9
11
13
15
17
19
21
China (Reserve Requirement "RRR")
Red Dot = Projected Additional 200 Basis Point Reduction

FISCAL STIMULUS
54
1. Infrastructure Pull Forward
2. SME Tax Reform
3. Expanded Foreign Direct Investment (FDI)

CAPACITY TO STIMULATE
55
Source: *IMF
**Includes China, Brazil, India, Russia, Korea, South Africa, Mexico and Taiwan
Chart Source: BCA Research

MARKET DOESN’T BELIEVE
56 Source: http://www.zerohedge.com/sites/default/files/images/user3303/imageroot/2012/08/20120815_ms1.png

WILL ECONOMY HOLD?
57

MANUFACTURING SLOWING
58 Source: Bloomberg Finance, L.P., TAG
10.00
20.00
30.00
40.00
50.00
60.00
70.00
80.00
90.00
100.00
110.00
-15.00
-10.00
-5.00
0.00
5.00
10.00
15.00
20.00
25.00
30.00
Industrial Production Year/Year with Industrial Level Overlay
Industrial Production % Industrial Production
Negative
Positive

MANUFACTURING SLOWING
59 Source: Bloomberg Finance, L.P., TAG
115,000.00
135,000.00
155,000.00
175,000.00
195,000.00
215,000.00
-40.00
-30.00
-20.00
-10.00
0.00
10.00
20.00
30.00
40.00
Capital Expenditures with Year Over Year Overlay
CapEx y/y (%) Capital Expenditures
y/y => "Negative"
y/y =>"Positive"

MANUFACTURING SLOWING
60 Source: Bloomberg Finance, L.P., TAG
25.00
35.00
45.00
55.00
65.00
75.00
85.00
95.00
105.00
115.00
125.00
Auto Supply Days
Average=66
Negative
Positive

CONSUMER EXHAUSTION
61 Source: Bloomberg Finance, L.P., TAG
12.00
13.00
14.00
15.00
16.00
17.00
18.00
19.00
20.00
21.00
22.00
Consumer Debt to Income
Consumer Debt to Income
Old Paradigm
New Paradigm

PERSISTENT HIGH UNEMPLOYMENT
62 Source: Bloomberg Finance, L.P., TAG
3.0
5.0
7.0
9.0
11.0
13.0
15.0
17.0
Unemployment with U-6
Unemployment U-6
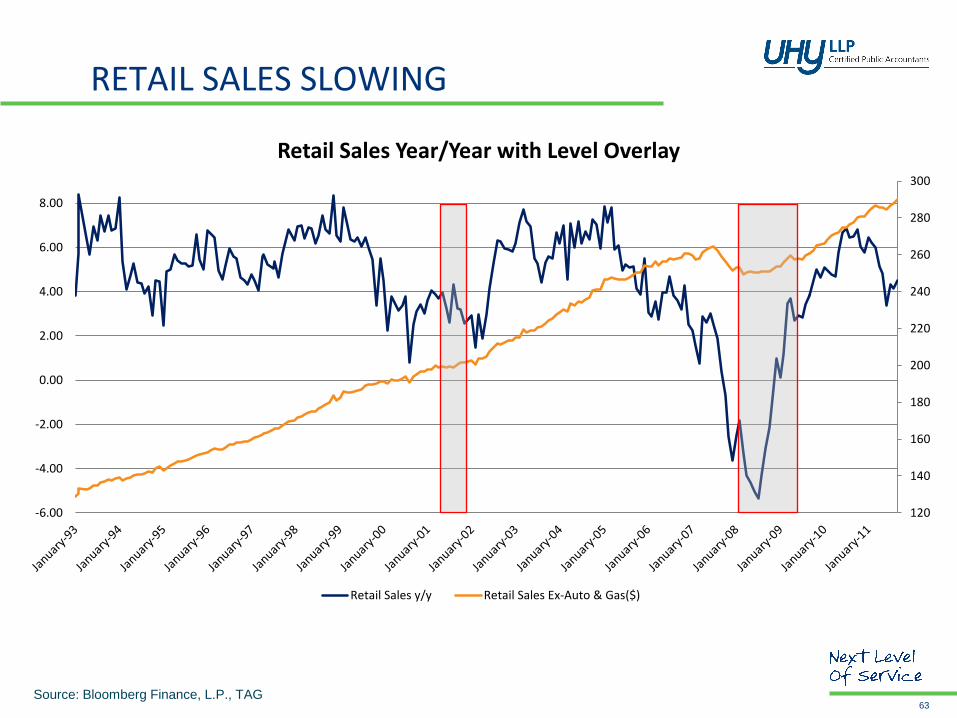
RETAIL SALES SLOWING
63 Source: Bloomberg Finance, L.P., TAG
120
140
160
180
200
220
240
260
280
300
-6.00
-4.00
-2.00
0.00
2.00
4.00
6.00
8.00
Retail Sales Year/Year with Level Overlay
Retail Sales y/y Retail Sales Ex-Auto & Gas($)

CONSUMER CONFIDENCE DOWN
64 Source: Bloomberg Finance, L.P., TAG
20.00
40.00
60.00
80.00
100.00
120.00
140.00
Jun
e-7
7
Jun
e-7
8
Jun
e-7
9
Jun
e-8
0
Jun
e-8
1
Jun
e-8
2
Jun
e-8
3
Jun
e-8
4
Jun
e-8
5
Jun
e-8
6
Jun
e-8
7
Jun
e-8
8
Jun
e-8
9
Jun
e-9
0
Jun
e-9
1
Jun
e-9
2
Jun
e-9
3
Jun
e-9
4
Jun
e-9
5
Jun
e-9
6
Jun
e-9
7
Jun
e-9
8
Jun
e-9
9
Jun
e-0
0
Jun
e-0
1
Jun
e-0
2
Jun
e-0
3
Jun
e-0
4
Jun
e-0
5
Jun
e-0
6
Jun
e-0
7
Jun
e-0
8
Jun
e-0
9
Jun
e-1
0
Jun
e-1
1
Jun
e-1
2
Consumer Confidence
Consumer Confidence
Average = 92.97
+1 Standard Deviation
+2 Standard Deviations
-1 Standard Deviation
-2 Standard Deviations

GREAT HOUSING HOPE
65

RECORD LOW INVENTORY
66 Source: Bloomberg Finance, L.P., TAG
3.00
4.00
5.00
6.00
7.00
8.00
9.00
10.00
11.00
12.00
13.00
140
190
240
290
340
390
440
490
540
590
New Home Supply (Months) with Inventory Overlay
New Homes Inventory New Home Supply Months
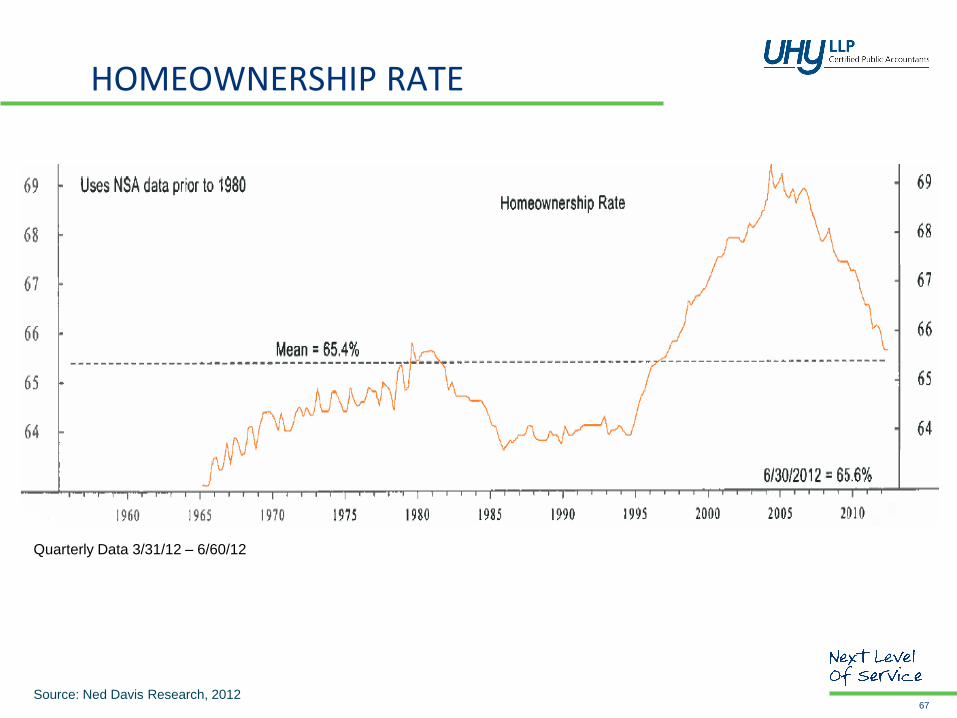
HOMEOWNERSHIP RATE
67 Source: Ned Davis Research, 2012
Quarterly Data 3/31/12 – 6/60/12

HOUSE PRICES
68 Source: http://www.jparsons.net/housingbubble/

PERMITS & STARTS
69 Source: Bloomberg Finance, L.P., TAG
0
500
1000
1500
2000
2500
3000
475
975
1475
1975
2475
Building Permits & Housing Starts
Permits Housing Starts

ECONOMIC IMPACT
70 Source: Bloomberg Finance, L.P., TAG
Housing Starts & Jobs
Housing Starts (yellow) & Unemployment (green)

ECONOMIC IMPACT
71 Source: Bloomberg Finance, L.P., TAG
Housing Starts & Consumer Confidence
Housing Starts (yellow) & Consumer Confidence (green)

ECONOMIC IMPACT
72 Source: Bloomberg Finance, L.P., TAG
Consumer Confidence & GDP
Consumer Confidence (yellow) & GDP (green)

ECONOMIC IMPACT
73 Source: Bloomberg Finance, L.P., TAG
Consumer Consumption
2%
7%
12%
17%
22%
27%
32%
37%
42%
Gas & Energy
Motor Vehicles & Parts
Clothing
Recreation
Food & Food Svc
Medical Care
Housing

TAG’S INVESTMENT COMMITTEE
74
James F. Peters, Jr. Chief Executive Officer
Paul J. Simon Chief Investment Officer
Joseph Styrna, CFA, CMT
Senior Research Analyst Gene Huang, PhD
Special Advisor
• Global Macro Team
• Forty plus years of asset management experience, with a CPA background
• Published author and speaker on financial markets
• Global Micro Team
• Twenty three years global analyst experience
• Frequent contributor to national financial media outlets
• Global Micro Team
• Thirteen years analyst experience
• Member of the CFA Institute and Market Technicians Association (MTA)
• Global Macro Team
• Chief Economist, Federal Express
• More than two decades global economic experience

TAG’S PORTFOLIO ADVISOR
75
Kevin A.W. Sheard Portfolio Advisor
Kevin is responsible for financial consulting services to families & institutions. Encompassing a comprehensive planning approach, he works with clients to develop their investment objectives, develops financial modeling and advises clients on their Portfolio construction to achieve their objectives. During his twelve year career, Kevin was a Trader of various securities at Fidelity Investments where he then became a Financial Planning Consultant. He later managed a $275 million dollar client base as a Financial Consultant at Charles Schwab & Co. In his leisure, Kevin enjoys the outdoors as a member of Ducks Unlimited and Trout Unlimited and was a ski coach for the Michigan Special Olympics. Kevin earned a Bachelor of Science degree in Sociology from Northern Michigan University.
[email protected] (248) 283-2520

DISCLOSURES
76
This Global Manufacturing Economic Forecast presentation has been provided by Tactical Allocation Group, LLC (“TAG”) for informational purposes only and should not be considered as investment advice or a recommendation for any particular security, strategy or investment product. Information contained herein has been obtained from sources believed to be reliable, but not guaranteed. This material contains the current opinion of the manager and such opinions are subject to change without notice. No part of this material may be reproduced in any form, or referred to in any other publication, without express written permission.
Risk Disclosures and Additional Information: Past performance is not an indication of future results. Investment return and principal value will fluctuate, so that your investment, if sold, may be worth more or less than the original cost. Investing in non-U.S. securities may entail higher risk due to non-U.S. currency fluctuations and political or economic uncertainty that may be especially heightened when investing in emerging markets. Diversification does not ensure against loss. All investments involve a risk of loss. Information contained in this document (other than TAG’s performance information) has been obtained from sources believed to be reliable, but not guaranteed. Neither the information nor any opinion expressed herein constitutes a recommendation to invest in accordance with a particular portfolio or a solicitation for the sale or purchase of any particular security. For a more complete description of TAG’s investment process and fees, consult TAG's Disclosure Brochure. A complete list of firm composite descriptions is available upon request. Tactical Allocation Group, LLC 139 S. Old Woodward Avenue, Birmingham, MI 48009 (248) 283-2520 | www.tagportfolios.com | [email protected]
© 2012 Tactical Allocation Group, LLC. All rights reserved

77 77 77 77 77 77 77 77 77 77 77 77 77 77 77 77 77 77 77 77 77 77
James F. Peters, Jr.
Chief Executive Officer Tactical Allocation Group, LLC
248 283 2520
CONTACT INFORMATION
Shale Oil & Gas Production: A New Chapter in Domestic Manufacturing Wayne Wilson Managing Director UHY Advisors Texas ,LLC
MANUFACTURING OUTLOOK 2013

OVERVIEW
79
• The Hype • Impact on Natural Gas Price
• Impact on Power Generation
• Impact on Raw Materials
• Challenges to Impacts

THE HYPE
80
• Will Change the Design of Cities in the Future
• Will Change the Automotive Industry Forever
• Bigger than the Internet
• Could Change the World
• Significant Environmental Benefits

IMPACT ON NATURAL GAS PRICE
81
• Shale has grown to about 25% of natural gas production
• Shale production quadrupled from 2007-2010 from 1.3 TCF to 5.3 TCF
• Projected to be 46% of US natural gas production by 2035
• Prices have fallen from over $10 per MMBTU in 2008 to less than $3 in 2012.
• Shale production pivotal to any forecast for natural gas production

PRICE PER MMBTU OF GAS VS. COAL
82
$0.00
$1.00
$2.00
$3.00
$4.00
$5.00
$6.00
$7.00
$8.00Ja
n-0
9
Mar
-09
May
-09
Jul-
09
Sep
-09
No
v-0
9
Jan
-10
Mar
-10
May
-10
Jul-
10
Sep
-10
No
v-1
0
Jan
-11
Mar
-11
May
-11
Jul-
11
Sep
-11
No
v-1
1
Jan
-12
Mar
-12
May
-12
Jul-
12
Sep
-12
Pri
ce p
er
MM
btu
Henry Hub NYMEX Future Price
CAPP NYMEX Future Price per MMBtu

IMPACT ON POWER GENERATION
83
• US is historically a coal generation nation
• Coal accounted for 57% of power generation in US in 1985
• Coal=34% and Gas=32% in May 2012
• Reason is falling natural gas prices combined with increasing environmental costs of coal
• Capital cost for conventional coal is over 3X that of conventional combined cycle natural gas
IMPACT ON RAW MATERIALS
84
• Natural gas as feedstock for chemicals and plastics
• 30+% increase in ethylene
• Downstream industries include everything from clothing and textile mills to beverages and pharmaceuticals
• Impact of lower plastic prices is widespread
• Potential future impacts of plastic alternatives to wood or metal manufacturing
CHALLENGES TO IMPACTS
85
• Globalization of Natural Gas Market
• Impact of Low Prices on Shale Gas Producers
• Supply Demand Equilibrium
• Increased Environmental Regulation
• Other Government Interference

CONTACT INFORMATION
86
Wayne Wilson
Managing Director UHY Advisors Texas, LLC
713 407 3831

REFRESHMENT BREAK
87
Will reconvene in 15 minutes
Medical Devices: Bringing Your Product to Market Timothy M. McCarthy Senior Counsel Clark Hill PLC
MANUFACTURING OUTLOOK 2013

89
What are the five top concerns of medical device manufacturers?
1. Medical device tax.
2. Medical device tax.
3. Medical device tax.
4. Medical device tax.
5. Medical device tax.
MEDICAL DEVICES: BRINGING YOUR PRODUCT TO MARKET

90
The medical device tax:
• 2.3 per cent on sale of any medical device.
• By manufacturer, producer, or importer.
• Effective January 1, 2013.
• Exemptions for eyeglasses, contact lenses, hearing aids, and devices generally purchased by general public at retail.
MEDICAL DEVICES: BRINGING YOUR PRODUCT TO MARKET

91 91
The medical device tax: Issues
1. Efforts to repeal:
• Stock prices are down because of the tax.
• Obamacare benefits for hospitals could result in higher volumes.
2. Treatment of kits.
3. Contracts and rebates.
MEDICAL DEVICES: BRINGING YOUR PRODUCT TO MARKET

92 92 92 92
The sixth top issue to medical device manufacturers:
6. FDA approval
MEDICAL DEVICES: BRINGING YOUR PRODUCT TO MARKET

93 93 93 93 93 93 93
FDA approval:
• Average time for premarket notification clearance (510(k)) has increased.
• Average time for approval of a premarket approval application (PMA) has doubled since 2008
MEDICAL DEVICES: BRINGING YOUR PRODUCT TO MARKET

94 94 94 94 94 94 94 94 94 94 94 94
What the FDA is doing:
• Budget for device review has increased from $120M to $292M.
• 240 additional full-time employees.
• Clear, meaningful metrics to be used.
MEDICAL DEVICES: BRINGING YOUR PRODUCT TO MARKET

95 95 95 95 95 95
The seventh top issue to medical device manufacturers:
7. Patent protection
• Develop a patent strategy • Consider patent problems:
― Lag time to issue ― Increased costs
MEDICAL DEVICES: BRINGING YOUR PRODUCT TO MARKET

96 96 96 96 96 96 96 96 96
Patent protection of your medical device during development:
1. Get good non-disclosure agreements.
2. File early for patent protection.
• Especially after March 16, 2013.
3. File for all alternate designs.
4. Claim all possible users.
5. Consider design patents.
6. Joint development agreements.
MEDICAL DEVICES: BRINGING YOUR PRODUCT TO MARKET

97 97 97 97 97 97 97 97 97 97 97 97 97 97 97
Patent protection of your medical device after obtaining a patent. 1. Cease-and-desist letter.
2. Infringement lawsuit.
3. ITC proceeding.
4. Licensing.
Consider the advice of Abraham Lincoln.
MEDICAL DEVICES: BRINGING YOUR PRODUCT TO MARKET

98 98 98 98 98 98 98 98 98 98 98 98 98 98 98 98 98 98 98
Protection of your IP all the time.
1. Employee relationship:
a. Defining role of employee and scope of duties. b. Assignments of inventions from employees and
partners. c. Protect from use of IP from employee’s prior job. d. Non-competition clauses.
MEDICAL DEVICES: BRINGING YOUR PRODUCT TO MARKET

99 99 99 99 99 99 99 99 99 99 99 99 99 99 99 99 99 99 99 99 99 99
Protection of your IP all the time.
2. Trade secrets:
a. Keep secret information secret. b. Restrict disclosure within the company. c. NDAs with suppliers.
3. If it truly is a trade secret, treat it like a trade
secret. 4. Non-compete agreements.
MEDICAL DEVICES: BRINGING YOUR PRODUCT TO MARKET

100 100 100 100 100 100 100 100 100 100 100 100 100 100 100 100 100 100 100 100 100 100
Tim McCarthy Senior Counsel
Clark Hill
[email protected] 312 985 5561
CONTACT INFORMATION

Maximizing Momentum For Automotive Suppliers Anthony Pratt Director Of Forecasting, Americas R.L. Polk & Co.
MANUFACTURING OUTLOOK 2013

© 2012 R. L. Polk & Co. All rights reserved.
Anthony Pratt Director of Forecasting, The Americas
August 2012

“5 Trends in 5 Minutes”
The 6 Burning Forecasting Questions:
© 2012 R. L. Polk & Co. All rights reserved.
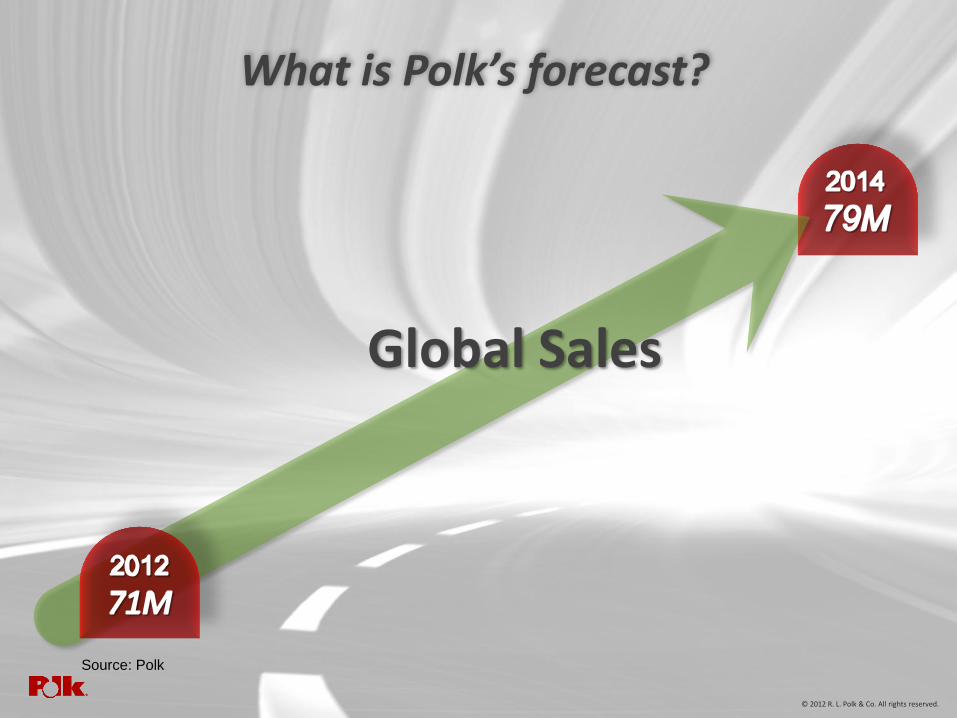
1) “What is Polk’s forecast?”
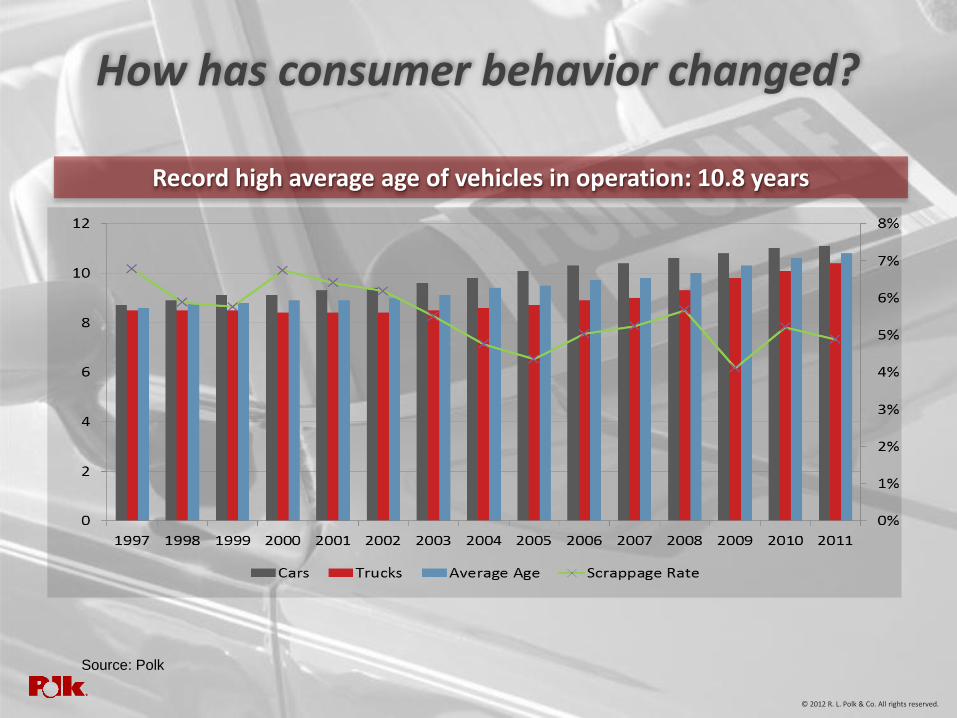
2) “How has consumer behavior changed?”
3) “Should suppliers be cautious about capital investment?”
4) “How does the ‘European Crisis” threaten you?”
5) “Will China continue to drive growth?”
6) “What else should you be watching?”

“5 Trends in 5 Minutes”
What is Polk’s forecast?
© 2012 R. L. Polk & Co. All rights reserved.
“5 Trends in 5 Minutes”
Global Sales
What is Polk’s forecast?
© 2012 R. L. Polk & Co. All rights reserved.
Source: Polk

© 2012 R. L. Polk & Co. All rights reserved. 106
0
10,000
20,000
30,000
40,000
50,000
60,000
70,000
80,000
90,000
100,000
19
95
19
96
19
97
19
98
19
99
20
00
20
01
20
02
20
03
20
04
20
05
20
06
20
07
20
08
20
09
20
10
20
11
20
12
20
13
20
14
20
15
20
16
20
17
WE CEE NAFTA Asia-Pacific/Middle East Latin America Africa
Global Light Vehicle Registration Volumes: 1995 - 2017
What is Polk’s forecast?
34% growth between 2012 and 2017
Approaching 100 million units by 2020
© 2012 R. L. Polk & Co. All rights reserved.
Source: Polk

“5 Trends in 5 Minutes”
U.S. Sales
What is Polk’s forecast?
© 2012 R. L. Polk & Co. All rights reserved.
Source: Polk

“5 Trends in 5 Minutes”
What is Polk’s forecast?
© 2012 R. L. Polk & Co. All rights reserved.
Millions of Units
7
8
9
10
11
12
13
14
15
16
17
2007 2008 2009 2010 2011 2012F 2013F 2014F 2015F 2016F 2017F
13.2
10.3
11.5
12.6
14.3
15.2 16.0 16.0 16.0
15.5
16.0
U.S. Sales likely to peak at 16 million units through 2017
Source: Polk

“5 Trends in 5 Minutes”
What is Polk’s forecast?
© 2012 R. L. Polk & Co. All rights reserved.
Risks outweigh opportunities: “Falling off the financial cliff”
14.3
15.2
16.0 16.0 16.0 15.5
14.1
14.5
15.0
15.4 15.5 15.4
13.5
14
14.5
15
15.5
16
16.5
2012F 2013F 2014F 2015F 2016F 2017F
Upside Baseline Downside
14.5
15.5
16.3 16.2
15.9
16.3
Source: Polk

“5 Trends in 5 Minutes”
N.A. Assembly
What is Polk’s forecast?
© 2012 R. L. Polk & Co. All rights reserved.
Source: Polk

“5 Trends in 5 Minutes”
What is Polk’s forecast?
© 2012 R. L. Polk & Co. All rights reserved.
Millions of Units
2007 2008 2009 2010 2011 2012F 2013F 2014F 2015F 2016F 2017F
7
9
11
13
15
17
19
North American Production: Expansion likely
16.2 16.9 16.8 16.9 15.1
12.6
8.6
11.9
13.1
15.0
15.4
Source: Polk

“5 Trends in 5 Minutes”
What is Polk’s forecast?
© 2012 R. L. Polk & Co. All rights reserved.
17% 16% 12%
13% 18% 22%
70% 66% 66%
0.0%
10.0%
20.0%
30.0%
40.0%
50.0%
60.0%
70.0%
80.0%
90.0%
100.0%
2002 2012 2022
Canada Mexico USA
Assembly Investment: “Canada is world’s most expensive”
Source: Polk

“5 Trends in 5 Minutes”
How has consumer behavior changed?
© 2012 R. L. Polk & Co. All rights reserved.
“5 Trends in 5 Minutes”
How has consumer behavior changed?
© 2012 R. L. Polk & Co. All rights reserved.
Record high average age of vehicles in operation: 10.8 years
Source: Polk

“5 Trends in 5 Minutes” © 2012 R. L. Polk & Co. All rights reserved.
How has consumer behavior changed?
Ownership length: 71 months (and rising?)
Source: Polk

“5 Trends in 5 Minutes” © 2012 R. L. Polk & Co. All rights reserved.
How has consumer behavior changed?
Loan terms over 5 years: 46%
Source: TransUnion

“5 Trends in 5 Minutes”
Customers are returning!
© 2012 R. L. Polk & Co. All rights reserved.
How has consumer behavior changed?

“5 Trends in 5 Minutes”
Should suppliers be cautious about capital investment?
© 2012 R. L. Polk & Co. All rights reserved.

© 2012 R. L. Polk & Co. All rights reserved. 119
Global light vehicle production % change: 2012 vs. 2011
Should suppliers be cautious about capital investment?
Production volumes growing in 2012; excluding Europe
31%
18% 15%
10% 9% 8% 7% 7%
- 6%
-20.0%
0.0%
20.0%
40.0%
Africa Japan N. Amer. China E. Euro. Asia Rest World S. Amer, EU27
© 2012 R. L. Polk & Co. All rights reserved.
Source: Polk

© 2012 R. L. Polk & Co. All rights reserved. 120
40,000
50,000
60,000
70,000
80,000
90,000
100,000
1995 2000 2005 2010 2015
Should suppliers be cautious about capital investment?
Global Light Vehicle Production Volumes (000)
Global production volumes approaching 100 million vehicles
© 2012 R. L. Polk & Co. All rights reserved.
Source: Polk

“5 Trends in 5 Minutes”
Should suppliers be cautious about capital investment?
Loyalty Rate Over Time (% Loyal to Manufacturer) © 2012 R. L. Polk & Co. All rights reserved.
43.3
44.8 46.2
45.0
42.9 41.5
40.6 40.0 39.8
36
38
40
42
44
46
48
Yr 1 Yr 2 Yr 3 Yr 4 Yr 5 Yr 6 Yr 7 Yr 8 Yr 9
Loyalty: Declines the longer a consumer owns a vehicle
Source: Polk
% L
oya
l to
Ma
nu
factu
rer
Number of years owned

“5 Trends in 5 Minutes”
Should suppliers be cautious about capital investment?
© 2012 R. L. Polk & Co. All rights reserved.
Loyalty: New vehicle launches typically increase conquest sales
Source: Polk

“5 Trends in 5 Minutes”
Should suppliers be cautious about capital investment?
© 2012 R. L. Polk & Co. All rights reserved.
The battle for U.S. market share!
U.S. Market Share Forecast by Manufacturer Source: Polk

© 2012 R. L. Polk & Co. All rights reserved.
Should suppliers be cautious about capital investment?
Proceed with caution!

“5 Trends in 5 Minutes”
How does the European crisis threaten you?
© 2012 R. L. Polk & Co. All rights reserved.

“5 Trends in 5 Minutes”
2007 2011 % Change
VW 12.5% 15.4% 3.0%
Nissan 2.4% 4.4% 1.9%
Hyundai 2.4% 3.6% 1.2%
Skoda 3.6% 4.5% 0.9%
Kia 2.0% 2.7% 0.7%
Ford 10.3% 10.3% 0.1%
Peugeot 8.7% 8.5% -0.2%
Citroen 7.5% 7.3% -0.2%
Renault 9.9% 9.6% -0.2%
Mazda 1.8% 1.2% -0.6%
Opel/Vxh. 10.6% 9.4% -1.2%
Fiat 7.8% 6.6% -1.2%
Toyota 7.0% 4.9% -2.1% EU27 Market Share: 2007 vs. 2011
How does the European crisis threaten you?
EU 27 market share “winners” and “losers”
© 2012 R. L. Polk & Co. All rights reserved.
Source: Polk

© 2012 R. L. Polk & Co. All rights reserved. 127
Mill
ion
s
13.6 13.7 13.0 12.8
11.9 12.2 12.8 13.3 13.6 13.8
5.1
2.99 3.6
4.3 4.6 4.9 5.5 5.98
6.5 7.1
0
2
4
6
8
10
12
14
16
2008 2009 2010 2011 2012F 2013F 2014F 2015F 2016F 2017F
Western Euro. Central/Eastern Euro.
European New Light Vehicle Registrations: 2008 - 2017
How does the European crisis threaten you?
Euro crisis impacts all economies
© 2012 R. L. Polk & Co. All rights reserved.
Source: Polk

128
GDP Contributors to Growth 2011 2012 2013
GDP Growth: 1.5 -0.2 1.4
o Private Consumption 0.1 -0.2 0.5
o Government Consumption -0.1 0.0 0.2
o Fixed Investment 0.3 -0.3 0.4
o Net Exports 1.1 0.8 0.2
o Chg. In Inv + Stat. Discr. 0.1 -0.5 0.2
European Union Real GDP Growth by Components: 2011 - 2013
How does the European crisis threaten you?
Exports buffering OEMs from struggling home market
© 2012 R. L. Polk & Co. All rights reserved.
Source: Feri

© 2012 R. L. Polk & Co. All rights reserved. 129
European New Light Vehicle Production Volumes: 2008 - 2017
How does the European crisis threaten you?
0
2
4
6
8
10
12
14
16
18
2008 2009 2010 2011 2012F 2013F 2014F 2015F 2016F 2017F
Central / Easter Europe Western Europe
Mill
ion
s
Exports partially offsetting decline in home market
14.5
12.0
13.5 14.0 12.9
13.2 14.1
14.7 15.0 15.4
7% Export 8%
Export
12% Export
6.0 4.8
5.5 6.1 6.4 6.9
7.6 8.1 8.6 8.9
18% Export
39% Export
25% Export
© 2012 R. L. Polk & Co. All rights reserved.
Source: Polk

© 2012 R. L. Polk & Co. All rights reserved. 130
How does the European crisis threaten you?
© 2012 R. L. Polk & Co. All rights reserved.
Source: Polk
A great deal of risk and uncertainty!

“5 Trends in 5 Minutes”
Will China continue to drive growth?
© 2012 R. L. Polk & Co. All rights reserved.

© 2012 R. L. Polk & Co. All rights reserved. 132
Will China continue to drive growth?
59% China Growth
(35% CTG)
34% U.S. Growth (13% CTG)
34% Global Growth
56% BRIC Growth
(55% CTG)
Sales % growth: 2011 vs. 2017
© 2012 R. L. Polk & Co. All rights reserved.
Source: Polk

© 2012 R. L. Polk & Co. All rights reserved. 133
Will China continue to drive growth?
China Light Vehicle Registration Volumes: 2008 - 2017
“Lower tier” Chinese cities will drive growth
6.2
10.2
13.0 13.1 14.6
15.6 17.1
18.2 19.5
20.8
0
5
10
15
20
25
2008 2009 2010 2011 2012 2013 2014 2015 2016 2017
© 2012 R. L. Polk & Co. All rights reserved.
Gov’t Stimulus
Source: Polk

“5 Trends in 5 Minutes”
What else should you be watching?
© 2012 R. L. Polk & Co. All rights reserved.

To download this presentation and to access more of
our Forecasting publications and analyses, please visit:
www.polk.com/forecasts

136 136 136 136 136 136 136 136 136 136 136 136 136 136 136 136 136 136 136 136 136 136
Anthony Pratt
Director Of Forecasting, Americas; R.L. Polk & Co
248 728 7000
CONTACT INFORMATION

PANEL DISCUSSION
137
Questions and answers

ATTENDEE CHECKLIST
138
CPE materials • On-site: pick up at the registration desk (sign in, complete/return
evaluation form, pick up certificate) • On-line: email us
Feedback (forms in attendee booklet) Questions
• On-site: fill out question cards (we will collect later) • On-line: click the link to email your questions
Keep a look out for a post-event email
• Download a copy of the PowerPoint presentation • Link to view the webcast video
Pre-register for 2013 (2014 Outlook)
Get on our Manufacturing Insider mailing list

CONCLUDING THOUGHTS
139
Thank you!