manual for use of the maq software - chemical analysis ... · manual for use of the maq software....
TRANSCRIPT
IFU510
v170791
MAQ ‐ S
USER
GUIDE
V2.1
Manual for use
of the MAQ
software
MAQ‐S User Guide v2.1
2
www.agilent. com © 2017 Multiplicom NV, all rights reserved.
Revision date: September 2017
Table of Contents
Chapter 1 Installation ...................................................................................... 3
Chapter 2 MAQ-S: An overview ........................................................................ 3
2.1. Background ......................................................................................... 3
2.2. The software ........................................................................................ 4
Chapter 3 Starting a new project ...................................................................... 5
Chapter 4 Import ............................................................................................ 5
4.1. Selecting the data folder and the assay description file ............................... 5
4.2. Import/export projects ........................................................................... 6
4.3. ABI import issues .................................................................................. 6
4.4. Unknown internal lane standard .............................................................. 7
Chapter 5 ListBox ........................................................................................... 8
5.1. De-Selecting reads and references .......................................................... 8
5.2. The data .............................................................................................. 9
Chapter 6 The chromatogram graph ................................................................ 11
6.1. Content ............................................................................................. 11
6.2. Changing bin width or position .............................................................. 12
6.3. Other functions ................................................................................... 12
Chapter 7 DosPlot ......................................................................................... 13
7.1. What's on the DosPlot .......................................................................... 13
Chapter 8 Export .......................................................................................... 14
Chapter 9 Settings ........................................................................................ 15
Chapter 10 License ....................................................................................... 16
Chapter 11 Demo ......................................................................................... 16
Chapter 12 More help... ................................................................................. 16
12.1. MAQ-S Help features .......................................................................... 16
12.2. Globbing .......................................................................................... 17
12.3. Dosage Quotient ................................................................................ 17
MAQ‐S User Guide v2.1
3
www.agilent. com © 2017 Multiplicom NV, all rights reserved.
Revision date: September 2017
Chapter 1 Installation
MAQ-S can be downloaded from the Multiplicom website at
www.agilent.com/en/products/next-generation-sequencing/amplicon-target-
amplification-(multiplicom)/maq-s. The application works right away after
decompression, so you do not need to install anything. This should exclude any
permission issues of the operating system, regarding the installation of
software on your computer. MAQ-S works anywhere, so you can put the MAQ-
S folder anywhere you like.
The MAQ-S folder also contains a subfolder named DemoFiles in which some
sample (.fsa) files can be found together with their assay description file (.enc).
Using these files, you can trial the program fully.
MAQ-S is a cross-platform application and thereby also available for Linux
users.
Chapter 2 MAQ-S: An overview
2.1. Background
MAQ-S was developed to simplify the analysis of a new method called Multiplex
Amplicon Quantification (MAQ).
MAQ is a multiplex PCR (mPCR)-based method for the detection and analysis
of copy number variations (CNVs) in a genomic region or gene of interest. This
method consists of the simultaneous PCR amplification of several fluorescently
labeled target and control sequences. The comparison of normalized intensities
between the test individual and reference individuals results in a dosage
quotient indicating the copy number of the target amplicon.
The PCR primers of the MAQ assays are designed by proprietary software that
allows the design of mPCR primer sets with a very high multiplexing degree (>
40). In this way, several genomic regions, genes or even exons of interest can
be simultaneously analyzed. MAQ is highly comparable to Multiplex Ligation-
dependent Probe Amplification (MLPA), with the important difference that the
experimental setup consists of a single mPCR reaction followed by fluorescent
fragment analysis, resulting in a considerable reduction of labour and time.
Note:
MAQ-S also supports the analysis of experimental data obtained with Multiplex
Ligation-dependent Probe Amplification (MLPA).
MAQ‐S User Guide v2.1
4
www.agilent. com © 2017 Multiplicom NV, all rights reserved.
Revision date: September 2017
2.2. The software
The application compares normalized peak areas between a test individual and
reference individuals resulting in a dosage quotient indicating the copy number
of the target amplicon. Data analysis is straightforward and starts with
importing raw data files generated by the fragment analysis (.fsa files) together
with the assay description file. Next, dosage quotients are automatically
calculated and visualized. The interface itself is kept very simple and is thereby
very user-friendly. Chromatogram data as well as dosage quotients can be
graphically represented and exported.
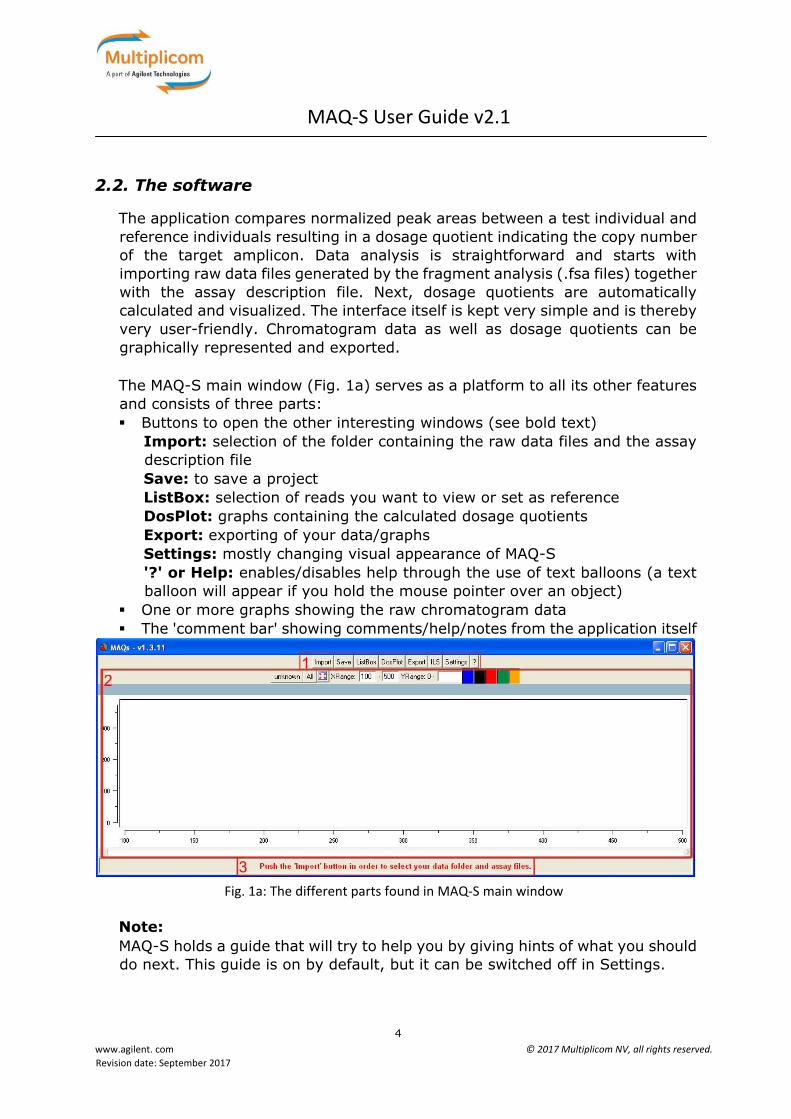
The MAQ-S main window (Fig. 1a) serves as a platform to all its other features
and consists of three parts:
Buttons to open the other interesting windows (see bold text)
Import: selection of the folder containing the raw data files and the assay
description file
Save: to save a project
ListBox: selection of reads you want to view or set as reference
DosPlot: graphs containing the calculated dosage quotients
Export: exporting of your data/graphs
Settings: mostly changing visual appearance of MAQ-S
'?' or Help: enables/disables help through the use of text balloons (a text
balloon will appear if you hold the mouse pointer over an object)
One or more graphs showing the raw chromatogram data
The 'comment bar' showing comments/help/notes from the application itself
Fig. 1a: The different parts found in MAQ‐S main window
Note:
MAQ-S holds a guide that will try to help you by giving hints of what you should
do next. This guide is on by default, but it can be switched off in Settings.
MAQ‐S User Guide v2.1
5
www.agilent. com © 2017 Multiplicom NV, all rights reserved.
Revision date: September 2017
Chapter 3 Starting a new project
To have a look at the dosage quotients, you will only need to do two things (if
your settings are correct):
Select the data folder.
Select the correct assay description file.
If your settings are not optimal, MAQ‐S will not be able to identify the correct control reads automatically. In this case, you will need to set these manually by selecting them and pushing the 'SetRef' button found in the ListBox.
Chapter 4 Import
4.1. Selecting the data folder and the assay description file
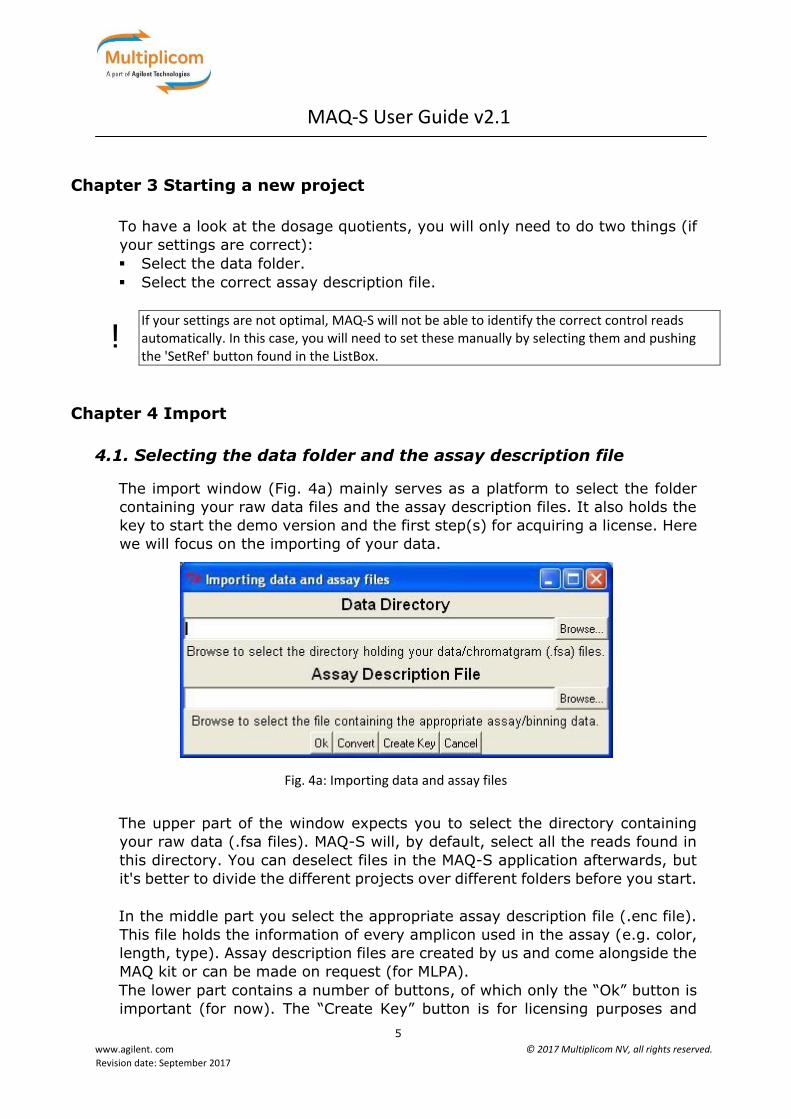
The import window (Fig. 4a) mainly serves as a platform to select the folder
containing your raw data files and the assay description files. It also holds the
key to start the demo version and the first step(s) for acquiring a license. Here
we will focus on the importing of your data.
Fig. 4a: Importing data and assay files
The upper part of the window expects you to select the directory containing
your raw data (.fsa files). MAQ-S will, by default, select all the reads found in
this directory. You can deselect files in the MAQ-S application afterwards, but
it's better to divide the different projects over different folders before you start.
In the middle part you select the appropriate assay description file (.enc file).
This file holds the information of every amplicon used in the assay (e.g. color,
length, type). Assay description files are created by us and come alongside the
MAQ kit or can be made on request (for MLPA).
The lower part contains a number of buttons, of which only the “Ok” button is
important (for now). The “Create Key” button is for licensing purposes and
!

MAQ‐S User Guide v2.1
6
www.agilent. com © 2017 Multiplicom NV, all rights reserved.
Revision date: September 2017
starting the demo version. The “Convert” button is for creating the assay files
but only works if you have a valid account.
Although the assay files are created solely by us, the user is still able to change bin position and/or width.
4.2. Import/export projects
Opening previously saved projects can be performed by:
• Using the “Import” button, after which you browse the directory in which
your project file(s) can be found.
• Double-clicking the project file (.mqs).
Saving a project is performed by clicking the “Save” button. A project file holds
information about:
• The location of the data files.
• The location of the assay description file.
• The currently activated reads AND assay.
• The currently set reference reads.
At the moment, only the locations of data/assay files are kept. So, a project will only work if you do NOT move the assay and data files.
4.3. ABI import issues
Depending on the software you are using, the analysis of the internal lane
standard is done automatically. This analysis results in a correlation between
retention time and base length.
A correct representation of your chromatogram relies on this correlation.
Unfortunately, the ABI software sometimes fails to give a correct correlation,
usually with overloaded samples. This will result in chromatograms that are
shifted.
In that case, you can let MAQ-S do the analysis:
• by clicking the “AnaILS” (Analyze Internal Lane Standard) button in the
ListBox.
• by default, with the option “always overrule standard" in Settings
(which is disabled by default).
It can also happen that one or more sizes of the internal lane standard are not
found, resulting in one or more ranges with uncertain base lengths.
!
MAQ‐S User Guide v2.1
7
www.agilent. com © 2017 Multiplicom NV, all rights reserved.
Revision date: September 2017
Example:
Suppose size 200 is missing in the GS500LIZ standard, which usually contains
sizes "35 50 75 100 139 150 160 200 300 340 350 400 450 490 500." => All
sizes between 160 and 300 are uncertain and are covered by a pink (by default)
rectangle.
It's not recommended to let MAQ‐S do the analysis of the internal lane standard by default. It can take a lot of time, and in most cases it's not necessary.
4.4. Unknown internal lane standard
In case the ABI software does NOT analyze the internal lane standard, MAQ-S
will do this automatically for you. If, however, the internal lane standard used
is unknown to MAQ-S, it will ask you to enter the sizes of every peak within
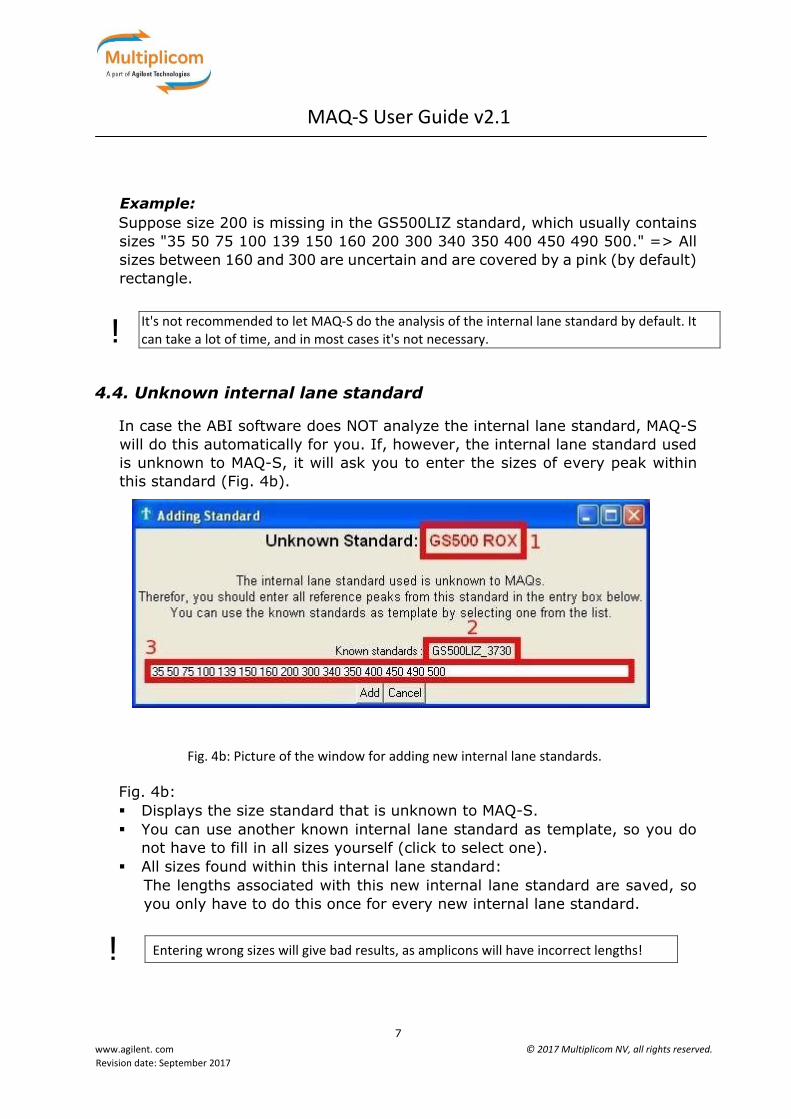
this standard (Fig. 4b).
Fig. 4b: Picture of the window for adding new internal lane standards.
Fig. 4b:
Displays the size standard that is unknown to MAQ-S.
You can use another known internal lane standard as template, so you do
not have to fill in all sizes yourself (click to select one).
All sizes found within this internal lane standard:
The lengths associated with this new internal lane standard are saved, so
you only have to do this once for every new internal lane standard.
Entering wrong sizes will give bad results, as amplicons will have incorrect lengths!
!
!
MAQ‐S User Guide v2.1
8
www.agilent. com © 2017 Multiplicom NV, all rights reserved.
Revision date: September 2017
Chapter 5 ListBox
The ListBox window serves as an overview of your experiment as well as a
platform to select and deselect reads and references.
5.1. De-Selecting reads and references
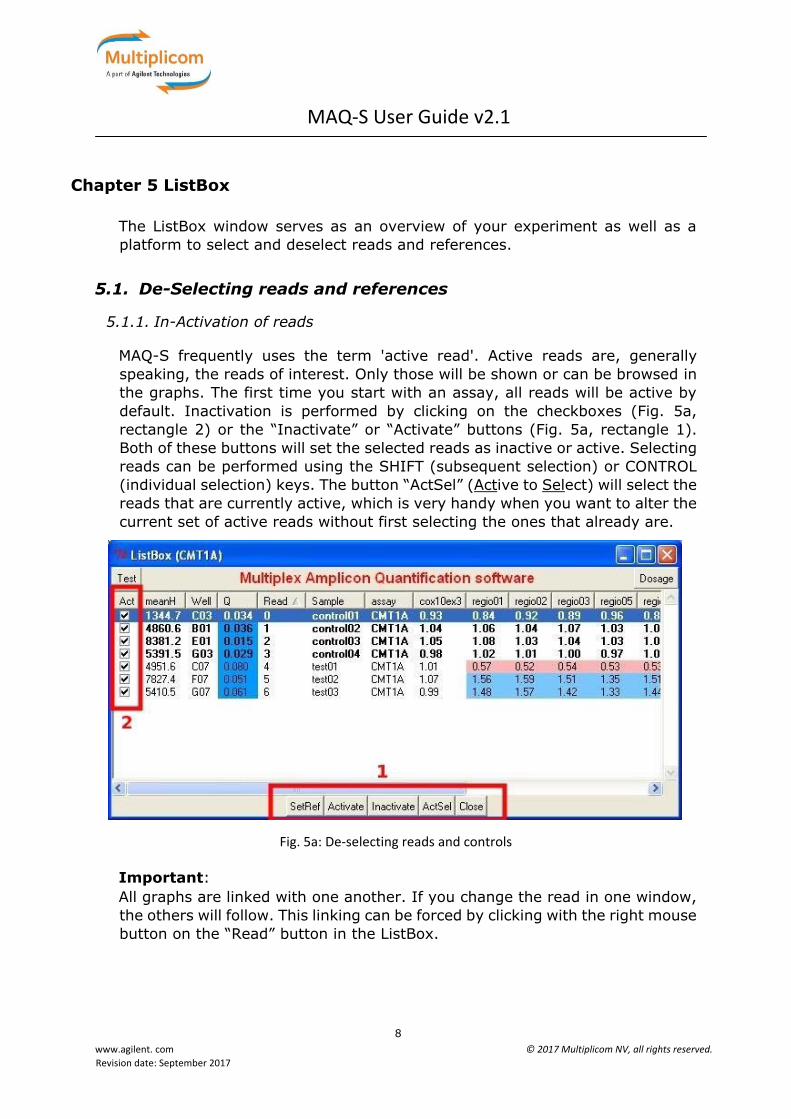
5.1.1. In-Activation of reads
MAQ-S frequently uses the term 'active read'. Active reads are, generally
speaking, the reads of interest. Only those will be shown or can be browsed in
the graphs. The first time you start with an assay, all reads will be active by
default. Inactivation is performed by clicking on the checkboxes (Fig. 5a,
rectangle 2) or the “Inactivate” or “Activate” buttons (Fig. 5a, rectangle 1).
Both of these buttons will set the selected reads as inactive or active. Selecting
reads can be performed using the SHIFT (subsequent selection) or CONTROL
(individual selection) keys. The button “ActSel” (Active to Select) will select the
reads that are currently active, which is very handy when you want to alter the
current set of active reads without first selecting the ones that already are.
Fig. 5a: De‐selecting reads and controls
Important:
All graphs are linked with one another. If you change the read in one window,
the others will follow. This linking can be forced by clicking with the right mouse
button on the “Read” button in the ListBox.
MAQ‐S User Guide v2.1
9
www.agilent. com © 2017 Multiplicom NV, all rights reserved.
Revision date: September 2017
5.1.2. Setting the reference reads
The reference reads are extremely important, because they will determine
whether you'll have a deletion, duplication or nothing at all. These references
are automatically set after you load an experiment. This is done based upon a
certain pattern in the file name. This pattern can be set or changed in Settings.
If MAQ-S can't find any matching reference individuals, you can still set those
manually by first selecting them, followed by pushing the “SetRef” button (Fig.
5a, rectangle 1). After the reference reads are known, dosage quotients can
and will be calculated.
Notes:
• You should always use more than one reference.
• A good reference should always have at least one copy of every
amplicon. Otherwise, you cannot have any clue about the copy number,
because the dosage quotient can't be calculated.
• The reference reads set are listed in bold.
5.2. The data
The ListBox (Fig. 5b) holds useful information about the reads:
• meanH : average height of all the amplicons
• standard : ILS used by MAQ-S to analyze the raw data
• ILSA: tells you if the ILS was known to MAQ-Sv or unknown and selected
by the user
• Q: a quality value of the control amplicons within the read, after setting
the reference samples
• sample : name of the sample, extracted from the name of the raw data
file name
• assay : assay used at the moment to analyze the data
• DQ : dosage quotients
• file: raw data file used to load into the program
MAQ‐S User Guide v2.1
10
www.agilent. com © 2017 Multiplicom NV, all rights reserved.
Revision date: September 2017
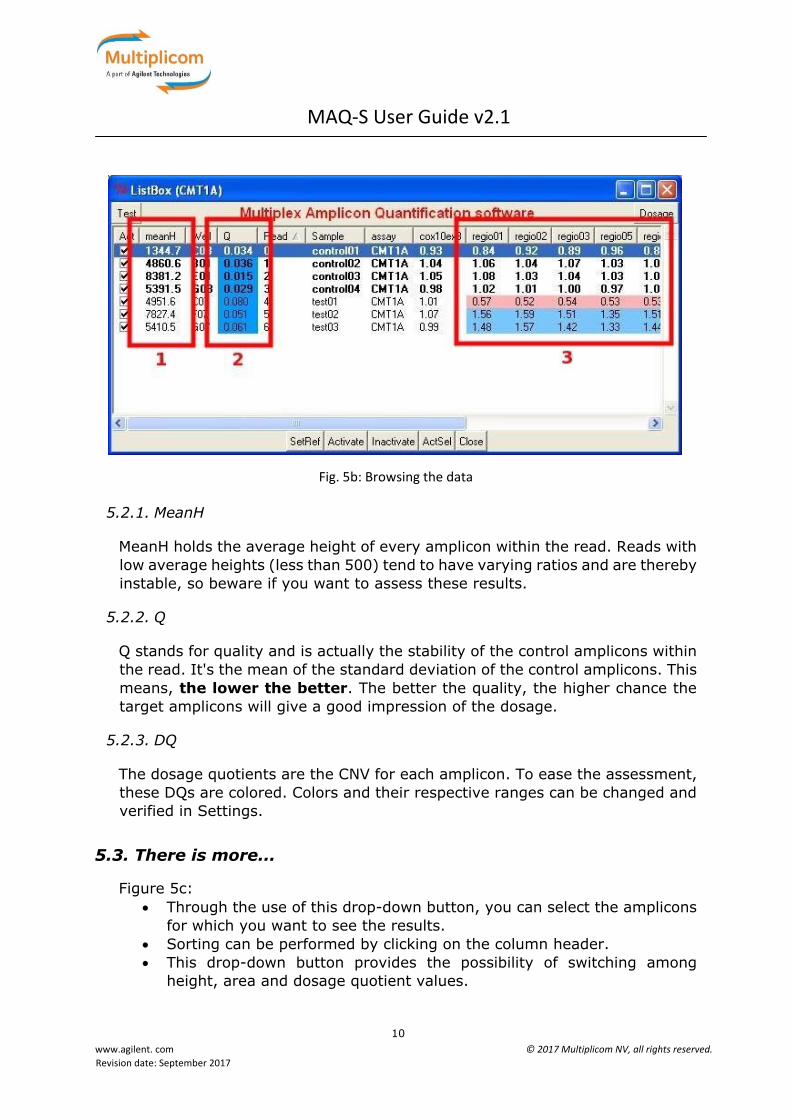
Fig. 5b: Browsing the data
5.2.1. MeanH
MeanH holds the average height of every amplicon within the read. Reads with
low average heights (less than 500) tend to have varying ratios and are thereby
instable, so beware if you want to assess these results.
5.2.2. Q
Q stands for quality and is actually the stability of the control amplicons within
the read. It's the mean of the standard deviation of the control amplicons. This
means, the lower the better. The better the quality, the higher chance the
target amplicons will give a good impression of the dosage.
5.2.3. DQ
The dosage quotients are the CNV for each amplicon. To ease the assessment,
these DQs are colored. Colors and their respective ranges can be changed and
verified in Settings.
5.3. There is more...
Figure 5c:
Through the use of this drop-down button, you can select the amplicons
for which you want to see the results.
Sorting can be performed by clicking on the column header.
This drop-down button provides the possibility of switching among
height, area and dosage quotient values.

MAQ‐S User Guide v2.1
11
www.agilent. com © 2017 Multiplicom NV, all rights reserved.
Revision date: September 2017
Fig. 5c: Changing content
Chapter 6 The chromatogram graph
6.1. Content
This region of the main window (Fig. 6a) holds and shows the:
• Raw chromatogram data (dark blue line)
• Label of the read (test01)
• Bins of the target amplicons (yellow area)
• Bins of the control amplicons (grey area)
• Areas (light blue) used for calculating the dosage quotient
• Area (pink) with fixed height for getting a quick and general idea about
the intensity (without having to look at the Y-axis)
• Reference chromatogram (grey line), which can be put on every read
after the references are set. This chromatogram represents the mean of
all references currently set and can be shifted or hidden in Settings.
Fig. 6a: Peak areas of the test individual in blue, and the average reference peaks in grey

MAQ‐S User Guide v2.1
12
www.agilent. com © 2017 Multiplicom NV, all rights reserved.
Revision date: September 2017
Note:
• Many properties (e.g. color and font) of the objects shown in the
chromatogram can be altered using Settings.
• Ranges that are not fully covered by the internal lane standard are
shown in the same color as the 'low height marker.'
6.2. Changing bin width or position
If you are unhappy about the position or the width of a certain bin (because
the peaks are somewhat shifted, or the background is high), you can very
easily move or resize the bin. To enter the editing state, just double click on
the bin you want to change. By default, MAQ-S will zoom into the region so you
can move with more precision (this can be turned off in Settings). To move the
bin, click and drag with the left mouse button. To resize the bin, click and drag
with the right mouse button. To leave the editing state, just double click. By
default, MAQ-S will zoom out again.
After the bins are in place, you can:
• re-analyze your data by re-selecting the assay and/or
• export the assay for future use.
6.3. Other functions
In addition to just looking at the default range, you can also (Fig. 6b):
• Select another assay (if the assay description file contains more than
one).
• Quickly zoom into a certain region (default width can be adjusted in
Settings).
• Change grid layout (number of rows and/or columns).
• Change the X (base length) and Y (peak intensities) axis.
• View the intensities of other dyes.
Fig. 6 b : The different chromatogram functions

MAQ‐S User Guide v2.1
13
www.agilent. com © 2017 Multiplicom NV, all rights reserved.
Revision date: September 2017
Note:
• All graphs are linked with one another. If you change the read in one
window, the others will follow. This linking can be forced by clicking with
the right mouse button on the chromatogram graph.
• You can use bin editing (double clicking) to quickly zoom into a region
around the bin. To zoom out, just double click outside the bin.
Chapter 7 DosPlot
The DosPlot is a graph showing one or more dosage quotients (only the
activated reads are shown).
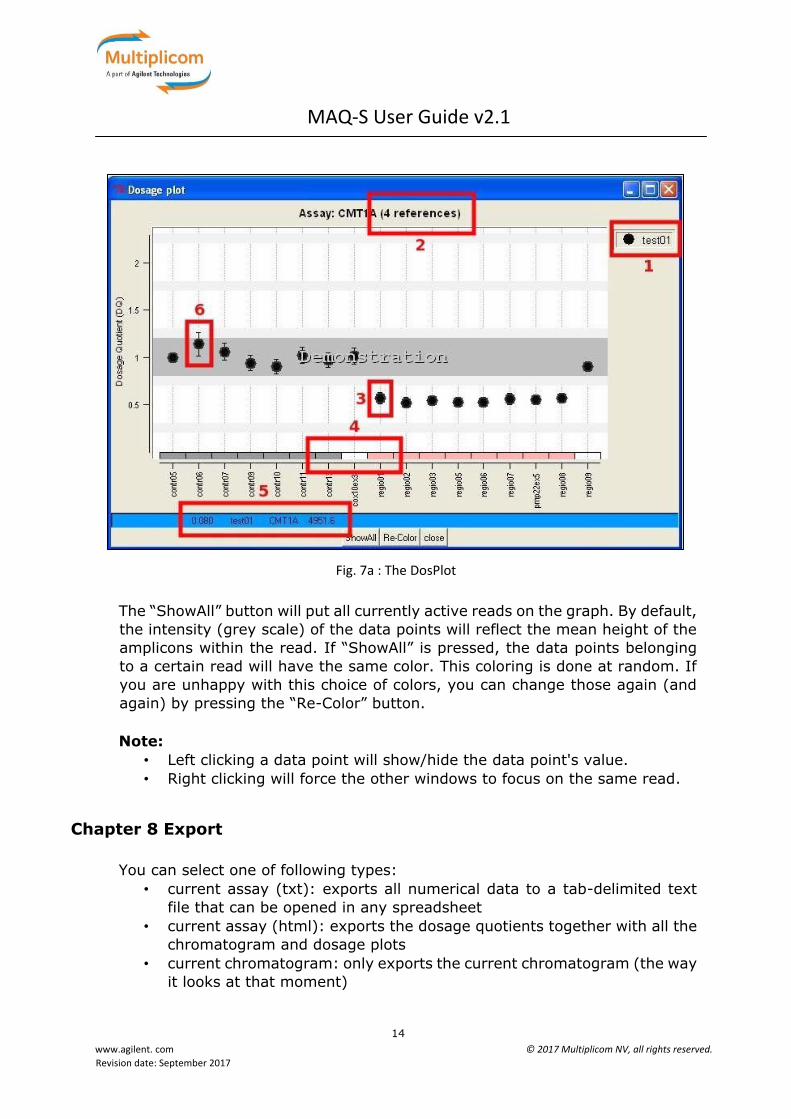
7.1. What's on the DosPlot
Figure 7a:
Holds the reads label
Shows how many (if any) controls are set at the moment
One data value (its intensity resembles the mean height; the more dark the
better)
The type of amplicon:
• gray: good, stable control amplicon
• striped gray: bad, unstable control amplicon
• white: target amplicon (no dosage change)
• colored: target amplicon (dosage change)
General information of the current read (Q, label, assay, meanH)
One data value and its standard deviation error flag
MAQ‐S User Guide v2.1
14
www.agilent. com © 2017 Multiplicom NV, all rights reserved.
Revision date: September 2017
The “ShowAll” button will put all currently active reads on the graph. By default,
the intensity (grey scale) of the data points will reflect the mean height of the
amplicons within the read. If “ShowAll” is pressed, the data points belonging
to a certain read will have the same color. This coloring is done at random. If
you are unhappy with this choice of colors, you can change those again (and
again) by pressing the “Re-Color” button.
Note:
• Left clicking a data point will show/hide the data point's value.
• Right clicking will force the other windows to focus on the same read.
Chapter 8 Export
You can select one of following types:
• current assay (txt): exports all numerical data to a tab-delimited text
file that can be opened in any spreadsheet
• current assay (html): exports the dosage quotients together with all the
chromatogram and dosage plots
• current chromatogram: only exports the current chromatogram (the way
it looks at that moment)
Fig. 7 a : The DosPlot
MAQ‐S User Guide v2.1
15
www.agilent. com © 2017 Multiplicom NV, all rights reserved.
Revision date: September 2017
• current DosPlot: only exports the current DosPlot (the way it looks at
that moment)
• assay description file: exports the current (changed) assay to a file
Note:
• It's imperative that you know that if you export a graph, it will export it
the way it looks at THAT moment (e.g. colors and size). Altering the look
is done by changing the Settings.
• Only the first chromatogram graph will be exported, even if you have
more than one chromatogram graph in the main window.
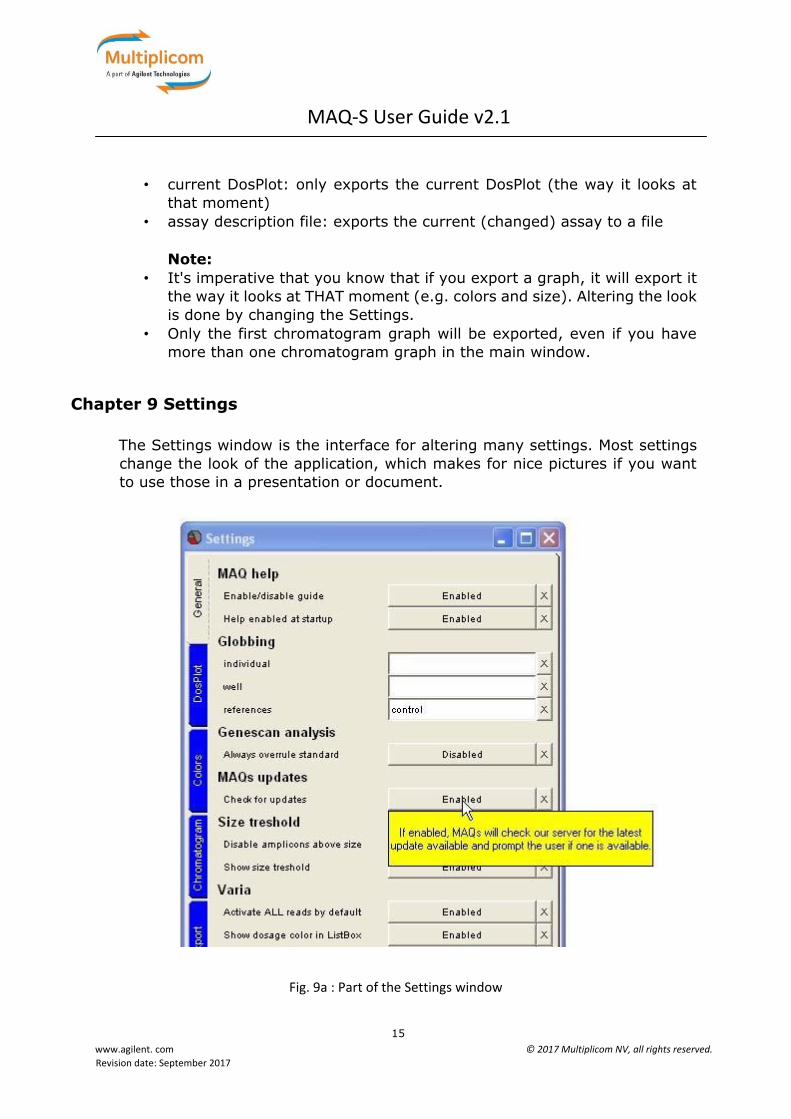
Chapter 9 Settings
The Settings window is the interface for altering many settings. Most settings
change the look of the application, which makes for nice pictures if you want
to use those in a presentation or document.
Fig. 9a : Part of the Settings window

MAQ‐S User Guide v2.1
16
www.agilent. com © 2017 Multiplicom NV, all rights reserved.
Revision date: September 2017
Important:
If you have questions about a certain setting, or you are not sure what it does,
turn on the help feature and move your mouse over the setting. Most likely, it
will give a brief description.
Chapter 10 License
MAQ-S is license-free for Multiplicom customers.
Note:
• The License File is created based upon the Key.bin file and thereby only
valid for the computer the Key.bin file was created on.
• MAQ assay description files will be handed over together with the kits.
• MLPA assay description files can be obtained after contacting us.
Chapter 11 Demo
You can also trial the application in its full functionality using a limited set of
data files. This limited set of data files are files that are delivered with the
package and can be found in the DemoFiles folder. Before you can start the
MAQ-S demo, you first must create a 'Key.bin' file by pushing the “Create Key”
button found in the Import window. After this, the application will ask you for
a License key, which you probably will not have. You can ignore this comment
if you want to analyze the demo files. Without a valid License File, however, no
other data files besides these demo files can be analyzed.
Note:
While using the Demo, all graphs will display the Demonstration tag.
This tag will be removed after a valid license has been obtained.
Chapter 12 More help
12.1. MAQ-S Help features
MAQ-S holds 2 types of help: the guide and help balloons.
• The guide will try to determine what you should do next, and it will notify
you through flashing objects and comments in the Comment Bar.
• The help balloons will show more information (if available) about the
object currently under the mouse pointer.
MAQ‐S User Guide v2.1
17
www.agilent. com © 2017 Multiplicom NV, all rights reserved.
Revision date: September 2017
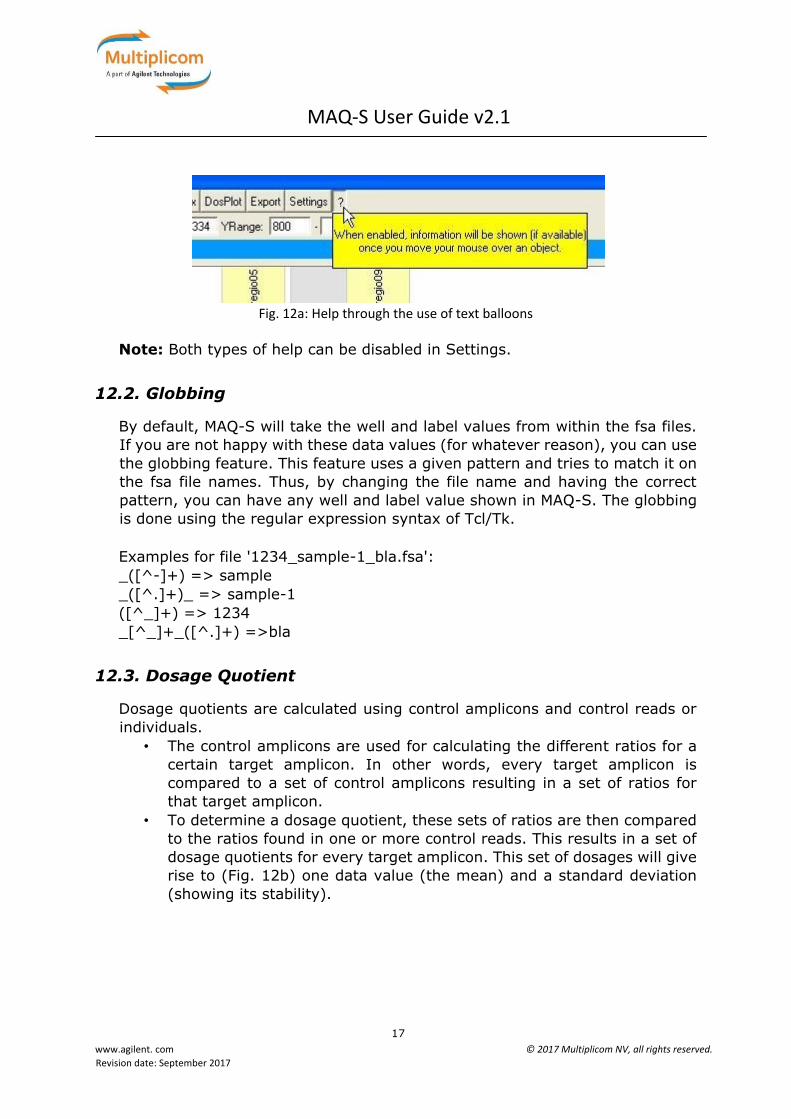
Fig. 12a: Help through the use of text balloons
Note: Both types of help can be disabled in Settings.
12.2. Globbing
By default, MAQ-S will take the well and label values from within the fsa files.
If you are not happy with these data values (for whatever reason), you can use
the globbing feature. This feature uses a given pattern and tries to match it on
the fsa file names. Thus, by changing the file name and having the correct
pattern, you can have any well and label value shown in MAQ-S. The globbing
is done using the regular expression syntax of Tcl/Tk.
Examples for file '1234_sample-1_bla.fsa':
_([^-]+) => sample
_([^.]+)_ => sample-1
([^_]+) => 1234
_[^_]+_([^.]+) =>bla
12.3. Dosage Quotient
Dosage quotients are calculated using control amplicons and control reads or
individuals.
• The control amplicons are used for calculating the different ratios for a
certain target amplicon. In other words, every target amplicon is
compared to a set of control amplicons resulting in a set of ratios for
that target amplicon.
• To determine a dosage quotient, these sets of ratios are then compared
to the ratios found in one or more control reads. This results in a set of
dosage quotients for every target amplicon. This set of dosages will give
rise to (Fig. 12b) one data value (the mean) and a standard deviation
(showing its stability).
MAQ‐S User Guide v2.1
18
www.agilent. com © 2017 Multiplicom NV, all rights reserved.
Revision date: September 2017
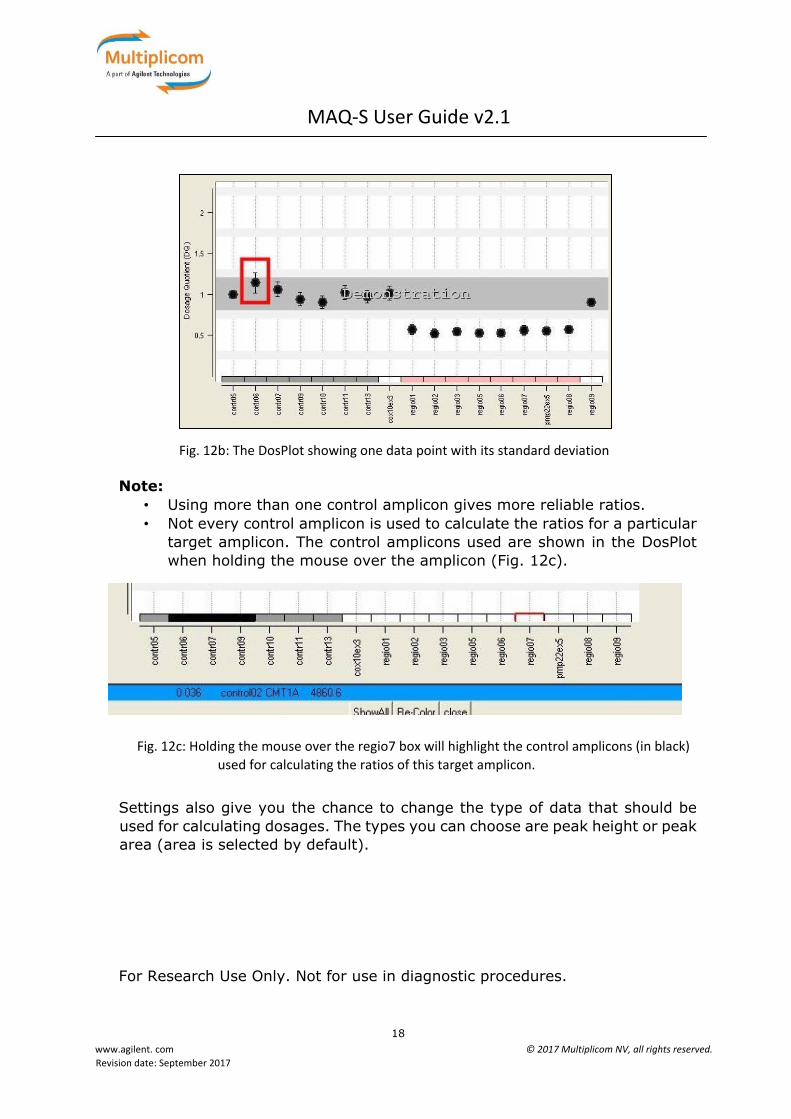
Fig. 12b: The DosPlot showing one data point with its standard deviation
Note:
• Using more than one control amplicon gives more reliable ratios.
• Not every control amplicon is used to calculate the ratios for a particular
target amplicon. The control amplicons used are shown in the DosPlot
when holding the mouse over the amplicon (Fig. 12c).
Fig. 12c: Holding the mouse over the regio7 box will highlight the control amplicons (in black)
used for calculating the ratios of this target amplicon.
Settings also give you the chance to change the type of data that should be
used for calculating dosages. The types you can choose are peak height or peak
area (area is selected by default).
For Research Use Only. Not for use in diagnostic procedures.