manjunath, sandhya c - libres.uncg.edulibres.uncg.edu/ir/uncg/f/manjunath_uncg_0154m_10315.pdf ·...
TRANSCRIPT

MANJUNATH, SANDHYA C., M.S. Isotopic Probe for Spectroscopic Studies of Heme. (2009) Directed by Dr. Gregory M. Raner. pp. 59
Cytochrome P450 enzymes (P450s) are heme containing monooxygenases with
great potential in applications focused in biotechnological areas. An understanding of the
precise chemical process behind this enzyme is essential in research in the areas of
pharmaceuticals and biochemistry. In order to get a better understanding of P450s, it is
important to provide spectroscopic characterization of the electron spin distributions
within the heme macrocycle. Paramagnetic NMR has been shown to be a powerful tool
for probing electronic distribution and spin-densities within the heme macrocycle.
Selective incorporation of 13C may facilitate the use of 13C-NMR in the study of P450
monooxygenase. Furthermore, selective labeling with 15N or 2H at specific positions
within the heme group maybe also be useful in the application of other spectroscopic
techniques when applied to P450 enzymes. All of these labeling studies could be
accomplished using a recombinant expression system involving a strain of E.coli which
cannot produce aminolevulinic acid (ALA), a biosynthetic heme precursor. By
synthesizing 2H, 13C or 15N labeled ALA, incorporation of these isotopes into the heme of
dehaloperoxidase, a model heme protein, via the biosynthetic pathway of the heme
cofactor maybe accomplished. A successfully method was developed to make 2H-ALA in
a way that is both economical and time efficient, and the relative ability of this expression
system to incorporate 2H into the heme was evaluated, relative to 13C or 15N.
ISOTOPIC PROBE FOR SPECTROSCOPIC STUDIES OF HEME
by
Sandhya C. Manjunath
A Thesis Submitted to the Faculty of The Graduate School at
The University of North Carolina at Greensboro in Partial Fulfillment
of the Requirements for the Degree Master of Science
Greensboro 2009
Approved by
________________________ Committee Chair

To my Amma and Appa,
Thank you for your love, encouragement, and support,
and to Madhura,
for always believing in me and for your love and affection.
Without you three, I would not be where I am today.
ii
APPROVAL PAGE
This thesis has been approved by the following committee of the Faculty of The
Graduate School at The University of North Carolina at Greensboro.
Committee Chair
Committee Members
_______________________________ Date of Acceptance by Committee _______________________________ Date of Final Oral Examination
iii

ACKNOWLEDGEMENTS
I would like to express my deepest gratitude to Dr. Greg Raner for his guidance
and support through my graduate work at UNCG. I would also like to thank my other
committee members Dr. Alice Haddy and Dr. Nadja Cech for their valuable comments
and assistance through my graduate work. Thanks also goes to Dr. Liam Duffy for letting
me work in his lab for a year and for letting me play with liquid helium. I would also like
to thank all the Professors who have helped me professionally and also as a student at
UNCG.
I would like to thank my lab mates, and my fellow graduate students for their
support. Special thanks to Molly, Jackie, Lauren and Brian for helping me in every step
of the way.
Without my family and friends, I would never have been able to come this far.
First, thanks to both of my Ajja and Ajji, to all my aunts and uncles, and my cousins. To
Suganthi, Srikanth, Bala and Kalai, thank you for your encouragements, your kind words
and support. To Komal, Amanda, Kim and Laura, thank you for just being there when I
needed you and for being great friends.
Finally, I could not have done this work without Vamsi. Thank you for running
my MS samples, for your support, and most of all for having faith in me.
iv

TABLE OF CONTENTS
P a g e
LIST OF TABLES………………………………………………………………………vii
LIST OF FIGURES……………………………………………………………………viii
CHAPTER
I. INTRODUCTION…………………………………………………….................1
I.A. General overview of cytochrome P450………………………………1 I.B. Escherichia coli Hu227 and dehaloperoxidase…………………........4 I.C. Active site of CYP450BM3 and transient intermediates…….…….......7 I.D. NMR studies of isotopically labeled heme………………………....10 I.E. Synthesis of deuterium labeled aminolevulinic acid…………..…13
II. EXPERIMENTAL…………………………………………………………15 II.A. Preparation of Luria-Bertani broth (LB) media CaCl2 solution and LB-agar plates.………………………………15 II.B. Growing Hu227 untransformed cells in LB media……………16 II.C. Procedure for making competent Hu227 cells…………………16 II.D. Plasmid purification of 102A2 from BL-21; BM3F87G from HB101………………………………………………….……18 II.E. Procedure for transformation of Hu227 cells with p102A2, and pBM3F87G plasmids………………………………19 II.F. Preparing and sterilization of Terrific Broth (TB) media and expression and harvesting of BM3F87G cells……………………20 II.G. Synthesis of deuterated aminolevulinic acid (2H-ALA) ……………21 II.H. Growing Hu227/DHP using synthesized 2H-ALA…………………23 II.I. Extraction of heme from DHP for LC-MS data … … … … … … … 2 4 II.J. Purification of 2H-DHP by anion exchange DEAE column………25 II.K. Preperation of EPR samples……………………………………26 II.L. Extraction of heme from DHP for MALDI data ……………………26
v

III. RESULTS AND DISCUSSION……………………………………..............28
III.A. Synthesis of 2H-aminolevulinic acid (2H-ALA)…………………28 III.B. Alternative method to make deuterium-ALA (2H-ALA)…………33 III.C. Plasmid purification results………………………………………36 III.D. Dehaloperoxidase expression levels and purification……………39 III.E. Electron paramagnetic resonance spectroscopy…………………42 III.F. LC-MS analysis of isotopically labeled heme from dehaloperoxidase…………………………………………………..45 III.G. MALDI-TOF analysis of isotopically labeled heme from dehaloperoxidase…………………………………………………50
IV. CONCLUSIONS……………………………………………………………55
REFERENCES…………………………………………………………………………58
vi

LIST OF TABLES
Page
III.1. The available literature values, the chemical shift assignments and 1H-NMR data for the synthesized 2H-phthalylglycine……………………………29 III.2. The available literature values, the chemical shift assignments and 1H-NMR data for the synthesized 2H-phthalimidoacetyl chloride…….…………30 III.3. The available literature values, the chemical shift assignments and 1H-NMR data for the synthesized 2H-phthalimidolevulinic acid ethyl ester………32 III.4. The available literature values, the chemical shift assignments and 1H-NMR data for the synthesized 2H-aminolevulinic acid………………………..33
vii

LIST OF FIGURES
Page
I.1. The catalytic cycle of cytochrome P450…………………………………………3
I.2. Structure and numbering of protoheme IX………………………………………4
I.3. Expected labeling patterns of 4 and 5-13C-ALA…………………………………5
I.4. Biosynthetic pathway of heme. ……………………………………..………………..7
I.5. Proposed isoporphyrin intermediate in the reaction of 3-PBA……………………9
I.6. Typical porphyrin core 13C chemical shifts………………………………………..11
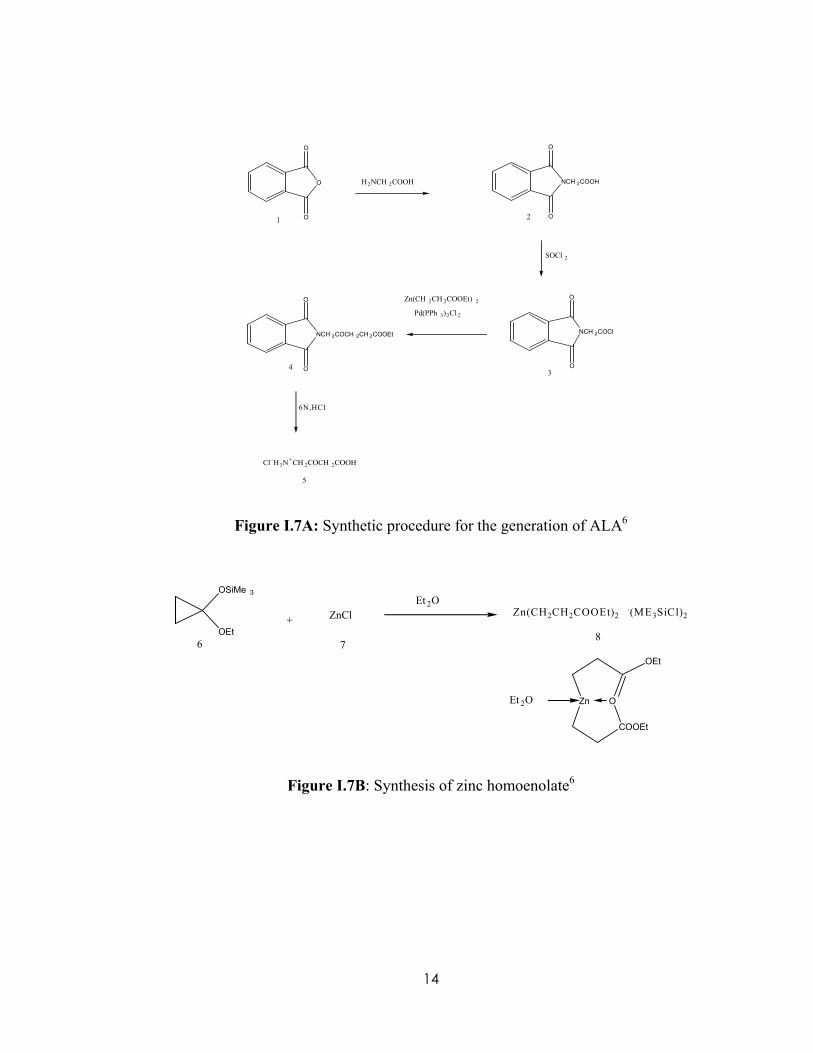
I.7.A. Synthetic procedure for the generation of ALA…………………………………14
I.7.B. Synthesis of zinc homoenolate……………………………………………………14
III.1. Synthesis of 2H-phthalylglycine from phthalic anhydride and 2,2-D2 glycine…29
III.2. Synthesis of 2H-phthalimidoacetyl chloride from phthalylglycine and thionyl chloride………………………………………….….30
III.3. Synthesis of 2H-phthalimidolevulinic acid ethyl ester from 2H-phthalimidoacetyl chloride and zinc homoenolate……………………………31
III.4. Synthesis of 2H-ALA from acid hydrolysis of 2H-phthalimidolevulinic acid ethyl ester………………………………………….33
III.5. 1H-NMR spectra of regular ALA…………………………………………………34
III.6. 1H-NMR spectra of synthesized 2H-ALA…………………………………………35
III.7. Diagram of regular ALA and deuterium-labeled ALA……………………………35
III.8. Agarose gel electrophoresis comparing two different methods to make pT7…….38 III.9. Agarose gel electrophoresis of plasmid controls…………………………………38
III.10. Absorbance spectrum of CO-reduced P450 BM3F87G in whole cells………39
viii

III.11. Absorption difference spectrum of CO-reduced heme complex of purified DHP in whole cells……………………….…………………………………….40
III.12. Absorption difference spectrum of CO-reduced heme complex of purified
[5-13C] DHP in whole cells……...………………………………………………41
III.13. Absorption difference spectrum of CO-reduced heme complex of purified 2H-DHP in whole cells…………..……………………………………………42
III.14. Absorption spectrum of 15N -DHP, [4-13C] DHP, [5-13C] DHP and
pure DHP in preparation for EPR analysis ………………………………...…43 III. 15. EPR spectra of DHP samples at X-band in the g=2 region using 0.5mW
microwave power, a field sweep from 500 to 4000 G modulation amplitude of 15G, and temperature of 10K…………………………………….44
III. 16. EPR spectra of DHP samples at X-band in g=6 region using 0.5mW microwave power, a field sweep from 500-1600 G modulation amplitude of 15G, and temperature of 10K……………….……………………45
III.17. HPLC purified heme from dehaloperoxidase observed at 398 nm…….…………47
III.18. LC-MS selective ion chromatogram (615.5 - 616.5) of purified isotopically labeled heme from DHP for blank, DHP expressed in unlabeled ALA, 13C-DHP overexpressed in [5-13C] ALA and 2H-DHP overexpressed in 2H-ALA…………….………………………………48
III.19. LC-MS selective ion chromatogram (623.5 - 624.5) of purified
isotopically labeled heme from DHP for blank, DHP expressed in unlabeled ALA, 13C-DHP overexpressed in [5-13C] ALA and 2H-DHP overexpressed in 2H-ALA…………………………………………….49
III.20. MALDI-TOF spectrum of 13C labeled heme from DHP, displaying
a major peak at 616 m/z and a minor peak at 624 m/z……………………..…50 III.21. MALDI-TOF spectrum of unlabeled heme from DHP, displaying
a major peak at 616 m/Z………………………………………………………...52
ix

x
III.22. MALDI-TOF spectrum of 13C labeled heme from DHP, displaying a major peak at 624 m/Z…..................................................................................53
III.23. MALDI-TOF spectrum of 2H labeled heme from DHP, displaying a major peak at 616 m/Z………………………………………………………54

CHAPTER I
INTRODUCTION
I.A. General overview of cytochrome P450
Iron serves important functions in the human body; therefore many important
proteins contain heme as a prosthetic group, which means it contains an iron atom in the
center of a large heterocyclic ring called a porphyrin. Cytochrome P450 (CYP450) is a
diverse family of a metalloproteins containing a heme prosthetic group that is bound to
the protein via thiolate ligation of a protein Cys residue1. CYP450 belongs to a group of
monoxygenase enzyme that catalyzes many biological reactions in bacteria, plants and
animals. It is also responsible for the metabolism of many endobiotic metabolisms such
as testosterone, progesterone and they also play an important role in the xenobiotic
metabolism in humans.
There are the two general classes that P450 enzymes can be split into, class I,
which consists of most bacterial P450s and class II, which includes mammalian P450s.
Class I P450’s are cytosolic in nature with a lot of applications focused in the field of
biotechnology. Studies on microsomal P450s tend to aim at understand xenobiotic
metabolism in humans which is a major component in the field of pharmacology.
CYP450 has a big role in metabolism of pharmaceuticals and contribute to the
1

biotransformation of a biologically active parent compound2. This process generally
leads to less active metabolites that are more easily eliminated from the body.
The name cytochrome P450 has been given to this class due to the fact that these
proteins all have reduced-CO complexes with an absorption peak with a λ max at 450
nm1,2,3. The CO binding pigment has a red shift when reduced and bound to CO whereas
most heme proteins have a blue shift when reduced and bound to CO. In the reaction
mechanism of P450 containing system, the active site of CYP450 contains a heme iron
center. The reaction mechanism of the P450 family is a cyclic reaction that involves the
reduction and oxidation of the central heme iron by incoming electrons, donated from
nicotamide adenine dinucleotide phosphate (NADPH). The catalytic cycle of CYP450 is
shown below in Figure I.1. The reaction takes place with the binding of a substrate to the
active site which causes the heme to go from its ferric hexa-coordinated (low-spin) state
to the ferric penta-coordinated (high spin) state. The second stage in the cycle is the
reduction of the heme iron to the ferrous state by a single electron transfer from NADPH.
In the third step, molecular oxygen binds rapidly to the metal center forming a Fe2+-O2
complex, which undergoes a slow conversion to a more stable Fe3+-O2°- complex. In the
fourth step, there is a second reduction in which a second electron is accepted from the
reductase and forms a ferric-peroxide complex, (Fe-O) 3+. This is a very unstable complex
so in the next step, it is rapidly protonated and forms a hydroperoxo-ferric intermediate,
which then is protonated again to release water and produces a reactive oxo-ferryl
intermediate. In the next step, a ferryl-oxo species reacts with substrate to form a
2

hydroxylated product. This product is released from the active site and replaced by the
water2.
FeIII
O
HH
RH
FeIII
FeII
O2
FeIII
O
O-
e-
FeIII
O
O2-
FeIII
O
OH
H+
FeIV
O
H+
H2O
FeIII
O
R H
e-
Catalytic Cycle of P450
2
3
4
5(A)
5(B)
6
7
1
Figure I.1: The catalytic cycle of cytochrome P4502
As indicated previously, the active site of P450 contains an iron protoporphyrin
IX group where oxygen is activated and substrate oxidation occurs. The numbering
system of heme and its structure is found below in Figure I.2. The dots on the figure
represent the four meso positions and are labeled with Greek letters α, β, γ, and δ. The
core carbons (located in the pyrrole rings) have a separate system of numbering. For
3

example, the first carbon away from the meso carbon (Cm) is called Cα and the second
carbon away from the meso carbon is Cβ4. Shown in figure below is an iron atom in
center of protoporphyrin ring bound to four nitrogen atoms from the pyrrole rings. In the
current work an attempt was made to label various positions on the heme with stable
isotopes.
Cmα
Cmδ Cmβ
Cα
Cβ
Cmγ
Figure I.2: Structure and numbering of protoheme IX4
I.B. Escherichia coli Hu227 and dehaloperoxidase
Our attempts to label the heme in P450 involve utilization of a specialized strain
of E.Coli. Hu227 strain is a mutant strain which contains a mutation in the HemeA gene,
which codes for the enzyme glutamyl-tRNA (GTA) reductase11. GTA reductase is
responsible for the reduction of glutamyl-tRNA to glutamyl-1-semialdehyde (GSA). The
next reaction by GSA – aminotransferase converts GSA to aminolevulenic acid (ALA),
which is the biosynthetic precursor to heme. Hu227 strains cells cannot synthesize ALA
4

naturally, so the cultures of this strain must be supplemented with ALA to produce and
grow. Previously in our lab, 4-13C and 5-13C ALA were synthesized and included in
growth media for Hu227 cells instead of regular ALA. The predicted pattern for ALA
using the 13C labeled in positions 4 and 5 is shown below in Figure I.3. The asterisk
represents the 13C labeled carbons.
H2N OH H2N O
OO
OO
4-13C - ALA 5-13C-ALA
* * H
Figure I.3. Expected labeling patterns of 4 and 5-13C-ALA
Initial attempts to express heme containing proteins using this recombinant
system focused on an enzyme from a related class of heme proteins. Dehaloperoxidase
(DHP) is an enzyme found in a marine worm, Amphitrite ornate. DHP is a globular
5

heme-containing enzyme that provides the marine worm with the ability to catalyze the
oxidative dehalogenation of halogenated phenols12. Studies using UV-Visible absorption
have demonstrated that exogenous ligand-ferric DHP is hexa-coordinated with water and
has a proximal neutral histidine as axial ligand. It was proposed that this state activates
the peroxide through an electron push-effect mechanism12. By synthesizing deuterium
labeled ALA, incorporation of 2H into the heme of dehaloperoxidase via the biosynthetic
pathway of the heme cofactor may be accomplished. This will open up the door for
production of P450 enzymes to be used in biochemical studies involving P450 deuterium
isotope effects aimed at understanding the deformylation of aldehydes.
In E.coli the biosynthesis of heme starts with the condensation of one glycine and
one succinyl-CoA to form δ-aminolevulinic acid (ALA). Next is the condensation of two
ALA molecules, catalyzed by ALA dehydratase enzyme, also called Porphobilinogen
Synthase which forms porphobilinogen (PBG), as shown in Figure I.413. The four PBG
molecules are then condensed by PBG deaminase (by elimination of the amino group) to
form a 1-hydroxymethylbilane (HMB). This is then converted to uroporphrinogen III
(Uro’gen) by uroporphyrinogen III synthase. The conversion from Uro’gen to
protoporphyrin IX happens in several steps. First, the four acetyl side chains on Uro’gen
are decarboxylated by Uro’gen decarboxylase which converts them to methyl groups and
yields coproporphyrinogen III (Copro’gen). Two of the four propionyl groups undergo
oxidative decarboxylation converting them to vinyl groups by Copro’gen oxidase which
yields protoporphyrinogen IX. In the next step there is an oxidation of
protoporphyrinogen IX, which adds more double bonds by removing six hydrogen atoms
6

to give protoporphyrin IX catalyzed by protoporphyrinogen oxidase. In the next step,
Fe2+ is inserted to protoporphyrin IX by ferrochelatase.
Figure I.4. Biosynthetic pathway of heme14. The highlighted atom represents 13C
I.C. Active site of CYP450BM3 and transient intermediates
As mentioned before, CYP450 is a class of monoxygenase enzyme, and studies
relevant to these particular enzymes have been designed to gain a better mechanistic
understanding of this human drug metabolizing systems. CYP450BM3 isoform is a fatty
acid hydroxylase that uses NADPH and one molecule of molecular oxygen which
7

oxidizes long chain fatty acids. It is a member of the class II P450s, making it an
important model for the human drug metabolism of P450’s. The BM3 enzyme is a single
polypeptide, has a deep nonpolar pocket leading to heme center. The x-ray crystal
structure of BM3 active site shows that there is a phenylalanine residue at position 87 and
that iron at the heme center is bound to protein by a cysteine-thiolate linkage. Removing
this Phe-87 from the active site and replacing it with any other amino acid with a smaller
nonpolar side chain enhances the BM3 enzyme in the oxidation of aromatic substrates9.
Li and colleagues replaced the Phe-87 with alanine and glycine and noticed that the
hydroxylation of p-nitrophenoxydodeconoic acid (12-pNCA) was markedly increased.
Prior studies have shown that P450BM3 with a F87G mutant modification of the
heme using aromatic aldehydes results in altered catalytic activity rather than inactivation
of the enzymes10. Raner et al. also performed a similar study using stopped-flow
experiment to determine different intermediates in the heme reaction involving CYPBM3
F87G with 3-phenylpropianaldehyde (3-PPA) or 3-phenylbutyraldehyde (3-PBA) as
substrates8. This study showed that the aldehydes lost the carbonyl carbon and the heme
cofactor was alkylated at the γ meso position, in the course of this reaction as shown in
Figure I.5.
8

Figure I.5. Proposed isoporphyrin intermediate in the reaction of 3-PBA8
One of the long term goals for this project was to develop technology that would
be useful in the identification of transient intermediates in the peroxo-pathway for
P450BM3-F87G. The hypothesis is that in the presence of hydrogen peroxide and an
aldehyde substrate, P450BM3-F87G will form a transient peroxy-hemiacetal intermediate,
which decomposes to form an isoporphyrin intermediate. Heme alkylation occurs in this
reaction which proceeds with the formation of γ-meso isoporphyrin intermediate that
must decay with the deprotonation at the γ-meso carbon. This deprotonation should show
a fully expressed deuterium isotope effect in the stopped-flow experiment. To address
this issue, deuterium (2H) labeled aminolevulinic acid (ALA) was synthesized for the
incorporation of deuterium into the meso heme positions. Experiments described in this
9

thesis were designed to evaluate the ability of E.Coli to utilize ALA, synthesized with 2H-
labeles to produce a deuterated heme cofactor in order to probe.
I.D. NMR studies of isotopically labeled heme
Isotopic labeling with 13C or 15N may also be useful for NMR studies. The
spectroscopic properties of any heme-protein usually result from the heme cofactor,
which are related in turn to the electronic state of the central iron and the porphyrin itself.
A low spin state exists, for example, when water is coordinated to the central iron in the
axial position. A high spin state occurs when this water is removed, leaving iron existing
as a pentacoordinated species1. These two spin states have distinct spectral patterns which
allow the use of visible absorption spectrophotometry to monitor changes. Different
forms of spectroscopy are also useful, along with UV/Vis, to probe minor changes in
axial ligation and/or oxidation states of the heme group.
10

Figure I.6. Left: Typical porphyrin core 13C chemical shifts. (a) FeIII-porphyrinates with the S = ½, dπ electron configuration, (b) FeIII-porphyrinates with the S = ½, (dxy)1
electron configuration, and (c) FeIII-porphyrinates with the S = ³/², (dxy)2(dxz,dyz)2(dz2)1
electron configuration. Right: Schematic representation of the 3a2u(π) and 3e(π) porphyrin orbitals. Relative sizes of the circles at each atom are proportional to the calculated electron density5.
Caignan and his collegues conducted a study with hydroxide complex of
Pseudomonas aeruginosa heme oxygenase (HO) containing 13C labled heme, in which an
OH served as a model for the OOH ligand of the FeIII-OOH intermediate. In this study,
they conclude that 13C NMR chemical shifts can be used to determine the heme electronic
structure5. As shown in Figure I.6.(a), the Cβ has the furthest downfield shift, indicating
that the major electron density is located on Cβ in S = ½, dπ electron configuration have
11

spin delocalization into porphyrin 3e(π) orbital. Due to a very small shift, Cα has a small
amount of unpaired density and Cm has no unpaired density. Ferrihemes with S = ½,
(dxy)1 electron configuration, on the other hand, have majority of their spin delocalization
in the porphyrin 3a2u(π) orbital, suggesting in Figure I.6(b), that most of the electron
density is located on the Cm due to the substantial downfield shift. Ferriheme with S = ³/²,
(dxy)2(dxz,dyz)2(dz2)1 electron configuration has a significant amount of electron density
on Cβ and Cα as indicated by the downfield shift, and Cm has no electron density.
Since there are many questions concerning the electronic structure of heme in
P450, conducting studies that will probe spin distribution using 13C-NMR paramagnetic
spectroscopy will be useful in future applications. In particular, 13C-labeling of heme
cofactor will provide a method of exploring the electronic spin density across the
porphyrin backbone. One of the drawbacks is that using 1H-NMR is not helpful when
probing paramagnetic hemoproteins and spin states. Previously, our lab successfully
synthesized 13C-labeled aminolevulinic acid (ALA), a heme precursor, at positions 4 and
5 and 15N has also been incorporated at the pyrrole nitrogens. E.Coli Hu227 bacterial cell
line was used due to the inability of these cells to produce ALA. Using mass
spectrometery, it was demonstrated that the mass of 13C-labeled heme increased by 8
mass units and 15N-labeled heme increased by 4 mass units, as predicted based on the
known biosynthetic pathway in E.Coli. However, the 13C MS data was slightly
ambiguous. In the current study, the goal was to use ESI-MS to clearly show 13C
incorporation in the heme. This technology will allow for the evaluation of electronic
distribution within the heme cofactor of P450 enzymes using 13C paramagnetic NMR.
12

I.E. Synthesis of deuterium labeled aminolevulinic acid
For synthesizing deuterium-labeled aminolevulinic acid (2H-ALA), the procedure
of Wang and Scott6 was chosen with slight modification. The reaction scheme of the
synthesis is shown in Figure I.7A. The synthesis of 2H-ALA starts with labeled glycine
and is protected by phthalic anhydride to yield phthalylglycine. Phthalylglycine is then
treated with thionyl chloride to yield phthalimidoacetyl chloride. The next step requires
that the phthalimidoacetyl chloride be coupled with zinc homoenolate. A palladium
catalyst is used in order to form phthalimolevulic acid ethyl ester. But to get to the last
step, the zinc homoenolate had to be synthesized by reacting [(1-ethoxycyclopropyl)-
oxy]trimethylsilane with zinc chloride in dry ether, which can be seen in Figure I.7B The
zinc homoenolate then reacts with phthalimidoacetyl chloride to yield phthalimolevulic
acid ethyl ester. In the next step, acid hydrolysis of phthalimolevulic acid ethyl ester with
hydrochloric acid yields labeled aminolevulinic acid (ALA). For the pupose of this
project, 2,2-D2 Glycine was used as the starting material to ultimately generate 2H labeled
ALA.
13
14
O
O
O
NCH 2COOH
O
O
NCH 2COCl
O
NCH 2COCH 2CH 2COOEt
O
O
Cl -H3N+CH 2COCH 2COOH
H2NCH 2COOH
SOCl 2
Zn(CH 2CH 2COOEt) 2
Pd(PPh 3)2Cl 2
6N,HCl
1 2
34
5
O
Figure I.7A: Synthetic procedure for the generation of ALA6
OSiMe 3
OEt
ZnCl Zn(CH2CH2COOEt)2 .(ME3SiCl)2
Zn O
COOEt
OEt
Et 2O
+
Et 2O
6 78
Figure I.7B: Synthesis of zinc homoenolate6

CHAPTER II
EXPERIMENTAL
II.A. Preparation of Luria - Bertani broth (LB) media, CaCl2 solution and LB-Agar plates
The LB media was prepared by adding 4 g of LB powder mixture to a total
volume of 200 mL of dH2O. A 80mM CaCl2 solution was prepared by adding 1.18 g of
Calcium Chloride to 100mL of dH2O. LB-Agar solution for the plates was prepared by
adding 3.75 g of agar and 5 g of LB powder to 250 mL of dH2O, and a magnetic stir bar.
All 3 solutions were sterilized for 15 min and allowed to cool at room temperature. Once
the solutions were sterilized, the LB-Agar solution was stirred room temperature on a stir
plate, and when it was cool enough to touch, 100 mg/L of ampicillin and 10 mg/mL of
ALA was added. Only 10 mg/mL of ALA was added to the LB media, with no
ampicillin. After that, the LB-Agar solution was poured in to the agar plates and once it
solidified, it was then placed in a 20°C refrigerator. The preparation of the media and the
sterilization of the media were done to grow non-virulent strain of E.Coli cell, Hu227.
15

II.B. Growing Hu227 untransformed cells in LB media
Sterile techniques were employed through the whole procedure when growing
Hu227 cells. Using a 25-mL pipette, a 25 mL aliquot of LB/ALA media was transferred
to a 50 mL Falcon tube. The media was then inoculated with the untransformed Hu227
cells and they were than shaken at 200 rpms at 37° C overnight. The following day, the
media was thick with growth.
II.C. Procedure for making competent Hu227 cells
E.Coli Hu227 cells were made competent with sterile techniques throughout the
preparative steps. 10 mL of the Hu227 thick media was then transferred to another 50 mL
falcon tube, along with 15mL of plain LB media. It was grown again for 30 min at 200
rpm, 37°C. The cell cultures were transferred over to 6 of the 1.5 mL microcentrifuge
tubes and were centrifuged for 1 min at 10,000 rpm. The supernatant was discarded and 1
mL of ice-cold sterile 80 mMCaCl2 was added to the pellet and the cells were then
suspended, very gently. Using chilled CaCl2 increases the permeability of the membranes
of the cells. The suspended pellets were centrifuged again for 1 min at 10,000 rpm. The
supernatant was discarded and the pellets were suspended in chilled CaCl2 solution and
placed on ice for 10 min. The tubes were centrifuged again for a min at 10,000 rpm and
resuspended in 200 µL of chilled CaCl2 and placed in -70°C for at least 3 hours before
taking it out for transformation. Using the protocol for Plasmid DNA Purification, the
QIAprep Spin Miniprep kit and a Microcentrifuge, both 102A2/BL-21 and
16

BM3F87G/HB101 were purified from overnight cultures of the respective cell lines
grown in the presence of appropriate antibiotic to ensure plasmid maintenance.
Another alternative method from Kotchoni et. al. was also used to make Hu227
cells competent15, since p102A2 was not expressing well with Hu227 competent cells
from the method above. For this experiment three seperate solutions had to be made in
advance. Solution I (50mM Glucose, 25mM Tris-HCl – pH 8.0, 10mM EDTA – pH 8.0)
was prepared by adding 4.5g of glucose, 1.5g of Tris, and 1.9g of EDTA to a 500 mL
deionized water. The pH of the solution was taken down to 8.0 with HCl and than
autoclaved. 4µg/mL lysozyme was also prepared in order to add into the solution I just
before use. Solution II (0.2M NaOH, 1% (w/v) SDS) was prepared by first making a
stock solution of 2M NaOH and a stock solution of 10% (w/v) SDS. The solution was
than prepared just before use by diluting to 0.2M NaOH and 1% (w/v) SDS and was
autoclaved. Solution III (8M Ammonium Acetate) was prepared by adding 61.6 g of
ammonium acetate to 100mL of deionized water and was also autoclaved.
An overnight culture was setup with 2mL of 102A2/BL-21and pT7po1 in a
2.5mL eppendorf tubes. The cells were centrifuged at 5000 g for 5 min at room
temperature. The pellets were then suspended in 200µL of Solution I, which contained
the freshly added lysozyme. The solution was incubated for 5 min in room temperature.
After 5 min of incubation, 400µL of freshly prepared Solution II was added and inverted
gently 6 times. Immediately, 200µL of Solution III was added and mixed gently. It was
then incubated on ice for 5 min and a white precipitate had formed. This was centrifuged
17

for 5 min at 10000 g and the supernatant was transferred to a new tube. To that
supernatant, 600µL of isoproponal was added and mixed gently and kept at room
temperature for 10 min. It was then centrifuged again for 5 min at 10000 g, but this time
the supernatant was discarded and the pellet was washed with 400µL of 70% (v/v)
ethanol. It was again centrifuged at 10000 g for 3 min, after which the supernatant was
discarded and the pellet was left to air dry for 30 min to get rid of the residual ethanol.
The pellet was resuspended in 30µL of 10mM Tris-HCl (pH 8.0) and was stored in -70°C
freezer.
II.D. Plasmid purification of 102A2 from BL-21; BM3F87G from HB101
Plasmid DNA Purification using the QIAprep Spin Miniprep kit and a
Microcentrifuge was used to purify both 102A2/BL-21 and BM3F87G/HB101. 102A2 in
BL-21 and BM3F87G in HB101 cells were centrifuged at 10000 rpms for 5 min in 1.5mL
centrifuge tubes. The supernatant was discarded and the procedure was repeated two
more times. After the third time, the pelleted bacterial cell was resupended in 250 µL of
Buffer P1 and transferred it to a microcentrifuge tube provided by the kit. Also added 250
µL of Buffer P2 and inverted the tube 6 times, and 350 µL of Buffer N3 and also inverted
the tube 6 times. Once everything was mixed properly, the solution was centrifuged for
10 min at 13,000 rpms. The supernatant from last step was transferred to QIAprep spin
column by decanting. It was then centrifuged for a minute to discard the flow-through. It
was then washed further to remove trace nuclease activity by adding 500 µL of Buffer PB
and centrifuging for a minute. The solution was again washed by adding 750 µL of
18

Buffer PE and centrifuged another minute. After discarding the flow-through, the
solution was centrifuged for an additional minute to remove the residual wash buffer, so
the residual ethanol will not inhibit subsequent enzymatic reactions. The spin column was
then transferred to a clean 1.5 mL microcentrifuge tube, to elute DNA by adding 50 µL
of Buffer EB. After letting the solution stand for a minute, it was then centrifuged for an
additional minute, and the purified 102A2 and BM3F87G plasmid was stored in -70°C
freezer.
II.E. Procedure for transformation of Hu227 cells with p102A2, and pBM3F87G
plasmids
Both Hu227 competent cells and plasmids 102A2 and BM3F87G were thawed
out on ice, and 200 µL of the competent Hu227 cells were transferred over to two of the
sterile 1.5 ml microcentrifuge tubes. Purified 102A2 plasmid (25µL) or BM3F87G
plasmid (25µL) was added to the 200 µL of Hu227 cells in separate tubes. The tubes
were flicked rapidly by hand several times to increase the efficiency. The tubes were then
incubated on ice for 30 min. After the incubation on ice, the solutions were transferred
over to a hot water bath with temperature of 42°C for 50 seconds. This was done in order
to heat shock the cells to increase the pores in the cells so it will be easier for the
plasmids to enter the cells. After the heat shock, the solutions were again placed on ice
for 2 minutes. After the incubation on ice, 900 µL of LB/ALA/Amp was added to the
mixture and incubated for an hour at 37°C shaking at 200 rpms. After an hour, 100 µL of
19

each growth mixture was streaked onto the already made LB/ALA/Amp plates. The
plates were then allowed to incubate overnight at 37°C.
II.F. Preparing and sterilization of Terrific Broth (TB) media and expression and
harvesting of BM3F87G cells
The TB media was prepared by mixing 47.6 g of TB powder to 1L of dH2O, in a
wide-mouth culture flask. The six flasks were then placed in an autoclave for
sterilization. Once the media was cool enough, 100 mg/L of ampicillin and 10 mg/L of
ALA was added to the media. After that, a single colony of BM3F87G/Hu227 cell was
used to inoculate all the cultures. The cultures were mixed in a gyroshaker at room
temperature with a shaking rate of 200 rpms. After 40 hours of agitation of the cultures,
the cells were induced with 150 mg/L of IPTG, for expression of the recombinant P450
and the speed was reduced to 70 rpms and left overnight. The cells were then harvested
by centrifuging the cells at 10,000 rpms for 10 min in the Beckman-Coulter centrifuge.
The supernatant was then discarded and the pellets were then suspended in 25 mL of 50
mM phosphate buffer (pH 7.4) and 15% glycerol. The solution was homogenized using a
glass homogenizer and 10 mg of lysozyme was added to the solution for cell lysis. It was
stirred for an hour at room temperature and the cell membranes were then broken by
using a sonicator. The solution was centrifuged at 18,000 rpm for 45 minutes, and the
supernatant stored in -70°C freezer.
20

II.G. Synthesis of deuterated aminolevulinic acid (2H- ALA)
Glycine-2,2-D2 was purchased from Cambridge Isotope Laboratories, Inc. dALA
was prepared by the procedure Wang and Scott described in their paper6. The scheme
used for this synthesis of ALA was presented in the Background, Figure I.7 (A) and
Figure 1.7 (B). A more detailed procedure for the synthesis of ALA is now presented.
Most of the reactions used were very sensitive to moisture, hence they were carried out
under an atmosphere of argon gas.
Glycine (1.0005g) was combined with phthalic anhydride (2.0087g) in a 50 mL
round bottom flask. Indirect heat was used to fuse the solids using a Bunsen burner.
Heating the solids for approximately 3 minutes caused the white powders to liquefy.
Soon after, solid crystals began forming on the inside of the flasks. The product was then
recrystallized from water and stored in the refrigerator. After 30 minutes, it was filtered
and the yield of the resulting product, phthalylglycine was 2.2548 g, 74.9% yield. It was
then stored in a desicator at room temperature.
Dried phthalylglycine (2.2541 g) and 12 mL of thionyl chloride was refluxed
overnight in a 25 mL round bottom flask. The reaction was carried out under continuous
argon gas flow in a 80°C oil bath. The liquid was then cooled and the thionyl chloride
was removed with a rotorvapor hooked to a vacuum. The resulting yellow powder was
analyzed by NMR and found to be the desired product phthalimidoacetyl chloride. The
overall yield of this product was 2.0632 g, 91.5% yield
21

In the subsequent step, zinc chloride (2.01g) was fused in a 100 mL round bottom
flask with indirect heat from Bunsen burner under vacuum, and cooled under vacuum to a
white solid. Approximately 30 mL of diethyl ether was added and the zinc chloride was
stirred at room temperature under argon gas flow. It was then refluxed at room
temperature for 2 hours to obtain a homogenous mixture. After that, 6.0 mL of dry [(1-
ethoxycyclopropyl)-oxy]trimethylsilane was added into the reaction drop wise with a
syringe. After 5 minutes of adding it slowly, the solution turned cloudy solution, and the
stirring was continued at room temperature for 1 hour. That was then followed by
additional reflux in a hot oil bath for 30 min to obtain the zinc homoenolate.
This solution was stirred further in an ice bath under argon gas. To this solution
Tetrakis (triphenylphosphine) palladium (155 mg) and phthalimidoacetyl chloride (2.0 g)
was added. After waiting for 30 min to obtain a homogenous mixture, 3 mL of N, N-
dimethylacetamide was added via a syringe very slowly. The solution was stirred at 0°C
for 1 hour and then stirred at room temperature for additional 2 hours under argon gas.
The solution was then evaporated using a Rotorvap, under vacuum. The light brown
residue was dissolved in 100 mL of dichloromethane and the solution was transferred to a
250 mL separatory funnel and washed with 50 mL of water. The aqueous fraction was
discarded and the dichloromethane fraction was again washed with 50 mL saturated NaCl
– water. The organic fraction was saved and dried overnight under vacuum. The oily-
orange solution that resulted was dried again using a Rotorvap under vacuum in an
attempt to attain the solid product, but each time, only an orange oil resulted. To obtain a
solid product, recrystallization from ethanol was attempted but again, no crystals were
22

produced. The speed-vac was again used to remove the solvent and the oily material was
again produced. An NMR spectra of the sample was taken, confirming the presence of
the product.
Phthalimidolevulinic acid ethyl ester (1.8134g) and 1:1 mix of hydrochloric acid:
acetic acid solution was placed in a 50 mL round bottom flask to reflux for 6 hours at
120°C. The deep yellow solution was evaporated using a Rotorvap under vacuum. To
remove excess acid, the solution was washed with 20 mL of water. The solid was then
taken up with 40 mL of water and transferred to a 125 mL seperatory funnel. To remove
phthalic acid, the aqueous fraction was washed with 25 mL of ethyl acetate four times.
The aqueous fraction was evaporated under vacuum to a brown-oily residue. To obtain
solid product, recrystallization from ethanol and diethyl ether was attempted, but no
crystals were produced. Recrystallization with acetone was also tried, but again no
crystals were produced. Finally, drop by drop of cold diethyl ether was used and kept to
freeze dry overnight to get 1.6613 g of white solid crystals. These were then stored at -
20°C in a glass vial.
II.H. Growing Hu227/DHP using synthesized 2H -ALA
Hu227 and DHP were grown according to what was described previously. The
media contained LB/2H-ALA/Amp and the DHP harboring E. Coli was used to inoculate
and cells were grown at 30°C at 200 rpms overnight. Once IPTG was added to induce
protein expression, the solution was centrifuged for 10 min at 10,000 rpm. The pellets
were then reconstituted with 50 mM, pH 7.4 phosphate buffer (PO43-). Then the cells
23

were lysed by adding 50 mg of Lysozyme and used a homogenizer to homogenize the
solution. It was then stirred at room temperature for an hour and was sonicated at full
speed for a minute, two times. The solution was again centrifuged for 45 min at 18,000
rpm. 1:1 ratio of 15% glycerol was added to the 2H-DHP supernatant and stored in -80°C
freezer.
II.I. Extraction of heme from DHP for LC-MS data
Once 2H-DHP supernatant was thawed, 3 mL of the supernatant was transferred
to a screw top test tube and 2M HCl (200 µL) was added to each of the test tube, and was
incubated at room temperature for 30 min, after which 2 mL of ethyl acetate was added to
one of the test tube, 2 mL of petroleum ether for 2nd of the 3 test tube, and 2 mL of
Isobutanol was added to the last test tube. Even though, a clear organic and aqueous layer
could be seen, they were all centrifuged for further clarity. Using a Pasteur pipette, the
organic layer was drawn out and some of the sample was evaporated under vacuum for 2
hours. The rest of the sample was saved for subsequent HPLC analysis and isolation. The
reddish pellet obtained was reconstituted with 60:40 Acetonitrile: water (1% TFA) for
both absorption spectra and HPLC chromatographic analysis. For LC-MS, the pellets
were treated either with the mobile phase (50:50 ACN: H20, 1% TFA), or with Methanol.
Since the LC-ESI results had a lot of impurities, the samples were processed by
HPLC and the fractions were collected between 1-15 minutes. The organic layer that was
saved in the above step was transferred to a HPLC glass sample vial. This was then
placed in the autosampler rack of a Shimadzu HPLC system equipped with a C8 column.
24

The flow rate for the column was 1.0 mL/min and the absorbance of the eluent was
observed at 398 nm. The mobile phase used was 60:40 mixture of ACN:H2O with 0.1%
TFA. The largest peaks were collected at retention times from 4 – 9 minutes and the
samples were evaporated under vacuum. The pellets were treated with methanol and the
data were obtained from LCQ Advantage Thermo Finnigan ion trap mass spectrometer
with electrospray ionization coupled to an Agilent HP1100 HPLC.
II.J. Purification of 2H-DHP by anion exchange DEAE column
The column was first washed with 20% EtOH and washed again with 20 mL of
50 mM phosphate buffer (PO43- )(pH 7.4), and was loaded with the crude cell lysated,
diluted 1:4 in 15% glycerol. The column was washed with 20 mL of 50 mM PO43- , 100
mM PO43- , 150 mM PO4
3- , and 200 mM PO43- buffer to generate a stepwise elution
gradient. The DHP protein, which adhered to the column during the 50 – 100mM
phosphate wash was eluted out. For both 150 mM PO43- and also 200 mM PO4
3- elution,
visible absorption spectra was taken and samples were stored in -80°C. For the
absorption spectrum, the sample was treated with CO gas and absorption between 400-
500 nm was recorded. After the background correction, a pinch of sodium dithionate was
added for both the sample and background, and an absorption spectrum was then taken.
This represents the reduced vs. reduced-CO difference spectrum for the enzyme.
25
II.K. Preparation of EPR samples
Previously in our lab, [4-13C] ALA DHP, [5-13C] ALA DHP, 15N-ALA DHP, and
pure DHP were prepared. In order to run an EPR spectrum on these samples, the enzyme
was oxidized to the ferric form using potassium ferricyanide to ensure a homogeneous
sample. Once the samples were thawed, they were treated with potassium ferricyanide at
which point the sample turned a reddish-yellow color. This sample was then passed
through a G-25 Sephadex column to remove excess ferricyanide. The red fraction was
extracted out and the yellow fraction (ferricyanide) was discarded. Once absorbance
spectra were taken for all four samples, the concentration of all of them had to be
normalized. After adjusting all of them to the same concentration, the samples were put
in clear fused quartz EPR tube and frozen in liquid nitrogen by immersing slowly over a
period of 15 to 20 seconds.
II.L. Extraction of heme from DHP for MALDI data
The DHP, 13C-DHP and 2H-DHP supernatant from the sample (3 ml) was
transferred to a screw top test tube and 1.5 mL of 1M HCl was added to each of the test
tube, so the heme could be released into the solution. It was incubated at room
temperature for an hour which produced a pinkish slurry solution. To this solution, 3 mL
of methyl ethyl ketone was added and each of the tubes was centrifuged for 30 min at
2500 rpm. After centrifugation, the organic layer was drawn out and the solution was
made ready for MALDI analysis. The matrix used was 12 µL of α-cyano-4-
hydroxycinnamic acid (CHCA) in 50% acetonitrile with 0.1% trifluoroacetic acid (TFA).
26

27
To spot the solution, 1µL of the DHP, 13C-DHP and 2H-DHP samples were added to
12µL of the matrix diluent (50% acetonitrile with 0.1% TFA) and a 12µL aliquot of the
matrix solution. From this sample, 0.5µL was spotted on a MALDI plate for analysis.
The samples were analyzed in an Applied Biosystems 4700 Proteomics Analyzer and this
analysis was conducted in reflector positive mode.

CHAPTER III
RESULTS AND DISCUSSION
III.A. Synthesis of 2H-aminolevulinic acid (2H-ALA)
The first step of the synthesis was formation of phthalylglycine with the yield of
75%. 2,2-D2 Glycine was reacted with phthalic anhydride to form 2H-phthalylglycine.
Nuclear magnetic resonance spectroscopy was used to characterize the products and was
carried out on a JEOL JNM-ECA500 FT NMR system. Figure III.1 shows the synthesis
of phthalylglycine from phthalic anhydride and glycine (2H denoted by D). Table III.1.
shows the available literature values, the chemical shift assignments and 1H-NMR data
for the synthesized 2H-Phthalylglycine. The literature values from Wang and Scott6 for
the phthalylglycine (CH2COOH) was a doublet at 4.40 ppm. In the 2H-phthalylglycine
(C2H2COOH), there should not be any doublet peak, and there was not, if the deuterium
had been incorporated since 1H-NMR can only detect protons, not deuterium. The
assigned chemical shift of 2H-phthalylglycine at 7.90 ppm was close to the literature
value of 7.82 ppm. The peak at 2.50 ppm is DMSO solvent peak.
28

O
O
O
NCD2COOH
O
O
H2NCD2COOH
Phthalic Anhydride 2H-Phthalylglycine
Figure III.1. The synthesis of 2H-phthalylglycine from phthalic anhydride and 2,2-D2
glycine.
Table III.1. The available literature values, the chemical shift assignments and 1H-NMR data for the synthesized 2H-phthalylglycine.
Experimental (1H-
NMR, ppm) Literature6 Assignment
2H-Phthalyglycine
2.45 No peak
7.85
4.40 7.82
DMSO (solvent) CH2COOH (lit) AA’BB’, 4H
The next step in synthesis of ALA was the formation of phthalimidoacetyl
chloride. To do this, the reactant phtalylglycine from the last step had to be completely
dry. The dried phthylglycine was reacted with thionyl chloride to yield phthalimidoacetyl
chloride. The excess thionyl chloride was evaporated off and the percent yield was
calculated to be 92%. Figure III.2. shows the synthesis of 2H-Phthalimidoacetyl Chloride
29
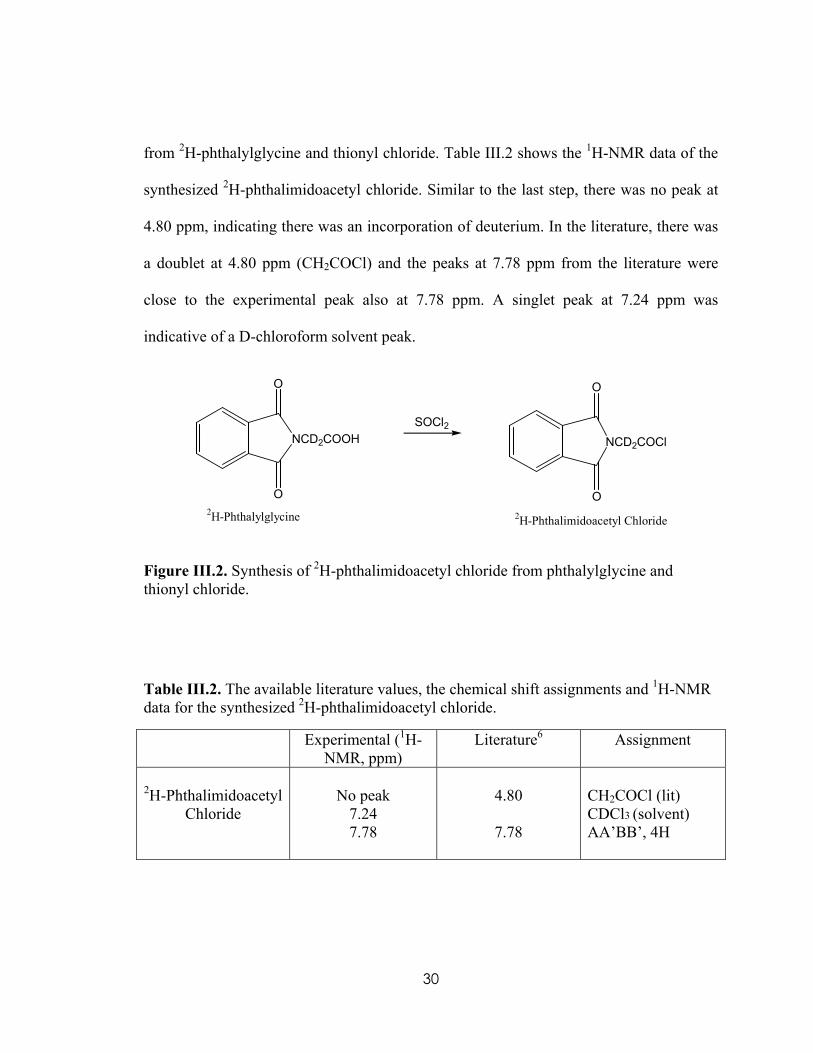
from 2H-phthalylglycine and thionyl chloride. Table III.2 shows the 1H-NMR data of the
synthesized 2H-phthalimidoacetyl chloride. Similar to the last step, there was no peak at
4.80 ppm, indicating there was an incorporation of deuterium. In the literature, there was
a doublet at 4.80 ppm (CH2COCl) and the peaks at 7.78 ppm from the literature were
close to the experimental peak also at 7.78 ppm. A singlet peak at 7.24 ppm was
indicative of a D-chloroform solvent peak.
NCD2COOH
O
O
NCD2COCl
O
O2H-Phthalylglycine 2H-Phthalimidoacetyl Chloride
SOCl2
Figure III.2. Synthesis of 2H-phthalimidoacetyl chloride from phthalylglycine and thionyl chloride.
Table III.2. The available literature values, the chemical shift assignments and 1H-NMR data for the synthesized 2H-phthalimidoacetyl chloride.
Experimental (1H-NMR, ppm)
Literature6 Assignment
2H-Phthalimidoacetyl Chloride
No peak
7.24 7.78
4.80
7.78
CH2COCl (lit) CDCl3 (solvent) AA’BB’, 4H
30

The third step of this synthesis was the most labor intensive beacause zinc
homoenolate solution had to be used in subsequent reaction with 2H-phthalimidoacetyl
chloride. It is important to note that all the reagents had to be kept dry at all times and
under an atmosphere of argon gas during the synthesis of zinc homoenolate. The overall
yield for the synthesis of 2H-phthalimidolevulinic acid ethyl ester was 88%. Figure III.3.
shows the synthesis of 2H-phthalimidolevulinic acid ethyl ester from 2H-
phthalimidoacetyl chloride and zinc homoenolate. Table III.3. shows the 1H-NMR data
for 2H-phthalimidolevulinic acid ethyl ester. All the 1H-NMR data from 2H-
phthalimidolevulinic acid ethyl ester was in close agreement with the literature values6.
Just like the last steps, the deuterium was still intact and incorporated which is shown by
the absence of a peak at 4.56 ppm, which is consistent with the results from previous
steps. All other protons were observed in the NMR spectra consistent with specific 2H
incorporation.
NCD2COCl
O
O
Zn(CH2CH2COOEt)2
Pd(PPh3)2Cl2NCD2COCH2CH2COOEt
O
O
2H-Phthalimidoacetyl chloride2H-Phthalimidolevulinic acid ethyl ester
Figure III.3. Synthesis of 2H-phthalimidolevulinic acid ethyl ester from 2H-phthalimidoacetyl chloride and zinc homoenolate.
31

Table III.3. The available literature values, the chemical shift assignments and 1H-NMR data for the synthesized 2H-phthalimidolevulinic acid ethyl ester.
Experimental (1H-NMR, ppm)
Literature6 Assignment
2H-Phthalimidolevulinic
acid ethyl ester
1.23 2.60 2.91 4.19
No peak 7.24 7.78
1.26 2.65 2.84 4.14 4.56
7.80
t, 3H, CH2CH3
m, 2H, COCH2CH2
m, 2H, COCH2CH2
q, 2H, OCH2CH3
NCH2CO (lit) CDCl3 (solvent) AA’BB’, 4H
The last step of this synthesis was the acid hydrolysis and deprotection of 2H-
phthalimidolevulinic acid ethyl ester to yield 2H-Aminolevulinic acid (2H-ALA), the final
product. Product yield for this step was calculated to be 92%. Figure III.4 shows the
synthesis of 2H-aminolevulinic acid and Table III.4. shows 1H-NMR data of 2H-
aminolevulinic acid. The 1H-NMR peak at 4.10 ppm for the last step indicated that the
protons had exchanged with deuterium. The other two peaks were in agreement with the
literature values, but where there should have been no peaks at 4.13 ppm if deuterium
was incorporated; there was a doublet at 4.10 ppm which would indicate 2 protons at the
5th position of ALA. The conclusion is that acid hydrolysis of 2H-phthalimidolevulinic
acid ethyl ester converted the deuterium which was incorporated in the last step to
exchange back with protons. Due to the conversion between deuterium and hydrogen
during acid hydrolysis, another alternative method to make 2H-ALA was chosen. A
detailed method to make 2H-ALA is described below in III.B.
32

NCD2COCH2CH2COOEt
O
O
6N,HClCl-H3N
+CD2COCH2COOH
2H-Phthalimidolevulinic acid ethyl ester 2H-Aminolevulinic acid
Figure III.4. The synthesis of 2H-ALA from acid hydrolysis of 2H-phthalimidolevulinic acid ethyl ester.
Table III.4. The available literature values, the chemical shift assignments and 1H-NMR data for the synthesized 2H-aminolevulinic acid.
Experimental (1H-NMR, ppm)
Literature6 Assignment
2H-ALA
2.70 3.95 4.10
2.71 2.90 4.13
m, 2H, 13COCH2CH2
m, 2H, 13COCH2CH2
d, 2H, NCH2CO
III.B. Alternative method to make deuterium-ALA (2H-ALA)
Since in the previous method, the deuterium exchanged with hydrogen, it was
necessary to come up with a new method to make 2H-ALA. The last step of the reaction
in the synthesis of ALA from Wang and Scott6 was the acid hydrolysis and deprotection
of the phthalimidolevulinic acid ethyl ester. It is probably due to the presence of acid and
water that deuterium exchanged with hydrogen. From this logic it was possible to
33

synthesize 2H-ALA by adding deuterium oxide and 2M HCl to pure ALA. For both
regular ALA and for 2H-ALA, 1H-NMR spectra was taken with the same concentration in
each of the tubes. Figure III.5 and III.6 shows 1H-NMR spectra of regular ALA and 2H-
ALA respectively.
Figure III.5. 1H-NMR spectra of regular ALA.
34

Figure III.6. 1H-NMR spectra of synthesized 2H-ALA.
OHH2N
O
O
Aminolevulinic Acid
OHH2N
O
OD
D
D
D
D
D
2H-Aminolevulinic Acid
H
H
H
H
H
H2.55
2.753.95
Figure III.7. Diagram of regular ALA and deuterium-labeled ALA.
In Figure III.5, regular ALA was prepared with solvent deuterium oxide (D2O).
Once 1H-NMR spectra was taken, 25 µL aliquots of 2 M HCl was added to the NMR
35

tube and each time 1H-NMR spectra was taken. When 150 µL of 2 M HCl, had been
added, the peaks at 2.55 pppm, 2.75 ppm and at 3.95 ppm disappeared. Looking at 1H-
NMR spectra of regular ALA, the triplet at 2.55 ppm and 2.75 ppm and the singlet at 3.95
ppm is considerably reduced in the 1H-NMR spectra of 2H-ALA. Looking at Figure III.6,
the peaks at 2.55 ppm, 2.75 ppm and at 3.95 ppm has very little intensity compared to
Figure III.5. Since 1H-NMR can only detect protons and cannot detect deuterium, the
absence of the proton peaks in Figure III.6. clearly indicated the incorporation of
nd rd th position of ALA. deuterium into the 2 , 3 and the 5
III.C. Plasmid purification results
One of the goals of this project was to generate enough production of P450 BM3
since this plasmid contained T7 promoter for control of expression, so this recombinant
plasmid can be used in 2H – heme incorporation. Since E.Coli Hu227 cells do not contain
the gene for expressing T7 polymerase, these plasmids cannot be expressed in Hu227
cells. In order to express in Hu227 cells, it is important to transfect the cells with a DNA
that will allow T7 polymerase expression. A two step transformation with plasmid T7
polymerase 1 (pT7po1) was attempted. This involved imparting the Hu227 cells with
kanamycin resistance and transforming the second plasmid BM3. The QIAGEN kit
method to make competent cells was not as successful, so an alternative method from
Kotchoni et al15 was successfully used to make better competent cells. Figure III.8 shows
Agarose Gel Electrophoresis of pT7po1 comparing the QIAGEN kit and the method from
Kotchoni et al. It was observed that the competent cells using the method from Kotchoni
36

produced a band with much greater intensity indicating a much higher yield of plasmid,
which can be seen on lane 1. The competent cells made using the method from QIAGEN
can be seen on lane 2. The problem was that once both plasmids were transformed into
Hu227 cells, the expressions of the cells were very low after the induction with IPTG. It
appears therefore that the expression system in Hu227 is not effective. Figure III.9 shows
the gel in which all the plasmids were purified and transformed. In lane 1 is p102A2, lane
2 is pBM3F87G, lane 3 is pBM3W8G7 and lane 4 is pBMH. All the plasmids were then
expressed in Hu227 cells and induced with IPTG. The BM3F87G in Hu227 was the only
one to express fairly well compare to 102A2/Hu227, BM3W87G/Hu227 and BMH/Hu227.
It correlated to the fact that pBM3F87G had the brightest band as seen in Figure III.9. Once
BM3F87G/Hu227 was transformed and expressed, an absorbance spectrum of CO-reduced
heme complex of BM3F87G was taken as shown in Figure III.10. Looking at the
absorbance spectra, it can be seen that the peak is right at 450 nm is typical of the
absorbance associated with P450 enzymes. This makes it easier to track the expression of
P450 enzymes in whole cells, and is therefore useful in determining whether to harvest
the cells based on their expression. The yield of BM3F87G is close to 100 nmoles of
this particular enzyme in P450’s.
BM3/1L, which is typical expression of
37

Figure III.8. Agarose gel electrophoresis comparing two different methods to make pT7
Figure III.9. Agarose gel electrophoresis of plasmid controls
38

Figure III.10. Absorbance spectrum of CO-reduced P450 BM3F87G in whole cells.
III.D. Dehaloperoxidase expression levels and purification
Dehaloperoxidase (DHP) enzyme was chosen for the 2H incorporation of heme
protein, as discussed previously. Aminolevulinic acid (ALA) was required for the cells in
order to express since they cannot generate ALA on their own. Therefore, incorporating
deuterium labeled ALA (2H-ALA) into the cells ensured the incorporation of deuterium
into the heme of DHP. DHP was expressed and purified successfully from E.Coli Hu227
cells. These cells were grown in Luria Bertani (LB) growth media containing 2H-ALA.
Figure III.11 displays an absorbance spectrum of CO-reduced heme complex of purified
DHP. The λmax of purified DHP is right at 420 nm, typical DHP peak, with absorption of
P450 peak
39
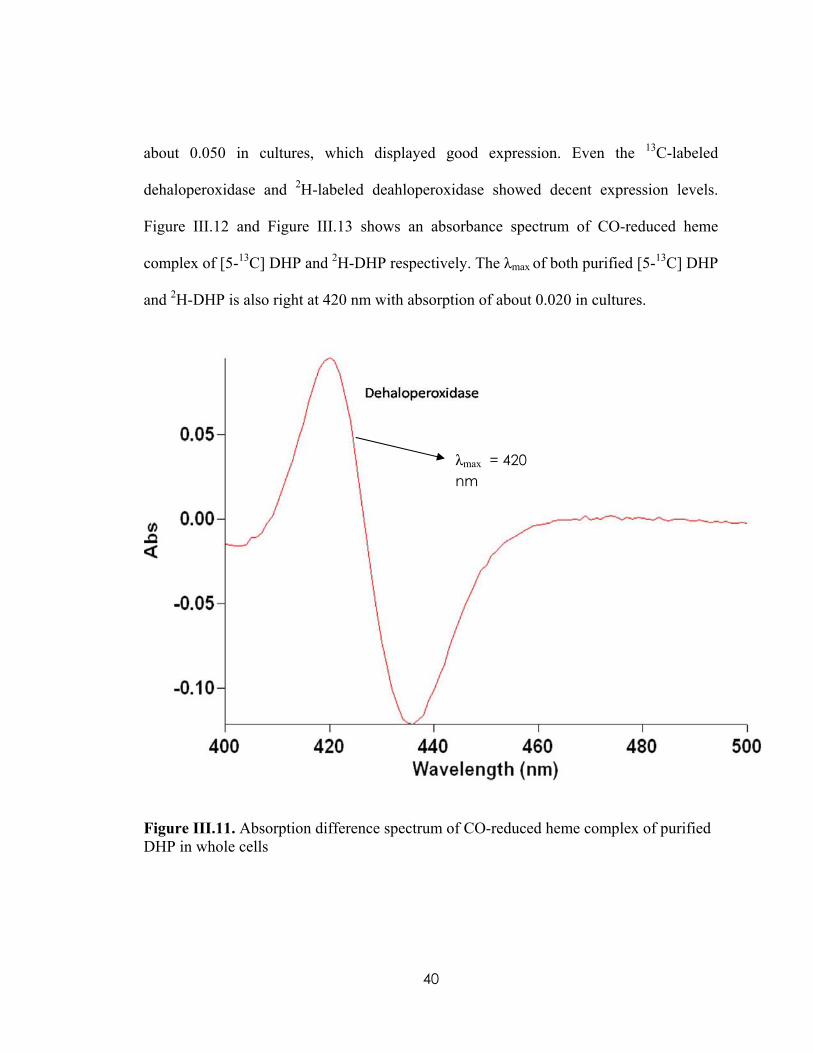
about 0.050 in cultures, which displayed good expression. Even the 13C-labeled
dehaloperoxidase and 2H-labeled deahloperoxidase showed decent expression levels.
Figure III.12 and Figure III.13 shows an absorbance spectrum of CO-reduced heme
complex of [5-13C] DHP and 2H-DHP respectively. The λmax of both purified [5-13C] DHP
and 2H-DHP is also right at 420 nm with absorption of about 0.020 in cultures.
λmax = 420 nm
Figure III.11. Absorption difference spectrum of CO-reduced heme complex of purified DHP in whole cells
40

420 nm
Figure III.12 Absorption difference spectrum of CO-reduced heme complex of purified [5-13C] DHP in whole cells
41

420 nm
Figure III.13. Absorption difference spectrum of CO-reduced heme complex of purified 2H-DHP in whole cells
III.E. Electron paramagnetic resonance (EPR) spectroscopy
EPR spectroscopy was carried out using a Bruker Instruments EMX EPR
spectrometer, equipped with an Oxford Instruments ESR 900 liquid helium cryostat.
Currently the EPR results for 15N-DHP, [4-13C] DHP, [5-13C] DHP and pure DHP are
inconclusive. The goal of this study is to develop technology that would be useful in the
identification of transient intermediates in the peroxo-pathway. If there is incorporation
of 13C or 15N in the heme of DHP, the peaks may show broadening or splitting if coupling
to these isotopes is significant. During the preparation of the DHP samples for EPR, the
42

absorbance spectrum was taken in order to get all of them to the same concentration.
Figure III.14 shows the absorbtion spectra of all four samples after column purification.
Once the concentrations were determined and normalized to the unlabeled sample, the
samples were put in a clear fused quartz EPR tubes and frozen in liquid nitrogen over a
period of 15 to 20 seconds.
Figure III.14 Absorption spectrum of 15N -DHP, [4-13C] DHP, [5-13C] DHP and pure DHP in preparation for EPR analysis.
Several EPR spectra with varying concentration of isotopically-labeled and
unlabeled DHP were recorded and analyzed. The concentration of 15N-DHP, [4-13C]
DHP, [5-13C] DHP was approximately 200 µM but the concentration of unlabeled pure
DHP was approximately 70 µM. The samples were examined at X-band frequency,
43

shown in Figure III.15 and Figure III.16. Figure III.15 shows the EPR spectra for DHP
samples at g = 2 region. The spectra looks the same for all the samples, but there is a
small signal around g = 2.056 for [5-13C] DHP. This could be more likely a disrupted iron
species or it could be due to the isotopic effect from [5-13C] DHP as opposed to [4-13C]
DHP, or it could potentially also be a contamination from an impurity in the sample.
Also, in Figure III.16, at g = 6 region, [5-13C] DHP also shows a little bit of broadening.
Though it is not clear whether this is significant, more studies in the future might be
worth undertaking.
Figure III. 15. EPR spectra of DHP samples at X-band in the g=2 region using 0.5 mW microwave power, a field sweep from 500 to 4000 G modulation amplitude of 15G, and temperature of 10K.
44

Figure III. 16. EPR spectra of DHP samples at X-band in g=6 region using 0.5mW microwave power, a field sweep from 500-1600 G modulation amplitude of 15G, and temperature of 10K.
III.F. LC-MS analysis of isotopically labeled heme from dehaloperoxidase
High performance liquid chromatography – mass spectrometry with electrospray
ionization (LC-MS) was conducted on heme that had been extracted and purified from
dehaloperoxidase. Since the MS results had a lot of contaminations and impurities, the
samples were further purified using HPLC and the heme fraction at 4.43 min was
collected as shown in Figure III.17. The solvent from this fraction was evaporated and
resuspended in the mobile phase and subsequently subjected to analysis using LC-MS.
The LC-MS chromatograms for unlabeled heme from DHP using unlabeled ALA, 13C
heme from DHP using [5-13C] ALA and 2H heme from DHP using 2H-ALA are shown in
45

Figure III.18. As expected, the blank had no detectable ion at m/Z of 616, but DHP, 13C-
DHP and 2H-DHP all had a 616 m/Z. The fact that 13C-DHP had ion at 616 m/Z, not 624
m/Z, as shown in Figure III.19, suggested that eight 13C atoms were not successfully
incorporated into the heme. Also the fact that 2H-DHP had a 616 m/Z indicated that
deuterium had not fully exchanged with hydrogen. To further clarify the data,
esterification of the heme was also done by adding 5% sulfuric acid to methanol. This
was done by locking the two free carboxylic acid group to a methyl group so the charge
on heme will be +3. The analysis of LC-MS data for the esterification of heme showed
that, esterification did not work due to the fact that there was still 616 m/Z on unlabeled
DHP instead of expected 205 m/Z (616 mass: 3 charge). Previously, it was shown that
13C-ALA was incorporated into DHP and a clear 624 m/Z peak was shown. But, since
there was no 624 m/Z peak in the current sample of DHP but a 616 m/Z was observed,
another ionization method, MALDI was used in order to clarify the 616 m/Z of 13C-DHP.
As expected, there was a clear 624 m/Z peak, but also a 616 m/Z peak on MALDI. A
possible reason for this could be that the cell cultures of DHP/Hu227 were contaminated.
If there was no contamination, there should have only been a clear 624 m/Z peak, but
because there was a higher ion peak at 616 m/Z and not 624 m/Z was probably due to
contamination, as shown in Figure III.20. Re-plating DHP/Hu227 on a LB/ALA/Amp
plate and growing fresh cultures out of that eliminated the possibility of contaminants.
The absence of 624 m/Z peak of 13C-DHP on LC-MS (ESI) and presence of 624 m/Z by
MALDI is probably a dilution issue because LC-ESI the samples molecule have to travel
46

through the mobile phase before they are ionized in which they are already diluted. In
MALDI there is no mobile phase it has to travel through.
Heme fraction collected at 4.43 min
Figure III.17. HPLC purified heme from dehaloperoxidase observed at 398 nm.
47

RT: 0.00 - 43.79
0 5 10 15 20 25 30 35 40Time (min)
0
20
40
60
80
100
0
20
40
60
80
100
0
20
40
60
80
100
Re
lativ
e A
bun
danc
e
0
20
40
60
80
100
30.48615.82
29.60615.96
30.98615.6728.01
615.9340.90
615.9935.99
616.4720.71615.81 26.22
616.1832.08
615.6920.09616.33
2.28616.29
37.07616.10
17.50616.42
41.03615.7114.
61612.03
6.635.71
12.96615.8561
8.50615.86
36.22616.20
33.88615.82 37.19
616.1727.38
615.8128.96
616.0826.32
615.8540.82
616.3022.34
616.282.59
616.4520.81
616.1318.81
615.8116.19
616.2211.02
616.133.70
616.509.07
615.8436.50
616.23
39.95616.21
40.68616.1036.84
616.3027.14615.93
35.63615.93
26.11616.01
31.23616.20
22.46615.97
21.47615.70
41.19616.30
3.38616.18
18.61615.87
6.92616.15
16.83615.90
13.39616.30
8.34615.58
NL:8.09E5Base Peak m/z= 615.50-616.50 F: MS blank-01
NL:6.73E6Base Peak m/z= 615.50-616.50 F: MS c13-dhp
NL:4.34E6Base Peak m/z= 615.50-616.50 F: MS d-dhp-01
Blank
NL:4.84E6Base Peak m/z= 615.50-616.50 F: MS dhp-01DHP
13C-DHP
36.20616.24
36.10616.16
2H-DHP
27.85616.03
34.91615.56
33.94616.05
27.08615.71
36.54615.51
3.32616.10
40.60615.97
25.01616.08
18.13616.36
16.54615.74
21.83616.05
10.88615.54
5.58616.40
13.85616.06
7.06616.50
Figure III.18. LC-MS selective ion chromatogram (615.5 - 616.5) of purified isotopically labeled heme from DHP for blank, DHP expressed in unlabeled ALA, 13C-DHP overexpressed in [5-13C] ALA and 2H-DHP overexpressed in 2H-ALA.
48

RT: 0.00 - 43.79
0 5 10 15 20 25 30 35 40Time (min)
0
20
40
60
80
100
0
20
40
60
80
100
0
20
40
60
80
100
Re
lativ
e A
bun
dan
ce
0
20
40
60
80
100
22.51623.99
37.32624.3722.88
623.6222.40
624.1131.78
623.6533.47
624.3124.78
623.95 40.88624.30
2.23624.08
29.31624.29
18.40624.48
17.42623.98
37.67624.42
14.73623.7112.26
624.078.06
623.997.48
624.11
36.09624.18
36.27624.16
33.73623.7328.61
624.1325.84
624.36 36.87624.19
29.83624.33
22.26623.7720.92
624.2225.19
623.8419.23623.91
39.98623.89
7.87624.01
3.43623.83
16.60624.24
41.03624.08
13.97623.50
10.11623.71
36.48624.17
25.06624.34 36.53
624.0534.28
624.153.33
624.34 27.27623.78
37.00624.39
28.72624.36
24.53624.19
22.09623.91
30.86623.60
39.93624.47
40.97624.4920.13
623.8118.01
623.7215.95624.05
3.43623.74
3.03623.61
6.54623.57
9.54623.61
12.67624.26
36.28624.25
34.70623.6626.93
623.9723.65623.83
3.30624.08
34.04624.1631.35
624.1336.78
623.5621.08
623.80 40.63623.7819.63
624.2815.71
624.276.18
623.542.81
623.726.76
623.7242.99
624.0110.55
624.3013.04
623.88
NL:6.24E5Base Peak m/z= 623.50-624.50 F: MS blank-01
NL:8.65E5Base Peak m/z= 623.50-624.50 F: MS dhp-01
NL:8.00E5Base Peak m/z= 623.50-624.50 F: MS c13-dhp
NL:7.28E5Base Peak m/z= 623.50-624.50 F: MS d-dhp-01
Figure III.19. LC-MS selective ion chromatogram (623.5 - 624.5) of purified isotopically labeled heme from DHP for blank, DHP expressed in unlabeled ALA, 13C-DHP overexpressed in [5-13C] ALA and 2H-DHP overexpressed in 2H-ALA.
49

599 620 641 662 683 704
M ass ( m/ z)
4560
0
10
20
30
40
50
60
70
80
90
100
% I
nten
sity
4 7 0 0 Re fle c to r Sp e c # 1 [BP = 6 1 6 .2 , 4 5 6 0 ]
616.
2083
624.
2355
655.
3088
650.
1909
623.
2352
656.
3032
658.
2333
614.
2194
619.
2241
622.
0856
682.
0139
666.
0403
652.
1970
615.
2252
632.
2125
671.
2972
648.
1986
660.
2224
640.
2366
697.
9854
616.2083
624.2355
Figure III.20. MALDI-TOF spectrum of 13C labeled heme from DHP, displaying a major peak at 616 m/z and a minor peak at 624 m/z.
III.G. MALDI-TOF analysis of isotopically labeled heme from dehaloperoxidase
Matrix Assisted Laser Desorption/Ionization-Time of Flight Mass Spectrometry
(MALDI-TOF) was used for analysis of heme from DHP because it proved to be a better
ionization technique, as discussed previously in III.F. Unlabeled heme from DHP using
unlabeled ALA, 13C heme from DHP using [5-13C] ALA and 2H heme from DHP using
50

2H-ALA were analyzed by MALDI to test for successful incorporation of isotopically
labeled atoms in to the heme. The spectral data of this analysis is shown in Figure III.19,
Figure III.20 and Figure III.21 respectively. When comparing the MALDI-TOF
spectrum of unlabeled heme sample (Figure III. 19) to the 13C-labeled heme sample
(Figre III. 20), there is an increase in mass from 616 m/z to 624 m/z which suggests that
eight 13C atoms were incorporated into the heme as expected. However, when comparing
the MALDI-TOF spectrum of unlabeled heme sample (Figure III.19) to the 2H-labeled
heme sample (Figure III.21), there is no increase in mass 616 m/z to 624 m/z, which
clearly indicates there was no incorporation 2H-labeled atoms in the heme. These data
concludes that the deuterium was not incorporated into the heme of DHP. The reason for
this could be due to the hydrogen in water environment replacing deuterium in heme.
Another reason that deuterium could not be incorporated could also be because of a slow
exchange of deuterium and hydrogen during enzymatic reaction of ALA to heme as
shown in the biosynthetic pathway of heme in Figure I.4.
51

5 9 9 6 2 0 6 4 1 6 6 2 6 8 3 7 0 4
4700 Reflector Spec #1[BP = 616.2, 1363]
M a s s (m /z )
1 3 6 3 .1
0
1 0
2 0
3 0
4 0
5 0
6 0
7 0
8 0
9 0
1 0 0 616.
1876
697.
9742
655.
2833
650.
1779
689.
1949
615.
1986
635.
1836
679.
1765
688.
0155
682.
0019
622.
0704
699.
2609
664.
6780
616.1876 m/Z
% I
nte
nsi
ty
Figure III.21. MALDI-TOF spectrum of unlabeled heme from DHP, displaying a major peak at 616 m/Z.
52

5 9 9 6 2 0 6 4 1 6 6 2 6 8 3 7 0 4
M a s s (m /z )
3 0 4 5 .9
0
1 0
2 0
3 0
4 0
5 0
6 0
7 0
8 0
9 0
1 0 0
% I
nte
nsi
ty4700 Reflector Spec #1[BP = 624.2, 3046]
624.
2229
663.
3077
672.
1601
687.
1947
658.
2101
623.
2264
689.
1959
662.
2999
686.
1974
660.
2042
671.
1725
656.
1967
685.
1999
642.
2700
640.
2249
657.
2025
617.
3495
624.2229 m/Z
Figure III.22. MALDI-TOF spectrum of 13C labeled heme from DHP, displaying a major peak at 624 m/Z.
53

54
5 9 9 6 2 0 6 4 1 6 6 2 6 8 3 7 0 4
M a s s (m /z )
3 8 1 2 .5
0
1 0
2 0
3 0
4 0
5 0
6 0
7 0
8 0
9 0
1 0 0
% I
nte
nsi
ty4700 Reflector Spec #1[BP = 616.2, 3813]
616.
1857
655.
2770
664.
6816
679.
1693
650.
1796
614.
1966
619.
2039
699.
2570
657.
2900
622.
0614
652.
1598
681.
9964
673.
2374
633.
1880
632.
1858
654.
2657
671.
2727
610.
5726
616.1857 m/Z
Figure III.23. MALDI-TOF spectrum of 2H labeled heme from DHP, displaying a major peak at 616 m/Z.

CHAPTER IV
CONCLUSIONS
Paramagnetic NMR can be a powerful tool for probing electronic distribution and
spin-densities within the heme macrocycle. A significant limitation to its use in
cytochrome P450 studies is that natural abundance of 13C is relatively low, and P450
enzymes have proven resistant to heme reconstitution. Therefore, the availability of
appropriately labeled 13C enzyme is severely limited. A step in the direction toward
utilizing paramagnetic NMR as a tool for studying P450 is the development of a
recombinant system whereby the P450 can be expressed with isotopically labeled heme
incorporated, thus eliminating the need for inefficient reconstitution procedures.
A strain of E.coli, Hu227 was selected because of its inability to produce
aminolevulinic acid (ALA), a heme precursor in the biosynthetic pathway. Since E.coli
Hu227 cannot synthesize their own ALA we can selectively label heme with isotopes by
using isotopically labeled ALA in the media. In past studies, Cytochrome P450 has been
expressed under the control of T7 promoter using E.Coli BL-21 cells. These cells have a
T7 polymerase encoded in their genome, under the control of a lac promoter. Thus, IPTG
addition involves T7 polymerase production which, in turn, induces the target gene.
Hu227 cells have no such T7 polymerase, so expression of P450 from one of the readily
available plasmids in Hu227 would be expected to be very inefficient.
55
Dehaloperoxidase (DHP), an enzyme which also contains heme has been a model
protein because it was under the control of lac promoter and expresses very well in these
cells. An additional goal of this research, however remained improving expression of the
P450BM3 enzyme in the Hu227 cells. Initially there was an attempt at a multi step
synthesis of 2H-aminolevulinic acid from glycine, but the deuterium apparently
exchanged with hydrogen from water in the last step. However, an alternative method
was used to make 2H-aminolevulinic acid and it was characterized using 1H-NMR.
Additionally, the generation of good expression level for both DHP and BM3F87G was
conducted successfully. Also, the expression level for both unlabeled DHP and also
isotopically labeled DHP was generated in a high yield.
High performance liquid chromatography – mass spectrometry with electrospray
ionization (LC-MS) was conducted on heme that had been extracted and purified from
dehaloperoxidase. Previously, it was proven that 13C-ALA was incorporated into DHP
and a clear 624 m/Z peak was shown. But, since there was no 624 m/Z peak in the current
sample of DHP but a 616 m/Z was observed, another ionization method, MALDI-TOF
was used in order to clarify the 616 m/Z of 13C-DHP. After eliminating the possibility of
contamination, there was a clear 624 m/Z peak for 13C-DHP on MALDI. However, when
comparing the MALDI-TOF spectrum of unlabeled heme sample to the 2H-labeled heme
sample, there is no increase in mass 616 m/Z to 624 m/Z, which clearly indicates there
was no incorporation 2H-labeled atoms in the heme. This might be due to hydrogen in
56

57
water environment replacing deuterium in heme, or a slow exchange of hydrogen and
deuterium through the enzymatic reaction of ALA to heme. Although it was not possible
to incorporate 2H into the heme, successful incorporation of 13C and 15N into the heme
will be useful in the application of the spectroscopic techniques when applied to P450
enzymes.

REFERENCES
1. Danielson, P.B. Current Drug Metabolism, 2002, 3, 561.
2. Montellano, P. R. O. d. Cytochrome P450 Structure, Mechanism, and Biochemistry, 2nd ed. Plenum Publishers: New York, 1995.
3. Guengerich, F. P. J. Biol. Chem. 1991, 266, 10019.
4. Alontaga, A. Y., Bunce, R.A., Wilkis, A., Rivera, M. Inorg. Chem. 2006, 45, 8876.
5. Caignan, G.A.; Deshmukh, R.; Zeng, Y.; Wilks, A.; Bunce, R.A.; Rivera, M., J. Am. Chem. Soc. 2003, 125, 11842.
6. Wang, J., Scott, A.I. Tetrahedron Lett. 1997, 38, 739.
7. Nakamura, E., Aoki, Kouichi, S., Oshino, S.H., Kuwajima, I. J. Am. Chem. Soc.1987, 109, 8056.
8. Raner, G.M., Hatchell, A.J., Morton, P.E., Ballou, D.P., Coon, M.J. J. Inorganic Biochemistry 2000, 81, 153.
9. Li, Q., Ogawa, J., Shimizu, S. Biochem and Biophys Res Comm, 2001, 280, 1258.
10. Raner, G.M., Hatchell, A.J., Dixon, M.U., Joy, T.L., Haddy, A.E., Johnstone, E.R. Biochem, 2002, 41, 9601.
11. Li, J., Deslouches, B., Cosloy, S.D., Russell, C.S. Biochem et Biophys Acta, 2003, 1626,102.
58

12. Osborne, R. L., Sumithran, S., Coggins, M.K., Chen, Y.P., Lincoln, D.E., Dawson, J.H. J. Inorg. Biochem. 2006, 100, 1100.
13. Rivera, M., Walker, F.A. Anal. Biochem. 1995, 230, 295.
14. Rivera, M., Caignan, G. A., Anal. Bioanal. Chem. 2004, 378, 1464.
15. Kotchoni, S.O., Gachomo, E.W., Betiku,E., Shonukan, O.O. African J. of Biotech. 2003, 2(4), 88.
16. Budde, M., Morr, Michael, Schmid, Rolf. D., Urlacher, Vlada B. Chem. Bio. Chem. 2006, 7, 789.
17. Roach, M. P., Chen, Y.P., Woodin, S.A., Lincoln, D.E., Lovell, C.R., Dawson, J.H. Biochemistry 1997, 36, 2197
18. Svistunenko, D.A. Biochem. Biophys. Acta. 2005, 1707, 127-55.
19. Schunemann, V. J. Biol. Chem. 2004, 279(12), 10919- 10930.
20. Hiner, A. Biochemistry. 2003, 42, 8799-8908.
21. Niehaus, K., Deng, P., Belyea, J., Franzen, S., Niehause, G.U. J. Phys. Chem. B. 2006, 110, 13264.
22. von Weymarn, L. B., Blobaum, A. L., Hollenberg, P.F. Arch. Biochem. Biophys. 2004, 425, 95.
23. Spolitak, T. J. Biol. Chem. 2005, 280(21), 20300-20309.
59