manitoba weed survey · 2019-04-16 · 78-1 report on the 1977 weed survey and questionnaire in...
TRANSCRIPT

Annual Crops 2016
Manitoba Weed Survey
Julia Y. Leeson Jeanette Gaultier Laryssa Grenkow
Weed Survey Series


Manitoba Weed Survey of
Annual Crops in 2016
by
JULIA Y. LEESON Agriculture and Agri-Food Canada
JEANETTE GAULTIER Manitoba Agriculture
LARYSSA GRENKOW Manitoba Pulse & Soybean Growers
Weed Survey Series Publication 17-2
Published by Agriculture and Agri-Food Canada, Saskatoon Research Centre
107 Science Place, Saskatoon, Saskatchewan, S7N 0X2, Canada July 2017


i
PREVIOUSLY PUBLISHED REPORTS IN THE WEED SURV EY SERIES
Number Title 76-1 Weed survey of cultivated land in Saskatchewan (1976) 77-1 Weed survey of cultivated land in Saskatchewan (1977) 78-1 Report on the 1977 weed survey and questionnaire in Saskatchewan 78-2 Weed survey of cultivated land in Saskatchewan (1978) 78-3 Weed survey of cultivated land in Manitoba (1978) 79-1 Manitoba weed survey questionnaire data (1978) 79-2 Weed survey of cultivated land in Saskatchewan (1979) 79-3 Weed survey of cultivated land in Manitoba (1979) 80-2 Weed survey of grain fields in Prince Edward Island (1978) 80-3 Manitoba weed survey questionnaire data (1979) 82-1 Weed survey of cultivated land in Manitoba (1981) 82-2 Manitoba weed survey questionnaire data (1981) 83-1 Weed survey of Essex and Kent counties (1978 and 1979) 83-2 Essex and Kent counties - weed survey questionnaire data (1978 and 1979) 83-3 The 1979 weed survey of grain fields in Prince Edward Island 83-4 Peace River Region of British Columbia weed survey of cereal and oilseed crops (1978, 1979 and 1980) 83-5 Peace River Region of British Columbia weed survey of forage crops (1978, 1979 and 1980) 83-6 Weed survey of Saskatchewan cereal and oilseed crops from 1976 to 1979 84-1 Weed surveys of Manitoba cereal and oilseed crops from 1978, 1979 and 1981 85-1 Weed surveys of alfalfa seed fields in Manitoba (1983) 85-2 Survey for weeds and their competitive effect in corn and soybean fields of Essex and Kent Counties in
Ontario 85-3 Dew’s Alberta weed survey (1973-1977) 86-1 Weed survey of Saskatchewan sunflower fields (1985) 86-2 Weed survey of Saskatchewan mustard, lentil and dry pea crops (1985) 86-3 Weed survey of Saskatchewan winter wheat fields (1985) 86-4 Fort Vermilion Area of Alberta weed survey in cereal and oilseed fields (1985) 87-1 Weed survey of Saskatchewan cereal and oilseed crops (1986)
87-2 Weed survey of Saskatchewan winter wheat fields (1986) 87-3 Saskatchewan cereal and oilseed crops weed survey questionnaire (1986) 88-1 Weed survey of cereal and oilseed crops in Manitoba (1986) 88-2 Weed survey of Saskatchewan winter wheat fields (1987) 88-3 Manitoba cereal and oilseed crops weed survey questionnaire (1986) 89-1 Weed survey of Saskatchewan winter wheat fields (1985-1988) 90-1 Weeds of corn, soybean, and winter wheat fields under conventional, conservation, and no-till management
systems in southwestern Ontario (1988 and 1989) 96-1 Saskatchewan weed survey of cereal, oilseed and pulse crops (1995) 97-1 Manitoba weed survey comparing zero and conventional tillage crop production systems (1994) 98-1 Manitoba weed survey of cereal and oilseed crops in 1997
98-2 Alberta weed survey of cereal and oilseed crops in 1997 98-3 Saskatchewan weed survey: herbicide resistant wild oat and green foxtail 1996 (Table continued on next page)

Previously Published Reports in the Weed Survey Series
ii
Previously published reports in the Weed Survey Series (continued)
Number Title 99-3 Farm management practices in Manitoba - 1997 weed survey questionnaire results 99-4 Saskatchewan weed survey: herbicide-resistant wild oat 1997 02-1 Alberta weed survey of cereal, oilseed and pulse crops in 2001 02-2 Manitoba weed survey of cereal and oilseed crops in 2002 03-1 Saskatchewan weed survey of cereal, oilseed and pulse crops in 2003 04-1 Alberta weed survey of herbicide-resistant weeds in 2001 04-2 Manitoba weed survey of herbicide-resistant weeds in 2002 05-1 Prairie weed surveys of cereal, oilseed and pulse crops from the 1970s to the 2000s 05-2 Farm management practices in Alberta - 1997 weed survey questionnaire results 05-3 Farm management practices in Alberta - 2001 weed survey questionnaire results 06-1 Saskatchewan weed survey of herbicide-resistant weeds in 2003 06-2 Prairie weed survey of herbicide-resistant wild oat from 2001 to 2003 10-1 Alberta weed survey of irrigated fields in 2009 12-1 Alberta weed survey of dryland fields in 2010 14-1 Alberta weed survey - field management questionnaire 16-1. Saskatchewan weed survey of cereal, oilseed and pulse crops in 2014 and 2015

iii
ACKNOWLEDGEMENTS Financial Support Direct financial assistance to conduct the survey was provided by:
Manitoba Agri-Research and Development Fund (GF2), Western Grains Research Foundation, Manitoba Pulse & Soybean Growers, Manitoba Wheat & Barley Growers Association, Manitoba Canola Growers, Manitoba Oat Growers Association, Manitoba Corn Growers Association, Manitoba Seed Growers Association, Manitoba Flax Growers Association and National Sunflower Association of Canada
In-Kind Support The 2016 weed survey of major annual crops in Manitoba was a product of the hard work, support, and encouragement of many people from the following organizations: Manitoba Agriculture, Manitoba Pulse & Soybean Growers, University of Manitoba and Agriculture and Agri-Food Canada (AAFC). We would like to thank Rob Gulden for his support of the project and assistance recruiting surveyors. We would like to thank the Manitoba Agriculture and Agriculture and Agri-Food Canada staff who helped with site qualification and co-ordination. In particular, we would like to thank Natalie Azure and Evan Vandermeulen from Manitoba Agriculture. The Agriculture and Agri-Food Canada team who contacted producers on the telephone to recruit their participation in the study included Shelby Capcara, Anna Jacobson, and Justin Norton. These individuals as well as Chelsea Coates, Erika Peterson and Kyle Rosvold were also responsible for data entry and verification. We are grateful to Henry deGooijer, Saskatchewan Land Resource Centre who provided access to a database facilitating the stratified selection of sites by ecodistrict and extension district. The field survey was conducted by Manitoba Agriculture employees, University of Manitoba students, and independent contractors. We would like to thank the following surveyors: Indra Ariyaratne, Earl Bargen, Diljeet Brar, Kim Brown, Terry Buss, Derrick Chomokovski, Nicole Clousin, Tracey Cummer, Amir Farooq, Jo-Lene Gardiner, Bram Gates, Jeanette Gaultier, Charles Geddes, Alex Griffiths, Elmer Kaskiw, Lionel Kaskiw, Sunil Kawthekar, Mark Klassen, Braden Korocil, Ingrid Kristjanson, Anastasia Kubinec, Mandy Lewick, Marnie McCracken, Everlito Mendoza, Hannah Minshull, Les Mitchell, Chad Newell, Peter Petrash, Rejean Picard, Marla Riekman, Jonathan Rosset, Laura Schmidt, Mildred Valentino and Curtis Weeks. We would like to thank A. Gordon Thomas for initiating the Weed Survey Series in the 1970s and developing the reporting format that is used here. His work on all the preceding Manitoba weed surveys laid the groundwork for this report. Producer Support It a special pleasure to acknowledge the contribution made by 658 producers who agreed to co-operate in the project by permitting survey staff to count weeds in their fields.
Julia Leeson
Jeanette Gaultier


v
CONTENTS
Part I INTRODUCTION History of Weed Survey Activities in Manitoba ........................................................................ 1 The 2016 Manitoba Weed Survey Project ................................................................................. 3
Part II DESCRIPTION OF SURVEYED AREA
Study Area ................................................................................................................................. 4 Ecoregions and Ecodistricts ....................................................................................................... 4
Ecoregion Map.................................................................................................................... 5 Ecodistrict Map ................................................................................................................... 6 Part III METHODOLOGY
Crop Selection............................................................................................................................ 9 Stratification of Sites.................................................................................................................. 9
Municipality Map ............................................................................................................. 11 Random Site Selection ............................................................................................................. 12 Site Selection for Flax and Sunflower Survey ......................................................................... 12 Field Survey Personnel ............................................................................................................ 12 Timing of Weed Counts ........................................................................................................... 13 Weed Counts in Fields ............................................................................................................. 13
Weed List .......................................................................................................................... 14 Data Analysis ........................................................................................................................... 19
Crop Reporting District Map ............................................................................................ 20 Guide to the Use of the Field Survey Summary Tables ........................................................... 22 Limitations, Constraints and Biases ......................................................................................... 22
Part IV FIELD SURVEY SUMMARY TABLES
List of Summary Tables in Part IV .......................................................................................... 25 Province ................................................................................................................................... 29 Ecoregion ................................................................................................................................. 45 Crop Reporting District............................................................................................................ 74 Municipality ........................................................................................................................... 103 Previous Surveys .................................................................................................................... 152
Part V POPULATION SHIFTS 1978 TO 2016 .................................................................................... 163 Part VI DISTRIBUTION MAPS
List of Distribution Maps ....................................................................................................... 165 Maps for Selected Species ..................................................................................................... 166


1
Part I INTRODUCTION History of Weed Survey Activities in Manitoba Early reports on weeds in Manitoba were lists of species with general statements of where they occurred and the seriousness of the problem1. The first indication of the relative importance of seven serious weeds in Manitoba was obtained from reconnaissance surveys in 1930 and 19312. In these surveys, estimates of the prevalence and distributions of species were obtained from government officials and weed inspectors through interviews and questionnaires. Groh and Frankton3 published the results of their reconnaissance survey in 1949. They listed the frequency of occurrence of weeds in various areas of the province. In a questionnaire survey conducted during the 1960s by Alex4, the extension staff was asked to estimate the density and area infested with 40 species of weeds based on their knowledge of their specific Districts. These estimates for municipalities were presented on maps for each species. Although this survey provided information that was of great value at the time, researchers and extension specialists recognized, by the mid-1970s, a need for quantitative data based on weed counts in fields of producers. From 1975 to 1978, a weed survey involving the weed supervisors was conducted during June when the weeds were in the seedling stage5. This survey was the first to obtain quantitative information on the occurrence and size of weed populations in annual crops. The current series of surveys was initiated in 1978. These new surveys differed in the timing of the field counts. Weeds were counted during July and early August. Information on the distribution and abundance of weeds occurring in cereal and oilseed crops in Manitoba was obtained in a series of summer surveys from 1978, 1979 and 19816. A goal of 500 fields was set for each year of the survey. A minimum of ten sites was allocated to each Agricultural District, resulting in an overrepresentation of the Interlake Region in relation to the number of cultivated hectares. Not all the selected sites in a District or all Districts were surveyed each year because of staff limitations and other unforeseen circumstances. Two Districts were not surveyed in 1978, one District was not surveyed in 1979 and two Districts were not surveyed in 1981. Distribution maps were produced for 32 species. A question asked frequently is whether or not the species composition and density of the weed flora have changed since the last survey. Thus, surveys are needed to document the weed picture every few years so that these comparisons can be made. Consecutive annual surveys can only rarely be used to detect trends in weed distribution and abundance because shifts in weed populations occur slowly. Consequently, the initial three years of annual surveys were followed by a second survey conducted five years later in 19867. Three Districts were not surveyed at this time.
1 Fletcher, J. 1897. The worst Canadian weeds. Central Exp. Farm, Canada Department of Agriculture. Bull. No. 28,
Ottawa, ON. 43 pp. 2 Mason, J. M. 1932. Weed survey of the prairie provinces. National Research Council of Canada. Rep. No. 26,
Ottawa, ON. 34 pp 3 Groh, H. and C. Frankton. 1949. Canadian weed survey. 7th Report. Canada Department of Agriculture, Ottawa,
ON. 144 pp. 4 Alex, J. F. 1965. Survey of weeds of cultivated land in the prairie provinces. Exp. Farm, Res. Branch, Canada
Department of Agriculture, Regina, SK. 68 pp. 5 Thomas, A. G. and D. I. Donaghy. 1991. A survey of the occurrence of seedling weeds in spring annual crops in
Manitoba. Can. J. Plant Sci. 71: 811-820. 6 Thomas, A. G. and R. F. Wise. 1984. Weed surveys of Manitoba cereal and oilseed crops in 1978, 1979 and 1981.
Weed Survey Series Publication 84-1, Agriculture Canada, Regina, Saskatchewan. 230 pp. 7 Thomas, A. G. and R. F. Wise. 1988. Weed surveys of Manitoba cereal and oilseed crops in 1986. Weed Survey
Series Publication 88-1, Agriculture Canada, Regina, Saskatchewan. 201 pp.

Introduction – History of Weed Surveys in Manitoba
2
A third survey was conducted eleven years later in 1997 utilized ecodistricts as the strata for the stratified random-sampling of sites8. This resulted in a greater proportion of the surveyed fields allocated to the Northwestern and Southwestern Regions. A goal of 500 fields was set for the survey. One District was not surveyed. A complimentary survey of 116 cereal and oilseed fields was conducted in 1994 to determine if differences in weed populations existed between fields managed with zero and conventional tillage systems9. Each zero tillage field was paired with a nearby conventional field sown to the same crop. Fields were surveyed in the spring prior to spraying and again in the fall after tillage operations in the conventional fields but prior to spraying for winter annual weeds. Only 27 rural municipalities were included in the survey. No fields were surveyed in the Interlake Region. The last provincial survey of Manitoba was completed in 2002 and summarized in a Weed Survey Series Report10. While the protocol was similar to the previous survey, more fields were included. The survey was part of a project to survey 4000 fields across all Prairie Provinces; therefore, the total number of fields surveyed in Manitoba was proportional to the farm area in Manitoba relative to Alberta and Saskatchewan. 631 fields were surveyed. The survey included the major annual cereal and oilseed pulse crops (spring wheat, barley, oats, canola, and flax). A specialized survey of 84 winter wheat fields was conducted in 200911. This survey used similar protocols to the current series of surveys and established a benchmark for the residual weed community in winter wheat in Manitoba.
8 Thomas, A. G., B. L. Frick, R. C. Van Acker, S. Z. Knezevic and D. Joosse. 1998. Manitoba survey of cereal and
oilseed crops in 1997. Weed Survey Series Publication 98-1, Agriculture and Agri-Food Canada, Saskatoon, Saskatchewan. 233 pp. 36 maps.
9 Thomas, A. G., D. J. Kelner, R. F. Wise and B. L. Frick. 1997. Manitoba weed survey comparing zero and conventional tillage crop production systems (1994). Weed Survey Series Publication 97-1, Agriculture and Agri-Food Canada, Saskatoon, Saskatchewan. 130 pp.
10 Leeson, J.Y., A.G. Thomas, T. Andrews, K.R. Brown and R.C. Van Acker. 2002. Manitoba weed survey of cereal and oilseed crops in 2002. Weed Survey Series Publ. 02-2, Agriculture and Agri-Food Canada, Saskatoon Research Centre, Saskatoon, SK. 191 pp.
11 Cavalieri, A., Lewis, D. W. and Gulden, R. H. 2013. Residual weeds in winter wheat in Manitoba. Can. J. Plant Sci. 93: 1195–1200.

Introduction – The 2016 Manitoba Weed Survey Project
3
The 2016 Manitoba Weed Survey Project Rationale Fourteen years have passed since the fourth survey in Manitoba was conducted in 2002. Numerous changes in the agricultural industry since the last survey have presented the need for a new survey with updated information. Soybean, corn and sunflower were included in the survey for the first time in 2016. The increased acreage of soybean and corn would be expected to impact weed populations in the province. The weed survey data can be used to document the changes in the distribution and abundance of weeds that have occurred since the previous provincial surveys in 2002, 1997, 1986 and 1978 to 1981. Changes in weed abundance can be identified because all the surveys since 1978 have used a similar methodology. Individual weeds or groups of species identified as increasing in abundance can be targeted for attention by various agencies involved in weed science. The trends identified by the weed surveys are important to the research, industry, and extension communities for developing weed management recommendations for producers. Objective The objective of the project was to conduct, in 2016, the fifth weed survey in Manitoba since the series of provincial surveys began in the late 1970s. The survey would measure the species compositions and population densities of the weed communities in the major summer annual crops grown in Manitoba. Expected benefits of the provincial weed survey 1. Quantitative field surveys of weed populations are used to reveal the current size, extent, and order of importance of
species in the province, ecoregions, and other spatially defined areas of interest. 2. The spatial distributions of the most common species are represented in maps that clearly illustrate areas of high and
low abundance in relation to the physical landscape and jurisdictional areas of the province. 3. Tracking the increase or decrease in weed populations and the changes in the composition and structure of weed
communities, using the database of survey information from the previous four surveys, will indicate the extent by which various weeds are spreading or being controlled and thus the effectiveness of weed management programs.
4. Crop yield losses due to specific weeds can be estimated and these loss estimates can be used to establish the
economic costs. 5. Weed survey data can provide an objective basis for developing ecologically and economically sustainable strategies
to manage agricultural weeds. The data are used to set research and education priorities, develop recommendations, and design weed management strategies in the research, extension, and agri-business communities.
6. Targeting of increasingly scarce scientific resources requires objective information on the species compositions and
population densities of the weed communities that occur locally, regionally or provincially. Individual species or groups of species can be targeted for attention by various agricultural agencies.
7. Additional benefits of the weed survey will be realized when the results are combined with the information gathered
in the farm management questionnaire survey. The questionnaire survey will provide detailed information on what farmers are doing to produce a crop. By combining the field and questionnaire survey data, particular weed management practices that are important determinants of distinctive weed communities can be determined.
8. Relating trends in weed populations and communities to the use of specific agronomic and weed control practices or
to cropping systems will identify possible reasons that certain weeds have become more or less of a problem on an ecoregion, crop, or provincial basis.
9. Predicting shifts in weed populations and communities that might occur because of anticipated changes in
agronomic practices, weed control management, and agricultural policy will allow agricultural agencies to develop weed management strategies that meet the future needs of farmers.

4
Part II DESCRIPTION OF SURVEYED AREA
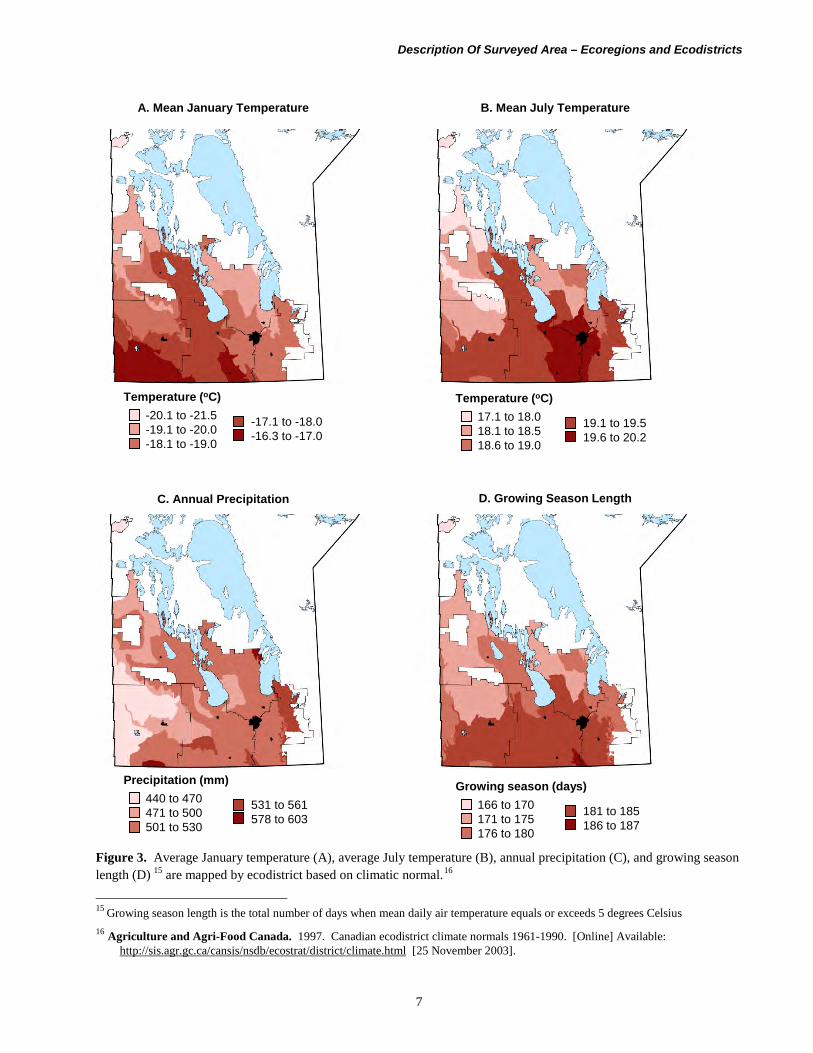
Study Area The survey included the 3.4 million hectares of cultivated land of the province of Manitoba. This area extends from the border with the United States in the south to approximately 54°N, and from the Saskatchewan border in the west to the Boreal Shield on the eastern side of the province. Ecoregions and Ecodistricts The represented by eight ecoregions 12 (Figure 1). Ecoregions are areas of similar landforms, climate, natural vegetation, soils and land use. Each ecoregion consists of one or more ecodistricts (Figure 2). Ecodistricts are areas with similar in landform, relief, surficial material, soil, vegetation and land use. Average January temperature, average July temperature, annual precipitation, and growing season length are mapped by ecodistrict based on climatic normal (Figure 3). The Aspen Parkland Ecoregion occupies the southwestern corner of the province and a small area between Riding Mountain and Duck Mountain. Native vegetation is mostly gone, but would have been dominated by trembling aspen, bur oak and fescue grasslands. The ecoregion is underlain by Cretaceous shale, and is undulating to kettled to gently undulating to level, with glacial till, glaciolacustrine and glaciofluvial deposits. The dominant soil is a Black Chernozem, with pockets of Regosols and Gleysols. This ecoregion is a highly productive agricultural area. All twelve ecodistricts in this ecoregion were included in the survey. The Southwest Manitoba Uplands consists of two distinct uplands (Pembina Hills and Turtle Mountain) in south-central Manitoba surrounded by the Aspen Parkland Ecoregion. The native vegetation is trembling aspen, balsam poplar and bur oak. The Southwest Manitoba Uplands is hummocky to kettled glacial till with fluvioglacial deposits, underlain by Cretaceous or Tertiary shale. The predominant soils are Dark Gray and Black Chernozems, with local areas of Gray Luvisols, peaty Gleysols and Mesisols. Agriculture is significant only in Pembina Hills. The majority of Turtle Mountain is included in a provincial park; therefore, there was one field in this ecodistrict in the survey. The Boreal Transition Ecoregion occurs in Manitoba as a single ecodistrict forming a narrow belt bordering Riding Mountain and Duck Mountain. Trembling aspen and balsam poplar also dominate the native vegetation of this ecoregion. The ecoregion is a hummocky plain, with glacial till and fluvioglacial deposits underlain by Cretaceous shale. Predominant soils are Dark Gray Chernozems, with local areas of Gray Luvisols, peaty Gleysols and Mesisols. The Mid-Boreal Upland Ecoregion occurs as three separate elevated uplands along the Manitoba escarpment known as Porcupine Hills, Duck Mountain and Riding Mountain. Each of these uplands is a unique ecodistrict. Native vegetation in this ecoregion is dominated by trembling aspen, balsam poplar, white and black spruce and balsam fir. This ecoregion consists of kettled to dissected deep glacial till, glaciolacustrine and glaciofluvial deposits overlaying Cretaceous shales. Predominant soils are Gray Luvisols, with local areas of peaty Gleysols, Mesisols, Eutric Brunisols and Dark Gray Chernozems. Agriculture only occurs in the lower elevations surrounding the parks in the two southern ecodistricts.
12 Smith, R. E., H. Veldhuis, G. F. Mills, R. G. Eilers, W. R. Fraser and G. W. Lelyk. 1998. Terrestrial ecozones,
ecoregions, and ecodistricts, an ecological stratification of Manitoba’s natural landscapes. Technical Bulletin 98-9E. Land Resource Unit, Brandon Research Centre, Research Branch, Agriculture and Agri-Food Canada, Winnipeg, Manitoba. Report and national map at 1:1 500 000 scale.

Description Of Surveyed Area – Ecoregions and Ecodistricts
5
Areas included in summaries of:
Interlake Plain
Boreal TransitionMid-Boreal UplandsLake Manitoba Plain
Aspen ParklandSouthwest Manitoba Uplands
Lake of the Woods
InterlakePlain
Boreal Transition
Mid-Boreal Uplands
Lake Manitoba
Plain
Aspen Parkland
Southwest ManitobaUplands
Lake of the Woods
Mid-Boreal Lowland
Aspen Parkland
Figure 1. Area surveyed in ecoregions included in the weed survey. Ecoregions that are grouped in summaries are shaded with the same colour. Map derived from Canadian Soil Information System website13.
13 Agriculture and Agri-Food Canada. 2003. A national ecological framework for Canada: GIS data. [Online]
Available: http://sis.agr.gc.ca/cansis/nsdb/ecostrat/gis_data.html [11 February 2016].

Description Of Surveyed Area – Ecoregions and Ecodistricts
6
717
709
709
715
839840
844843
841
720
723 724
846
375
726
849
853
852
851850
847
848
716
753751
752758 757
759
764854
766765
763760
855
669
677
718
Areas included in summaries of:
Interlake Plain
Boreal TransitionMid-Boreal UplandsLake Manitoba Plain
Aspen ParklandSouthwest Manitoba Uplands
Lake of the Woods
Figure 2. Area surveyed in ecodistricts included in the weed survey. Ecodistrict names are found in Table 2. Map derived from Canadian Soil Information System website14. 14 Agriculture and Agri-Food Canada. 2003. A national ecological framework for Canada: GIS data. [Online]
Available: http://sis.agr.gc.ca/cansis/nsdb/ecostrat/gis_data.html [11 February 2016].
Description Of Surveyed Area – Ecoregions and Ecodistricts
7
B. Mean July TemperatureA. Mean January Temperature
C. Annual Precipitation D. Growing Season Length
531 to 561578 to 603
Precipitation (mm)440 to 470471 to 500501 to 530
181 to 185186 to 187
Growing season (days)166 to 170171 to 175176 to 180
19.1 to 19.519.6 to 20.2
Temperature (oC)17.1 to 18.018.1 to 18.518.6 to 19.0
-17.1 to -18.0-16.3 to -17.0
Temperature (oC)-20.1 to -21.5-19.1 to -20.0-18.1 to -19.0
Figure 3. Average January temperature (A), average July temperature (B), annual precipitation (C), and growing season length (D) 15 are mapped by ecodistrict based on climatic normal.16
15 Growing season length is the total number of days when mean daily air temperature equals or exceeds 5 degrees Celsius 16 Agriculture and Agri-Food Canada. 1997. Canadian ecodistrict climate normals 1961-1990. [Online] Available:
http://sis.agr.gc.ca/cansis/nsdb/ecostrat/district/climate.html [25 November 2003].
Description Of Surveyed Area – Ecoregions and Ecodistricts
8
The Lake Manitoba Plain Ecoregion lies south and west of the Interlake Plain Ecoregion and extends from the USA-Canada border in a northwestern direction to Lake Dauphin. It is transitional between boreal forest and aspen parkland. Native vegetation is dominated by trembling aspen, bur oak and fescue grassland. The ecoregion is underlain by limestone, and has broadly ridged glacial till in the north and smooth lacustrine deposits in the south. The predominant soil is a Black Chernozem, with local pockets of Gleysols and Vertisols. All twelve ecodistricts in this ecoregion were included in the survey. The Interlake Plain Ecoregion extends in a broad arc from the USA-Canada border at the southern edge of the province in a north western direction to the Saskatchewan border. Native vegetation in this ecoregion is dominated by trembling aspen and balsam poplar. The ecoregion is level to ridged, with glacial till and glaciolacustrine deposits underlain by Paleozoic limestone. Predominant soils are Dark Gray Chernozems, with local areas of Black Chernozems, Eutric Brunisols, Gleysols and Mesisols. Sites were allocated in all six ecodistricts in this ecoregion. However, much of the north eastern portion of the ecoregion is not used for agriculture. The Mid-Boreal Lowland Ecoregion is north of the main agricultural area in Manitoba extending into eastern Saskatchewan. The majority of this ecoregion is not suitable for agriculture; however, grain and oilseed crops are produced where soils and drainage allow. This ecoregion is represented in the weed surveys by two ecodistricts. Cereals and oilseeds are grown on the alluvial soils in the Saskatchewan Delta, the northernmost ecodistrict included in the survey. Agricultural area in the Grindstone is found adjacent to the Interlake Plain Ecoregion. The survey data from this ecoregion is combined with data from the Interlake Plain Ecoregion in the weed summaries. The Lake of the Woods Ecoregion occupies the southeastern corner of the province. This ecoregion is a mixed forest region, with native vegetation dominated by trembling aspen, paper birch, jack pine, white spruce, eastern white cedar, black ash and white elm. The area has glacial till with fluvioglacial deposits, overlaying Archean bedrock. The predominant soils are Organics Mesisols, Fibrisols, Brunisols, and Gray Luvisols with Dark Gray Chernozemic and Gleysolic soils found in local areas. Agriculture is not a major occupation in this ecoregion, limited to lowlands along rivers and streams where artificial drainage systems have been developed. Only one of the five ecodistricts, located along the western edge of the ecoregion, had enough cultivated area to be included in the survey.

9
Part III METHODOLOGY
Crop Selection The selection of annual crops to be included in the survey was based on the 2015 seeded area for the province17 (Table 1). A minimum of 20 fields was set as the limit for inclusion of a crop in the general survey. Based on a survey target of 600 fields in Manitoba, the six most common annual crops were selected. Table 1. Area of the crops selected for the survey and the number of fields allocated to each crop
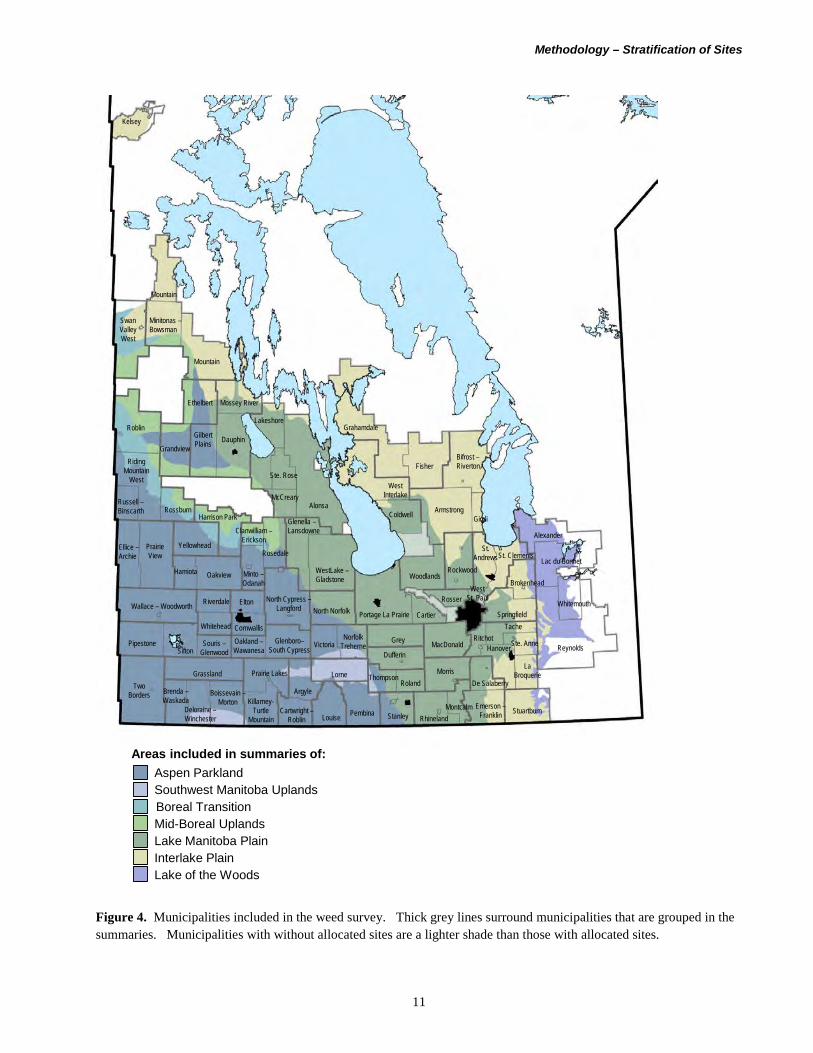
Seeded area Proportion of area Expected number Crop (1,000 acres) (%) of fields Canola 3140 36.3 217 Spring wheat 2915 33.7 202 Soybean 1385 16.0 96 Oats 480 5.5 33 Barley 400 4.6 28 Corn 340 3.9 24 Total 8660 600 Flax and sunflower were the next most common annual crops in Manitoba (seeded area of 125,000 and 100,000 acres, respectively). Weed populations in these crops were of particular interest; however, there was not enough acreage either of these crops to expect to reach the minimum number of fields through random site selection. Therefore, a separate survey of these two crops was conducted using different selection procedures. The results for these two crops are also included in this report. A target of twenty fields of each of these crops was set, for a total of 640 fields surveyed in 2016. Stratification of Sites Ecodistricts were used as the strata in a stratified random-sampling procedure. The number of fields in an ecodistrict was allocated in proportion to the seeded area of the selected crops in the ecodistrict, relative to the total area seeded to selected crops in all ecodistricts (Table 2). Hectarage of field crops derived from the 2011 census data of Statistics Canada for each soil landscape complex (a subunit of ecodistrict)18 was summed to obtain hectarage per ecodistrict. To facilitate the organization of the survey for provincial staff, fields allocated to ecodistricts were subsequently allocated to municipalities based on proportion of each ecodistrict’s area cultivated in each municipality (Figure 4). Four municipalities within the surveyed area did not have enough agricultural land base to have allocated sites (East St. Paul, St. Francois Xavier, St. Laurent and Headingly).
17 Statistics Canada. 2016. Table 001-0010 - Estimated areas, yield, production and average farm price of principal
field crops, in metric units, annual, CANSIM (database). [Online] Available: http://www5.statcan.gc.ca/cansim/a47 [accessed: January 12, 2017].
18 Agriculture and Agri-Food Canada. 2013. Production variables by SLC v3.2 from 2011. [Online] Available: http://www.agr.gc.ca/atlas/rest/services/mapservices/aafc_interpolated_census_of_agriculture/MapServer [19 October 2015].

Methodology – Stratification of Sites
10
Table 2. Allocation of sites based on ecodistrict area for the survey of common annual crops and number of sites surveyed in each ecodistrict in the surveys of common annual crops, flax and sunflower Common Annual Crops Flax Sunflower Ecoregion and Ecodistrict Allocated Surveyed Surveyed Surveyed Lake of the Woods 10 11 375 Stead 10 11
Interlake Plain including Mid-Boreal Lowland (Ecodisticts 669 & 677) 55 58 2 1 717 Swan Lake 18 16 718 Waterhen 1 0 720 Gypsumville 1 2 723 Ashern 4 4 1 724 Gimli 23 27 1 1 726 Steinbach 7 7 669 Saskatchewan Delta 1 1 677 Grindstone 1 1
Boreal Transition 23 25 709 Swan River 23 25
Mid-Boreal Uplands 12 15 715 Duck Mountain 3 3 716 Riding Mountain 9 12
Aspen Parkland 246 253 13 8 751 St. Lazare 5 5 752 Melville 9 9 753 Hamiota 69 71 5 757 Shilo 13 14 758 Stockton 24 26 1 3 759 Carberry 7 7 1 760 Gainsborough Creek 2 4 763 Oak Lake 15 12 1 1 764 Hilton 10 10 1 765 Killarney 48 53 3 1 766 Manitou 31 31 2 2 839 Grandview 13 11
Lake Manitoba Plain 240 243 4 8 840 Dauphin 12 8 841 Alonsa 10 9 843 Ste. Rose 4 3 844 McCreary 8 7 846 Lundar 2 1 847 Gladstone 7 8 848 Langruth 1 1 849 Winnipeg 110 114 3 5 850 MacGregor 21 19 1 851 Portage 12 14 852 Winkler 46 48 3 853 Emerson 8 11
Southwest Manitoba Uplands 14 14 2 1 854 Pembina Hills 13 13 2 1 855 Turtle Mountain 1 1
Manitoba 600 619 21 18
Methodology – Stratification of Sites
11
Alexander
Alonsa
Argyle
Armstrong
Bifrost –Riverton
Reynolds
Roblin
Rockwood
Rossburn
Sifton
St. Andrews
Ste. Anne
Swan Valley West
Two Borders
Wallace – Woodworth
Rhineland
Riverdale
Roland
Rosser
Souris –Glenwood
St. Clements
Ste. Rose
Tache
Victoria
WestLake –Gladstone
West St. Paul
Riding Mountain
West
Ritchot
Rosedale
Russell –Binscarth
Springfield
StanleyStuartburn
Thompson
Whitehead
Whitemouth
Woodlands
Yellowhead
Boissevain –Morton
Ellice –Archie
Clanwilliam –Erickson
Cornwallis
Brenda –Waskada
Dauphin
De Salaberry
Brokenhead
Deloraine –Winchester
Fisher
Dufferin
Gilbert Plains
CartierElton
Gimli
Morris
Emerson –Franklin
Grahamdale
Lac du Bonnet
Grandview
Killarney-Turtle
MountainCartwright –
Roblin
Ethelbert
Grassland
Kelsey
MacDonaldGreyHanover
McCreary
Harrison Park
Minitonas –Bowsman
Glenella –Lansdowne
Hamiota
La Broquerie
Minto –Odanah
North Cypress –Langford
Lorne
Montcalm
North Norfolk
Mossey River
Oakland –Wawanesa
Lakeshore
Louise
Mountain
Oakview
Portage La Prairie
Norfolk Treherne
Pembina
Prairie Lakes
Pipestone
Prairie View
Glenboro–South Cypress
Mountain
West Interlake
Coldwell
Areas included in summaries of:
Interlake Plain
Boreal TransitionMid-Boreal UplandsLake Manitoba Plain
Aspen ParklandSouthwest Manitoba Uplands
Lake of the Woods
Figure 4. Municipalities included in the weed survey. Thick grey lines surround municipalities that are grouped in the summaries. Municipalities with without allocated sites are a lighter shade than those with allocated sites.

Methodology –Site Selection
12
Random Site Selection The random selection of sites used the legal land description grid established by the Dominion Land Survey System19 in western Canada. A random sample was selected from all quarter sections (65 ha) that had greater than 16 cultivated hectares within each target ecodistrict and municipality. A list that contained eight times the allocated number of sites was developed for each ecodistrict. Land owner information for the list of Legal Land Descriptions was acquired from the Manitoba Agricultural Services Corporation, and then telephone numbers were added as necessary from local telephone directories. Manitoba Agriculture and Agriculture and Agri-Food Canada staff acted as the primary contact point for producers. Producers were contacted beginning in the last week in May and continuing through July. Sites were qualified, in the order that they were listed, until the required number of fields had been obtained. A site qualified if the person who farmed the land answered yes to all of the following questions.
1. Will you grant permission for a surveyor to count weeds on the selected quarter section during July or August? 2. Is there a field in the quarter section seeded to a selected crop? 3. Is the identified field accessible by road? 4. Do you agree to complete a questionnaire on management practices used on the identified field in the fall?
If a field in a quarter section did not qualify, an attempt was made to qualify a nearby field. This step was followed only if the land was farmed by the same person as the preselected quarter section. For each site, the following information was recorded into a database:
(a) the name, mailing address, and telephone number of the farm operator for the qualified fields, (b) a new quarter section if it had been changed from the preselected site, (c) the crop seeded in the selected field and the identity of the underseeded crop if present,
Site Selection for Flax and Sunflower Survey Randomly selected fields in the general survey that were seeded to flax or sunflower were qualified for inclusion in the survey. Eight flax fields and two sunflower fields were identified in this manner. Additional fields were identified by Manitoba Agriculture staff and permission to conduct the survey was subsequently obtained from the producers. A total of 21 flax and 18 sunflower fields were surveyed. Field Survey Personnel and Training The majority of the fields were surveyed by Manitoba Agriculture staff (79%) and University of Manitoba students (12%). Independent contractors surveyed the remaining fields. A total of 34 people contributed to the weed counts. A full-day orientation session was held in Brandon at the Assiniboine Community College (ACC) on June 29 prior to the start of the field survey. The purpose of the session was to explain reasons for conducting a weed survey, how to implement the protocol, how to handle unknown weeds, how to collect samples and how to record the weed data on the field sheets. Much of the session was devoted to weed identification, including a slide show and a tour of the ACC weed garden. Potential identification problems with specific groups of species were highlighted during the session.
19 McKercher, R. B. and B. Wolfe. 1986. Understanding Western Canada’s Dominion Land Survey System. Division
of Extension and Community Relations, University of Saskatchewan, Saskatoon, SK.
Methodology –Weed Counts
13
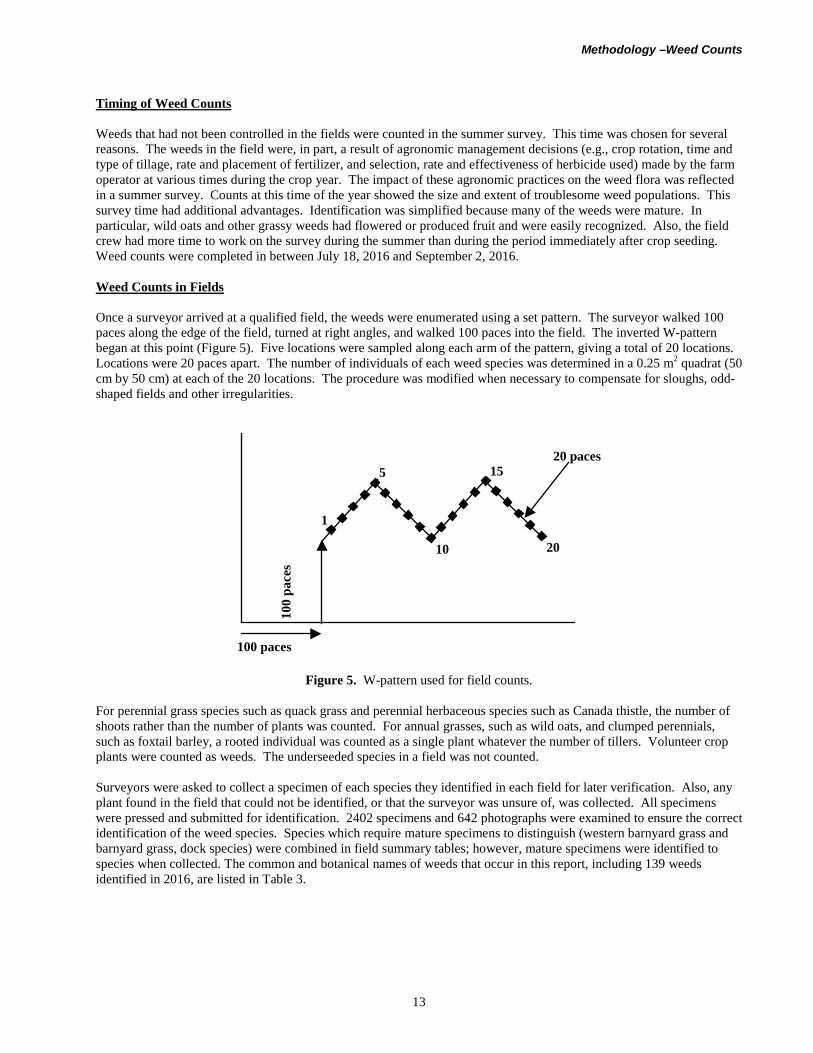
Timing of Weed Counts Weeds that had not been controlled in the fields were counted in the summer survey. This time was chosen for several reasons. The weeds in the field were, in part, a result of agronomic management decisions (e.g., crop rotation, time and type of tillage, rate and placement of fertilizer, and selection, rate and effectiveness of herbicide used) made by the farm operator at various times during the crop year. The impact of these agronomic practices on the weed flora was reflected in a summer survey. Counts at this time of the year showed the size and extent of troublesome weed populations. This survey time had additional advantages. Identification was simplified because many of the weeds were mature. In particular, wild oats and other grassy weeds had flowered or produced fruit and were easily recognized. Also, the field crew had more time to work on the survey during the summer than during the period immediately after crop seeding. Weed counts were completed in between July 18, 2016 and September 2, 2016. Weed Counts in Fields Once a surveyor arrived at a qualified field, the weeds were enumerated using a set pattern. The surveyor walked 100 paces along the edge of the field, turned at right angles, and walked 100 paces into the field. The inverted W-pattern began at this point (Figure 5). Five locations were sampled along each arm of the pattern, giving a total of 20 locations. Locations were 20 paces apart. The number of individuals of each weed species was determined in a 0.25 m2 quadrat (50 cm by 50 cm) at each of the 20 locations. The procedure was modified when necessary to compensate for sloughs, odd-shaped fields and other irregularities.
100 paces
100
pace
s
5
1
10
15
20
20 paces
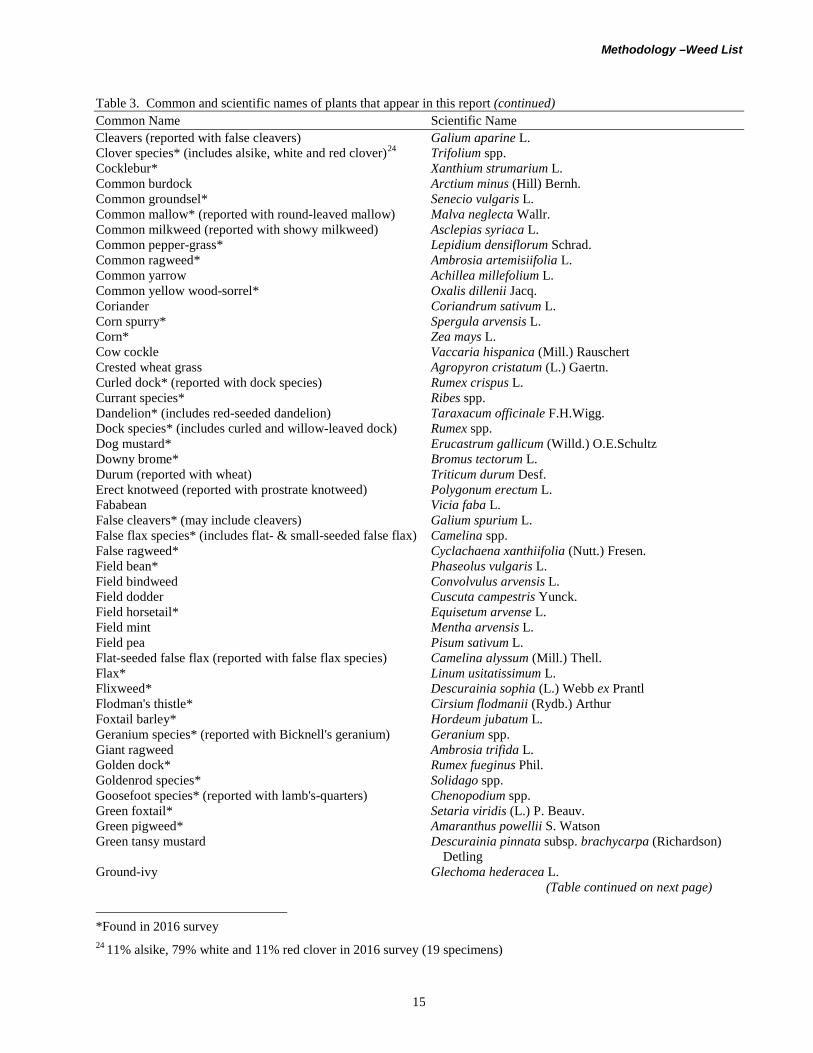
Figure 5. W-pattern used for field counts. For perennial grass species such as quack grass and perennial herbaceous species such as Canada thistle, the number of shoots rather than the number of plants was counted. For annual grasses, such as wild oats, and clumped perennials, such as foxtail barley, a rooted individual was counted as a single plant whatever the number of tillers. Volunteer crop plants were counted as weeds. The underseeded species in a field was not counted. Surveyors were asked to collect a specimen of each species they identified in each field for later verification. Also, any plant found in the field that could not be identified, or that the surveyor was unsure of, was collected. All specimens were pressed and submitted for identification. 2402 specimens and 642 photographs were examined to ensure the correct identification of the weed species. Species which require mature specimens to distinguish (western barnyard grass and barnyard grass, dock species) were combined in field summary tables; however, mature specimens were identified to species when collected. The common and botanical names of weeds that occur in this report, including 139 weeds identified in 2016, are listed in Table 3.

Methodology –Weed List
14
Table 3. Common20 and scientific names21 of plants that appear in this report Common Name Scientific Name Absinth* Artemisia absinthium L. Alfalfa* Medicago sativa L. Alsike clover* (reported with clover species) Trifolium hybridum L. American dragonhead* Dracocephalum parviflorum Nutt. American stinging nettle Urtica dioica subsp. gracilis (Aiton) Selander American vetch* (may include other vetch species) Vicia americana Muhl. ex Willd. var. americana Annual blue grass (reported with blue grass species) Poa annua L. Annual sow-thistle* Sonchus oleraceus L. Aspen poplar (reported with poplar species) Populus tremuloides Michx. Aster species* Aster spp. Atriplex species Atriplex spp. Ball mustard Neslia paniculata (L.) Desv. Balsam poplar (reported with poplar species) Populus balsamifera L. Barley* Hordeum vulgare L. Barnyard grass* Echinochloa spp. (includes western barnyard grass and barnyard grass)22 Barnyard grass* (reported with barnyard grass species) Echinochloa crus-galli (L.) P.Beauv. Beggarticks species* Bidens spp. Bicknell's geranium* (includes other geranium species)23 Geranium bicknellii Britton Biennial campion Silene csereii Baumg. Biennial wormwood* Artemisia biennis Willd. Bird's-foot trefoil* Lotus corniculatus L. Black medick* Medicago lupulina L. Black mustard Brassica nigra (L.) W.D.J. Koch Black nightshade (reported with nightshade species) Solanum nigrum L. Bladder campion* Silene vulgaris (Moench) Garcke Blue grass species* Poa spp. Bluebur (includes western bluebur) Lappula squarrosa (Retz.) Dumort. Blue-joint* Calamagrostis canadensis (Michx.) P.Beauv. Bracted vervain Verbena bracteata Lag. & Rodr. Broad-leaved plantain* (includes other plantain species) Plantago major L. Buckwheat Fagopyrum esculentum Moench Buffalograss* Bouteloua dactyloides (Nutt.) Columbus Bur oak* Quercus macrocarpa Michx. Canada blue grass* (reported with blue grass species) Poa compressa L. Canada fleabane* Erigeron canadensis L. Canada thistle* Cirsium arvense (L.) Scop. Canary grass Phalaris canariensis L. Canola/rapeseed* Brassica napus L. and B. rapa L. Caraway Carum carvi L. Carolina geranium* (reported with Bicknell's geranium) Geranium carolinianum L. Chickweed* Stellaria media (L.) Vill. Clammy hedge-hyssop* Gratiola neglecta Torr. (Table continued on next page) 20 Darbyshire, S. J., M. Favreau and M. Murray. 2000. Common and Scientific Names of Weeds in Canada.
Publication 1397/B, Agriculture and Agri-Food Canada, Ottawa, ON. 132 pp. 21 Brouillet, L., F. Coursol, S.J. Meades, M. Favreau, M. Anions, P. Bélisle & P. Desmet. 2010+. VASCAN, the
Database of Vascular Plants of Canada. http://data.canadensys.net/vascan/ (consulted on 2017-01-06).
*Found in 2016 survey 22 51% western barnyard grass and 49% barnyard grass in 2016 survey (83 specimens) 23 71% Bicknell's geranium and 29% Carolina geranium in 2016 survey (7 specimens)
Methodology –Weed List
15
Table 3. Common and scientific names of plants that appear in this report (continued) Common Name Scientific Name Cleavers (reported with false cleavers) Galium aparine L. Clover species* (includes alsike, white and red clover)24 Trifolium spp. Cocklebur* Xanthium strumarium L. Common burdock Arctium minus (Hill) Bernh. Common groundsel* Senecio vulgaris L. Common mallow* (reported with round-leaved mallow) Malva neglecta Wallr. Common milkweed (reported with showy milkweed) Asclepias syriaca L. Common pepper-grass* Lepidium densiflorum Schrad. Common ragweed* Ambrosia artemisiifolia L. Common yarrow Achillea millefolium L. Common yellow wood-sorrel* Oxalis dillenii Jacq. Coriander Coriandrum sativum L. Corn spurry* Spergula arvensis L. Corn* Zea mays L. Cow cockle Vaccaria hispanica (Mill.) Rauschert Crested wheat grass Agropyron cristatum (L.) Gaertn. Curled dock* (reported with dock species) Rumex crispus L. Currant species* Ribes spp. Dandelion* (includes red-seeded dandelion) Taraxacum officinale F.H.Wigg. Dock species* (includes curled and willow-leaved dock) Rumex spp. Dog mustard* Erucastrum gallicum (Willd.) O.E.Schultz Downy brome* Bromus tectorum L. Durum (reported with wheat) Triticum durum Desf. Erect knotweed (reported with prostrate knotweed) Polygonum erectum L. Fababean Vicia faba L. False cleavers* (may include cleavers) Galium spurium L. False flax species* (includes flat- & small-seeded false flax) Camelina spp. False ragweed* Cyclachaena xanthiifolia (Nutt.) Fresen. Field bean* Phaseolus vulgaris L. Field bindweed Convolvulus arvensis L. Field dodder Cuscuta campestris Yunck. Field horsetail* Equisetum arvense L. Field mint Mentha arvensis L. Field pea Pisum sativum L. Flat-seeded false flax (reported with false flax species) Camelina alyssum (Mill.) Thell. Flax* Linum usitatissimum L. Flixweed* Descurainia sophia (L.) Webb ex Prantl Flodman's thistle* Cirsium flodmanii (Rydb.) Arthur Foxtail barley* Hordeum jubatum L. Geranium species* (reported with Bicknell's geranium) Geranium spp. Giant ragweed Ambrosia trifida L. Golden dock* Rumex fueginus Phil. Goldenrod species* Solidago spp. Goosefoot species* (reported with lamb's-quarters) Chenopodium spp. Green foxtail* Setaria viridis (L.) P. Beauv. Green pigweed* Amaranthus powellii S. Watson Green tansy mustard Descurainia pinnata subsp. brachycarpa (Richardson)
Detling Ground-ivy Glechoma hederacea L. (Table continued on next page)
*Found in 2016 survey
24 11% alsike, 79% white and 11% red clover in 2016 survey (19 specimens)

Methodology –Weed List
16
Table 3. Common and scientific names of plants that appear in this report (continued) Common Name Scientific Name Hairy nightshade* (reported with nightshade species) Solanum sarrachoides Sendtn. Hairy-nerved carrionflower Smilax lasioneura Hook. Hare's-ear mustard Conringia orientalis (L.) C.Presl Hedge bindweed* Calystegia sepium (L.) R.Br. Hemp dogbane (reported with spreading dogbane) Apocynum cannabinum L. Hemp-nettle* Galeopsis tetrahit L. Henbit Lamium amplexicaule L. Indian mustard Brassica juncea (L.) Czern. Kentucky blue grass* (reported with blue grass species) Poa pratensis L. Knawel Scleranthus annuus L. Kochia* Bassia scoparia (L.) A.J.Scott Lady's-thumb* (reported with pale smartweed) Persicaria maculosa Gray Lamb's-quarters* (includes other goosefoot species) Chenopodium album L. Large crab grass* Digitaria sanguinalis (L.) Scop. Leafy spurge* Euphorbia esula L. Low cudweed* (may include western marsh cudweed) Gnaphalium uliginosum L. Manitoba maple* Acer negundo L. Maple-leaved goosefoot* Chenopodium simplex (Torr.) S.Fuentes, Uotila & Borsch Marsh yellow cress* Rorippa palustris (L.) Besser Meadow rue species Thalictrum spp. Mouse-eared chickweed Cerastium fontanum subsp. vulgare (Hartm.) Greuter &
Burdet Narrow-leaved American vetch* Vicia americana var. minor Hook. (reported with American vetch) Narrow-leaved hawk's-beard* Crepis tectorum L. Narrow-leaved plantain* Plantago lanceolata L. (reported with broad-leaved plantain) Needle-and-thread grass* Hesperostipa comata (Trin. & Rupr.) Barkworth subsp.
comata Night-flowering catchfly* Silene noctiflora L. Nightshade species* (includes hairy and black nightshade) Solanum spp. Northern bedstraw* Galium boreale L. Northern willowherb* Epilobium ciliatum Raf. Oak-leaved goosefoot* Oxybasis glauca (L.) S.Fuentes et al. subsp. glauca Oats* Avena sativa L. Orchard grass* Dactylis glomerata L. Pale smartweed* (includes lady's-thumb)25 Persicaria lapathifolia (L.) Delarbre Pasture sage Artemisia frigida Willd. Pennsylvania pellitory* Parietaria pensylvanica Muhl. ex Willd Perennial rye grass* (may include other rye grass species) Lolium perenne L. Perennial sow-thistle* Sonchus arvensis L. Persian darnel Lolium persicum Boiss. & Hohen. ex Boiss. Pineappleweed* Matricaria discoidea DC. Poplar species (includes aspen and balsam poplar) Populus spp. Povertyweed* Iva axillaris Pursh Prairie junegrass Koeleria macrantha (Ledeb.) Schult. Prairie sunflower Helianthus petiolaris Nutt. Prickly lettuce* Lactuca serriola L. Proso millet* Panicum miliaceum L. (Table continued on next page)
*Found in 2016 survey
25 98% pale smartweed and 2% lady's-thumb in 2016 survey (122 specimens)

Methodology –Weed List
17
Table 3. Common and scientific names of plants that appear in this report (continued) Common Name Scientific Name Prostrate knotweed* (may include erect knotweed) Polygonum aviculare L. Prostrate pigweed* Amaranthus blitoides S.Watson Purple milk-vetch Astragalus agrestis Douglas ex G.Don Purslane speedwell* Veronica peregrina L. Purslane* Portulaca oleracea L. Pygmyflower Androsace septentrionalis L. Quack grass* Elymus repens (L.) Gould Rayless aster* Symphyotrichum ciliatum (Ledeb.) G.L.Nesom Red clover* (reported with clover species) Trifolium pratense L. Red goosefoot Oxybasis rubra (L.) S.Fuentes, Uotila & Borsch Redroot pigweed* Amaranthus retroflexus L. Red-seeded dandelion (reported with dandelion) Taraxacum erythrospermum Andrz Ridge-seeded spurge (reported with thyme-leaved spurge) Euphorbia glyptosperma Engelm. Rose species Rosa spp. Rough cinquefoil* (may include other cinquefoil species) Potentilla norvegica L. Rough hair grass* Agrostis scabra Willd. Rough pennyroyal Hedeoma hispida Pursh Round-leaved mallow* (includes common mallow)26 Malva pusilla Sm. Rush species* Juncus spp. Russian pigweed Axyris amaranthoides L. Russian thistle* Salsola tragus L. Rye* Secale cereale L. Scentless chamomile* Tripleurospermum inodorum (L.) Sch.Bip. Scouring-rush* Equisetum hyemale L. Sedge species* Carex spp. Shepherd's-purse* Capsella bursa-pastoris (L.) Medik. Short-awned foxtail* Alopecurus aequalis Sobol. Showy milkweed* (may include common milkweed) Asclepias speciosa Torr. Siberian elm* Ulmus pumila L. Silverberry Elaeagnus commutata Bernh. ex Rydb. Silverweed* Potentilla anserina L. Silvery cinquefoil Potentilla argentea L. Slender wheat grass Elymus trachycaulus (Link) Gould ex Shinners Slough grass* Beckmannia syzigachne (Steud.) Fernald Small bugloss Anchusa arvensis (L.) M.Bieb. Small-flowered geranium (reported with Bicknell's geranium) Geranium pusillum L. Small-seeded false flax* (reported with false flax species) Camelina microcarpa Andrz. ex DC. Smooth brome (may include other perennial brome species)* Bromus inermis Leyss. Soybean* Glycine max (L.) Merr. Spear-leaved goosefoot* Blitum nuttallianum Schult. Spiny annual sow-thistle* Sonchus asper (L.) Hill Spreading dogbane (may include hemp dogbane) Apocynum androsaemifolium L. Stink grass* Eragrostis cilianensis (All.) Vignolo ex Janch. Stinkweed* Thlaspi arvense L. Stork's-bill* Erodium cicutarium (L.) L'Hér. ex Aiton Striate knotweed Polygonum achoreum S.F.Blake Sunflower* Helianthus annuus L. Tall buttercup Ranunculus acris L. Tall hedge mustard Sisymbrium loeselii L. (Table continued on next page)
*Found in 2016 survey
26 87% round-leaved mallow and 13% common mallow in 2016 survey (23 specimens)

Methodology –Weed List
18
Table 3. Common and scientific names of plants that appear in this report (continued) Common Name Scientific Name Tansy Tanacetum vulgare L. Tartary buckwheat* Fagopyrum tataricum (L.) Gaertn. Thyme-leaved spurge* (may include ridge-seeded spurge) Euphorbia serpillifolia Pers. Timothy* Phleum pratense L. Toad rush* Juncus bufonius L. Tumble mustard Sisymbrium altissimum L. Tumble pigweed* Amaranthus albus L. Two-grooved milk-vetch Astragalus bisulcatus (Hook.) A.Gray Vetch species (reported with American vetch) Vicia spp. Vetchling species Lathyrus spp. Water smartweed* Persicaria amphibia var. stipulacea (N. Coleman) H.Hara Western barnyard grass* Echinochloa muricata var. microstachya Wiegand (reported with barnyard grass species) Western bluebur (reported with with bluebur) Lappula occidentalis (S. Watson) Greene Western marsh cudweed (reported with low cudweed) Gnaphalium palustre Nutt. Western snowberry* Symphoricarpos occidentalis Hook. Wheat* (may include durum) Triticum aestivum L. White clover* (reported with clover species) Trifolium repens L. White cockle* Silene latifolia Poir. White mustard* Sinapis alba L. White sweet-clover* (reported with yellow sweet-clover) Melilotus albus Medik. Wild buckwheat* Fallopia convolvulus (L.) Á.Löve Wild cucumber Echinocystis lobata (Michx.) Torr. & A.Gray Wild licorice Glycyrrhiza lepidota Pursh Wild mustard* Sinapis arvensis L. Wild oats* Avena fatua L. Wild radish Raphanus raphanistrum L. Wild tomato Solanum triflorum Nutt. Willow species* Salix spp. Willow-leaved dock* (reported with dock species) Rumex triangulivalvis (Danser) Rech. f. Witch grass* Panicum capillare L. Wood whitlow-grass Draba nemorosa L. Wormseed mustard* Erysimum cheiranthoides L. Yellow evening-primrose* Oenothera biennis L. Yellow foxtail* Setaria pumila (Poir.) Roem. & Schult. Yellow nut sedge Cyperus esculentus L. Yellow rocket Barbarea vulgaris W.T.Aiton Yellow sweet-clover* (includes white sweet-clover) Melilotus officinalis (L.) Lam. Yellow toadflax* Linaria vulgaris Mill. *Found in 2016 survey

Methodology – Data Analysis
19
Data Analysis Weed count data on field sheets were numerically coded, entered into computer files, and verified. Data were processed in Microsoft® Excel and summary tables were produced following the standard format used in previous Weed Survey Series Reports. For the first time in a Manitoba Weed Survey Report, the data was weighted. The 2016 data was weighted by crop to allow the use of all collected data in area summaries without bias toward sunflower and flax. The crop weights were calculated by taking the ratio of the expected number of fields in the province with the crop based on 2016 seeded acres27 to the number of fields surveyed in each crop. Subsequently all data were weighted to account for sites not surveyed. The field weights were calculated by taking the ratio of the expected number of fields in the ecodistrict to the number of fields surveyed in the ecodistrict (see stratification of sites). To account for ecodistricts without any surveyed sites, weights were multiplied by the ratio of the expected number of fields within the ecoregion to the number of fields surveyed within the ecoregion. Previous survey data presented in this report was not weighted by crop but was weighted to account for sites not surveyed based on the 2011 Census of Agriculture to allow meaningful comparisons to the 2016 data. The median density, mean density, mean number of species per field and percentage of weed free quadrats were calculated for each crop, ecoregion, crop district and region based on the weighted data. Standard errors were calculated for the means and percentage of weed free quadrats. Weed data were summarized in tables using ecological, agronomic, and jurisdictional variables including ecoregion (Figure 1), crop, Municipality (Figure 4) and Crop Reporting District (Figure 6). A minimum of ten sites was set to allow meaningful summarization. Where these minima were not reached for a crop, a summary table was not provided, but data were retained in other appropriate summaries. For example, a separate summary table for oat in the Aspen Parkland Ecoregion was not provided; however, the fields were included in the appropriate overall summaries for areas and provincial oat summaries. Geographic areas (ecoregions and municipalities) with fewer fields than required were combined with adjacent areas. The geographic distribution of 35 frequently occurring species is presented in maps produced with ArcMap GIS 10.2 from Environmental Systems Research Institute, Inc.. Inverse Distance Weighting was used to estimate frequency of the species by interpolating presence/absence data. The interpolation included all sites within used a fixed radius of 0.2° (approximately 22 km) extended if necessary to include a minimum of twenty sites. The sites were given a weight of inverse of the square root of the distance to the interpolated point. The data presented is smoothed using nearest neighbour focal statistics, based on the means within a four cell radius. The maps of volunteer crops (canola and wheat) do not include fields planted to the volunteer crop. Additionally, separate maps were made to show the current distribution of western barnyard grass and barnyard grass. Barnyard grass species were not identified to the species level in previous surveys; therefore, historical data is only presented at the genus level.
27 Statistics Canada. 2016. Table 001-0010 - Estimated areas, yield, production and average farm price of principal
field crops, in metric units, annual, CANSIM (database). [Online] Available: http://www5.statcan.gc.ca/cansim/a47 [accessed: October 12, 2016].

Methodology – Data Analysis
20
Areas included in summaries of:
Interlake Plain
Boreal TransitionMid-Boreal UplandsLake Manitoba Plain
Aspen ParklandSouthwest Manitoba Uplands
Lake of the Woods
Interlake
Southwest
Central
Northwest
Eastern
Figure 6. Crop Reporting Districts 28 included in the weed survey. Grey lines are municipality boundaries and thick black lines are Crop Reporting District boundaries.
28 Manitoba Agriculture. 2016. Crop Report. [Online] Available:
http://www.gov.mb.ca/agriculture/crops/cropreports/pdf/mb_agri_rptg_map_2012.pdf [31 January 2017].

Methodology – Data Analysis
21
Data were summarized using seven quantitative variables. Details for the calculation of these variables are described elsewhere29. Frequency. The number of fields in which a particular species occurred, expressed as a percentage of the total number of fields surveyed in groups such as crops or ecoregions, and in the province. Field uniformity (all fields). The number of quadrats in which a particular species occurred, expressed as a percentage of all the quadrats surveyed in groups such as crops or ecoregions, and in the province (20 per field multiplied by the number of fields). Field uniformity (occurrence fields). The number of quadrats in which a particular species occurred, expressed as a percentage of the number of quadrats in groups such as crops or ecoregions, and in the province for the occurrence fields only (20 per field multiplied by the number of fields in which the species occurred). Field density (all fields). A measure of the number of plants of a species counted in a square metre. The density values for each species in a single field are averaged over all fields surveyed in groups such as crops, ecoregions, and in the province. Field density (occurrence fields). A measure of the number of plants of each species counted in a square metre. The density values for each species in a single field are averaged over only the fields in which the weed occurred in groups such as crops or ecoregions, and in the province. High density. The highest field density values recorded for a species in groups such as in groups such as crops or ecoregions, and in the province. Relative abundance. A combination of the frequency, field uniformity (all fields) and field density (all fields) values for each species. Relative frequency for a species (RF) is the frequency value for a species divided by the sum of frequency values for all species, expressed as a percentage. Relative field uniformity (all fields) for a species (RU) is the field uniformity value for a species divided by the sum of field uniformity values for all species, expressed as a percentage. Relative field density (all fields) for a species (RD) is the field density value for a species divided by the sum of field density values for all species, expressed as a percentage. Relative abundance for a species = RF + RU + RD. The total of the relative abundance values for all species equals 300. This measure was used to rank the species in the field survey summary tables. This calculation assumed that the frequency, field uniformity and field density measures were equally important in estimating the abundance of a species. Relative abundance has no units attached to it, but the value for one species can be compared with the value of another species. For example, if green foxtail has a value of 36 and wild buckwheat 18, then green foxtail is twice as abundant as wild buckwheat. Relative abundance does not necessarily relate to the competitive ability of the species. A species may have a high relative abundance value but not be very competitive.
29 Thomas, A. G. 1985. Weed survey system used in Saskatchewan for cereal and oilseed crops. Weed Science 33: 34-
43.

Methodology – Limitations
22
Guide to the Use of the Field Survey Summary Tables For the purposes of illustration, the meaning of the variables is explained for the species green foxtail in the provincial summary table (Table 5). A frequency of 24.4% means that green foxtail occurred at least once in 161 of the 658 fields surveyed. This variable estimates the geographic extent of the weed. Field uniformity shows the proportion of quadrats (20 per field) in which the species occurred. In the example, the value for all field uniformity means that green foxtail occurred in 10.0% of the quadrats surveyed. This variable can be used as an estimate of the area occupied by a weed. The occurrence field uniformity value means that green foxtail was present in 41.1% of the quadrats when considering only the 161 occurrence fields. Three density variables are included in the tables. Green foxtail had an occurrence field density of 14.6 plants per square metre and an all field density of 3.6 plants per metre square. The density for fields in which the species occurred is always equal to or higher than the density for all the fields in the summary. The maximum density shows that at least one field had a density of 163.4 green foxtail plants per square metre. The final column shows the abundance of each species surveyed relative to each other. Values in this column add up to 300. Relative abundance is derived from the values of the frequency, field uniformity (all fields) and density (all fields) variables. The relative abundance variable is used for ranking species such as green foxtail and wild buckwheat. Because the all field density value of green foxtail is over 3 times larger than larger than that for wild buckwheat, green foxtail is ranked higher, even though wild buckwheat has a higher frequency and a slightly higher all field uniformity. The relative abundance value of 37.7 for green foxtail is higher than the value of 30.3 for wild buckwheat. Limitations, Constraints and Biases The results in this report provide a ‘snapshot’ of the size and extent of weed populations in agricultural ecoregions at the time of the survey. It might be argued that 2016 was not indicative of a typical year throughout Manitoba as the majority of the province had high precipitation in comparison with historic levels30. Differences in precipitation and temperature may favour some weeds over others, or may result in higher or lower weed numbers in some areas than usual for the period as a whole. Consequently, only dramatic or consistent trends in the weed data are considered to be important. Minor fluctuations may result from simple year-to-year variation. The survey protocol has been designed to reduce bias in sampling, and to obtain objective information on the weed flora that remains after control practices have been used by the producer. In the development of the protocol, several constraints were placed on the eligibility of areas and fields for inclusion in the survey. The survey covers the main area of agriculture in the province. Only the major agricultural crops were considered. Other crops may have different weed floras. Fields were only surveyed if they were accessible by road, and if the producers were willing to cooperate. Riverlots were excluded due to unforeseen difficulties obtaining ownership information. These constraints will have altered the spectrum of fields slightly from a completely random sample. For a variety of reasons, some sites on the final list are different from those on the stratified random list developed initially. When surveyors went to the field, they were given a list of preselected and qualified sites. Sometimes mistakes were made, and the legal description given was not in an appropriate crop, sufficiently accessible, or in another way not a legitimate site. In this instance, the surveyor made an alternative selection, usually in the immediate vicinity. Sometimes the alternate selections were in different ecodistricts. Two municipalities (Coldwell and West Interlake) and one ecodistrict (718) with allocated sites were not surveyed (Figure 6). In each of these cases, only one site was allocated. Weighting was used to overcome this problem; however, the accuracy of regional summaries is expected to be lowered. The area in annual crops in each of the ecodistricts in the municipalities of East St. Paul, St. Francois Xavier, St. Laurent and Headingly was too small to have any allocated sites. Species distribution maps are interpolated for these areas based on surrounding sites. 30 National Agroclimate Information Service (NAIS). Precipitation compared to historical distribution (Prairie Region) April 1 to August 16, 2016 [Online] Available: http://www4.agr.gc.ca/DW-GS/historical-historiques.jspx?lang=eng&jsEnabled=true [11 February 2016]

Methodology – Limitations
23
Areas included in summaries of:
Interlake Plain
Boreal TransitionMid-Boreal UplandsLake Manitoba Plain
Aspen ParklandSouthwest Manitoba Uplands
Lake of the Woods
Figure 6. Locations of surveyed fields. Red squares indicate fields, black lines indicate crop reporting district municipality borders and grey lines indicate municipality borders. Areas with allocated sites that were not surveyed a lighter shade than those with surveyed sites .

Methodology – Limitations
24
Only a small portion of each field was surveyed. This portion intentionally did not include sloughs, field edges, shelterbelts, etc. It also did not extend into the less accessible areas of the field. This may limit the representation of some species, such as foxtail barley, that are found more commonly near saline sloughs, or smooth brome grass that is often found near field margins. The small area in the field was sufficient to illustrate the distribution of major species and minor species that might be important to agriculture. This level of sampling is not sufficient to give an exhaustive list of the flora, or to illustrate the distribution of rare species. The identification of some weed species is difficult in the field. Surveyors were asked to send in samples to confirm identification. However, in some cases, good samples were not available. Generally, the identification and counts by the field surveyors were used without alteration, if identifiable samples were not available. Species which require mature specimens to identify (thyme-leaved spurge and ridge-seed spurge, western barnyard grass and barnyard grass, dock species) were combined in field summary tables. Combining these species allowed direct comparison with data from previous surveys. It can be challenging to identify volunteers within the same crop. Therefore, volunteers are likely underestimated in area summaries and summaries of the same crop. The weed survey recorded the numbers of individuals of each species. It does not show the vigour, the biomass or the competitive ability of the plants found in the field. The survey shows what was present, not its effect on the crop. In the survey analysis, all species are considered separately. The complex interrelationships among species have not been considered. This will be the subject of later analyses. Relationships between species and farm management practices will be considered in a further publication in this series. The relationships between species and field variables (for instance, distribution patterns in the field) are not considered.
25
Part IV FIELD SURVEY SUMMARY TABLES
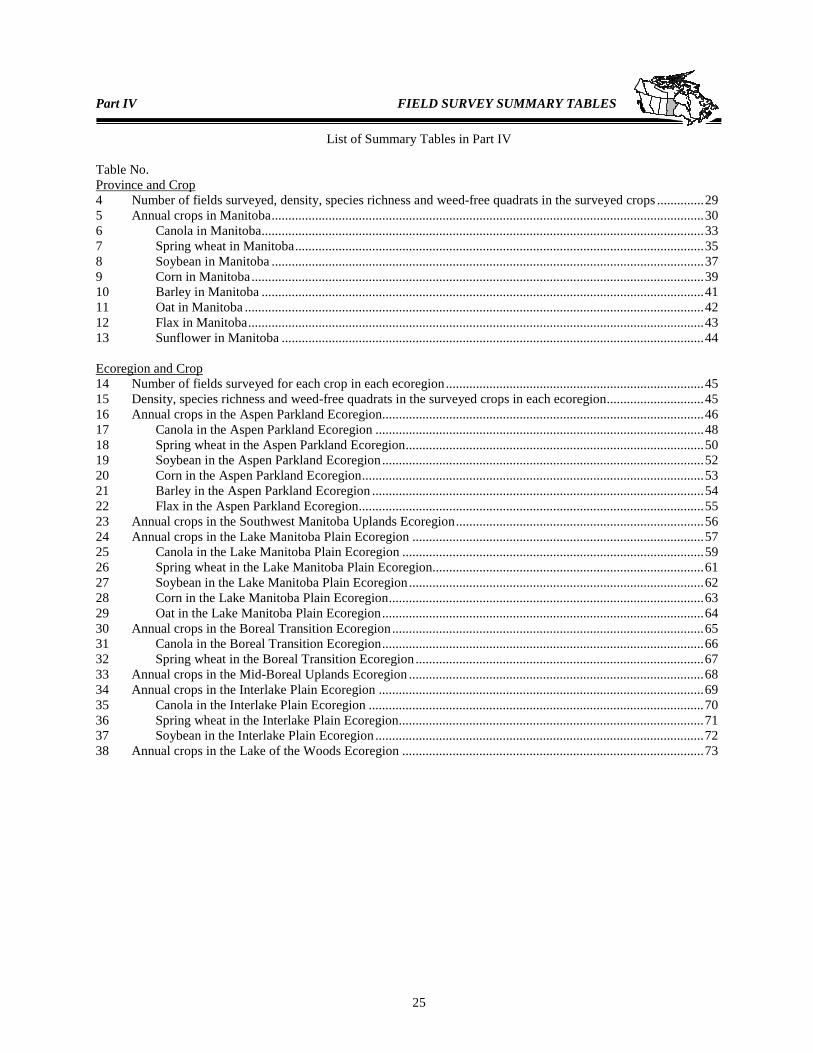
List of Summary Tables in Part IV Table No. Province and Crop 4 Number of fields surveyed, density, species richness and weed-free quadrats in the surveyed crops .............. 29 5 Annual crops in Manitoba ................................................................................................................................. 30 6 Canola in Manitoba .................................................................................................................................... 33 7 Spring wheat in Manitoba .......................................................................................................................... 35 8 Soybean in Manitoba ................................................................................................................................. 37 9 Corn in Manitoba ....................................................................................................................................... 39 10 Barley in Manitoba .................................................................................................................................... 41 11 Oat in Manitoba ......................................................................................................................................... 42 12 Flax in Manitoba ........................................................................................................................................ 43 13 Sunflower in Manitoba .............................................................................................................................. 44 Ecoregion and Crop 14 Number of fields surveyed for each crop in each ecoregion ............................................................................. 45 15 Density, species richness and weed-free quadrats in the surveyed crops in each ecoregion ............................. 45 16 Annual crops in the Aspen Parkland Ecoregion................................................................................................ 46 17 Canola in the Aspen Parkland Ecoregion .................................................................................................. 48 18 Spring wheat in the Aspen Parkland Ecoregion ......................................................................................... 50 19 Soybean in the Aspen Parkland Ecoregion ................................................................................................ 52 20 Corn in the Aspen Parkland Ecoregion ...................................................................................................... 53 21 Barley in the Aspen Parkland Ecoregion ................................................................................................... 54 22 Flax in the Aspen Parkland Ecoregion ....................................................................................................... 55 23 Annual crops in the Southwest Manitoba Uplands Ecoregion .......................................................................... 56 24 Annual crops in the Lake Manitoba Plain Ecoregion ....................................................................................... 57 25 Canola in the Lake Manitoba Plain Ecoregion .......................................................................................... 59 26 Spring wheat in the Lake Manitoba Plain Ecoregion ................................................................................. 61 27 Soybean in the Lake Manitoba Plain Ecoregion ........................................................................................ 62 28 Corn in the Lake Manitoba Plain Ecoregion .............................................................................................. 63 29 Oat in the Lake Manitoba Plain Ecoregion ................................................................................................ 64 30 Annual crops in the Boreal Transition Ecoregion ............................................................................................. 65 31 Canola in the Boreal Transition Ecoregion ................................................................................................ 66 32 Spring wheat in the Boreal Transition Ecoregion ...................................................................................... 67 33 Annual crops in the Mid-Boreal Uplands Ecoregion ........................................................................................ 68 34 Annual crops in the Interlake Plain Ecoregion ................................................................................................. 69 35 Canola in the Interlake Plain Ecoregion .................................................................................................... 70 36 Spring wheat in the Interlake Plain Ecoregion ........................................................................................... 71 37 Soybean in the Interlake Plain Ecoregion .................................................................................................. 72 38 Annual crops in the Lake of the Woods Ecoregion .......................................................................................... 73

Field Survey Summary Tables – List of Tables
26
Crop Reporting District and Crop 39 Number of fields surveyed for each crop in each crop reporting district .......................................................... 74 40 Density, species richness and weed-free quadrats in the surveyed crops in each crop reporting district .......... 74 41 Annual crops in the Southwest Crop Reporting District ................................................................................... 75 42 Canola in the Southwest Crop Reporting District ...................................................................................... 77 43 Spring wheat in the Southwest Crop Reporting District ............................................................................ 79 44 Barley in the Southwest Crop Reporting District ...................................................................................... 81 45 Flax in the Southwest Crop Reporting District .......................................................................................... 82 46 Annual crops in the Northwest Crop Reporting District ................................................................................... 83 47 Canola in the Northwest Crop Reporting District ...................................................................................... 85 48 Spring wheat in the Northwest Crop Reporting District ............................................................................ 86 49 Annual crops in the Central Crop Reporting District ........................................................................................ 87 50 Canola in the Central Crop Reporting District ........................................................................................... 89 51 Spring wheat in the Central Crop Reporting District ................................................................................. 91 52 Soybean in the Central Crop Reporting District ........................................................................................ 92 53 Corn in the Central Crop Reporting District .............................................................................................. 93 54 Barley in the Central Crop Reporting District ........................................................................................... 94 55 Sunflower in the Central Crop Reporting District ..................................................................................... 95 56 Annual crops in the Eastern Crop Reporting District ....................................................................................... 96 57 Canola in the Eastern Crop Reporting District .......................................................................................... 97 58 Soybean in the Eastern Crop Reporting District ........................................................................................ 98 59 Annual crops in the Interlake Crop Reporting District ..................................................................................... 99 60 Canola in the Interlake Crop Reporting District ...................................................................................... 100 61 Spring wheat in the Interlake Crop Reporting District ............................................................................ 101 62 Soybean in the Interlake Crop Reporting District .................................................................................... 102 Municipality 63 Number of fields surveyed in each municipality ............................................................................................ 103 64 Density, species richness and weed-free quadrats in each municipality ......................................................... 105 Municipalities in the Southwest Crop Reporting District 64 Brenda-Waskada, Boissevain-Morton & Deloraine-Winchester .................................................................... 107 65 Elton & Cornwallis ........................................................................................................................................ 108 66 Grassland ........................................................................................................................................................ 109 67 Harrison Park .................................................................................................................................................. 110 68 Killarney-Turtle Mountain & Prairie Lakes .................................................................................................... 111 69 Minto-Odanah, Rosedale & Clanwilliam-Erickson ........................................................................................ 112 70 North Cypress-Langford ................................................................................................................................. 113 71 Oakland-Wawanesa & Glenboro-South Cypress ............................................................................................ 114 72 Oakview & Hamiota ....................................................................................................................................... 115 73 Pipestone, Souris-Glenwood & Sifton ............................................................................................................ 116 74 Prairie View & Ellice-Archie .......................................................................................................................... 117 75 Riverdale & Whitehead ................................................................................................................................... 118 76 Two Borders ................................................................................................................................................... 119 77 Wallace-Woodworth ....................................................................................................................................... 120 78 Yellowhead ..................................................................................................................................................... 121 Municipalities in the Northwest Crop Reporting District 79 Gilbert Plains, Dauphin & Mossey River ....................................................................................................... 122 80 Grandview & Ethelbert ................................................................................................................................... 123 81 Minitonas-Bowsman, Mountain & Kelsey ..................................................................................................... 124 82 Riding Mountain West, Roblin, Rossburn & Russell-Binscarth .................................................................... 125 83 Ste. Rose, Lakeshore, McCreary & Alonsa .................................................................................................... 126 84 Swan Valley West in the Northwest Crop Reporting District ......................................................................... 127

Field Survey Summary Tables – List of Tables
27
Municipalities in the Central Crop Reporting District 85 Cartwright-Roblin & Argyle ........................................................................................................................... 128 86 Dufferin ........................................................................................................................................................... 129 87 Grey ................................................................................................................................................................ 130 88 Lorne ............................................................................................................................................................... 131 89 Louise ............................................................................................................................................................. 132 90 MacDonald...................................................................................................................................................... 133 91 Morris ............................................................................................................................................................. 134 92 Norfolk Treherne & Victoria .......................................................................................................................... 135 93 North Norfolk ................................................................................................................................................. 136 94 Pembina .......................................................................................................................................................... 137 95 Portage La Prairie & Cartier ........................................................................................................................... 138 96 Rhineland & Montcalm................................................................................................................................... 139 97 Stanley ............................................................................................................................................................ 140 98 Thompson & Roland ....................................................................................................................................... 141 99 WestLake-Gladstone & Glenella-Lansdowne ................................................................................................. 142 Municipalities in the Eastern Crop Reporting District 100 Emerson-Franklin & De Salaberry ................................................................................................................. 143 101 Hanover, Tache, Ritchot, Ste. Anne, La Broquerie ......................................................................................... 144 102 Springfield & Brokenhead .............................................................................................................................. 145 103 Whitemouth, Lac du Bonnet, Alexander, Reynolds & Stuartburn .................................................................. 146 Municipalities in the Interlake Crop Reporting District 104 Bifrost-Riverton, Armstrong & Gimli ............................................................................................................ 147 105 Fisher & Grahamdale ...................................................................................................................................... 148 106 Rockwood ....................................................................................................................................................... 149 107 Rosser, St. Andrews, St. Clements & West St. Paul ....................................................................................... 150 108 Woodlands ...................................................................................................................................................... 151 Previous Surveys 109 Number of fields surveyed, density, species richness and weed-free quadrats by decade .............................. 152 194 Annual crops in Manitoba in 2002 .................................................................................................................. 153 195 Annual crops in Manitoba in 1997 .................................................................................................................. 155 196 Annual crops in Manitoba in 1986 .................................................................................................................. 157 197 Annual crops in Manitoba in 1978-81 ............................................................................................................ 159


Field Survey Summary Tables – Density, Species Richness and Weed-Free Quadrats by Crop
29
Table 4. Number of fields surveyed, density, species richness and weed-free quadrats in the surveyed crops in Manitoba Number of Density Species Weed-free fields surveyed (number/m2) (number/field) quadrats Crop mean SE median mean SE % SE Canola 206 12.1 1.4 4.8 4.4 0.2 46.8 3.5 Spring wheat 196 16.0 1.9 4.8 4.4 0.2 43.7 3.5 Soybean 118 9.2 1.2 4.1 4.5 0.3 44.6 4.6 Corn 41 20.3 4.4 9.3 5.8 0.5 26.4 6.9 Barley 35 26.3 8.0 5.8 5.0 0.5 39.4 8.3 Oat 23 44.9 15.9 13.2 6.6 1.1 23.0 8.8 Flax 21 18.1 3.4 9.4 6.8 0.5 14.6 7.7 Sunflower 18 20.7 4.3 14.1 6.9 0.5 13.9 8.2 Manitoba 658 15.4 1.1 5.2 4.7 0.1 42.5 1.9

Field Survey Summary Tables – Annual Crops
30
Table 5. 2016 Annual crops in Manitoba (658 fields) Frequency Field Uniformity Field Density (#/m2) Relative
Rank Species (%) All Occurrence All Occurrence High Abundance 1 Green foxtail 24.4 10.0 41.1 3.6 14.6 163.4 37.7 2 Wild buckwheat 52.7 13.1 24.8 1.0 2.0 55.2 30.3 3 Barnyard grass species 23.0 6.4 27.8 1.1 4.8 80.0 18.2 4 Wild oats 20.7 5.6 26.8 0.9 4.4 69.6 15.6 5 Canola/rapeseed 23.2 6.5 28.1 0.7 2.9 35.6 15.4 6 Yellow foxtail 11.2 3.9 35.2 1.2 10.6 82.8 13.8 7 Dandelion 21.1 4.4 21.0 0.5 2.4 84.2 11.9 8 Redroot pigweed 20.9 4.5 21.7 0.4 2.1 22.2 11.6 9 Wheat 15.5 4.4 28.5 0.5 3.5 39.4 10.9 10 Round-leaved mallow 20.1 4.1 20.1 0.3 1.7 17.4 10.3 11 Broad-leaved plantain 12.5 3.4 27.4 0.6 4.5 57.4 9.6 12 Pale smartweed 17.5 3.2 18.3 0.4 2.0 24.8 9.0 13 Canada thistle 18.1 3.1 17.3 0.3 1.6 33.8 8.7 14 Lamb's-quarters 15.5 3.0 19.3 0.3 2.0 43.0 8.2 15 Spiny annual sow-thistle 11.1 2.6 23.7 0.2 2.0 17.0 6.3 16 Night-flowering catchfly 9.4 1.9 20.4 0.2 2.5 52.0 5.3 17 False cleavers 9.0 2.2 25.1 0.2 1.9 25.6 5.1 18 Chickweed 7.5 1.9 25.5 0.3 3.4 23.2 5.1 19 Perennial sow-thistle 8.5 1.8 21.4 0.2 1.8 24.2 4.5 20 Biennial wormwood 9.2 1.7 18.4 0.1 1.4 22.8 4.4 21 Field horsetail 4.3 1.0 22.5 0.3 5.9 61.2 3.5 22 Foxtail barley 6.9 1.1 16.1 0.1 1.7 15.0 3.3 23 Wild mustard 3.6 0.8 23.0 0.2 5.9 89.4 2.9 24 Oak-leaved goosefoot 6.0 0.9 14.3 0.1 1.4 16.2 2.7 25 Black medick 5.4 1.0 19.0 0.1 1.4 6.0 2.6 26 Golden dock 3.3 0.8 25.4 0.1 3.9 23.8 2.3 27 Shepherd's-purse 5.4 0.7 13.9 < 0.1 0.9 11.6 2.2 28 Thyme-leaved spurge 5.2 0.7 13.5 0.1 1.1 32.0 2.1 29 Purslane 3.9 0.8 21.6 0.1 1.9 8.4 2.1 30 Kochia 4.6 0.7 15.8 < 0.1 1.1 4.0 2.0 31 Stork's bill 2.3 0.7 28.1 0.1 4.2 15.8 1.7 32 Dock species 3.3 0.6 16.9 0.1 1.8 8.0 1.6 33 Hemp-nettle 3.1 0.5 16.0 < 0.1 1.3 11.6 1.4 34 Stinkweed 2.7 0.5 17.8 0.1 2.0 15.6 1.4 35 Clover species 2.4 0.5 22.4 < 0.1 1.7 10.8 1.3 36 Marsh yellow cress 2.7 0.5 18.2 < 0.1 1.3 4.8 1.3 37 Yellow sweet-clover 2.6 0.5 17.6 < 0.1 1.1 3.0 1.2 38 Quack grass 0.7 0.3 45.9 0.1 15.4 68.6 1.2 39 Rough cinquefoil 2.2 0.4 18.3 < 0.1 1.8 9.2 1.1 40 Northern willowherb 2.2 0.3 13.1 < 0.1 2.0 15.8 1.0 41 Tumble pigweed 2.3 0.4 15.6 < 0.1 0.9 1.8 1.0 42 Soybean 1.9 0.4 18.9 < 0.1 1.6 11.4 0.9 43 Witch grass 0.6 0.1 16.6 0.1 17.2 41.8 0.8 44 Rough hair grass 0.2 0.1 70.0 0.1 60.0 60.0 0.8 45 Alfalfa 2.1 0.3 12.0 < 0.1 0.7 1.6 0.8 46 American dragonhead 2.1 0.2 10.2 < 0.1 0.5 2.0 0.7 47 Scouring-rush 1.2 0.3 21.8 < 0.1 2.0 6.6 0.7 48 Narrow-leaved hawk's-beard 1.3 0.2 18.3 < 0.1 1.1 3.4 0.6 49 Maple-leaved goosefoot 1.7 0.1 7.8 < 0.1 0.5 1.0 0.5 50 Willow species 1.5 0.1 8.7 < 0.1 0.7 2.8 0.5 51 Annual sow-thistle 0.4 0.2 50.6 < 0.1 11.0 22.6 0.5 52 Green pigweed 0.6 0.2 34.3 < 0.1 4.3 15.2 0.5
(Table continued on next page)

Field Survey Summary Tables – Annual Crops
31
Table 5. 2016 Annual crops in Manitoba (658 fields) (continued) Frequency Field Uniformity Field Density (#/m2) Relative
Rank Species (%) All Occurrence All Occurrence High Abundance 53 American vetch 1.6 0.1 8.0 < 0.1 0.4 1.8 0.5 54 Prostrate pigweed 1.1 0.2 14.3 < 0.1 1.3 3.8 0.5 55 Manitoba maple 1.0 0.2 16.6 < 0.1 1.0 4.0 0.4 56 Proso millet 0.4 0.1 34.4 < 0.1 9.2 20.0 0.4 57 Rye 0.4 0.2 57.3 < 0.1 5.4 9.6 0.4 58 Bicknell's geranium 1.0 0.2 16.0 < 0.1 0.9 2.2 0.4 59 Oats 0.7 0.2 28.6 < 0.1 1.4 2.6 0.4 60 Canada fleabane 0.7 0.1 18.0 < 0.1 1.1 2.0 0.3 61 Absinth 0.6 0.1 11.8 < 0.1 3.2 17.6 0.3 62 Dog mustard 0.6 0.1 26.7 < 0.1 1.5 3.0 0.3 63 Low cudweed 0.8 0.1 9.2 < 0.1 1.3 3.0 0.3 64 Prostrate knotweed 0.7 0.1 13.8 < 0.1 1.4 3.4 0.3 65 Rayless aster 0.6 0.1 16.7 < 0.1 0.9 2.6 0.3 66 Cocklebur 0.6 0.1 14.8 < 0.1 1.2 3.8 0.3 67 Stink grass 0.5 0.1 24.8 < 0.1 1.6 3.2 0.3 68 Tartary buckwheat 0.3 0.1 44.4 < 0.1 4.2 10.2 0.3 69 Barley 0.6 0.1 15.2 < 0.1 1.3 2.0 0.3 70 Showy milkweed 0.8 0.1 7.9 < 0.1 0.7 1.0 0.3 71 Perennial rye grass 0.3 0.1 31.3 < 0.1 2.9 3.8 0.2 72 Common pepper-grass 0.1 0.1 55.0 < 0.1 18.0 18.0 0.2 73 Purslane speedwell 0.3 0.1 18.4 < 0.1 4.1 10.4 0.2 74 Flax 0.5 0.1 13.1 < 0.1 0.8 2.0 0.2 75 Leafy spurge 0.2 0.1 50.0 < 0.1 4.4 4.4 0.2 76 Siberian elm 0.6 < 0.1 6.9 < 0.1 0.4 1.2 0.2 77 Downy brome 0.2 0.1 35.0 < 0.1 2.0 2.0 0.1 78 False ragweed 0.4 < 0.1 10.5 < 0.1 0.5 2.8 0.1 79 Nightshade species 0.4 < 0.1 10.9 < 0.1 0.4 0.8 0.1 80 Bird's-foot trefoil 0.3 < 0.1 14.8 < 0.1 1.1 1.4 0.1 81 Flodman's thistle 0.3 < 0.1 16.0 < 0.1 1.4 2.0 0.1 82 Hedge bindweed 0.4 < 0.1 9.8 < 0.1 0.5 0.8 0.1 83 Scentless chamomile 0.2 0.1 35.0 < 0.1 4.0 4.0 0.1 84 Blue grass species 0.3 < 0.1 12.7 < 0.1 0.5 0.8 0.1 85 Common yellow wood-sorrel 0.2 < 0.1 20.0 < 0.1 3.6 3.6 0.1 86 Slough grass 0.3 < 0.1 10.0 < 0.1 0.6 0.6 0.1 87 Smooth brome 0.3 < 0.1 10.0 < 0.1 0.4 0.4 0.1 88 Needle-and-thread grass 0.2 < 0.1 20.0 < 0.1 1.6 1.6 0.1 89 Clammy hedge-hyssop 0.3 < 0.1 5.0 < 0.1 0.8 1.2 0.1 90 Bladder campion 0.3 < 0.1 5.0 < 0.1 0.2 0.2 0.1 91 Aster species 0.2 < 0.1 14.0 < 0.1 1.0 1.2 0.1 92 Spear-leaved goosefoot 0.2 < 0.1 25.0 < 0.1 1.4 1.4 0.1 93 Timothy 0.2 < 0.1 25.0 < 0.1 1.1 1.1 0.1 94 White mustard 0.1 < 0.1 25.0 < 0.1 1.4 1.4 0.1 95 Silverweed 0.2 < 0.1 5.0 < 0.1 1.2 1.2 0.1 96 Russian thistle 0.2 < 0.1 11.0 < 0.1 0.6 0.6 0.1 97 Common groundsel 0.1 < 0.1 30.0 < 0.1 1.8 1.8 0.1 98 Bur oak 0.2 < 0.1 15.0 < 0.1 0.6 0.6 0.1 99 Currant species 0.2 < 0.1 5.0 < 0.1 0.2 0.2 0.1 100 Sedge species 0.2 < 0.1 15.0 < 0.1 0.6 0.6 0.1 101 Goldenrod species 0.2 < 0.1 10.0 < 0.1 0.4 0.4 0.1 102 Rush species 0.2 < 0.1 10.0 < 0.1 0.4 0.4 0.1 103 Beggarticks species 0.2 < 0.1 10.0 < 0.1 0.4 0.4 0.1 104 Pennsylvania pellitory 0.2 < 0.1 5.0 < 0.1 0.2 0.2 0.1
(Table continued on next page)

Field Survey Summary Tables – Annual Crops
32
Table 5. 2016 Annual crops in Manitoba (658 fields) (continued) Frequency Field Uniformity Field Density (#/m2) Relative
Rank Species (%) All Occurrence All Occurrence High Abundance 105 Field bean 0.2 < 0.1 5.0 < 0.1 0.2 0.2 0.1 106 White cockle 0.2 < 0.1 10.0 < 0.1 0.4 0.4 0.1 107 Prickly lettuce 0.2 < 0.1 5.0 < 0.1 0.8 0.8 0.1 108 Corn spurry 0.2 < 0.1 10.0 < 0.1 0.4 0.4 0.1 109 False flax species 0.1 < 0.1 10.0 < 0.1 0.6 0.6 0.1 110 Blue-joint 0.1 < 0.1 5.0 < 0.1 1.6 1.6 < 0.1 111 Flixweed 0.2 < 0.1 5.0 < 0.1 0.2 0.2 < 0.1 112 Large crab grass 0.1 < 0.1 15.0 < 0.1 0.8 0.8 < 0.1 113 Pineappleweed 0.2 < 0.1 5.0 < 0.1 0.2 0.2 < 0.1 114 Western snowberry 0.2 < 0.1 5.0 < 0.1 0.2 0.2 < 0.1 115 Povertyweed 0.2 < 0.1 5.0 < 0.1 0.2 0.2 < 0.1 116 Buffalograss 0.2 < 0.1 5.0 < 0.1 0.2 0.2 < 0.1 117 Short-awned foxtail 0.2 < 0.1 5.0 < 0.1 0.2 0.2 < 0.1 118 Common ragweed 0.1 < 0.1 8.4 < 0.1 0.3 0.4 < 0.1 119 Yellow toadflax 0.2 < 0.1 5.0 < 0.1 0.2 0.2 < 0.1 120 Northern bedstraw 0.1 < 0.1 5.0 < 0.1 0.4 0.4 < 0.1 121 Orchard grass 0.1 < 0.1 5.0 < 0.1 0.2 0.2 < 0.1 122 Wormseed mustard 0.1 < 0.1 10.0 < 0.1 0.6 0.6 < 0.1 123 Toad rush < 0.1 < 0.1 40.0 < 0.1 3.4 3.4 < 0.1 124 Yellow evening-primrose 0.1 < 0.1 10.0 < 0.1 1.0 1.0 < 0.1 125 Sunflower 0.1 < 0.1 10.0 < 0.1 0.4 0.4 < 0.1 126 Water smartweed 0.1 < 0.1 5.0 < 0.1 0.2 0.2 < 0.1 127 Corn < 0.1 < 0.1 20.0 < 0.1 1.0 1.0 < 0.1

Field Survey Summary Tables – Canola
33
Table 6. 2016 Canola in Manitoba (206 fields) Frequency Field Uniformity Field Density (#/m2) Relative
Rank Species (%) All Occurrence All Occurrence High Abundance 1 Green foxtail 18.1 7.3 40.7 2.2 12.0 82.8 29.7 2 Wild buckwheat 48.0 10.6 22.0 0.8 1.6 14.4 28.3 3 Wheat 25.3 7.9 31.0 0.9 3.5 29.4 21.3 4 Yellow foxtail 10.8 4.5 41.7 1.6 14.8 82.8 20.2 5 Wild oats 23.8 6.3 26.4 0.7 3.0 27.2 17.9 6 Barnyard grass species 18.3 5.5 29.9 0.8 4.4 33.4 16.5 7 Redroot pigweed 21.6 4.1 19.0 0.5 2.1 22.2 13.0 8 Round-leaved mallow 20.7 3.8 18.4 0.2 1.1 4.0 10.6 9 Canada thistle 18.6 3.3 17.9 0.2 1.3 4.8 9.8 10 Dandelion 14.8 3.6 24.0 0.3 1.8 7.4 9.3 11 Broad-leaved plantain 13.8 3.2 23.5 0.3 2.3 12.2 9.1 12 Pale smartweed 18.5 2.8 15.2 0.2 1.2 10.0 8.9 13 False cleavers 13.2 2.9 22.3 0.2 1.6 8.2 7.8 14 Lamb's-quarters 16.0 2.1 13.0 0.1 0.9 8.4 7.0 15 Spiny annual sow-thistle 10.2 2.6 25.2 0.2 2.3 17.0 7.0 16 Chickweed 10.8 2.4 22.4 0.2 2.1 9.2 6.9 17 Field horsetail 4.9 1.4 28.4 0.4 8.6 61.2 6.0 18 Perennial sow-thistle 9.1 2.1 22.9 0.2 2.3 24.2 6.0 19 Oak-leaved goosefoot 8.4 1.6 18.8 0.2 2.1 16.2 5.0 20 Biennial wormwood 8.7 1.5 17.6 0.1 1.0 3.8 4.3 21 Golden dock 4.7 1.2 24.3 0.2 4.2 23.8 3.9 22 Night-flowering catchfly 7.6 1.0 13.2 0.1 0.7 2.6 3.3 23 Rough hair grass 0.5 0.3 70.0 0.3 60.0 60.0 2.9 24 Shepherd's-purse 7.1 0.7 10.3 < 0.1 0.7 1.6 2.8 25 Black medick 5.6 0.8 14.7 0.1 1.1 6.0 2.7 26 Kochia 5.2 0.9 16.6 0.1 1.2 4.0 2.6 27 Stork's bill 2.8 0.8 29.9 0.1 2.9 10.2 2.2 28 Thyme-leaved spurge 4.8 0.6 12.3 < 0.1 1.0 3.0 2.1 29 Dock species 4.0 0.5 13.2 0.1 2.0 8.0 2.1 30 Clover species 3.0 0.7 23.1 0.1 2.3 10.8 2.0 31 Foxtail barley 3.9 0.6 15.6 < 0.1 0.9 2.2 1.8 32 Hemp-nettle 2.3 0.6 27.3 0.1 2.8 11.6 1.7 33 Scouring-rush 1.1 0.6 57.1 < 0.1 4.6 6.6 1.3 34 Canola/rapeseed 2.4 0.4 18.1 < 0.1 1.4 4.6 1.3 35 Stinkweed 3.1 0.4 11.8 < 0.1 0.5 0.8 1.2 36 Rough cinquefoil 1.7 0.4 22.7 < 0.1 2.8 6.2 1.2 37 American dragonhead 3.2 0.2 6.4 < 0.1 0.3 1.0 1.0 38 Marsh yellow cress 1.9 0.4 18.6 < 0.1 1.3 3.4 1.0 39 Rye 0.5 0.4 80.0 < 0.1 9.6 9.6 0.9 40 Purslane 1.5 0.3 22.3 < 0.1 1.6 4.2 0.9 41 Tumble pigweed 1.8 0.3 14.5 < 0.1 0.8 1.4 0.8 42 Green pigweed 0.9 0.2 27.5 < 0.1 4.5 8.2 0.8 43 Alfalfa 1.9 0.2 12.3 < 0.1 0.8 1.6 0.8 44 American vetch 1.9 0.2 10.9 < 0.1 0.6 1.8 0.8 45 Willow species 1.9 0.2 10.0 < 0.1 0.6 1.0 0.7 46 Quack grass 0.5 0.3 65.0 < 0.1 7.4 7.4 0.7 47 Bicknell's geranium 1.4 0.3 19.5 < 0.1 1.1 2.2 0.7 48 Narrow-leaved hawk's-beard 1.0 0.2 24.9 < 0.1 1.8 3.4 0.6 49 Yellow sweet-clover 1.9 0.1 7.0 < 0.1 0.3 0.6 0.6 50 Flax 1.4 0.2 13.1 < 0.1 0.8 2.0 0.6 51 Prostrate pigweed 0.9 0.2 22.5 < 0.1 2.4 3.8 0.6 52 Leafy spurge 0.5 0.3 50.0 < 0.1 4.4 4.4 0.6
(Table continued on next page)

Field Survey Summary Tables – Canola
34
Table 6. 2016 Canola in Manitoba (206 fields) (continued) Frequency Field Uniformity Field Density (#/m2) Relative
Rank Species (%) All Occurrence All Occurrence High Abundance 53 Low cudweed 1.3 0.1 8.5 < 0.1 0.9 1.6 0.5 54 Downy brome 0.6 0.2 35.0 < 0.1 2.0 2.0 0.5 55 Perennial rye grass 0.6 0.1 25.0 < 0.1 2.2 2.2 0.4 56 Common yellow wood-sorrel 0.5 0.1 20.0 < 0.1 3.6 3.6 0.4 57 Soybean 1.0 0.1 10.0 < 0.1 0.5 0.8 0.4 58 Wild mustard 1.0 0.1 7.5 < 0.1 0.3 0.4 0.3 59 Prostrate knotweed 1.0 0.1 7.6 < 0.1 0.3 0.4 0.3 60 Flodman's thistle 0.5 0.1 20.0 < 0.1 2.0 2.0 0.3 61 Northern willowherb 1.0 0.1 5.0 < 0.1 0.2 0.2 0.3 62 Absinth 1.0 < 0.1 5.0 < 0.1 0.2 0.2 0.3 63 Cocklebur 0.9 < 0.1 5.0 < 0.1 0.2 0.2 0.3 64 Blue grass species 0.5 0.1 20.0 < 0.1 0.8 0.8 0.2 65 Canada fleabane 0.4 0.1 25.0 < 0.1 1.6 1.6 0.2 66 Aster species 0.5 0.1 15.0 < 0.1 1.2 1.2 0.2 67 Maple-leaved goosefoot 0.5 0.1 15.0 < 0.1 1.0 1.0 0.2 68 Hedge bindweed 0.5 0.1 15.0 < 0.1 0.8 0.8 0.2 69 Bur oak 0.5 0.1 15.0 < 0.1 0.6 0.6 0.2 70 Showy milkweed 0.5 < 0.1 10.0 < 0.1 1.0 1.0 0.2 71 Bird's-foot trefoil 0.5 < 0.1 10.0 < 0.1 0.8 0.8 0.2 72 Clammy hedge-hyssop 0.5 < 0.1 5.0 < 0.1 1.2 1.2 0.2 73 Goldenrod species 0.5 < 0.1 10.0 < 0.1 0.4 0.4 0.2 74 Rush species 0.5 < 0.1 10.0 < 0.1 0.4 0.4 0.2 75 Beggarticks species 0.5 < 0.1 10.0 < 0.1 0.4 0.4 0.2 76 Field bean 0.6 < 0.1 5.0 < 0.1 0.2 0.2 0.2 77 Manitoba maple 0.6 < 0.1 5.0 < 0.1 0.2 0.2 0.2 78 Prickly lettuce 0.5 < 0.1 5.0 < 0.1 0.8 0.8 0.2 79 Purslane speedwell 0.6 < 0.1 5.0 < 0.1 0.2 0.2 0.2 80 Flixweed 0.5 < 0.1 5.0 < 0.1 0.2 0.2 0.2 81 False ragweed 0.5 < 0.1 5.0 < 0.1 0.2 0.2 0.1 82 Pineappleweed 0.5 < 0.1 5.0 < 0.1 0.2 0.2 0.1 83 Western snowberry 0.5 < 0.1 5.0 < 0.1 0.2 0.2 0.1 84 Siberian elm 0.5 < 0.1 5.0 < 0.1 0.2 0.2 0.1 85 Oats 0.5 < 0.1 5.0 < 0.1 0.2 0.2 0.1 86 Smooth brome 0.4 < 0.1 10.0 < 0.1 0.4 0.4 0.1 87 Northern bedstraw 0.4 < 0.1 5.0 < 0.1 0.4 0.4 0.1

Field Survey Summary Tables – Spring Wheat
35
Table 7. 2016 Spring wheat in Manitoba (196 fields) Frequency Field Uniformity Field Density (#/m2) Relative
Rank Species (%) All Occurrence All Occurrence High Abundance 1 Green foxtail 33.0 13.2 39.9 5.0 15.3 163.4 52.2 2 Wild buckwheat 54.5 13.5 24.8 1.1 2.1 45.6 33.1 3 Wild oats 23.2 5.6 24.3 1.2 5.3 51.8 18.7 4 Canola/rapeseed 29.5 6.9 23.6 0.6 2.2 27.4 17.6 5 Dandelion 24.5 4.6 18.6 0.8 3.3 84.2 15.2 6 Barnyard grass species 19.4 5.0 26.0 0.9 4.5 29.2 15.0 7 Canada thistle 21.3 3.7 17.2 0.5 2.2 33.8 11.5 8 Round-leaved mallow 18.3 4.3 23.4 0.4 2.3 14.6 11.0 9 Spiny annual sow-thistle 14.4 3.6 24.9 0.3 2.1 13.6 8.8 10 Lamb's-quarters 14.8 2.7 18.4 0.3 1.9 16.4 7.9 11 Night-flowering catchfly 13.9 2.7 19.8 0.3 2.1 11.6 7.7 12 False cleavers 12.5 3.2 25.8 0.2 1.9 16.8 7.5 13 Redroot pigweed 12.6 2.9 22.9 0.3 2.1 9.6 7.4 14 Chickweed 9.9 2.6 25.8 0.4 3.8 23.2 7.2 15 Broad-leaved plantain 9.0 2.2 24.0 0.4 4.8 53.0 6.9 16 Pale smartweed 11.1 2.4 21.9 0.3 2.6 20.0 6.8 17 Yellow foxtail 6.2 1.9 30.6 0.5 8.8 64.0 6.7 18 Foxtail barley 12.2 2.2 17.8 0.3 2.4 15.0 6.7 19 Wild mustard 5.2 1.4 26.8 0.5 9.9 89.4 5.8 20 Perennial sow-thistle 6.5 1.0 15.2 0.1 1.1 2.8 2.9 21 Biennial wormwood 6.3 1.0 16.5 0.1 1.0 3.0 2.9 22 Hemp-nettle 6.6 0.8 11.6 0.1 0.8 2.2 2.6 23 Stork's bill 3.0 0.9 31.4 0.1 4.3 11.4 2.4 24 Kochia 4.9 0.9 18.4 0.1 1.2 3.2 2.4 25 Soybean 3.8 0.9 23.5 0.1 2.2 11.4 2.3 26 Shepherd's-purse 4.9 0.8 16.6 < 0.1 1.0 2.2 2.2 27 Field horsetail 2.5 0.7 27.8 0.1 5.7 20.0 2.2 28 Black medick 4.3 0.8 18.3 < 0.1 1.1 4.2 2.1 29 Dock species 3.3 0.8 22.8 0.1 2.2 4.4 2.0 30 Stinkweed 2.4 0.7 27.9 0.1 3.4 13.6 1.8 31 Wheat 3.7 0.6 17.3 < 0.1 0.9 1.6 1.7 32 Annual sow-thistle 1.1 0.5 50.0 0.1 11.4 22.6 1.5 33 Tumble pigweed 3.3 0.4 13.5 < 0.1 0.9 1.8 1.4 34 Thyme-leaved spurge 3.1 0.4 12.8 < 0.1 0.8 2.6 1.3 35 Golden dock 1.6 0.4 23.2 0.1 4.7 11.4 1.2 36 Proso millet 0.5 0.3 60.0 0.1 20.0 20.0 1.1 37 Oak-leaved goosefoot 2.2 0.2 7.3 < 0.1 0.9 2.6 0.8 38 Manitoba maple 1.0 0.4 39.6 < 0.1 2.4 4.0 0.8 39 Alfalfa 2.0 0.2 11.2 < 0.1 0.7 1.2 0.8 40 American vetch 2.5 0.1 6.0 < 0.1 0.3 0.6 0.8 41 Prostrate pigweed 1.5 0.2 13.3 < 0.1 1.2 3.2 0.6 42 Purslane 1.0 0.1 9.9 < 0.1 4.1 8.2 0.6 43 Yellow sweet-clover 1.1 0.2 16.3 < 0.1 1.5 3.0 0.5 44 Narrow-leaved hawk's-beard 1.0 0.2 20.0 < 0.1 0.9 0.9 0.5 45 American dragonhead 0.9 0.2 21.8 < 0.1 1.3 2.0 0.5 46 Low cudweed 1.0 0.1 10.1 < 0.1 1.9 3.0 0.5 47 Scentless chamomile 0.5 0.2 35.0 < 0.1 4.0 4.0 0.4 48 Slough grass 1.0 0.1 10.0 < 0.1 0.6 0.6 0.4 49 Maple-leaved goosefoot 1.2 0.1 5.0 < 0.1 0.2 0.2 0.3 50 Showy milkweed 1.0 0.1 5.0 < 0.1 0.6 0.6 0.3 51 Scouring-rush 1.1 0.1 5.0 < 0.1 0.4 0.6 0.3 52 Spear-leaved goosefoot 0.5 0.1 25.0 < 0.1 1.4 1.4 0.3
(Table continued on next page)

Field Survey Summary Tables – Spring Wheat
36
Table 7. 2016 Spring wheat in Manitoba (196 fields) (continued) Frequency Field Uniformity Field Density (#/m2) Relative
Rank Species (%) All Occurrence All Occurrence High Abundance 53 Bicknell's geranium 0.9 0.1 7.4 < 0.1 0.5 0.8 0.3 54 Timothy 0.5 0.1 25.0 < 0.1 1.1 1.1 0.3 55 Clover species 0.5 0.1 15.0 < 0.1 0.6 0.6 0.2 56 Dog mustard 0.6 0.1 10.0 < 0.1 0.4 0.4 0.2 57 Russian thistle 0.5 0.1 10.0 < 0.1 0.6 0.6 0.2 58 Northern willowherb 0.6 < 0.1 5.0 < 0.1 0.4 0.4 0.2 59 False ragweed 0.5 0.1 10.0 < 0.1 0.4 0.4 0.2 60 Smooth brome 0.5 0.1 10.0 < 0.1 0.4 0.4 0.2 61 Rough cinquefoil 0.5 0.1 10.0 < 0.1 0.4 0.4 0.2 62 White cockle 0.5 0.1 10.0 < 0.1 0.4 0.4 0.2 63 Hedge bindweed 0.6 < 0.1 5.0 < 0.1 0.2 0.2 0.2 64 Willow species 0.5 < 0.1 10.0 < 0.1 0.6 0.6 0.2 65 Rayless aster 0.6 < 0.1 5.0 < 0.1 0.2 0.2 0.2 66 Corn spurry 0.5 < 0.1 10.0 < 0.1 0.4 0.4 0.2 67 Bladder campion 0.6 < 0.1 5.0 < 0.1 0.2 0.2 0.2 68 Quack grass 0.5 < 0.1 5.0 < 0.1 0.8 0.8 0.2 69 Witch grass 0.5 < 0.1 5.0 < 0.1 0.4 0.4 0.2 70 Siberian elm 0.5 < 0.1 5.0 < 0.1 0.2 0.2 0.2 71 Cocklebur 0.5 < 0.1 5.0 < 0.1 0.8 0.8 0.2 72 Short-awned foxtail 0.5 < 0.1 5.0 < 0.1 0.2 0.2 0.1 73 Blue grass species 0.5 < 0.1 5.0 < 0.1 0.2 0.2 0.1 74 Yellow toadflax 0.5 < 0.1 5.0 < 0.1 0.2 0.2 0.1 75 Yellow evening-primrose 0.3 < 0.1 10.0 < 0.1 1.0 1.0 0.1

Field Survey Summary Tables – Soybean
37
Table 8. 2016 Soybean in Manitoba (118 fields) Frequency Field Uniformity Field Density (#/m2) Relative
Rank Species (%) All Occurrence All Occurrence High Abundance 1 Canola/rapeseed 44.8 13.0 29.0 1.4 3.1 30.6 39.5 2 Wild buckwheat 54.1 11.1 20.5 0.7 1.3 8.8 31.9 3 Barnyard grass species 27.8 6.1 21.9 0.8 3.0 35.0 22.1 4 Dandelion 28.2 5.9 20.9 0.6 2.0 24.6 19.0 5 Redroot pigweed 27.6 6.7 24.3 0.5 1.8 14.4 18.9 6 Wheat 19.9 4.9 24.7 0.5 2.7 22.0 15.7 7 Green foxtail 14.8 3.6 24.7 0.7 4.6 37.0 14.7 8 Yellow foxtail 14.5 3.1 21.6 0.5 3.6 42.6 12.3 9 Wild oats 13.4 3.2 23.7 0.5 3.7 23.6 11.9 10 Broad-leaved plantain 10.2 3.3 32.8 0.4 3.9 16.4 10.3 11 Biennial wormwood 14.8 2.7 18.3 0.3 2.0 22.8 9.6 12 Round-leaved mallow 17.0 2.1 12.4 0.2 1.1 5.8 8.1 13 Lamb's-quarters 11.1 2.2 19.9 0.1 1.3 3.8 6.5 14 Night-flowering catchfly 3.9 0.9 22.4 0.4 10.5 52.0 6.3 15 Pale smartweed 16.6 1.5 9.3 0.1 0.5 1.8 6.3 16 Marsh yellow cress 8.9 1.4 15.8 0.1 1.2 4.8 4.7 17 Black medick 6.2 1.5 24.3 0.1 1.8 4.4 4.3 18 Field horsetail 7.2 0.8 11.2 0.1 2.1 7.4 4.1 19 Golden dock 3.2 1.1 33.9 0.2 4.9 11.8 3.6 20 Perennial sow-thistle 5.3 1.2 22.3 0.1 1.7 3.6 3.4 21 Spiny annual sow-thistle 7.1 1.0 13.8 < 0.1 0.7 1.6 3.2 22 Canada thistle 6.6 0.9 13.2 0.1 1.1 4.6 3.2 23 Oak-leaved goosefoot 6.7 0.9 12.9 < 0.1 0.7 1.4 3.0 24 Rough cinquefoil 5.2 0.7 13.0 0.1 1.2 2.2 2.5 25 Clover species 4.3 0.9 21.5 < 0.1 1.1 2.6 2.5 26 Purslane 6.5 0.6 9.9 < 0.1 0.4 0.8 2.5 27 Northern willowherb 6.4 0.5 8.6 < 0.1 0.4 1.0 2.3 28 Yellow sweet-clover 4.5 0.8 16.8 < 0.1 0.9 3.0 2.3 29 Oats 2.4 1.0 39.7 < 0.1 1.9 2.6 2.1 30 Thyme-leaved spurge 4.9 0.4 7.6 < 0.1 0.3 0.6 1.7 31 Chickweed 0.8 0.4 50.0 0.1 10.2 10.2 1.6 32 Willow species 3.4 0.2 7.3 < 0.1 0.8 2.8 1.3 33 Shepherd's-purse 2.5 0.4 17.6 < 0.1 1.1 2.0 1.3 34 Maple-leaved goosefoot 3.5 0.2 6.8 < 0.1 0.7 1.0 1.3 35 Dock species 3.3 0.3 8.2 < 0.1 0.5 1.2 1.2 36 Kochia 2.4 0.3 13.1 < 0.1 0.7 1.8 1.1 37 Barley 1.8 0.3 15.3 < 0.1 1.4 2.0 1.0 38 Cocklebur 0.8 0.4 45.0 < 0.1 3.8 3.8 0.9 39 Narrow-leaved hawk's-beard 1.8 0.2 12.9 < 0.1 0.9 1.4 0.9 40 Tumble pigweed 1.8 0.3 15.8 < 0.1 0.7 1.2 0.9 41 Wild mustard 2.5 0.2 8.0 < 0.1 0.3 0.4 0.8 42 Perennial rye grass 0.8 0.3 40.0 < 0.1 3.8 3.8 0.8 43 Rayless aster 0.8 0.4 45.0 < 0.1 2.6 2.6 0.8 44 Canada fleabane 2.0 0.1 5.0 < 0.1 0.3 0.4 0.6 45 Needle-and-thread grass 1.0 0.2 20.0 < 0.1 1.6 1.6 0.6 46 Nightshade species 1.6 0.1 7.4 < 0.1 0.3 0.4 0.5 47 Bird's-foot trefoil 0.8 0.2 20.0 < 0.1 1.4 1.4 0.5 48 Alfalfa 1.6 0.1 5.0 < 0.1 0.2 0.2 0.5 49 Stork's bill 1.0 0.1 15.0 < 0.1 0.8 0.8 0.5 50 Sedge species 0.8 0.1 15.0 < 0.1 0.6 0.6 0.4 51 Witch grass 0.9 0.1 10.0 < 0.1 0.6 0.6 0.3 52 Stinkweed 0.8 0.1 10.0 < 0.1 0.6 0.6 0.3
(Table continued on next page)

Field Survey Summary Tables – Soybean
38
Table 8. 2016 Soybean in Manitoba (118 fields) (continued) Frequency Field Uniformity Field Density (#/m2) Relative
Rank Species (%) All Occurrence All Occurrence High Abundance 53 Pennsylvania pellitory 1.1 0.1 5.0 < 0.1 0.2 0.2 0.3 54 Manitoba maple 0.8 0.1 10.0 < 0.1 0.4 0.4 0.3 55 False flax species 0.8 0.1 10.0 < 0.1 0.6 0.6 0.3 56 Foxtail barley 1.0 0.1 5.0 < 0.1 0.2 0.2 0.3 57 Prostrate pigweed 1.0 < 0.1 5.0 < 0.1 0.2 0.2 0.3 58 Dog mustard 0.7 0.1 10.0 < 0.1 0.4 0.4 0.3 59 Povertyweed 0.9 < 0.1 5.0 < 0.1 0.2 0.2 0.3 60 Scouring-rush 0.9 < 0.1 5.0 < 0.1 0.2 0.2 0.3 61 Buffalograss 0.9 < 0.1 5.0 < 0.1 0.2 0.2 0.3 62 Absinth 0.8 < 0.1 5.0 < 0.1 0.2 0.2 0.3 63 American vetch 0.8 < 0.1 5.0 < 0.1 0.2 0.2 0.2 64 Bladder campion 0.7 < 0.1 5.0 < 0.1 0.2 0.2 0.2

Field Survey Summary Tables – Corn
39
Table 9. 2016 Corn in Manitoba (41 fields) Frequency Field Uniformity Field Density (#/m2) Relative
Rank Species (%) All Occurrence All Occurrence High Abundance 1 Barnyard grass species 43.6 15.5 35.6 3.0 6.8 80.0 31.9 2 Wild buckwheat 59.1 20.8 35.3 1.6 2.8 7.8 31.2 3 Canola/rapeseed 37.7 15.4 40.9 1.9 5.1 35.6 25.5 4 Lamb's-quarters 38.6 13.6 35.1 1.9 4.9 43.0 24.4 5 Round-leaved mallow 47.5 12.2 25.8 1.2 2.5 17.4 21.7 6 Green foxtail 12.5 8.3 66.4 2.8 22.5 74.0 21.2 7 Redroot pigweed 35.5 9.3 26.3 0.9 2.6 16.6 16.5 8 Purslane 26.3 8.2 31.2 0.5 1.9 4.2 12.1 9 Broad-leaved plantain 19.0 5.0 26.2 0.8 4.4 32.2 10.6 10 Yellow foxtail 21.6 6.2 28.7 0.5 2.1 4.8 9.8 11 Dandelion 18.1 5.4 29.6 0.4 2.3 6.8 8.5 12 Pale smartweed 13.9 4.0 29.0 0.6 4.5 23.2 8.0 13 Spiny annual sow-thistle 7.3 2.6 35.0 0.2 3.2 5.8 4.0 14 Canada thistle 11.6 1.7 15.0 0.1 1.0 2.4 3.6 15 Stink grass 7.7 2.4 30.9 0.2 2.1 3.2 3.6 16 Common pepper-grass 2.5 1.4 55.0 0.4 18.0 18.0 3.5 17 Biennial wormwood 11.6 1.5 13.2 0.1 0.6 1.0 3.3 18 Wheat 7.1 1.7 23.7 0.2 2.9 5.6 3.3 19 Field horsetail 4.9 1.1 22.4 0.3 6.2 8.2 3.0 20 Perennial sow-thistle 4.7 2.0 42.1 0.2 3.8 7.4 2.9 21 Stinkweed 2.3 0.9 40.0 0.4 15.6 15.6 2.7 22 Black medick 5.0 1.7 33.4 0.1 2.8 5.6 2.6 23 Yellow sweet-clover 7.2 1.2 16.4 0.1 1.4 3.0 2.5 24 Golden dock 4.6 1.8 39.1 0.1 2.0 2.2 2.4 25 Green pigweed 4.8 1.6 32.3 0.1 2.3 2.8 2.3 26 Purslane speedwell 2.5 1.0 40.0 0.3 10.4 10.4 2.3 27 Thyme-leaved spurge 9.4 0.7 7.6 < 0.1 0.4 0.8 2.3 28 Rough cinquefoil 2.3 1.4 60.0 0.2 9.2 9.2 2.3 29 Shepherd's-purse 9.2 0.6 6.1 0.1 0.6 1.6 2.2 30 Dock species 2.3 1.6 70.0 0.1 5.8 5.8 2.0 31 Foxtail barley 5.0 1.1 22.5 0.1 1.4 2.2 1.9 32 Marsh yellow cress 2.5 1.4 55.0 0.1 3.6 3.6 1.7 33 False cleavers 2.3 1.3 55.0 0.1 4.0 4.0 1.7 34 Oak-leaved goosefoot 7.1 0.4 5.0 < 0.1 0.2 0.2 1.5 35 Narrow-leaved hawk's-beard 5.0 0.7 13.3 < 0.1 0.6 1.0 1.5 36 Alfalfa 4.5 0.7 14.7 < 0.1 0.9 1.6 1.4 37 Maple-leaved goosefoot 4.9 0.6 12.6 < 0.1 0.5 0.8 1.4 38 American dragonhead 4.6 0.6 12.7 < 0.1 0.7 1.2 1.3 39 Clover species 4.8 0.6 11.8 < 0.1 0.6 1.0 1.3 40 Siberian elm 4.6 0.4 9.7 < 0.1 0.7 1.2 1.2 41 Soybean 2.9 0.7 25.0 < 0.1 1.4 1.4 1.1 42 Bicknell's geranium 2.8 0.7 25.0 < 0.1 1.6 1.6 1.1 43 Kochia 4.6 0.4 7.7 < 0.1 0.3 0.4 1.1 44 Common groundsel 2.4 0.7 30.0 < 0.1 1.8 1.8 1.1 45 Wild mustard 2.5 0.5 20.0 < 0.1 0.8 0.8 0.8 46 Nightshade species 2.4 0.5 20.0 < 0.1 0.8 0.8 0.8 47 Large crab grass 2.5 0.4 15.0 < 0.1 0.8 0.8 0.8 48 Night-flowering catchfly 2.3 0.3 15.0 < 0.1 1.4 1.4 0.8 49 Flodman's thistle 2.5 0.2 10.0 < 0.1 0.4 0.4 0.6 50 Scouring-rush 2.4 0.1 5.0 < 0.1 1.2 1.2 0.6 51 Orchard grass 2.9 0.1 5.0 < 0.1 0.2 0.2 0.6 52 Wormseed mustard 2.3 0.2 10.0 < 0.1 0.6 0.6 0.6
(Table continued on next page)

Field Survey Summary Tables – Corn
40
Table 9. 2016 Corn in Manitoba (41 fields) (continued) Frequency Field Uniformity Field Density (#/m2) Relative
Rank Species (%) All Occurrence All Occurrence High Abundance 53 Tumble pigweed 2.3 0.2 10.0 < 0.1 0.4 0.4 0.6 54 Prostrate pigweed 2.3 0.2 10.0 < 0.1 0.4 0.4 0.6 55 Clammy hedge-hyssop 2.5 0.1 5.0 < 0.1 0.2 0.2 0.5 56 Common ragweed 1.9 0.2 10.0 < 0.1 0.4 0.4 0.5 57 Sunflower 1.9 0.2 10.0 < 0.1 0.4 0.4 0.5

Field Survey Summary Tables – Barley
41
Table 10. 2016 Barley in Manitoba (35 fields) Frequency Field Uniformity Field Density (#/m2) Relative
Rank Species (%) All Occurrence All Occurrence High Abundance 1 Green foxtail 36.5 17.3 47.3 7.3 20.1 98.0 46.9 2 Wild buckwheat 68.9 20.4 29.6 1.7 2.5 13.8 34.0 3 Wild oats 25.5 9.1 35.9 2.9 11.3 69.6 22.2 4 Canola/rapeseed 26.8 14.0 52.2 1.8 6.9 28.8 21.8 5 Pale smartweed 25.8 7.0 27.4 1.2 4.6 24.8 14.4 6 Quack grass 8.4 4.9 58.8 2.3 27.8 68.6 13.8 7 Canada thistle 31.1 7.4 23.7 0.6 1.8 8.8 13.3 8 Barnyard grass species 22.2 7.0 31.5 0.9 4.0 18.4 12.5 9 Yellow foxtail 11.2 5.1 45.6 1.8 15.8 41.0 12.4 10 Night-flowering catchfly 17.3 7.0 40.4 0.6 3.6 9.4 10.5 11 Dandelion 20.7 4.2 20.3 0.4 1.9 7.8 8.4 12 Redroot pigweed 20.4 4.1 20.0 0.4 2.0 6.0 8.4 13 Broad-leaved plantain 12.6 2.9 23.0 0.6 4.7 21.6 6.7 14 Spiny annual sow-thistle 13.6 3.8 27.9 0.3 2.4 7.4 6.5 15 Chickweed 3.3 2.9 90.0 0.7 22.8 22.8 5.5 16 Round-leaved mallow 13.7 2.7 19.8 0.2 1.1 2.0 5.2 17 Foxtail barley 13.4 2.4 18.0 0.2 1.6 4.4 5.1 18 Biennial wormwood 10.5 3.0 28.9 0.2 2.3 6.0 5.0 19 Perennial sow-thistle 12.1 2.0 16.9 0.2 1.4 4.2 4.4 20 Wild mustard 11.1 2.3 20.5 0.1 1.1 1.8 4.2 21 Thyme-leaved spurge 9.0 1.8 19.9 0.2 1.8 3.2 3.6 22 Lamb's-quarters 7.9 2.0 25.0 0.1 1.8 3.4 3.4 23 Tartary buckwheat 2.6 2.3 90.0 0.3 10.2 10.2 3.0 24 Absinth 2.6 1.1 45.0 0.4 17.6 17.6 3.0 25 Wheat 8.0 1.5 18.3 0.1 1.0 1.4 2.9 26 Shepherd's-purse 5.5 1.2 22.7 < 0.1 0.9 1.4 2.1 27 Kochia 5.4 0.8 14.7 0.1 1.9 3.6 2.0 28 Clover species 2.6 1.1 45.0 0.1 4.0 4.0 1.7 29 White mustard 3.6 0.9 25.0 < 0.1 1.4 1.4 1.5 30 American dragonhead 4.5 0.7 15.0 < 0.1 0.6 0.6 1.4 31 False cleavers 2.7 0.9 35.0 < 0.1 1.8 1.8 1.4 32 Oak-leaved goosefoot 2.8 0.8 30.0 < 0.1 1.8 1.8 1.3 33 Hemp-nettle 3.6 0.5 15.0 < 0.1 0.8 0.8 1.2 34 Soybean 4.9 0.2 5.0 < 0.1 0.2 0.2 1.2 35 Stinkweed 2.5 0.5 20.0 0.1 2.2 2.2 1.1 36 Yellow sweet-clover 2.6 0.5 20.0 0.1 2.0 2.0 1.0 37 Blue-joint 3.3 0.2 5.0 0.1 1.6 1.6 1.0 38 Rough cinquefoil 2.6 0.4 15.0 < 0.1 0.8 0.8 0.8 39 Marsh yellow cress 2.7 0.3 10.0 < 0.1 0.8 0.8 0.8 40 Prostrate knotweed 2.6 0.3 10.0 < 0.1 0.8 0.8 0.8 41 Stink grass 2.8 0.1 5.0 < 0.1 0.2 0.2 0.7 42 Black medick 2.8 0.1 5.0 < 0.1 0.2 0.2 0.7 43 Dock species 2.8 0.1 5.0 < 0.1 0.2 0.2 0.7 44 Water smartweed 2.7 0.1 5.0 < 0.1 0.2 0.2 0.7 45 Manitoba maple 2.6 0.1 5.0 < 0.1 0.2 0.2 0.6

Field Survey Summary Tables – Oat
42
Table 11. 2016 Oat in Manitoba (23 fields) Frequency Field Uniformity Field Density (#/m2) Relative
Rank Species (%) All Occurrence All Occurrence High Abundance 1 Green foxtail 48.9 26.4 53.9 13.0 26.6 93.8 50.1 2 Barnyard grass species 42.9 14.3 33.4 4.6 10.8 44.8 24.2 3 Yellow foxtail 23.2 14.1 60.8 5.8 25.0 57.2 23.7 4 Wild buckwheat 45.3 20.8 45.8 2.1 4.6 13.4 22.2 5 Broad-leaved plantain 31.2 13.3 42.6 3.8 12.2 57.4 20.0 6 Pale smartweed 44.6 10.9 24.5 1.8 3.9 17.8 16.3 7 Wild oats 26.8 11.7 43.8 1.2 4.5 9.8 12.8 8 Wheat 9.1 5.1 56.6 1.9 21.5 39.4 8.4 9 Redroot pigweed 26.9 4.9 18.4 0.7 2.7 12.0 8.3 10 Perennial sow-thistle 25.1 6.2 24.7 0.5 1.9 6.8 8.1 11 Canola/rapeseed 26.4 5.2 19.7 0.4 1.5 5.0 7.6 12 Lamb's-quarters 18.1 5.0 27.4 1.0 5.5 17.8 7.5 13 Canada thistle 26.6 4.0 14.9 0.3 1.2 2.2 6.8 14 Witch grass 4.8 1.4 30.0 2.0 41.8 41.8 5.9 15 Wild mustard 9.7 3.9 40.4 0.8 8.7 16.2 5.4 16 Dandelion 18.1 3.5 19.4 0.3 1.6 4.2 5.2 17 Night-flowering catchfly 14.0 4.4 31.6 0.3 2.3 3.8 5.2 18 Northern willowherb 9.7 3.4 34.9 0.8 8.4 15.8 5.0 19 Purslane 9.3 3.1 33.6 0.4 4.4 8.4 4.0 20 Round-leaved mallow 12.2 3.0 25.0 0.2 1.9 4.0 3.9 21 Thyme-leaved spurge 10.4 2.3 22.1 0.2 1.5 2.4 3.1 22 Foxtail barley 13.8 1.2 8.5 0.1 0.7 1.0 2.9 23 Oak-leaved goosefoot 14.1 0.9 6.7 0.1 0.5 1.2 2.8 24 Black medick 9.7 2.0 20.1 0.1 1.2 1.8 2.7 25 Spiny annual sow-thistle 12.3 1.4 11.3 0.1 0.6 1.2 2.7 26 Yellow sweet-clover 5.0 2.8 55.0 0.2 3.0 3.0 2.5 27 Dog mustard 4.9 2.5 50.0 0.1 3.0 3.0 2.3 28 Stork's bill 3.8 0.8 20.0 0.6 15.8 15.8 2.3 29 Field horsetail 4.8 1.0 20.0 0.4 8.0 8.0 2.1 30 Canada fleabane 4.9 1.7 35.0 0.1 2.0 2.0 1.9 31 Tumble pigweed 4.9 1.5 30.0 0.1 1.8 1.8 1.7 32 Prostrate knotweed 4.8 1.2 25.0 0.2 3.4 3.4 1.7 33 Stinkweed 7.9 0.8 10.2 < 0.1 0.4 0.6 1.7 34 Barley 5.5 0.8 15.0 0.1 1.2 1.2 1.4 35 Rye 3.8 1.3 35.0 0.1 1.6 1.6 1.4 36 Rough cinquefoil 4.9 1.0 20.0 < 0.1 0.8 0.8 1.3 37 Scouring-rush 5.5 0.5 10.0 0.1 1.6 1.6 1.3 38 Alfalfa 4.9 0.7 15.0 < 0.1 0.8 0.8 1.2 39 Proso millet 4.7 0.7 15.0 < 0.1 1.0 1.0 1.2 40 Rayless aster 5.5 0.5 10.0 < 0.1 0.4 0.4 1.2 41 Tartary buckwheat 4.1 0.8 20.0 < 0.1 1.0 1.0 1.1 42 Showy milkweed 4.9 0.5 10.0 < 0.1 0.6 0.6 1.1 43 American dragonhead 4.9 0.5 10.0 < 0.1 0.4 0.4 1.0 44 Silverweed 4.8 0.2 5.0 0.1 1.2 1.2 1.0 45 Manitoba maple 4.9 0.2 5.0 < 0.1 0.6 0.6 0.9 46 Kochia 4.4 0.4 10.0 < 0.1 0.4 0.4 0.9 47 Golden dock 5.0 0.3 5.0 < 0.1 0.2 0.2 0.9 48 Chickweed 4.8 0.2 5.0 < 0.1 0.4 0.4 0.9 49 Maple-leaved goosefoot 4.8 0.2 5.0 < 0.1 0.2 0.2 0.9 50 Currant species 4.8 0.2 5.0 < 0.1 0.2 0.2 0.9

Field Survey Summary Tables – Flax
43
Table 12. 2016 Flax in Manitoba (21 fields) Frequency Field Uniformity Field Density (#/m2) Relative
Rank Species (%) All Occurrence All Occurrence High Abundance 1 Green foxtail 34.6 19.9 57.5 3.7 10.7 32.2 37.2 2 Wild buckwheat 66.8 15.8 23.7 1.3 1.9 7.2 26.1 3 False cleavers 29.2 12.7 43.6 2.2 7.4 25.6 23.6 4 Canola/rapeseed 42.1 12.9 30.6 1.1 2.7 13.4 20.0 5 Pale smartweed 43.9 14.0 31.8 0.9 2.1 5.6 19.5 6 Wheat 46.5 10.5 22.5 1.0 2.1 10.4 18.2 7 Round-leaved mallow 29.4 7.9 26.8 1.0 3.5 9.8 14.5 8 Chickweed 14.1 6.8 48.3 1.3 9.3 23.0 13.3 9 Redroot pigweed 33.2 7.1 21.4 0.7 2.0 6.6 12.7 10 Shepherd's-purse 20.0 6.6 33.2 0.7 3.5 11.6 10.6 11 Canada thistle 37.3 4.3 11.4 0.3 0.7 1.2 9.3 12 Green pigweed 9.2 5.9 63.8 0.8 8.8 15.2 9.3 13 Dandelion 32.3 3.5 10.7 0.2 0.5 1.4 7.7 14 Barnyard grass species 24.3 2.9 11.9 0.3 1.1 3.4 6.7 15 Spiny annual sow-thistle 13.9 4.4 32.0 0.3 2.4 3.8 6.5 16 Wild oats 23.3 3.3 14.0 0.2 0.7 2.0 6.2 17 Night-flowering catchfly 20.0 3.5 17.4 0.2 1.1 1.8 6.1 18 Thyme-leaved spurge 13.9 2.5 18.0 0.2 1.3 1.6 4.5 19 Perennial sow-thistle 9.7 3.4 34.7 0.2 1.9 2.8 4.4 20 Clover species 9.2 3.4 36.8 0.2 1.8 2.6 4.3 21 Broad-leaved plantain 8.9 2.0 22.6 0.3 3.2 3.6 4.0 22 Rye 5.0 3.0 60.0 0.2 4.6 4.6 3.8 23 Yellow foxtail 9.5 2.1 22.5 0.2 1.7 2.2 3.5 24 Alfalfa 9.9 2.2 22.5 0.1 1.2 1.2 3.4 25 Foxtail barley 14.1 1.4 10.0 0.1 0.4 0.6 3.2 26 Marsh yellow cress 9.8 1.6 16.4 0.1 1.2 2.0 3.0 27 Hemp-nettle 9.2 1.6 17.3 0.1 1.3 2.4 2.9 28 Stinkweed 6.2 1.9 30.0 0.1 1.6 1.6 2.5 29 Bicknell's geranium 9.4 0.9 10.0 < 0.1 0.4 0.4 2.1 30 American dragonhead 9.5 0.5 5.0 < 0.1 0.3 0.4 1.8 31 Kochia 4.7 0.9 20.0 < 0.1 0.8 0.8 1.4 32 Quack grass 4.4 0.7 15.0 0.1 1.4 1.4 1.4 33 Biennial wormwood 4.7 0.5 10.0 < 0.1 0.8 0.8 1.2 34 Showy milkweed 4.8 0.5 10.0 < 0.1 0.4 0.4 1.1 35 Lamb's-quarters 4.7 0.5 10.0 < 0.1 0.4 0.4 1.1 36 Rough cinquefoil 5.6 0.3 5.0 < 0.1 0.2 0.2 1.0 37 Yellow sweet-clover 4.7 0.2 5.0 < 0.1 0.2 0.2 0.9 38 Soybean 4.2 0.2 5.0 < 0.1 0.2 0.2 0.8

Field Survey Summary Tables – Sunflower
44
Table 13. 2016 Sunflower in Manitoba (18 fields) Frequency Field Uniformity Field Density (#/m2) Relative
Rank Species (%) All Occurrence All Occurrence High Abundance 1 Wild buckwheat 54.2 16.7 30.9 3.8 6.9 55.2 35.4 2 Green foxtail 45.0 20.6 45.7 2.7 6.0 17.6 31.1 3 Biennial wormwood 45.2 14.9 33.0 1.4 3.1 8.0 21.8 4 Thyme-leaved spurge 21.3 7.4 34.9 1.8 8.3 32.0 15.8 5 Round-leaved mallow 40.7 10.1 24.8 0.7 1.6 3.8 14.8 6 Wheat 27.5 8.8 32.1 1.1 4.1 11.0 14.3 7 Canola/rapeseed 27.2 10.1 36.9 0.9 3.3 8.0 13.9 8 Wild oats 21.2 7.4 34.9 1.2 5.6 12.2 12.9 9 Perennial sow-thistle 40.2 8.1 20.1 0.4 1.0 1.6 12.2 10 Barnyard grass species 21.5 7.0 32.5 1.0 4.7 16.8 11.9 11 Canada thistle 37.9 6.2 16.3 0.3 0.8 1.8 10.5 12 Pale smartweed 32.3 5.4 16.7 0.6 1.7 6.2 10.4 13 Redroot pigweed 22.1 5.2 23.4 0.5 2.1 3.8 8.4 14 Spiny annual sow-thistle 15.9 5.9 36.9 0.4 2.5 5.4 7.5 15 Lamb's-quarters 21.3 4.2 19.6 0.3 1.3 2.8 6.8 16 Yellow foxtail 15.9 2.4 15.4 0.6 3.5 7.0 6.4 17 Purslane 17.4 3.8 21.8 0.4 2.1 5.6 6.4 18 Field horsetail 5.7 3.1 55.0 0.6 11.4 11.4 5.7 19 Dandelion 16.3 3.3 20.0 0.1 0.9 1.2 4.9 20 Black medick 10.5 2.8 26.5 0.3 2.8 5.6 4.5 21 Annual sow-thistle 5.3 2.9 55.0 0.4 7.6 7.6 4.4 22 False ragweed 10.8 2.4 22.2 0.2 1.5 2.8 3.7 23 Wild mustard 11.1 2.5 22.6 0.1 1.1 1.6 3.6 24 Golden dock 11.7 2.3 20.0 0.1 1.1 1.8 3.6 25 Stork's bill 10.8 1.9 17.5 0.1 1.1 1.6 3.2 26 Toad rush 5.7 2.3 40.0 0.2 3.4 3.4 3.0 27 Shepherd's-purse 7.2 1.8 25.0 0.1 1.4 1.4 2.5 28 Willow species 11.3 0.9 7.6 0.1 0.5 0.8 2.4 29 Kochia 11.0 0.5 5.0 < 0.1 0.2 0.2 2.0 30 Marsh yellow cress 5.8 1.5 25.0 0.1 1.0 1.0 1.9 31 Narrow-leaved hawk's-beard 5.3 1.3 25.0 0.1 1.4 1.4 1.9 32 Corn 5.7 1.1 20.0 0.1 1.0 1.0 1.7 33 Stinkweed 7.2 0.7 10.0 < 0.1 0.4 0.4 1.6 34 Russian thistle 5.3 0.8 15.0 < 0.1 0.6 0.6 1.4 35 Aster species 5.5 0.5 10.0 < 0.1 0.4 0.4 1.2 36 Broad-leaved plantain 4.9 0.5 10.0 < 0.1 0.8 0.8 1.2 37 Oats 5.8 0.3 5.0 < 0.1 0.4 0.4 1.1 38 Oak-leaved goosefoot 5.5 0.3 5.0 < 0.1 0.6 0.6 1.1 39 Rayless aster 5.5 0.3 5.0 < 0.1 0.2 0.2 1.0 40 Foxtail barley 5.5 0.3 5.0 < 0.1 0.2 0.2 1.0 41 Common ragweed 5.5 0.3 5.0 < 0.1 0.2 0.2 1.0

Field Survey Summary Tables – Density, Species Richness and Weed-Free Quadrats by Ecoregion
45
Table 14. Number of fields surveyed by crop in each ecoregion Aspen Southwest Manitoba Lake Manitoba Boreal Mid-Boreal Interlake Lake of the Parkland Uplands Plain Transition Uplands Plain Woods Canola 103 3 56 14 8 18 4 Spring wheat 92 7 63 11 6 15 2 Soybean 17 2 78 0 0 16 5 Corn 11 0 25 0 1 4 0 Barley 22 2 9 0 0 2 0 Oat 8 0 12 0 0 3 0 Flax 13 2 4 0 0 2 0 Sunflower 8 1 8 0 0 1 0 Annual crops 274 17 255 25 15 61 11 Table 15. Density, species richness and weed-free quadrats in the surveyed crops in each ecoregion Number of Density Species Weed-free fields surveyed (number/m2) (number/field) quadrats Area mean SE median mean SE % SE Aspen Parkland Annual crops 274 16.6 1.5 6.4 5.1 0.2 33.3 2.8 Canola 103 11.8 1.9 5.7 4.6 0.3 38.8 4.8 Spring wheat 92 18.3 2.4 6.6 5.2 0.2 30.8 4.8 Soybean 17 6.5 1.9 3.9 5.0 0.5 42.3 12.0 Corn 11 40.6 13.2 15.9 7.1 1.1 9.1 8.7 Barley 22 23.8 8.9 7.8 5.5 0.5 32.0 9.9 Flax 13 18.4 4.8 9.6 7.0 0.8 15.7 10.1 Southwest Manitoba Uplands Annual crops 17 21.6 8.7 8.7 4.7 0.6 32.7 11.4 Lake Manitoba Plain Annual crops 255 14.9 2.3 3.4 4.4 0.2 51.1 3.1 Canola 56 12.5 3.1 2.8 4.1 0.5 60.0 6.5 Spring wheat 63 13.2 3.9 1.7 3.4 0.4 60.7 6.2 Soybean 78 8.5 1.3 3.8 4.2 0.4 47.2 5.7 Corn 25 12.7 2.7 8.1 5.2 0.6 32.8 9.4 Oat 12 60.6 29.1 12.4 8.2 2.0 22.6 12.1 Boreal Transition Annual crops 25 10.8 2.7 4.8 4.6 0.6 43.1 9.9 Canola 14 11.6 3.8 27.0 4.6 0.8 40.7 13.1 Spring wheat 11 9.9 3.6 4.4 4.5 1.0 46.4 15.0 Mid-Boreal Uplands Annual crops 15 29.4 7.2 22.6 6.9 0.5 13.3 8.8 Interlake Plain Annual crops 61 8.7 2.0 2.6 3.5 0.4 55.3 6.4 Canola 18 5.5 2.2 1.3 2.4 0.7 69.9 10.8 Spring wheat 15 4.3 1.4 2.3 3.0 0.4 60.5 12.6 Soybean 16 12.8 5.3 4.8 4.9 0.8 42.9 12.4 Lake of the Woods Annual crops 11 18.7 6.7 4.7 5.4 1.1 39.8 14.8

Field Survey Summary Tables – Aspen Parkland Ecoregion
46
Table 16. 2016 Annual crops in the Aspen Parkland Ecoregion (274 fields) Frequency Field Uniformity Field Density (#/m2) Relative
Rank Species (%) All Occurrence All Occurrence High Abundance 1 Green foxtail 36.6 15.0 41.0 4.3 11.7 82.8 45.2 2 Wild buckwheat 64.0 17.7 27.7 1.4 2.3 55.2 35.6 3 Wild oats 27.0 7.7 28.4 1.4 5.1 69.6 19.7 4 Barnyard grass species 20.9 6.4 30.6 1.1 5.5 80.0 16.2 5 Round-leaved mallow 31.2 6.6 21.2 0.5 1.6 14.6 14.6 6 Canola/rapeseed 25.6 6.6 26.0 0.7 2.7 28.8 14.5 7 Yellow foxtail 9.7 3.2 32.8 1.0 10.1 57.2 10.4 8 Canada thistle 22.3 4.4 19.6 0.4 1.8 33.8 10.3 9 Wheat 17.0 4.8 28.0 0.5 2.7 23.2 9.9 10 Spiny annual sow-thistle 15.3 4.5 29.5 0.4 2.8 17.0 9.2 11 Redroot pigweed 17.2 3.3 19.1 0.4 2.1 22.2 8.3 12 Lamb's-quarters 16.0 3.1 19.3 0.3 1.9 43.0 7.5 13 Broad-leaved plantain 11.3 2.8 24.4 0.4 3.9 53.0 7.1 14 False cleavers 13.9 3.5 25.2 0.2 1.8 25.6 7.1 15 Chickweed 9.8 2.5 25.5 0.4 4.2 23.2 6.5 16 Night-flowering catchfly 15.0 2.7 18.2 0.2 1.4 6.6 6.4 17 Dandelion 13.5 2.8 20.4 0.2 1.5 7.4 6.1 18 Pale smartweed 9.6 2.1 21.5 0.2 2.1 23.2 4.8 19 Foxtail barley 10.3 1.8 17.6 0.2 1.5 12.4 4.4 20 Kochia 8.9 1.6 17.9 0.1 1.3 4.0 3.7 21 Perennial sow-thistle 9.1 1.6 17.9 0.1 1.0 7.4 3.7 22 Biennial wormwood 8.1 1.5 18.1 0.1 1.1 6.0 3.3 23 Shepherd's-purse 7.6 1.3 16.8 0.1 1.0 11.6 3.0 24 Stork's bill 3.3 1.0 30.9 0.2 5.2 15.8 2.5 25 Golden dock 3.3 0.9 27.9 0.2 5.5 23.8 2.5 26 Oak-leaved goosefoot 5.6 1.0 18.1 0.1 1.1 2.6 2.3 27 Black medick 5.1 1.0 20.6 0.1 1.3 5.6 2.2 28 Hemp-nettle 4.9 0.9 18.1 0.1 1.5 11.6 2.1 29 Thyme-leaved spurge 4.8 0.7 14.4 0.1 1.6 32.0 2.0 30 Rough hair grass 0.4 0.3 70.0 0.2 60.0 60.0 1.8 31 Stinkweed 4.2 0.6 14.7 0.1 1.6 15.6 1.7 32 Field horsetail 2.4 0.6 23.6 0.1 3.5 11.4 1.4 33 Wild mustard 3.3 0.6 19.7 < 0.1 1.2 2.7 1.4 34 Purslane 2.9 0.5 18.3 0.1 2.1 8.2 1.4 35 Scouring-rush 2.2 0.6 28.3 0.1 2.6 6.6 1.3 36 Soybean 2.0 0.6 30.3 0.1 3.0 11.4 1.2 37 Yellow sweet-clover 2.3 0.6 25.7 < 0.1 1.8 3.0 1.2 38 Annual sow-thistle 0.9 0.5 50.6 0.1 11.0 22.6 1.1 39 Quack grass 1.2 0.5 43.4 0.1 6.4 13.4 1.1 40 Green pigweed 1.3 0.5 36.5 0.1 4.9 15.2 1.0 41 Rye 1.0 0.5 57.3 0.1 5.4 9.6 0.9 42 Dock species 1.8 0.4 21.5 < 0.1 1.5 5.8 0.8 43 Prostrate pigweed 1.8 0.3 18.5 < 0.1 1.8 3.8 0.8 44 Proso millet 0.4 0.2 60.0 0.1 20.0 20.0 0.8 45 Narrow-leaved hawk's-beard 1.6 0.4 24.3 < 0.1 1.5 3.4 0.8 46 American dragonhead 2.2 0.2 8.6 < 0.1 0.4 1.2 0.7 47 Rough cinquefoil 0.9 0.3 31.3 < 0.1 4.5 9.2 0.7 48 Alfalfa 1.7 0.2 12.8 < 0.1 0.8 1.6 0.6 49 Manitoba maple 1.0 0.3 30.9 < 0.1 1.8 4.0 0.6 50 Tumble pigweed 1.6 0.2 11.3 < 0.1 0.6 1.4 0.5 51 Clover species 1.2 0.2 16.0 < 0.1 0.7 1.2 0.4 52 Barley 1.0 0.1 13.1 < 0.1 1.0 1.2 0.4
(Table continued on next page)

Field Survey Summary Tables – Aspen Parkland Ecoregion
47
Table 16. 2016 Annual crops in the Aspen Parkland Ecoregion (274 fields) (continued) Frequency Field Uniformity Field Density (#/m2) Relative
Rank Species (%) All Occurrence All Occurrence High Abundance 53 Northern willowherb 1.2 0.1 6.5 < 0.1 0.3 0.4 0.3 54 Downy brome 0.5 0.2 35.0 < 0.1 2.0 2.0 0.3 55 Low cudweed 0.8 0.1 10.1 < 0.1 1.9 3.0 0.3 56 Oats 0.4 0.2 55.0 < 0.1 2.6 2.6 0.3 57 Blue grass species 0.8 0.1 12.7 < 0.1 0.5 0.8 0.3 58 Perennial rye grass 0.5 0.1 25.0 < 0.1 2.2 2.2 0.3 59 Slough grass 0.8 0.1 10.0 < 0.1 0.6 0.6 0.2 60 Marsh yellow cress 0.4 0.1 35.0 < 0.1 1.4 1.4 0.2 61 Maple-leaved goosefoot 0.7 0.1 10.9 < 0.1 0.7 1.0 0.2 62 Flax 0.8 0.1 7.5 < 0.1 0.3 0.4 0.2 63 Nightshade species 0.6 0.1 14.4 < 0.1 0.6 0.8 0.2 64 American vetch 0.8 0.1 7.4 < 0.1 0.3 0.4 0.2 65 Absinth 0.8 < 0.1 5.0 < 0.1 0.2 0.2 0.2 66 False ragweed 0.5 0.1 16.1 < 0.1 0.9 2.8 0.2 67 Rayless aster 0.6 0.1 10.0 < 0.1 0.4 0.4 0.2 68 Timothy 0.4 0.1 25.0 < 0.1 1.1 1.1 0.2 69 White mustard 0.4 0.1 25.0 < 0.1 1.4 1.4 0.2 70 Russian thistle 0.5 0.1 11.0 < 0.1 0.6 0.6 0.2 71 Hedge bindweed 0.4 0.1 15.0 < 0.1 0.8 0.8 0.2 72 Common groundsel 0.3 0.1 30.0 < 0.1 1.8 1.8 0.2 73 Showy milkweed 0.5 < 0.1 6.2 < 0.1 0.6 0.6 0.1 74 Willow species 0.4 < 0.1 10.0 < 0.1 0.6 0.6 0.1 75 Pennsylvania pellitory 0.5 < 0.1 5.0 < 0.1 0.2 0.2 0.1 76 Smooth brome 0.4 < 0.1 10.0 < 0.1 0.4 0.4 0.1 77 White cockle 0.4 < 0.1 10.0 < 0.1 0.4 0.4 0.1 78 False flax species 0.4 < 0.1 10.0 < 0.1 0.6 0.6 0.1 79 Witch grass 0.4 < 0.1 5.0 < 0.1 0.4 0.4 0.1 80 Cocklebur 0.4 < 0.1 5.0 < 0.1 0.8 0.8 0.1 81 Pineappleweed 0.4 < 0.1 5.0 < 0.1 0.2 0.2 0.1 82 Western snowberry 0.4 < 0.1 5.0 < 0.1 0.2 0.2 0.1 83 Siberian elm 0.4 < 0.1 5.0 < 0.1 0.2 0.2 0.1 84 Short-awned foxtail 0.4 < 0.1 5.0 < 0.1 0.2 0.2 0.1 85 Wormseed mustard 0.3 < 0.1 10.0 < 0.1 0.6 0.6 0.1 86 Toad rush 0.1 < 0.1 40.0 < 0.1 3.4 3.4 0.1 87 Yellow evening-primrose 0.2 < 0.1 10.0 < 0.1 1.0 1.0 0.1 88 Stink grass 0.3 < 0.1 5.0 < 0.1 0.2 0.2 0.1 89 Corn 0.1 < 0.1 20.0 < 0.1 1.0 1.0 < 0.1

Field Survey Summary Tables – Canola in the Aspen Parkland Ecoregion
48
Table 17. 2016 Canola in the Aspen Parkland Ecoregion (103 fields) Frequency Field Uniformity Field Density (#/m2) Relative
Rank Species (%) All Occurrence All Occurrence High Abundance 1 Green foxtail 28.4 10.7 37.8 2.5 9.0 82.8 38.1 2 Wild buckwheat 55.3 14.0 25.2 1.0 1.8 14.4 33.8 3 Wheat 26.7 8.8 32.8 0.9 3.5 23.2 22.2 4 Wild oats 27.4 7.3 26.5 0.8 2.8 27.2 19.4 5 Round-leaved mallow 34.3 6.6 19.2 0.4 1.1 3.8 17.0 6 Yellow foxtail 9.7 2.9 30.0 0.9 8.8 47.4 12.2 7 Barnyard grass species 15.2 4.4 29.1 0.5 3.2 17.4 11.7 8 Redroot pigweed 16.8 3.5 20.8 0.5 2.7 22.2 10.9 9 Canada thistle 20.9 3.8 17.9 0.2 1.1 3.8 10.1 10 Spiny annual sow-thistle 13.3 3.9 29.3 0.4 3.0 17.0 10.0 11 Lamb's-quarters 19.7 3.1 15.6 0.2 1.1 8.4 9.1 12 False cleavers 18.1 3.3 18.3 0.2 1.2 5.0 9.0 13 Dandelion 10.9 2.8 25.6 0.2 2.1 7.4 7.0 14 Chickweed 12.3 1.8 14.8 0.2 1.6 5.2 6.2 15 Rough hair grass 1.0 0.7 70.0 0.6 60.0 60.0 5.8 16 Broad-leaved plantain 10.2 1.8 17.7 0.1 1.2 2.0 4.9 17 Oak-leaved goosefoot 9.9 1.9 18.7 0.1 1.0 2.6 4.8 18 Kochia 9.5 1.6 17.2 0.1 1.3 4.0 4.7 19 Golden dock 4.0 1.2 30.8 0.3 7.5 23.8 4.7 20 Perennial sow-thistle 10.4 1.7 16.5 0.1 0.8 3.2 4.6 21 Shepherd's-purse 11.5 1.3 11.2 0.1 0.7 1.6 4.4 22 Biennial wormwood 9.4 1.5 15.8 0.1 0.8 3.8 4.1 23 Night-flowering catchfly 9.4 1.1 12.2 0.1 0.7 2.4 3.7 24 Stork's bill 3.8 1.5 40.0 0.1 3.8 10.2 3.5 25 Foxtail barley 6.8 1.0 14.9 0.1 0.9 2.2 2.9 26 Pale smartweed 5.1 1.0 20.0 0.1 1.3 3.4 2.6 27 Black medick 6.3 0.8 13.4 < 0.1 0.8 3.6 2.6 28 Scouring-rush 2.2 1.3 57.1 0.1 4.6 6.6 2.5 29 Hemp-nettle 1.9 1.0 52.8 0.1 6.1 11.6 2.4 30 Canola/rapeseed 3.9 0.8 21.2 0.1 1.6 4.6 2.2 31 Field horsetail 2.9 0.6 21.7 0.1 2.3 3.2 1.8 32 Rye 1.0 0.8 80.0 0.1 9.6 9.6 1.7 33 Thyme-leaved spurge 3.9 0.5 11.6 < 0.1 1.1 2.8 1.6 34 Green pigweed 1.8 0.5 27.5 0.1 4.5 8.2 1.6 35 Stinkweed 4.4 0.5 10.4 < 0.1 0.4 0.7 1.6 36 Quack grass 1.0 0.6 65.0 0.1 7.4 7.4 1.4 37 Purslane 1.9 0.6 31.7 < 0.1 2.3 4.2 1.4 38 Prostrate pigweed 1.8 0.4 22.5 < 0.1 2.4 3.8 1.2 39 Downy brome 1.3 0.4 35.0 < 0.1 2.0 2.0 0.9 40 Narrow-leaved hawk's-beard 1.0 0.4 45.0 < 0.1 3.4 3.4 0.9 41 American dragonhead 2.9 0.1 5.0 < 0.1 0.2 0.2 0.8 42 Perennial rye grass 1.2 0.3 25.0 < 0.1 2.2 2.2 0.8 43 Marsh yellow cress 1.0 0.3 35.0 < 0.1 1.4 1.4 0.6 44 Alfalfa 1.9 0.1 7.4 < 0.1 0.5 0.8 0.6 45 Flax 1.9 0.1 7.5 < 0.1 0.3 0.4 0.6 46 Rough cinquefoil 0.6 0.2 35.0 < 0.1 6.2 6.2 0.6 47 Dock species 2.0 0.1 5.0 < 0.1 0.2 0.2 0.6 48 Yellow sweet-clover 1.9 0.1 5.0 < 0.1 0.2 0.2 0.5 49 Blue grass species 1.0 0.2 20.0 < 0.1 0.8 0.8 0.5 50 Maple-leaved goosefoot 1.0 0.1 15.0 < 0.1 1.0 1.0 0.4 51 Hedge bindweed 1.0 0.2 15.0 < 0.1 0.8 0.8 0.4 52 Soybean 1.0 0.1 15.0 < 0.1 0.8 0.8 0.4
(Table continued on next page)

Field Survey Summary Tables – Canola in the Aspen Parkland Ecoregion
49
Table 17. 2016 Canola in the Aspen Parkland Ecoregion (103 fields) (continued) Frequency Field Uniformity Field Density (#/m2) Relative
Rank Species (%) All Occurrence All Occurrence High Abundance 53 Tumble pigweed 1.0 0.1 10.0 < 0.1 0.4 0.4 0.4 54 Willow species 1.0 0.1 10.0 < 0.1 0.6 0.6 0.4 55 Absinth 1.0 0.1 5.0 < 0.1 0.2 0.2 0.3 56 Pineappleweed 1.0 < 0.1 5.0 < 0.1 0.2 0.2 0.3 57 Western snowberry 1.0 < 0.1 5.0 < 0.1 0.2 0.2 0.3 58 American vetch 1.0 < 0.1 5.0 < 0.1 0.2 0.2 0.3 59 Siberian elm 1.0 < 0.1 5.0 < 0.1 0.2 0.2 0.3

Field Survey Summary Tables – Spring Wheat in the Aspen Parkland Ecoregion
50
Table 18. 2016 Spring wheat in the Aspen Parkland Ecoregion (92 fields) Frequency Field Uniformity Field Density (#/m2) Relative
Rank Species (%) All Occurrence All Occurrence High Abundance 1 Green foxtail 45.8 19.1 41.7 5.9 12.8 71.6 56.1 2 Wild buckwheat 65.6 18.3 27.9 1.6 2.5 45.6 36.1 3 Wild oats 29.4 8.1 27.5 1.9 6.3 51.8 22.2 4 Canola/rapeseed 38.3 8.0 21.0 0.8 2.1 27.4 18.2 5 Barnyard grass species 24.3 6.4 26.3 1.0 4.3 25.2 15.4 6 Round-leaved mallow 28.9 7.5 25.8 0.7 2.4 14.6 15.2 7 Spiny annual sow-thistle 20.1 6.1 30.2 0.5 2.7 13.6 11.7 8 Canada thistle 21.6 4.4 20.2 0.6 2.7 33.8 10.9 9 Broad-leaved plantain 13.9 3.8 27.3 0.9 6.3 53.0 10.5 10 Chickweed 11.5 3.9 33.7 0.7 6.1 23.2 9.1 11 Night-flowering catchfly 19.9 3.5 17.6 0.3 1.7 6.6 8.5 12 False cleavers 14.4 4.4 30.6 0.2 1.7 5.0 7.6 13 Dandelion 17.3 3.0 17.5 0.2 1.2 5.0 6.9 14 Foxtail barley 13.7 2.9 20.9 0.3 2.0 12.4 6.4 15 Pale smartweed 11.2 1.7 15.2 0.1 1.2 5.4 4.3 16 Redroot pigweed 10.6 1.7 16.4 0.1 1.3 3.6 4.2 17 Lamb's-quarters 10.8 2.0 18.0 0.1 0.9 2.6 4.2 18 Yellow foxtail 7.5 1.5 20.2 0.3 3.5 18.6 4.1 19 Kochia 9.3 1.9 19.9 0.1 1.3 3.2 3.9 20 Hemp-nettle 9.9 1.0 10.5 0.1 0.5 1.2 3.0 21 Soybean 4.5 1.5 34.2 0.2 3.5 11.4 2.9 22 Wild mustard 6.5 1.4 20.7 0.1 1.4 2.7 2.8 23 Biennial wormwood 7.5 1.1 14.9 0.1 1.0 3.0 2.7 24 Annual sow-thistle 2.2 1.1 50.0 0.3 11.4 22.6 2.7 25 Shepherd's-purse 4.6 1.2 25.7 0.1 1.4 2.2 2.2 26 Proso millet 1.1 0.7 60.0 0.2 20.0 20.0 2.0 27 Wheat 5.6 0.8 14.3 < 0.1 0.6 1.0 1.9 28 Stork's bill 3.3 0.8 23.3 0.1 3.5 8.0 1.9 29 Black medick 3.9 0.9 23.7 0.1 1.3 4.2 1.8 30 Perennial sow-thistle 3.9 0.8 21.2 < 0.1 1.1 2.0 1.6 31 Golden dock 2.2 0.6 28.1 0.1 6.2 11.4 1.6 32 Manitoba maple 2.1 0.8 39.6 0.1 2.4 4.0 1.4 33 Stinkweed 3.2 0.5 16.7 < 0.1 0.8 1.0 1.2 34 Field horsetail 2.2 0.4 20.0 0.1 2.5 4.6 1.1 35 Purslane 2.1 0.2 9.9 0.1 4.1 8.2 1.0 36 Prostrate pigweed 2.1 0.4 17.3 < 0.1 1.7 3.2 0.9 37 Narrow-leaved hawk's-beard 2.2 0.4 20.0 < 0.1 0.9 0.9 0.9 38 Low cudweed 2.1 0.2 10.1 < 0.1 1.9 3.0 0.8 39 Tumble pigweed 2.2 0.3 15.0 < 0.1 0.8 1.4 0.8 40 Thyme-leaved spurge 3.2 0.2 5.0 < 0.1 0.2 0.2 0.8 41 Oak-leaved goosefoot 2.2 0.2 10.0 < 0.1 1.4 2.6 0.8 42 Slough grass 2.2 0.2 10.0 < 0.1 0.6 0.6 0.7 43 Dock species 1.1 0.4 35.0 < 0.1 2.2 2.2 0.6 44 Yellow sweet-clover 1.0 0.3 30.0 < 0.1 3.0 3.0 0.6 45 Timothy 1.1 0.3 25.0 < 0.1 1.1 1.1 0.5 46 Clover species 1.2 0.2 15.0 < 0.1 0.6 0.6 0.4 47 American dragonhead 1.0 0.2 15.0 < 0.1 0.8 0.8 0.4 48 Russian thistle 1.1 0.1 10.0 < 0.1 0.6 0.6 0.3 49 Northern willowherb 1.3 0.1 5.0 < 0.1 0.4 0.4 0.3 50 Alfalfa 1.1 0.1 10.0 < 0.1 0.6 0.6 0.3 51 False ragweed 1.1 0.1 10.0 < 0.1 0.4 0.4 0.3 52 Smooth brome 1.1 0.1 10.0 < 0.1 0.4 0.4 0.3
(Table continued on next page)

Field Survey Summary Tables – Spring Wheat in the Aspen Parkland Ecoregion
51
Table 18. 2016 Spring wheat in the Aspen Parkland Ecoregion (92 fields) (continued) Frequency Field Uniformity Field Density (#/m2) Relative
Rank Species (%) All Occurrence All Occurrence High Abundance 53 Rough cinquefoil 1.1 0.1 10.0 < 0.1 0.4 0.4 0.3 54 White cockle 1.1 0.1 10.0 < 0.1 0.4 0.4 0.3 55 American vetch 1.1 0.1 10.0 < 0.1 0.4 0.4 0.3 56 Quack grass 1.0 0.1 5.0 < 0.1 0.8 0.8 0.3 57 Witch grass 1.1 0.1 5.0 < 0.1 0.4 0.4 0.3 58 Cocklebur 1.0 0.1 5.0 < 0.1 0.8 0.8 0.3 59 Showy milkweed 1.0 0.1 5.0 < 0.1 0.6 0.6 0.3 60 Short-awned foxtail 1.1 0.1 5.0 < 0.1 0.2 0.2 0.3 61 Blue grass species 1.1 0.1 5.0 < 0.1 0.2 0.2 0.3 62 Scouring-rush 1.0 0.1 5.0 < 0.1 0.2 0.2 0.2 63 Yellow evening-primrose 0.6 0.1 10.0 < 0.1 1.0 1.0 0.2

Field Survey Summary Tables – Soybean in the Aspen Parkland Ecoregion
52
Table 19. 2016 Soybean in the Aspen Parkland Ecoregion (17 fields) Frequency Field Uniformity Field Density (#/m2) Relative
Rank Species (%) All Occurrence All Occurrence High Abundance 1 Canola/rapeseed 77.5 20.0 25.8 1.8 2.3 18.8 65.7 2 Wild buckwheat 76.5 19.0 24.9 1.1 1.4 4.0 53.2 3 Wild oats 29.3 9.1 30.9 1.3 4.4 13.0 35.9 4 Round-leaved mallow 35.5 4.1 11.6 0.4 1.1 3.2 17.9 5 Wheat 29.0 5.9 20.2 0.4 1.2 3.0 17.8 6 Green foxtail 28.2 4.2 14.8 0.2 0.8 1.8 13.9 7 Redroot pigweed 28.3 3.2 11.1 0.1 0.5 1.0 11.5 8 Dandelion 17.8 2.4 13.4 0.1 0.6 1.4 7.9 9 Oats 5.5 3.0 55.0 0.1 2.6 2.6 6.6 10 Yellow foxtail 11.6 2.3 19.5 0.1 0.9 1.6 6.4 11 Kochia 11.1 2.0 17.7 0.1 1.0 1.8 6.1 12 Lamb's-quarters 16.9 1.1 6.6 0.1 0.4 0.6 5.7 13 Black medick 6.0 1.8 30.0 0.1 1.4 1.4 4.5 14 Canada thistle 11.5 1.1 10.0 0.1 0.5 0.6 4.5 15 Biennial wormwood 5.9 1.8 30.0 0.1 1.4 1.4 4.5 16 Night-flowering catchfly 11.5 0.9 7.6 < 0.1 0.3 0.4 3.8 17 Oak-leaved goosefoot 5.9 1.2 20.0 0.1 1.4 1.4 3.8 18 Northern willowherb 11.5 0.8 7.4 < 0.1 0.3 0.4 3.8 19 Barnyard grass species 11.2 0.6 5.0 0.1 0.5 0.6 3.8 20 Barley 6.0 0.6 10.0 < 0.1 0.8 0.8 2.6 21 Thyme-leaved spurge 5.8 0.6 10.0 < 0.1 0.6 0.6 2.4 22 Purslane 6.0 0.6 10.0 < 0.1 0.4 0.4 2.2 23 Clover species 6.0 0.6 10.0 < 0.1 0.4 0.4 2.2 24 False flax species 5.5 0.5 10.0 < 0.1 0.6 0.6 2.2 25 Pennsylvania pellitory 7.7 0.4 5.0 < 0.1 0.2 0.2 2.2 26 Nightshade species 5.6 0.6 10.0 < 0.1 0.4 0.4 2.1 27 Absinth 6.0 0.3 5.0 < 0.1 0.2 0.2 1.7 28 Spiny annual sow-thistle 6.0 0.3 5.0 < 0.1 0.2 0.2 1.7 29 Tumble pigweed 5.8 0.3 5.0 < 0.1 0.2 0.2 1.7 30 Perennial sow-thistle 5.5 0.3 5.0 < 0.1 0.2 0.2 1.6

Field Survey Summary Tables – Corn in the Aspen Parkland Ecoregion
53
Table 20. 2016 Corn in the Aspen Parkland Ecoregion (11 fields) Frequency Field Uniformity Field Density (#/m2) Relative
Rank Species (%) All Occurrence All Occurrence High Abundance 1 Barnyard grass species 72.6 41.1 56.6 9.9 13.6 80.0 50.7 2 Wild buckwheat 90.2 33.1 36.7 2.6 2.8 6.8 32.1 3 Lamb's-quarters 45.6 24.1 52.8 5.3 11.6 43.0 29.0 4 Green foxtail 9.4 9.4 100.0 6.9 74.0 74.0 22.1 5 Canola/rapeseed 54.2 21.1 39.0 2.0 3.7 10.2 20.9 6 Pale smartweed 27.0 12.1 44.9 2.2 8.3 23.2 14.1 7 Round-leaved mallow 53.3 10.9 20.4 0.9 1.6 7.0 13.9 8 Redroot pigweed 27.1 10.8 39.6 2.0 7.2 16.6 12.9 9 Spiny annual sow-thistle 19.0 8.6 45.3 0.8 4.5 5.8 8.2 10 Perennial sow-thistle 18.6 7.8 42.1 0.7 3.8 7.4 7.4 11 Purslane 27.7 5.1 18.5 0.3 1.1 2.6 6.7 12 Stinkweed 8.9 3.5 40.0 1.4 15.6 15.6 6.1 13 Yellow foxtail 18.3 6.0 32.7 0.4 2.4 3.0 6.0 14 Rough cinquefoil 8.9 5.3 60.0 0.8 9.2 9.2 5.4 15 Yellow sweet-clover 18.6 4.2 22.4 0.4 2.1 3.0 5.2 16 Black medick 9.4 6.1 65.0 0.5 5.6 5.6 5.0 17 Dock species 8.9 6.2 70.0 0.5 5.8 5.8 5.0 18 Field horsetail 9.4 2.8 30.0 0.8 8.2 8.2 4.3 19 Canada thistle 17.5 3.1 17.7 0.2 1.3 2.4 4.3 20 False cleavers 9.2 5.1 55.0 0.4 4.0 4.0 4.2 21 Golden dock 9.8 5.4 55.0 0.2 2.2 2.2 4.1 22 American dragonhead 18.3 2.3 12.7 0.1 0.7 1.2 3.8 23 Broad-leaved plantain 18.3 1.4 7.6 0.1 0.6 0.8 3.4 24 Green pigweed 9.2 3.7 40.0 0.3 2.8 2.8 3.4 25 Common groundsel 9.4 2.8 30.0 0.2 1.8 1.8 2.9 26 Alfalfa 8.6 2.2 25.0 0.1 1.6 1.6 2.4 27 Nightshade species 9.4 1.9 20.0 0.1 0.8 0.8 2.2 28 Dandelion 8.9 1.8 20.0 0.1 0.8 0.8 2.1 29 Clover species 8.6 1.7 20.0 0.1 1.0 1.0 2.1 30 Night-flowering catchfly 8.9 1.3 15.0 0.1 1.4 1.4 2.1 31 Scouring-rush 9.4 0.5 5.0 0.1 1.2 1.2 1.8 32 Wormseed mustard 8.9 0.9 10.0 0.1 0.6 0.6 1.7 33 Prostrate pigweed 8.9 0.9 10.0 < 0.1 0.4 0.4 1.7 34 Maple-leaved goosefoot 9.4 0.5 5.0 < 0.1 0.2 0.2 1.6 35 Narrow-leaved hawk's-beard 8.9 0.4 5.0 < 0.1 0.2 0.2 1.5

Field Survey Summary Tables – Barley in the Aspen Parkland Ecoregion
54
Table 21. 2016 Barley in the Aspen Parkland Ecoregion (22 fields) Frequency Field Uniformity Field Density (#/m2) Relative
Rank Species (%) All Occurrence All Occurrence High Abundance 1 Green foxtail 41.3 20.5 49.8 6.8 16.4 57.8 48.4 2 Wild buckwheat 91.4 28.2 30.8 2.4 2.6 13.8 43.9 3 Wild oats 27.1 11.0 40.5 4.1 15.3 69.6 29.0 4 Canola/rapeseed 34.3 18.5 54.0 2.6 7.7 28.8 28.6 5 Canada thistle 41.5 11.4 27.5 0.9 2.1 8.8 18.0 6 Night-flowering catchfly 23.7 8.5 36.1 0.6 2.6 4.8 12.1 7 Pale smartweed 22.6 6.9 30.5 0.8 3.5 8.0 11.6 8 Spiny annual sow-thistle 21.8 6.1 27.9 0.5 2.4 7.4 9.9 9 Redroot pigweed 24.3 4.7 19.2 0.4 1.6 4.0 8.9 10 Chickweed 5.2 4.7 90.0 1.2 22.8 22.8 8.8 11 Round-leaved mallow 22.0 4.4 19.8 0.2 1.1 2.0 7.7 12 Barnyard grass species 21.2 4.4 20.8 0.3 1.2 2.2 7.7 13 Biennial wormwood 13.3 4.7 35.3 0.4 2.8 6.0 6.8 14 Foxtail barley 17.9 3.5 19.6 0.3 1.8 4.4 6.8 15 Quack grass 5.2 3.7 70.0 0.7 13.4 13.4 6.1 16 Thyme-leaved spurge 10.1 2.4 24.2 0.2 2.4 3.2 4.3 17 Wheat 12.9 2.4 18.3 0.1 1.0 1.4 4.3 18 Wild mustard 13.2 2.0 15.4 0.1 0.8 1.4 4.1 19 Lamb's-quarters 8.6 2.5 29.7 0.2 2.0 3.4 3.8 20 Dandelion 8.6 2.2 25.7 0.1 1.6 2.6 3.5 21 Perennial sow-thistle 11.0 1.6 14.8 0.1 0.8 1.0 3.3 22 Shepherd's-purse 8.8 2.0 22.7 0.1 0.9 1.4 3.2 23 Kochia 8.6 1.3 14.7 0.2 1.9 3.6 3.0 24 White mustard 5.7 1.4 25.0 0.1 1.4 1.4 2.2 25 False cleavers 4.4 1.5 35.0 0.1 1.8 1.8 2.0 26 Oak-leaved goosefoot 4.4 1.3 30.0 0.1 1.8 1.8 2.0 27 Hemp-nettle 5.7 0.9 15.0 < 0.1 0.8 0.8 1.8 28 Broad-leaved plantain 5.7 0.9 15.0 < 0.1 0.8 0.8 1.8 29 Stinkweed 4.1 0.8 20.0 0.1 2.2 2.2 1.6 30 Yellow foxtail 4.5 0.2 5.0 < 0.1 0.2 0.2 1.0 31 Stink grass 4.5 0.2 5.0 < 0.1 0.2 0.2 1.0 32 Black medick 4.5 0.2 5.0 < 0.1 0.2 0.2 1.0 33 Dock species 4.4 0.2 5.0 < 0.1 0.2 0.2 1.0 34 Manitoba maple 4.2 0.2 5.0 < 0.1 0.2 0.2 0.9

Field Survey Summary Tables – Flax in the Aspen Parkland Ecoregion
55
Table 22. 2016 Flax in the Aspen Parkland Ecoregion (13 fields) Frequency Field Uniformity Field Density (#/m2) Relative
Rank Species (%) All Occurrence All Occurrence High Abundance 1 False cleavers 40.2 20.2 50.1 3.5 8.6 25.6 35.3 2 Wild buckwheat 69.3 20.7 29.9 1.8 2.5 7.2 30.5 3 Green foxtail 39.2 17.8 45.5 2.6 6.7 14.4 29.4 4 Round-leaved mallow 47.3 12.7 26.8 1.6 3.5 9.8 22.5 5 Wheat 52.2 12.3 23.6 0.6 1.2 2.4 17.4 6 Canola/rapeseed 45.2 12.0 26.7 0.7 1.6 3.1 16.7 7 Shepherd's-purse 32.2 10.7 33.2 1.1 3.5 11.6 16.4 8 Green pigweed 14.9 9.5 63.8 1.3 8.8 15.2 14.3 9 Redroot pigweed 29.3 6.2 21.2 0.8 2.7 6.6 11.8 10 Pale smartweed 32.4 7.6 23.5 0.4 1.3 2.4 10.9 11 Wild oats 37.6 5.3 14.0 0.3 0.7 2.0 9.6 12 Canada thistle 30.7 5.1 16.4 0.3 0.9 1.2 8.7 13 Night-flowering catchfly 24.6 4.8 19.6 0.3 1.3 1.8 7.8 14 Perennial sow-thistle 15.7 5.4 34.7 0.3 1.9 2.8 6.7 15 Chickweed 15.1 4.2 27.5 0.4 2.5 4.0 6.4 16 Rye 8.1 4.9 60.0 0.4 4.6 4.6 5.8 17 Spiny annual sow-thistle 14.9 3.4 22.8 0.3 2.0 3.8 5.6 18 Alfalfa 15.9 3.6 22.5 0.2 1.2 1.2 5.2 19 Foxtail barley 22.7 2.3 10.0 0.1 0.4 0.6 5.0 20 Hemp-nettle 14.9 2.6 17.3 0.2 1.3 2.4 4.5 21 Thyme-leaved spurge 14.9 2.2 14.5 0.2 1.4 1.6 4.4 22 Stinkweed 9.9 3.0 30.0 0.2 1.6 1.6 3.9 23 Broad-leaved plantain 7.6 1.9 25.0 0.2 2.8 2.8 3.2 24 Yellow foxtail 7.8 1.9 25.0 0.2 2.2 2.2 3.1 25 Clover species 8.1 2.4 30.0 0.1 1.2 1.2 3.0 26 Dandelion 7.6 1.9 25.0 0.1 1.4 1.4 2.7 27 Kochia 7.6 1.5 20.0 0.1 0.8 0.8 2.2 28 Quack grass 7.1 1.1 15.0 0.1 1.4 1.4 2.1 29 Showy milkweed 7.8 0.8 10.0 < 0.1 0.4 0.4 1.7 30 Lamb's-quarters 7.6 0.8 10.0 < 0.1 0.4 0.4 1.7 31 American dragonhead 7.8 0.4 5.0 < 0.1 0.4 0.4 1.5

Field Survey Summary Tables – Southwest Manitoba Uplands Ecoregion
56
Table 23. 2016 Annual crops in the Southwest Manitoba Uplands Ecoregion (17 fields) Frequency Field Uniformity Field Density (#/m2) Relative
Rank Species (%) All Occurrence All Occurrence High Abundance 1 Wild mustard 6.9 6.9 100.0 6.1 89.4 89.4 35.8 2 Chickweed 43.2 13.8 32.1 1.7 4.0 23.0 29.1 3 Green foxtail 22.5 9.8 43.5 3.2 14.4 40.4 28.2 4 Wild buckwheat 48.7 13.3 27.4 1.1 2.4 8.6 27.1 5 Barnyard grass species 22.4 9.2 41.2 1.4 6.3 15.0 19.2 6 Redroot pigweed 21.3 9.2 43.2 1.3 6.3 9.6 18.6 7 Canada thistle 31.1 6.1 19.7 1.2 4.0 17.2 17.6 8 Pale smartweed 20.7 6.9 33.1 1.5 7.2 20.0 17.1 9 Canola/rapeseed 20.1 5.4 27.0 0.5 2.6 13.4 11.4 10 Wheat 26.7 3.9 14.7 0.4 1.5 10.4 10.9 11 Stinkweed 6.9 5.1 75.0 0.9 13.6 13.6 10.2 12 Dandelion 29.1 3.1 10.8 0.2 0.6 1.2 9.7 13 Round-leaved mallow 25.1 3.0 11.9 0.2 0.6 3.8 8.6 14 Lamb's-quarters 15.9 2.9 17.9 0.3 1.8 3.8 7.2 15 Wild oats 14.4 3.2 22.5 0.2 1.4 1.6 6.8 16 Yellow foxtail 6.9 2.7 40.0 0.4 5.8 5.8 5.7 17 Night-flowering catchfly 8.5 1.8 21.6 0.2 2.1 2.6 4.2 18 Shepherd's-purse 14.1 1.0 7.4 0.1 0.4 0.6 4.2 19 Spiny annual sow-thistle 14.1 1.0 7.4 < 0.1 0.3 0.4 4.1 20 Thyme-leaved spurge 6.9 1.7 25.0 0.2 2.6 2.6 3.8 21 Spear-leaved goosefoot 6.9 1.7 25.0 0.1 1.4 1.4 3.4 22 Perennial sow-thistle 10.7 0.9 8.5 < 0.1 0.4 1.4 3.3 23 Hemp-nettle 7.2 1.1 15.0 < 0.1 0.6 0.6 2.7 24 Stork's bill 7.2 0.7 10.0 0.1 1.2 1.2 2.6 25 False ragweed 9.1 0.5 5.0 < 0.1 0.2 0.2 2.4 26 Prickly lettuce 7.2 0.4 5.0 0.1 0.8 0.8 2.1 27 Absinth 7.2 0.4 5.0 < 0.1 0.2 0.2 1.9 28 Kochia 6.9 0.3 5.0 < 0.1 0.2 0.2 1.8 29 American dragonhead 1.9 0.1 5.0 < 0.1 0.2 0.2 0.5

Field Survey Summary Tables – Lake Manitoba Plain Ecoregion
57
Table 24. 2016 Annual crops in the Lake Manitoba Plain Ecoregion (255 fields) Frequency Field Uniformity Field Density (#/m2) Relative
Rank Species (%) All Occurrence All Occurrence High Abundance 1 Green foxtail 18.8 7.5 39.7 3.6 19.4 163.4 36.6 2 Wild buckwheat 44.5 10.4 23.4 0.8 1.8 13.4 26.7 3 Yellow foxtail 15.6 5.2 33.3 1.6 10.3 82.8 19.9 4 Barnyard grass species 25.6 5.8 22.7 1.0 3.7 40.4 18.4 5 Canola/rapeseed 23.1 7.0 30.3 0.8 3.5 35.6 18.1 6 Redroot pigweed 29.2 6.8 23.3 0.6 2.1 14.4 18.0 7 Dandelion 26.4 5.5 20.9 0.8 3.0 84.2 17.1 8 Pale smartweed 23.3 4.1 17.5 0.5 2.1 24.8 12.9 9 Wheat 15.5 4.3 27.8 0.6 3.6 39.4 11.9 10 Wild oats 13.8 3.4 24.9 0.6 4.0 40.4 10.5 11 Lamb's-quarters 15.1 3.0 19.9 0.3 2.2 17.8 8.9 12 Broad-leaved plantain 8.6 2.5 28.6 0.6 6.8 57.4 8.5 13 Round-leaved mallow 14.7 2.8 19.1 0.3 1.9 17.4 8.2 14 Biennial wormwood 12.5 2.4 19.6 0.2 1.8 22.8 6.9 15 Canada thistle 13.9 1.7 12.4 0.2 1.1 4.8 6.0 16 Perennial sow-thistle 8.9 1.9 20.9 0.2 1.8 6.8 5.1 17 Purslane 6.4 1.5 24.0 0.1 1.8 8.4 3.9 18 Oak-leaved goosefoot 7.7 0.9 12.1 0.1 1.8 16.2 3.7 19 Spiny annual sow-thistle 6.7 1.3 19.9 0.1 1.2 5.4 3.5 20 Dock species 5.6 0.9 16.2 0.1 2.1 8.0 3.0 21 Thyme-leaved spurge 7.0 0.9 12.9 0.1 0.8 3.0 2.9 22 Golden dock 4.1 1.0 24.9 0.1 3.0 11.8 2.8 23 Wild mustard 4.4 0.9 20.6 0.1 2.7 16.2 2.8 24 Black medick 4.5 1.0 23.0 0.1 2.1 6.0 2.7 25 Night-flowering catchfly 3.5 0.9 25.5 0.1 3.1 11.6 2.5 26 Northern willowherb 4.3 0.6 15.1 0.1 2.5 15.8 2.4 27 Foxtail barley 4.7 0.6 13.3 0.1 1.5 6.4 2.2 28 Witch grass 1.0 0.2 21.6 0.2 24.4 41.8 2.0 29 Marsh yellow cress 4.0 0.7 17.8 < 0.1 1.2 3.6 2.0 30 Tumble pigweed 3.8 0.6 16.6 < 0.1 1.0 1.8 1.8 31 Field horsetail 2.8 0.3 12.5 0.1 3.9 8.0 1.7 32 Quack grass 0.3 0.2 80.0 0.2 68.6 68.6 1.6 33 Rough cinquefoil 2.7 0.5 19.4 < 0.1 1.5 3.0 1.5 34 Yellow sweet-clover 3.4 0.3 8.4 < 0.1 0.4 2.0 1.2 35 Maple-leaved goosefoot 3.4 0.2 7.2 < 0.1 0.5 1.0 1.2 36 Willow species 3.1 0.3 8.4 < 0.1 0.7 2.8 1.1 37 Prostrate knotweed 1.7 0.2 13.8 < 0.1 1.4 3.4 0.8 38 Clover species 1.4 0.3 19.2 < 0.1 1.5 4.0 0.8 39 Tartary buckwheat 0.7 0.3 44.4 < 0.1 4.2 10.2 0.7 40 Dog mustard 1.0 0.3 32.1 < 0.1 1.8 3.0 0.7 41 Alfalfa 1.8 0.2 10.8 < 0.1 0.5 0.8 0.7 42 Stink grass 0.9 0.3 30.9 < 0.1 2.1 3.2 0.7 43 Soybean 2.1 0.1 5.9 < 0.1 0.2 0.4 0.7 44 Kochia 1.9 0.2 8.2 < 0.1 0.3 0.4 0.6 45 Common pepper-grass 0.3 0.2 55.0 0.1 18.0 18.0 0.6 46 Canada fleabane 1.2 0.2 19.9 < 0.1 1.1 2.0 0.6 47 Chickweed 1.4 0.2 11.6 < 0.1 0.9 2.2 0.6 48 Purslane speedwell 0.8 0.1 18.4 < 0.1 4.1 10.4 0.5 49 Narrow-leaved hawk's-beard 1.2 0.2 14.9 < 0.1 0.9 1.4 0.5 50 American dragonhead 1.5 0.1 10.0 < 0.1 0.4 0.6 0.5 51 Showy milkweed 1.4 0.1 8.5 < 0.1 0.7 1.0 0.5 52 Cocklebur 0.8 0.2 24.1 < 0.1 1.9 3.8 0.5
(Table continued on next page)

Field Survey Summary Tables – Lake Manitoba Plain Ecoregion
58
Table 24. 2016 Annual crops in the Lake Manitoba Plain Ecoregion (255 fields) (continued) Frequency Field Uniformity Field Density (#/m2) Relative
Rank Species (%) All Occurrence All Occurrence High Abundance 53 Absinth 0.3 0.1 45.0 < 0.1 17.6 17.6 0.5 54 Bicknell's geranium 0.9 0.2 20.6 < 0.1 1.0 1.6 0.5 55 Manitoba maple 1.5 0.1 6.3 < 0.1 0.4 0.6 0.5 56 Leafy spurge 0.4 0.2 50.0 < 0.1 4.4 4.4 0.5 57 False cleavers 0.5 0.2 40.0 < 0.1 2.8 2.8 0.4 58 American vetch 1.3 0.1 5.0 < 0.1 0.3 0.4 0.4 59 Bird's-foot trefoil 0.8 0.1 14.8 < 0.1 1.1 1.4 0.4 60 Flodman's thistle 0.7 0.1 16.0 < 0.1 1.4 2.0 0.4 61 Stinkweed 0.9 0.1 12.8 < 0.1 0.6 0.6 0.4 62 Siberian elm 1.0 0.1 7.6 < 0.1 0.5 1.2 0.3 63 Perennial rye grass 0.4 0.1 40.0 < 0.1 3.8 3.8 0.3 64 Oats 0.9 0.1 9.2 < 0.1 0.5 0.8 0.3 65 Common yellow wood-sorrel 0.4 0.1 20.0 < 0.1 3.6 3.6 0.3 66 Scouring-rush 0.9 < 0.1 5.0 < 0.1 0.4 0.6 0.3 67 Shepherd's-purse 0.7 0.1 8.1 < 0.1 0.7 1.0 0.3 68 Barley 0.4 0.1 20.0 < 0.1 2.0 2.0 0.3 69 Needle-and-thread grass 0.5 0.1 20.0 < 0.1 1.6 1.6 0.3 70 Prostrate pigweed 0.8 < 0.1 5.0 < 0.1 0.2 0.2 0.2 71 Stork's bill 0.6 0.1 15.0 < 0.1 0.8 0.8 0.2 72 Clammy hedge-hyssop 0.7 < 0.1 5.0 < 0.1 0.8 1.2 0.2 73 Aster species 0.5 0.1 14.0 < 0.1 1.0 1.2 0.2 74 Hemp-nettle 0.5 < 0.1 10.0 < 0.1 2.0 2.0 0.2 75 Silverweed 0.6 < 0.1 5.0 < 0.1 1.2 1.2 0.2 76 Green pigweed 0.3 0.1 25.0 < 0.1 1.8 1.8 0.2 77 Bur oak 0.4 0.1 15.0 < 0.1 0.6 0.6 0.2 78 Rayless aster 0.6 < 0.1 5.0 < 0.1 0.2 0.2 0.2 79 Currant species 0.6 < 0.1 5.0 < 0.1 0.2 0.2 0.2 80 Goldenrod species 0.4 < 0.1 10.0 < 0.1 0.4 0.4 0.2 81 Rush species 0.4 < 0.1 10.0 < 0.1 0.4 0.4 0.2 82 Beggarticks species 0.4 < 0.1 10.0 < 0.1 0.4 0.4 0.2 83 Field bean 0.5 < 0.1 5.0 < 0.1 0.2 0.2 0.1 84 Hedge bindweed 0.5 < 0.1 5.0 < 0.1 0.2 0.2 0.1 85 Large crab grass 0.3 < 0.1 15.0 < 0.1 0.8 0.8 0.1 86 Flixweed 0.4 < 0.1 5.0 < 0.1 0.2 0.2 0.1 87 Povertyweed 0.4 < 0.1 5.0 < 0.1 0.2 0.2 0.1 88 Buffalograss 0.4 < 0.1 5.0 < 0.1 0.2 0.2 0.1 89 Common ragweed 0.3 < 0.1 8.4 < 0.1 0.3 0.4 0.1 90 Yellow toadflax 0.4 < 0.1 5.0 < 0.1 0.2 0.2 0.1 91 Sunflower 0.2 < 0.1 10.0 < 0.1 0.4 0.4 0.1 92 Water smartweed 0.3 < 0.1 5.0 < 0.1 0.2 0.2 0.1
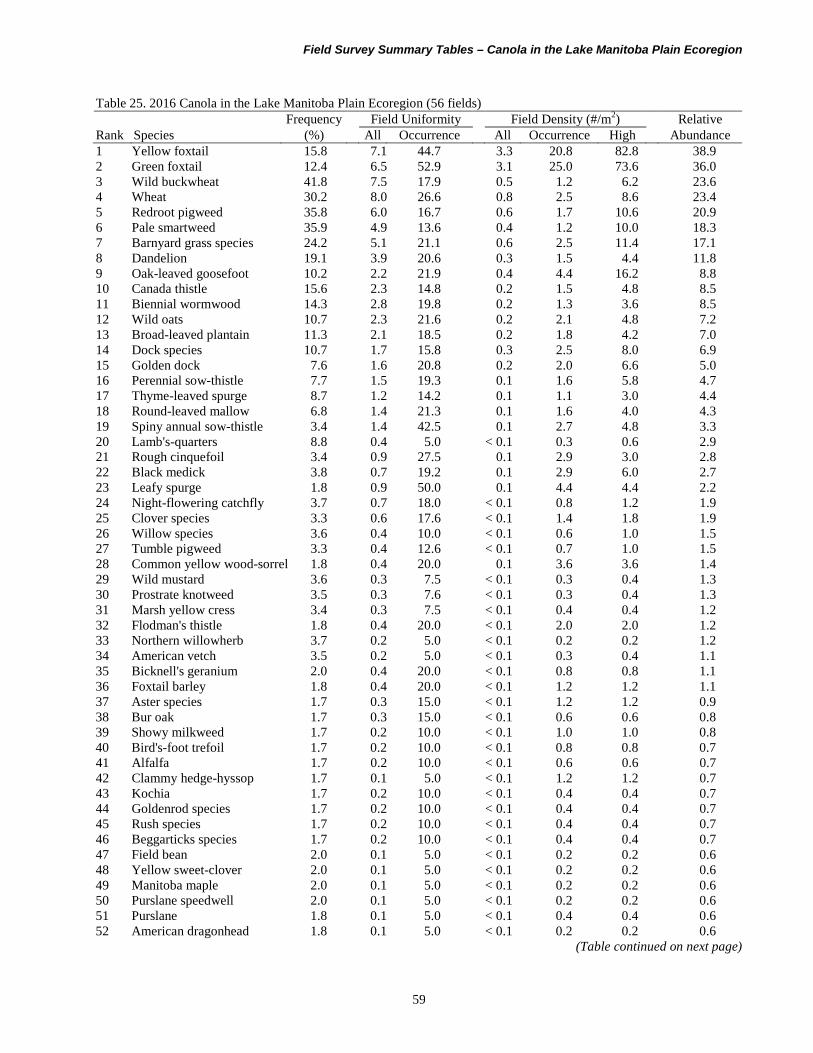
Field Survey Summary Tables – Canola in the Lake Manitoba Plain Ecoregion
59
Table 25. 2016 Canola in the Lake Manitoba Plain Ecoregion (56 fields) Frequency Field Uniformity Field Density (#/m2) Relative
Rank Species (%) All Occurrence All Occurrence High Abundance 1 Yellow foxtail 15.8 7.1 44.7 3.3 20.8 82.8 38.9 2 Green foxtail 12.4 6.5 52.9 3.1 25.0 73.6 36.0 3 Wild buckwheat 41.8 7.5 17.9 0.5 1.2 6.2 23.6 4 Wheat 30.2 8.0 26.6 0.8 2.5 8.6 23.4 5 Redroot pigweed 35.8 6.0 16.7 0.6 1.7 10.6 20.9 6 Pale smartweed 35.9 4.9 13.6 0.4 1.2 10.0 18.3 7 Barnyard grass species 24.2 5.1 21.1 0.6 2.5 11.4 17.1 8 Dandelion 19.1 3.9 20.6 0.3 1.5 4.4 11.8 9 Oak-leaved goosefoot 10.2 2.2 21.9 0.4 4.4 16.2 8.8 10 Canada thistle 15.6 2.3 14.8 0.2 1.5 4.8 8.5 11 Biennial wormwood 14.3 2.8 19.8 0.2 1.3 3.6 8.5 12 Wild oats 10.7 2.3 21.6 0.2 2.1 4.8 7.2 13 Broad-leaved plantain 11.3 2.1 18.5 0.2 1.8 4.2 7.0 14 Dock species 10.7 1.7 15.8 0.3 2.5 8.0 6.9 15 Golden dock 7.6 1.6 20.8 0.2 2.0 6.6 5.0 16 Perennial sow-thistle 7.7 1.5 19.3 0.1 1.6 5.8 4.7 17 Thyme-leaved spurge 8.7 1.2 14.2 0.1 1.1 3.0 4.4 18 Round-leaved mallow 6.8 1.4 21.3 0.1 1.6 4.0 4.3 19 Spiny annual sow-thistle 3.4 1.4 42.5 0.1 2.7 4.8 3.3 20 Lamb's-quarters 8.8 0.4 5.0 < 0.1 0.3 0.6 2.9 21 Rough cinquefoil 3.4 0.9 27.5 0.1 2.9 3.0 2.8 22 Black medick 3.8 0.7 19.2 0.1 2.9 6.0 2.7 23 Leafy spurge 1.8 0.9 50.0 0.1 4.4 4.4 2.2 24 Night-flowering catchfly 3.7 0.7 18.0 < 0.1 0.8 1.2 1.9 25 Clover species 3.3 0.6 17.6 < 0.1 1.4 1.8 1.9 26 Willow species 3.6 0.4 10.0 < 0.1 0.6 1.0 1.5 27 Tumble pigweed 3.3 0.4 12.6 < 0.1 0.7 1.0 1.5 28 Common yellow wood-sorrel 1.8 0.4 20.0 0.1 3.6 3.6 1.4 29 Wild mustard 3.6 0.3 7.5 < 0.1 0.3 0.4 1.3 30 Prostrate knotweed 3.5 0.3 7.6 < 0.1 0.3 0.4 1.3 31 Marsh yellow cress 3.4 0.3 7.5 < 0.1 0.4 0.4 1.2 32 Flodman's thistle 1.8 0.4 20.0 < 0.1 2.0 2.0 1.2 33 Northern willowherb 3.7 0.2 5.0 < 0.1 0.2 0.2 1.2 34 American vetch 3.5 0.2 5.0 < 0.1 0.3 0.4 1.1 35 Bicknell's geranium 2.0 0.4 20.0 < 0.1 0.8 0.8 1.1 36 Foxtail barley 1.8 0.4 20.0 < 0.1 1.2 1.2 1.1 37 Aster species 1.7 0.3 15.0 < 0.1 1.2 1.2 0.9 38 Bur oak 1.7 0.3 15.0 < 0.1 0.6 0.6 0.8 39 Showy milkweed 1.7 0.2 10.0 < 0.1 1.0 1.0 0.8 40 Bird's-foot trefoil 1.7 0.2 10.0 < 0.1 0.8 0.8 0.7 41 Alfalfa 1.7 0.2 10.0 < 0.1 0.6 0.6 0.7 42 Clammy hedge-hyssop 1.7 0.1 5.0 < 0.1 1.2 1.2 0.7 43 Kochia 1.7 0.2 10.0 < 0.1 0.4 0.4 0.7 44 Goldenrod species 1.7 0.2 10.0 < 0.1 0.4 0.4 0.7 45 Rush species 1.7 0.2 10.0 < 0.1 0.4 0.4 0.7 46 Beggarticks species 1.7 0.2 10.0 < 0.1 0.4 0.4 0.7 47 Field bean 2.0 0.1 5.0 < 0.1 0.2 0.2 0.6 48 Yellow sweet-clover 2.0 0.1 5.0 < 0.1 0.2 0.2 0.6 49 Manitoba maple 2.0 0.1 5.0 < 0.1 0.2 0.2 0.6 50 Purslane speedwell 2.0 0.1 5.0 < 0.1 0.2 0.2 0.6 51 Purslane 1.8 0.1 5.0 < 0.1 0.4 0.4 0.6 52 American dragonhead 1.8 0.1 5.0 < 0.1 0.2 0.2 0.6
(Table continued on next page)

Field Survey Summary Tables – Canola in the Lake Manitoba Plain Ecoregion
60
Table 25. 2016 Canola in the Lake Manitoba Plain Ecoregion (56 fields) (continued) Frequency Field Uniformity Field Density (#/m2) Relative
Rank Species (%) All Occurrence All Occurrence High Abundance 53 Flixweed 1.8 0.1 5.0 < 0.1 0.2 0.2 0.6 54 Cocklebur 1.7 0.1 5.0 < 0.1 0.2 0.2 0.5 55 Oats 1.7 0.1 5.0 < 0.1 0.2 0.2 0.5 56 Soybean 1.7 0.1 5.0 < 0.1 0.2 0.2 0.5

Field Survey Summary Tables – Spring Wheat in the Lake Manitoba Plain Ecoregion
61
Table 26. 2016 Spring wheat in the Lake Manitoba Plain Ecoregion (63 fields) Frequency Field Uniformity Field Density (#/m2) Relative
Rank Species (%) All Occurrence All Occurrence High Abundance 1 Green foxtail 26.0 7.6 29.1 4.3 16.6 163.4 51.3 2 Dandelion 31.6 7.1 22.5 2.0 6.2 84.2 34.6 3 Wild buckwheat 41.7 7.5 18.0 0.5 1.3 6.4 27.2 4 Wild oats 17.9 4.1 23.0 1.0 5.4 40.4 18.5 5 Barnyard grass species 13.8 4.2 30.0 1.0 7.0 29.2 17.5 6 Redroot pigweed 19.3 4.8 25.0 0.4 2.2 7.0 16.0 7 Yellow foxtail 6.5 2.9 45.1 1.2 17.9 64.0 15.0 8 Lamb's-quarters 18.5 3.2 17.3 0.4 2.4 16.4 13.5 9 Canola/rapeseed 16.0 4.0 24.8 0.3 2.1 7.0 13.1 10 Pale smartweed 11.1 2.8 25.5 0.3 2.3 6.8 9.4 11 Canada thistle 17.0 1.8 10.8 0.2 1.1 2.8 9.1 12 Perennial sow-thistle 11.9 1.7 14.1 0.2 1.3 2.8 7.1 13 Round-leaved mallow 8.9 1.6 17.9 0.2 2.7 14.2 6.8 14 Foxtail barley 11.0 1.4 12.3 0.2 1.9 6.4 6.8 15 Night-flowering catchfly 6.9 1.3 19.1 0.2 3.1 11.6 5.6 16 Dock species 7.0 1.4 20.6 0.2 2.3 4.4 5.4 17 Biennial wormwood 7.8 1.4 18.4 0.1 1.0 2.0 5.0 18 Spiny annual sow-thistle 6.2 1.2 18.9 0.1 1.4 2.8 4.2 19 Tumble pigweed 6.6 0.8 12.8 0.1 0.9 1.8 3.6 20 Wild mustard 4.8 0.7 14.9 < 0.1 0.7 1.0 2.7 21 Black medick 3.2 0.8 23.8 0.1 1.7 2.4 2.5 22 Wheat 3.1 0.8 25.0 < 0.1 1.5 1.6 2.4 23 Chickweed 3.2 0.5 16.0 < 0.1 1.3 2.2 2.0 24 False cleavers 1.8 0.7 40.0 < 0.1 2.8 2.8 1.9 25 Thyme-leaved spurge 3.2 0.6 17.9 < 0.1 0.8 1.4 1.9 26 Soybean 4.6 0.3 6.7 < 0.1 0.3 0.4 1.9 27 Oak-leaved goosefoot 3.6 0.2 5.0 < 0.1 0.5 0.6 1.4 28 Maple-leaved goosefoot 3.6 0.2 5.0 < 0.1 0.2 0.2 1.4 29 Golden dock 1.8 0.3 15.0 < 0.1 2.2 2.2 1.2 30 Broad-leaved plantain 1.8 0.4 20.0 < 0.1 1.2 1.2 1.2 31 Hemp-nettle 1.8 0.2 10.0 < 0.1 2.0 2.0 1.1 32 Alfalfa 1.8 0.2 10.0 < 0.1 0.4 0.4 0.9 33 Dog mustard 1.8 0.2 10.0 < 0.1 0.4 0.4 0.8 34 Scouring-rush 1.8 0.1 5.0 < 0.1 0.6 0.6 0.7 35 Willow species 1.4 0.1 10.0 < 0.1 0.6 0.6 0.7 36 Hedge bindweed 1.8 0.1 5.0 < 0.1 0.2 0.2 0.7 37 Rayless aster 1.8 0.1 5.0 < 0.1 0.2 0.2 0.7 38 Yellow sweet-clover 1.8 0.1 5.0 < 0.1 0.2 0.2 0.7 39 Showy milkweed 1.6 0.1 5.0 < 0.1 0.6 0.6 0.7 40 Siberian elm 1.6 0.1 5.0 < 0.1 0.2 0.2 0.6 41 American vetch 1.5 0.1 5.0 < 0.1 0.2 0.2 0.6 42 Field horsetail 1.4 0.1 5.0 < 0.1 0.4 0.4 0.6 43 Yellow toadflax 1.4 0.1 5.0 < 0.1 0.2 0.2 0.5 44 Prostrate pigweed 1.4 0.1 5.0 < 0.1 0.2 0.2 0.5

Field Survey Summary Tables – Soybean in the Lake Manitoba Plain Ecoregion
62
Table 27. 2016 Soybean in the Lake Manitoba Plain Ecoregion (78 fields) Frequency Field Uniformity Field Density (#/m2) Relative
Rank Species (%) All Occurrence All Occurrence High Abundance 1 Canola/rapeseed 41.9 12.7 30.4 1.5 3.7 30.6 43.4 2 Wild buckwheat 47.0 9.9 21.0 0.7 1.4 8.8 30.8 3 Redroot pigweed 30.2 8.7 28.8 0.7 2.2 14.4 25.5 4 Barnyard grass species 27.3 5.1 18.6 0.5 1.8 19.4 18.3 5 Yellow foxtail 17.9 4.0 22.3 0.7 4.1 42.6 17.7 6 Green foxtail 13.6 3.8 28.0 0.8 5.9 37.0 17.2 7 Dandelion 26.3 5.2 19.7 0.4 1.4 8.2 16.8 8 Biennial wormwood 16.5 3.2 19.5 0.4 2.5 22.8 12.5 9 Wheat 16.3 4.0 24.4 0.3 1.8 4.8 12.1 10 Wild oats 12.2 2.7 22.4 0.5 3.8 23.6 11.6 11 Round-leaved mallow 16.7 2.2 13.3 0.2 1.1 5.8 8.8 12 Broad-leaved plantain 6.9 2.3 33.1 0.3 4.8 15.2 8.2 13 Lamb's-quarters 11.8 2.7 22.5 0.2 1.3 2.8 7.8 14 Pale smartweed 17.1 1.3 7.8 0.1 0.4 1.8 6.6 15 Golden dock 4.8 1.6 33.9 0.2 4.9 11.8 5.8 16 Spiny annual sow-thistle 8.2 1.3 15.7 0.1 0.8 1.6 4.3 17 Marsh yellow cress 7.3 1.2 16.8 0.1 1.1 1.8 4.1 18 Black medick 4.6 1.3 28.6 0.1 2.6 4.4 4.1 19 Field horsetail 4.9 0.5 11.0 0.2 3.2 7.4 3.7 20 Purslane 7.3 0.8 10.6 < 0.1 0.4 0.8 3.0 21 Perennial sow-thistle 4.2 0.9 21.0 0.1 1.9 3.6 3.0 22 Northern willowherb 7.0 0.6 9.0 < 0.1 0.5 1.0 2.8 23 Oak-leaved goosefoot 6.1 0.6 9.9 < 0.1 0.6 1.2 2.6 24 Canada thistle 5.1 0.7 14.2 < 0.1 0.8 1.4 2.5 25 Thyme-leaved spurge 6.1 0.4 7.1 < 0.1 0.3 0.4 2.2 26 Yellow sweet-clover 5.5 0.5 9.3 < 0.1 0.4 0.8 2.2 27 Willow species 5.0 0.4 7.3 < 0.1 0.8 2.8 2.1 28 Maple-leaved goosefoot 5.2 0.4 6.8 < 0.1 0.7 1.0 2.1 29 Rough cinquefoil 2.9 0.4 15.0 < 0.1 1.0 1.0 1.5 30 Cocklebur 1.2 0.5 45.0 < 0.1 3.8 3.8 1.5 31 Dock species 3.4 0.3 9.5 < 0.1 0.7 1.2 1.5 32 Narrow-leaved hawk's-beard 2.7 0.4 12.9 < 0.1 0.9 1.4 1.4 33 Perennial rye grass 1.1 0.5 40.0 < 0.1 3.8 3.8 1.3 34 Barley 1.4 0.3 20.0 < 0.1 2.0 2.0 1.0 35 Tumble pigweed 1.4 0.4 25.0 < 0.1 1.2 1.2 1.0 36 Needle-and-thread grass 1.4 0.3 20.0 < 0.1 1.6 1.6 1.0 37 Bird's-foot trefoil 1.2 0.2 20.0 < 0.1 1.4 1.4 0.8 38 Stork's bill 1.4 0.2 15.0 < 0.1 0.8 0.8 0.7 39 Shepherd's-purse 1.4 0.1 10.0 < 0.1 1.0 1.0 0.7 40 Oats 1.2 0.2 15.0 < 0.1 0.8 0.8 0.6 41 Canada fleabane 1.9 0.1 5.0 < 0.1 0.2 0.2 0.6 42 Witch grass 1.3 0.1 10.0 < 0.1 0.6 0.6 0.6 43 Stinkweed 1.2 0.1 10.0 < 0.1 0.6 0.6 0.5 44 Manitoba maple 1.2 0.1 10.0 < 0.1 0.4 0.4 0.5 45 Wild mustard 1.4 0.1 5.0 < 0.1 0.2 0.2 0.5 46 Prostrate pigweed 1.4 0.1 5.0 < 0.1 0.2 0.2 0.5 47 Kochia 1.3 0.1 5.0 < 0.1 0.2 0.2 0.4 48 Povertyweed 1.3 0.1 5.0 < 0.1 0.2 0.2 0.4 49 Scouring-rush 1.3 0.1 5.0 < 0.1 0.2 0.2 0.4 50 Buffalograss 1.3 0.1 5.0 < 0.1 0.2 0.2 0.4 51 Clover species 1.2 0.1 5.0 < 0.1 0.2 0.2 0.4

Field Survey Summary Tables – Corn in the Lake Manitoba Plain Ecoregion
63
Table 28. 2016 Corn in the Lake Manitoba Plain Ecoregion (25 fields) Frequency Field Uniformity Field Density (#/m2) Relative
Rank Species (%) All Occurrence All Occurrence High Abundance 1 Canola/rapeseed 38.6 16.2 42.0 2.3 5.9 35.6 37.2 2 Wild buckwheat 50.7 19.5 38.4 1.6 3.1 7.8 36.4 3 Round-leaved mallow 50.5 12.9 25.6 1.4 2.7 17.4 29.8 4 Redroot pigweed 42.9 10.3 24.1 0.7 1.6 4.4 21.1 5 Purslane 31.1 11.2 35.9 0.7 2.2 4.2 19.6 6 Lamb's-quarters 31.3 8.7 27.9 0.7 2.1 6.8 17.7 7 Barnyard grass species 33.9 6.5 19.2 0.7 1.9 7.0 16.4 8 Yellow foxtail 27.3 7.5 27.6 0.6 2.0 4.8 15.1 9 Green foxtail 12.0 5.9 49.0 0.9 7.3 15.6 13.5 10 Dandelion 18.9 5.1 26.8 0.4 1.9 5.0 10.1 11 Common pepper-grass 4.0 2.2 55.0 0.7 18.0 18.0 8.1 12 Stink grass 12.5 3.9 30.9 0.3 2.1 3.2 7.3 13 Wheat 11.5 2.7 23.7 0.3 2.9 5.6 6.8 14 Purslane speedwell 4.0 1.6 40.0 0.4 10.4 10.4 5.2 15 Biennial wormwood 11.1 1.8 15.9 0.1 0.7 1.0 4.0 16 Canada thistle 11.6 1.5 13.3 0.1 0.7 1.6 4.0 17 Broad-leaved plantain 11.8 1.4 11.8 0.1 0.7 1.2 4.0 18 Pale smartweed 11.3 1.5 13.3 0.1 0.7 1.2 3.9 19 Foxtail barley 8.0 1.8 22.5 0.1 1.4 2.2 3.8 20 Marsh yellow cress 4.0 2.2 55.0 0.1 3.6 3.6 3.5 21 Thyme-leaved spurge 11.8 1.0 8.4 < 0.1 0.4 0.8 3.4 22 Field horsetail 4.0 0.6 15.0 0.2 4.2 4.2 2.5 23 Siberian elm 7.5 0.7 9.7 < 0.1 0.7 1.2 2.4 24 Bicknell's geranium 4.5 1.1 25.0 0.1 1.6 1.6 2.2 25 Green pigweed 4.0 1.0 25.0 0.1 1.8 1.8 2.1 26 Kochia 7.5 0.6 7.7 < 0.1 0.3 0.4 2.0 27 Narrow-leaved hawk's-beard 4.5 0.9 20.0 < 0.1 1.0 1.0 1.9 28 Oak-leaved goosefoot 6.8 0.3 5.0 < 0.1 0.2 0.2 1.7 29 Maple-leaved goosefoot 4.0 0.8 20.0 < 0.1 0.8 0.8 1.6 30 Wild mustard 4.0 0.8 20.0 < 0.1 0.8 0.8 1.6 31 Large crab grass 4.0 0.6 15.0 < 0.1 0.8 0.8 1.5 32 Spiny annual sow-thistle 4.0 0.6 15.0 < 0.1 0.8 0.8 1.5 33 Flodman's thistle 4.0 0.4 10.0 < 0.1 0.4 0.4 1.2 34 Tumble pigweed 3.8 0.4 10.0 < 0.1 0.4 0.4 1.1 35 Yellow sweet-clover 4.0 0.2 5.0 < 0.1 0.2 0.2 1.0 36 Clammy hedge-hyssop 4.0 0.2 5.0 < 0.1 0.2 0.2 1.0 37 Shepherd's-purse 3.8 0.2 5.0 < 0.1 0.2 0.2 0.9 38 Alfalfa 3.8 0.2 5.0 < 0.1 0.2 0.2 0.9 39 Common ragweed 3.1 0.3 10.0 < 0.1 0.4 0.4 0.9 40 Sunflower 3.1 0.3 10.0 < 0.1 0.4 0.4 0.9

Field Survey Summary Tables – Oat in the Lake Manitoba Plain Ecoregion
64
Table 29. 2016 Oat in the Lake Manitoba Plain Ecoregion (12 fields) Frequency Field Uniformity Field Density (#/m2) Relative
Rank Species (%) All Occurrence All Occurrence High Abundance 1 Green foxtail 44.9 28.1 62.6 18.6 41.4 93.8 47.5 2 Barnyard grass species 58.9 16.7 28.4 4.8 8.1 40.4 21.8 3 Wild buckwheat 44.4 26.6 60.1 3.1 7.1 13.4 21.4 4 Pale smartweed 60.4 17.3 28.7 3.2 5.3 17.8 19.7 5 Broad-leaved plantain 28.3 13.2 46.7 6.0 21.1 57.4 18.7 6 Wheat 17.5 9.9 56.6 3.8 21.5 39.4 12.4 7 Yellow foxtail 26.1 10.1 38.7 2.8 10.8 28.2 11.9 8 Wild oats 34.8 12.4 35.6 1.3 3.6 9.8 11.4 9 Lamb's-quarters 26.8 8.4 31.2 1.8 6.9 17.8 9.7 10 Perennial sow-thistle 28.3 9.9 35.1 0.8 2.9 6.8 8.9 11 Canola/rapeseed 34.1 8.8 25.8 0.7 2.0 5.0 8.8 12 Witch grass 9.3 2.8 30.0 3.9 41.8 41.8 8.7 13 Wild mustard 18.8 7.6 40.4 1.6 8.7 16.2 8.1 14 Northern willowherb 18.8 6.6 34.9 1.6 8.4 15.8 7.6 15 Redroot pigweed 25.3 5.6 22.3 1.2 4.8 12.0 7.4 16 Canada thistle 33.8 4.3 12.7 0.3 1.0 2.0 6.4 17 Round-leaved mallow 23.6 5.9 25.0 0.4 1.9 4.0 6.0 18 Purslane 18.1 6.1 33.6 0.8 4.4 8.4 6.0 19 Dandelion 25.3 4.8 19.2 0.5 1.9 4.2 5.8 20 Oak-leaved goosefoot 27.3 1.8 6.7 0.1 0.5 1.2 4.3 21 Black medick 18.8 3.8 20.1 0.2 1.2 1.8 4.2 22 Dog mustard 9.5 4.8 50.0 0.3 3.0 3.0 3.6 23 Night-flowering catchfly 9.3 3.7 40.0 0.4 3.8 3.8 3.2 24 Field horsetail 9.3 1.9 20.0 0.7 8.0 8.0 3.1 25 Canada fleabane 9.5 3.3 35.0 0.2 2.0 2.0 2.8 26 Thyme-leaved spurge 9.5 2.9 30.0 0.2 2.4 2.4 2.7 27 Tumble pigweed 9.5 2.9 30.0 0.2 1.8 1.8 2.6 28 Spiny annual sow-thistle 16.6 1.3 7.6 0.1 0.3 0.4 2.6 29 Prostrate knotweed 9.3 2.3 25.0 0.3 3.4 3.4 2.6 30 Rough cinquefoil 9.5 1.9 20.0 0.1 0.8 0.8 2.1 31 Alfalfa 9.5 1.4 15.0 0.1 0.8 0.8 1.9 32 Tartary buckwheat 8.0 1.6 20.0 0.1 1.0 1.0 1.8 33 Showy milkweed 9.5 1.0 10.0 0.1 0.6 0.6 1.6 34 American dragonhead 9.5 1.0 10.0 < 0.1 0.4 0.4 1.6 35 Stinkweed 8.0 1.2 15.0 < 0.1 0.6 0.6 1.5 36 Silverweed 9.3 0.5 5.0 0.1 1.2 1.2 1.5 37 Manitoba maple 9.5 0.5 5.0 0.1 0.6 0.6 1.4 38 Kochia 8.5 0.9 10.0 < 0.1 0.4 0.4 1.4 39 Chickweed 9.3 0.5 5.0 < 0.1 0.4 0.4 1.4 40 Maple-leaved goosefoot 9.3 0.5 5.0 < 0.1 0.2 0.2 1.3 41 Currant species 9.3 0.5 5.0 < 0.1 0.2 0.2 1.3 42 Foxtail barley 8.0 0.4 5.0 < 0.1 0.2 0.2 1.2

Field Survey Summary Tables – Boreal Transition Ecoregion
65
Table 30. 2016 Annual crops in the Boreal Transition Ecoregion (25 fields) Frequency Field Uniformity Field Density (#/m2) Relative
Rank Species (%) All Occurrence All Occurrence High Abundance 1 Barnyard grass species 27.8 11.5 41.2 2.7 9.6 33.4 42.4 2 Wild buckwheat 44.0 10.8 24.6 0.9 2.1 9.0 29.2 3 False cleavers 44.0 9.5 21.6 1.0 2.3 16.8 28.7 4 Wild oats 27.8 7.7 27.6 0.9 3.4 9.8 22.6 5 Canola/rapeseed 23.6 8.8 37.2 0.6 2.6 6.4 19.8 6 Canada thistle 32.1 7.0 21.9 0.5 1.6 4.0 19.0 7 Wheat 12.2 5.9 48.3 0.7 5.8 14.4 15.2 8 Lamb's-quarters 20.0 4.8 24.0 0.6 2.8 8.6 14.5 9 Chickweed 24.1 4.2 17.5 0.3 1.4 4.2 12.6 10 Foxtail barley 11.7 2.5 21.7 0.7 5.6 15.0 11.2 11 Pale smartweed 24.1 3.0 12.6 0.2 0.8 1.8 10.2 12 Broad-leaved plantain 12.1 2.6 21.6 0.3 2.3 4.2 7.9 13 Spiny annual sow-thistle 16.0 1.8 11.3 0.1 0.7 1.4 6.4 14 Dandelion 12.1 1.6 13.4 0.1 0.7 1.0 5.1 15 Perennial sow-thistle 8.2 2.2 27.5 0.1 1.3 1.8 5.0 16 Alfalfa 8.0 1.6 20.1 0.1 1.4 1.6 4.4 17 Night-flowering catchfly 12.1 1.2 10.0 0.1 0.5 0.8 4.4 18 American vetch 8.0 1.4 17.8 0.1 1.2 1.8 4.1 19 Scentless chamomile 3.9 1.4 35.0 0.2 4.0 4.0 3.7 20 Shepherd's-purse 7.8 1.0 12.5 0.1 1.2 2.2 3.6 21 Low cudweed 8.2 0.8 10.0 0.1 1.1 1.6 3.4 22 Field horsetail 8.2 0.8 10.0 0.1 0.8 1.2 3.2 23 Black medick 8.0 0.8 10.1 < 0.1 0.6 0.6 3.0 24 Redroot pigweed 8.2 0.8 10.0 < 0.1 0.5 0.6 3.0 25 Flax 4.1 1.0 25.0 0.1 2.0 2.0 2.7 26 Clover species 8.2 0.4 5.0 < 0.1 0.2 0.2 2.4 27 American dragonhead 4.1 0.6 15.0 < 0.1 1.0 1.0 1.9 28 Hemp-nettle 3.9 0.6 15.0 < 0.1 1.0 1.0 1.8 29 Round-leaved mallow 3.9 0.6 15.0 < 0.1 0.6 0.6 1.7 30 Green foxtail 3.9 0.4 10.0 < 0.1 0.8 0.8 1.5 31 Bicknell's geranium 4.1 0.4 10.0 < 0.1 0.6 0.6 1.5 32 Corn spurry 3.9 0.4 10.0 < 0.1 0.4 0.4 1.4 33 Rough cinquefoil 4.1 0.2 5.0 < 0.1 0.4 0.4 1.3 34 Cocklebur 4.1 0.2 5.0 < 0.1 0.2 0.2 1.2
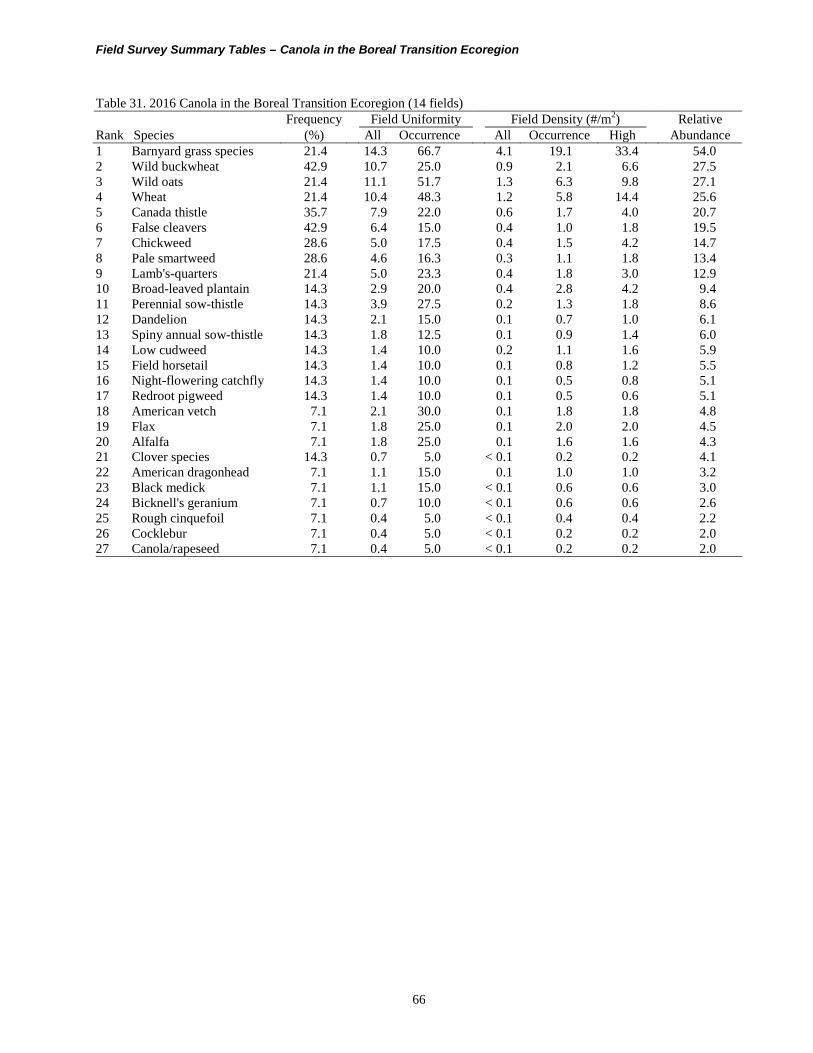
Field Survey Summary Tables – Canola in the Boreal Transition Ecoregion
66
Table 31. 2016 Canola in the Boreal Transition Ecoregion (14 fields) Frequency Field Uniformity Field Density (#/m2) Relative
Rank Species (%) All Occurrence All Occurrence High Abundance 1 Barnyard grass species 21.4 14.3 66.7 4.1 19.1 33.4 54.0 2 Wild buckwheat 42.9 10.7 25.0 0.9 2.1 6.6 27.5 3 Wild oats 21.4 11.1 51.7 1.3 6.3 9.8 27.1 4 Wheat 21.4 10.4 48.3 1.2 5.8 14.4 25.6 5 Canada thistle 35.7 7.9 22.0 0.6 1.7 4.0 20.7 6 False cleavers 42.9 6.4 15.0 0.4 1.0 1.8 19.5 7 Chickweed 28.6 5.0 17.5 0.4 1.5 4.2 14.7 8 Pale smartweed 28.6 4.6 16.3 0.3 1.1 1.8 13.4 9 Lamb's-quarters 21.4 5.0 23.3 0.4 1.8 3.0 12.9 10 Broad-leaved plantain 14.3 2.9 20.0 0.4 2.8 4.2 9.4 11 Perennial sow-thistle 14.3 3.9 27.5 0.2 1.3 1.8 8.6 12 Dandelion 14.3 2.1 15.0 0.1 0.7 1.0 6.1 13 Spiny annual sow-thistle 14.3 1.8 12.5 0.1 0.9 1.4 6.0 14 Low cudweed 14.3 1.4 10.0 0.2 1.1 1.6 5.9 15 Field horsetail 14.3 1.4 10.0 0.1 0.8 1.2 5.5 16 Night-flowering catchfly 14.3 1.4 10.0 0.1 0.5 0.8 5.1 17 Redroot pigweed 14.3 1.4 10.0 0.1 0.5 0.6 5.1 18 American vetch 7.1 2.1 30.0 0.1 1.8 1.8 4.8 19 Flax 7.1 1.8 25.0 0.1 2.0 2.0 4.5 20 Alfalfa 7.1 1.8 25.0 0.1 1.6 1.6 4.3 21 Clover species 14.3 0.7 5.0 < 0.1 0.2 0.2 4.1 22 American dragonhead 7.1 1.1 15.0 0.1 1.0 1.0 3.2 23 Black medick 7.1 1.1 15.0 < 0.1 0.6 0.6 3.0 24 Bicknell's geranium 7.1 0.7 10.0 < 0.1 0.6 0.6 2.6 25 Rough cinquefoil 7.1 0.4 5.0 < 0.1 0.4 0.4 2.2 26 Cocklebur 7.1 0.4 5.0 < 0.1 0.2 0.2 2.0 27 Canola/rapeseed 7.1 0.4 5.0 < 0.1 0.2 0.2 2.0

Field Survey Summary Tables – Spring Wheat in the Boreal Transition Ecoregion
67
Table 32. 2016 Spring wheat in the Boreal Transition Ecoregion (11 fields) Frequency Field Uniformity Field Density (#/m2) Relative
Rank Species (%) All Occurrence All Occurrence High Abundance 1 Canola/rapeseed 45.5 20.0 44.0 1.4 3.2 6.4 45.8 2 False cleavers 45.5 13.6 30.0 1.8 4.0 16.8 42.8 3 Wild buckwheat 45.5 10.9 24.0 1.0 2.2 9.0 31.7 4 Foxtail barley 27.3 5.9 21.7 1.5 5.6 15.0 27.8 5 Barnyard grass species 36.4 7.7 21.3 0.8 2.2 5.6 24.1 6 Lamb's-quarters 18.2 4.5 25.0 0.8 4.5 8.6 17.1 7 Canada thistle 27.3 5.9 21.7 0.4 1.5 3.2 16.5 8 Wild oats 36.4 3.2 8.8 0.4 1.2 3.0 15.6 9 Chickweed 18.2 3.2 17.5 0.2 1.2 1.8 9.6 10 Scentless chamomile 9.1 3.2 35.0 0.4 4.0 4.0 9.1 11 Shepherd's-purse 18.2 2.3 12.5 0.2 1.2 2.2 8.6 12 Spiny annual sow-thistle 18.2 1.8 10.0 0.1 0.5 0.8 6.9 13 Broad-leaved plantain 9.1 2.3 25.0 0.1 1.4 1.4 5.7 14 Pale smartweed 18.2 0.9 5.0 0.1 0.3 0.4 5.5 15 Alfalfa 9.1 1.4 15.0 0.1 1.2 1.2 4.6 16 Hemp-nettle 9.1 1.4 15.0 0.1 1.0 1.0 4.4 17 Round-leaved mallow 9.1 1.4 15.0 0.1 0.6 0.6 4.0 18 Dandelion 9.1 0.9 10.0 0.1 0.8 0.8 3.7 19 Green foxtail 9.1 0.9 10.0 0.1 0.8 0.8 3.7 20 Night-flowering catchfly 9.1 0.9 10.0 < 0.1 0.4 0.4 3.3 21 Corn spurry 9.1 0.9 10.0 < 0.1 0.4 0.4 3.3 22 Black medick 9.1 0.5 5.0 0.1 0.6 0.6 3.0 23 American vetch 9.1 0.5 5.0 0.1 0.6 0.6 3.0

Field Survey Summary Tables – Mid-Boreal Uplands Ecoregion
68
Table 33. 2016 Annual crops in the Mid-Boreal Uplands Ecoregion (15 fields) Frequency Field Uniformity Field Density (#/m2) Relative
Rank Species (%) All Occurrence All Occurrence High Abundance 1 Green foxtail 30.8 20.9 68.0 10.4 33.8 98.4 51.6 2 Field horsetail 34.9 11.3 32.4 4.5 12.8 61.2 26.6 3 Wild buckwheat 61.9 12.5 20.3 0.9 1.5 7.6 19.2 4 Dandelion 50.4 14.2 28.3 1.1 2.3 5.6 19.2 5 Broad-leaved plantain 25.8 14.2 55.0 1.7 6.8 12.2 17.6 6 Barnyard grass species 19.0 11.8 62.1 2.0 10.3 19.6 16.1 7 Wild oats 43.5 9.0 20.6 0.6 1.3 2.8 13.3 8 Wheat 12.9 6.8 52.5 1.9 14.9 29.4 12.2 9 False cleavers 40.2 7.5 18.6 0.5 1.2 2.8 11.7 10 Clover species 25.5 8.4 32.8 0.9 3.6 10.8 11.6 11 Night-flowering catchfly 24.6 8.9 36.3 0.8 3.3 6.6 11.3 12 Stork's bill 18.7 8.3 44.4 1.1 5.9 11.4 11.2 13 Canada thistle 37.8 6.0 15.9 0.6 1.6 3.6 10.9 14 Chickweed 28.2 7.0 24.9 0.5 1.7 2.6 9.6 15 Pale smartweed 28.5 3.2 11.1 0.2 0.7 1.0 6.6 16 Round-leaved mallow 12.6 4.4 34.6 0.4 3.0 5.0 5.5 17 Stinkweed 21.7 3.0 13.6 0.1 0.6 0.8 5.3 18 Black medick 21.4 2.4 11.4 0.1 0.5 0.8 4.8 19 Bicknell's geranium 12.6 2.5 20.2 0.2 1.5 2.2 3.9 20 Hemp-nettle 12.6 2.2 17.2 0.1 1.2 2.2 3.6 21 American dragonhead 12.6 2.2 17.2 0.1 1.1 2.0 3.5 22 Shepherd's-purse 18.5 0.9 5.0 < 0.1 0.3 0.4 3.4 23 Lamb's-quarters 12.6 1.2 9.9 < 0.1 0.4 0.6 2.7 24 Canola/rapeseed 12.3 0.9 7.5 < 0.1 0.3 0.4 2.4 25 Canada fleabane 6.4 1.6 25.0 0.1 1.6 1.6 2.2 26 Tumble pigweed 6.4 1.6 25.0 0.1 1.4 1.4 2.1 27 Yellow sweet-clover 6.4 1.0 15.0 < 0.1 0.6 0.6 1.6 28 Spiny annual sow-thistle 6.1 0.9 15.0 < 0.1 0.8 0.8 1.6 29 Smooth brome 6.4 0.6 10.0 < 0.1 0.4 0.4 1.4 30 Alfalfa 6.1 0.6 10.0 < 0.1 0.6 0.6 1.4 31 Northern bedstraw 6.4 0.3 5.0 < 0.1 0.4 0.4 1.2 32 Low cudweed 6.4 0.3 5.0 < 0.1 0.4 0.4 1.2 33 Foxtail barley 6.1 0.3 5.0 < 0.1 0.4 0.4 1.1 34 Biennial wormwood 6.2 0.3 5.0 < 0.1 0.2 0.2 1.1 35 American vetch 6.1 0.3 5.0 < 0.1 0.2 0.2 1.1

Field Survey Summary Tables – Interlake Plain Ecoregion
69
Table 34. 2016 Annual crops in the Interlake Plain Ecoregion (61 fields) Frequency Field Uniformity Field Density (#/m2) Relative
Rank Species (%) All Occurrence All Occurrence High Abundance 1 Broad-leaved plantain 29.9 7.3 24.4 0.8 2.6 32.2 28.0 2 Barnyard grass species 21.6 5.1 23.7 0.9 4.2 35.0 24.2 3 Yellow foxtail 5.8 3.8 65.6 1.3 22.2 41.0 22.0 4 Wild buckwheat 36.5 4.3 11.8 0.2 0.7 2.8 19.6 5 Wild oats 18.2 4.6 25.2 0.5 3.0 9.6 18.1 6 Dandelion 22.6 3.9 17.1 0.3 1.5 6.8 16.0 7 Wheat 9.9 2.9 29.4 0.6 5.9 22.0 13.8 8 Canola/rapeseed 16.7 4.1 24.8 0.3 1.5 3.8 13.7 9 Pale smartweed 19.5 3.5 18.1 0.3 1.3 5.8 13.7 10 Night-flowering catchfly 5.4 1.6 29.3 0.8 15.3 52.0 13.4 11 Green foxtail 6.1 2.3 37.7 0.5 8.6 18.4 11.0 12 Field horsetail 5.2 2.0 39.2 0.4 8.3 20.0 9.4 13 Redroot pigweed 13.6 2.2 15.9 0.1 0.8 4.0 8.3 14 Lamb's-quarters 11.6 1.9 16.1 0.2 1.4 4.8 8.0 15 False cleavers 6.0 2.3 38.7 0.2 3.0 8.2 7.2 16 Chickweed 4.1 2.1 50.0 0.2 4.7 9.2 6.4 17 Perennial sow-thistle 5.0 1.8 34.9 0.1 2.3 3.6 5.3 18 Spiny annual sow-thistle 8.7 1.2 14.1 0.1 0.7 1.4 4.9 19 Biennial wormwood 7.9 1.1 13.7 0.1 1.0 7.2 4.7 20 Clover species 4.2 1.5 35.9 0.1 1.9 2.6 4.3 21 Rough cinquefoil 6.6 0.8 11.8 0.1 1.2 2.2 4.0 22 Oak-leaved goosefoot 7.4 0.8 10.6 < 0.1 0.5 1.0 3.7 23 Canada thistle 5.5 0.8 13.8 0.1 1.7 4.6 3.7 24 Shepherd's-purse 7.3 0.6 8.1 0.1 0.9 1.6 3.7 25 Golden dock 3.4 0.6 16.6 < 0.1 1.4 1.8 2.3 26 Yellow sweet-clover 1.7 0.8 50.0 0.1 3.0 3.0 2.3 27 Oats 1.7 0.8 50.0 < 0.1 2.4 2.4 2.2 28 Black medick 4.8 0.4 8.4 < 0.1 0.3 0.4 2.1 29 Rayless aster 1.7 0.8 45.0 < 0.1 2.6 2.6 2.1 30 Soybean 2.5 0.6 25.7 < 0.1 1.4 2.4 2.0 31 Dock species 3.6 0.4 11.4 < 0.1 0.7 1.4 2.0 32 Proso millet 2.4 0.4 15.0 < 0.1 1.0 1.0 1.5 33 American vetch 3.7 0.2 5.0 < 0.1 0.2 0.2 1.4 34 Round-leaved mallow 3.1 0.2 5.0 < 0.1 0.3 0.4 1.2 35 Marsh yellow cress 2.5 0.2 9.1 < 0.1 0.4 0.4 1.2 36 Foxtail barley 2.6 0.2 7.0 < 0.1 0.4 1.2 1.1 37 Sedge species 1.7 0.3 15.0 < 0.1 0.6 0.6 1.0 38 Bicknell's geranium 2.1 0.1 6.2 < 0.1 0.2 0.4 0.8 39 Quack grass 1.1 0.2 20.0 < 0.1 1.6 1.6 0.8 40 Blue-joint 1.5 0.1 5.0 < 0.1 1.6 1.6 0.8 41 Willow species 1.6 0.2 10.0 < 0.1 0.4 0.4 0.8 42 Bladder campion 2.0 0.1 5.0 < 0.1 0.2 0.2 0.8 43 Stork's bill 2.0 0.1 5.0 < 0.1 0.2 0.2 0.8 44 Dog mustard 1.5 0.2 10.0 < 0.1 0.4 0.4 0.7 45 Wild mustard 1.5 0.2 10.0 < 0.1 0.4 0.4 0.7 46 Narrow-leaved hawk's-beard 1.8 0.1 5.0 < 0.1 0.2 0.2 0.7 47 Alfalfa 1.7 0.1 5.0 < 0.1 0.2 0.2 0.7 48 Nightshade species 1.7 0.1 5.0 < 0.1 0.2 0.2 0.7 49 American dragonhead 1.6 0.1 5.0 < 0.1 0.2 0.2 0.6 50 Hemp-nettle 1.6 0.1 5.0 < 0.1 0.2 0.2 0.6 51 Orchard grass 1.5 0.1 5.0 < 0.1 0.2 0.2 0.6 52 Thyme-leaved spurge 1.1 0.1 5.0 < 0.1 0.2 0.2 0.4

Field Survey Summary Tables – Canola in the Interlake Plain Ecoregion
70
Table 35. 2016 Canola in the Interlake Plain Ecoregion (18 fields) Frequency Field Uniformity Field Density (#/m2) Relative
Rank Species (%) All Occurrence All Occurrence High Abundance 1 Yellow foxtail 11.2 7.2 64.8 1.9 17.3 28.0 54.8 2 Wild oats 28.2 6.7 23.6 0.7 2.6 8.8 39.1 3 Broad-leaved plantain 24.5 6.3 25.8 0.6 2.3 9.6 33.6 4 Chickweed 11.8 5.9 50.0 0.6 4.7 9.2 27.2 5 False cleavers 5.9 5.6 95.0 0.5 8.2 8.2 22.7 6 Wild buckwheat 25.8 2.0 7.6 0.1 0.4 0.6 16.9 7 Pale smartweed 10.6 2.6 24.5 0.2 1.6 2.8 13.0 8 Redroot pigweed 13.9 2.1 15.1 0.1 0.8 1.4 12.2 9 Night-flowering catchfly 11.2 1.7 15.5 0.1 1.2 2.6 10.8 10 Barnyard grass species 9.4 1.6 17.5 0.2 1.8 3.2 10.4 11 Perennial sow-thistle 4.7 1.9 40.0 0.1 3.0 3.0 8.4 12 Shepherd's-purse 10.0 0.8 7.7 0.1 1.0 1.4 7.7 13 Lamb's-quarters 11.2 0.6 5.0 0.1 0.6 0.8 7.2 14 Spiny annual sow-thistle 9.4 0.9 10.0 < 0.1 0.4 0.6 6.6 15 Golden dock 6.5 1.0 15.0 0.1 1.2 1.2 6.2 16 Dandelion 7.8 0.4 5.0 < 0.1 0.2 0.2 4.5 17 Oak-leaved goosefoot 6.5 0.3 5.0 < 0.1 0.6 0.6 4.2 18 Willow species 4.7 0.5 10.0 < 0.1 0.4 0.4 3.3 19 Narrow-leaved hawk's-beard 5.3 0.3 5.0 < 0.1 0.2 0.2 3.0 20 Round-leaved mallow 4.7 0.2 5.0 < 0.1 0.4 0.4 2.8 21 American dragonhead 4.7 0.2 5.0 < 0.1 0.2 0.2 2.7 22 Wheat 4.7 0.2 5.0 < 0.1 0.2 0.2 2.7

Field Survey Summary Tables – Spring Wheat in the Interlake Plain Ecoregion
71
Table 36. 2016 Spring wheat in the Interlake Plain Ecoregion (15 fields) Frequency Field Uniformity Field Density (#/m2) Relative
Rank Species (%) All Occurrence All Occurrence High Abundance 1 Field horsetail 15.4 7.1 46.1 1.8 11.4 20.0 60.8 2 Wild buckwheat 48.9 6.6 13.5 0.4 0.8 2.8 39.0 3 Canola/rapeseed 26.2 6.7 25.4 0.4 1.4 3.8 31.2 4 Pale smartweed 8.6 4.7 55.0 0.5 5.8 5.8 24.3 5 Lamb's-quarters 22.2 3.5 15.7 0.4 1.7 3.6 23.3 6 Broad-leaved plantain 20.4 2.0 10.0 0.1 0.5 1.0 13.3 7 Dandelion 22.7 1.5 6.5 0.1 0.4 0.8 12.8 8 Redroot pigweed 9.1 2.8 31.3 0.1 1.6 4.0 12.4 9 Canada thistle 15.4 1.4 9.4 0.1 0.6 1.0 10.2 10 False cleavers 15.4 1.5 10.0 0.1 0.4 0.4 9.8 11 Barnyard grass species 13.6 1.0 7.5 < 0.1 0.3 0.4 7.6 12 Dock species 6.8 1.4 20.0 0.1 1.4 1.4 7.4 13 Wild oats 8.6 0.9 10.0 0.1 0.6 0.6 5.9 14 Spiny annual sow-thistle 6.8 1.0 15.0 < 0.1 0.6 0.6 5.4 15 Black medick 6.8 0.7 10.0 < 0.1 0.4 0.4 4.3 16 Shepherd's-purse 6.8 0.7 10.0 < 0.1 0.4 0.4 4.3 17 Soybean 2.3 1.0 45.0 0.1 2.4 2.4 4.2 18 Bladder campion 8.6 0.4 5.0 < 0.1 0.2 0.2 4.2 19 Stork's bill 8.6 0.4 5.0 < 0.1 0.2 0.2 4.2 20 American vetch 8.6 0.4 5.0 < 0.1 0.2 0.2 4.2 21 Bicknell's geranium 6.8 0.3 5.0 < 0.1 0.2 0.2 3.3 22 Hemp-nettle 6.8 0.3 5.0 < 0.1 0.2 0.2 3.3 23 Biennial wormwood 2.3 0.5 20.0 < 0.1 1.6 1.6 2.6 24 Foxtail barley 2.3 0.3 15.0 < 0.1 1.2 1.2 2.1

Field Survey Summary Tables – Soybean in the Interlake Plain Ecoregion
72
Table 37. 2016 Soybean in the Interlake Plain Ecoregion (16 fields) Frequency Field Uniformity Field Density (#/m2) Relative
Rank Species (%) All Occurrence All Occurrence High Abundance 1 Barnyard grass species 41.5 10.3 24.9 2.5 5.9 35.0 38.1 2 Wheat 31.0 10.6 34.2 2.2 7.0 22.0 34.0 3 Night-flowering catchfly 5.6 3.7 65.0 2.9 52.0 52.0 27.7 4 Dandelion 42.9 8.8 20.5 0.8 1.9 5.0 24.1 5 Wild buckwheat 53.6 7.5 14.0 0.4 0.8 2.0 21.9 6 Canola/rapeseed 31.0 8.9 28.7 0.6 1.8 2.6 19.6 7 Broad-leaved plantain 25.4 5.5 21.7 0.2 0.9 1.2 12.5 8 Green foxtail 6.3 3.5 55.0 0.8 12.2 12.2 10.9 9 Rough cinquefoil 24.6 2.9 11.8 0.3 1.2 2.2 10.4 10 Clover species 14.1 4.9 34.8 0.3 1.8 2.6 9.8 11 Pale smartweed 26.8 3.0 11.3 0.1 0.6 1.4 9.7 12 Perennial sow-thistle 12.7 4.1 32.5 0.3 2.0 3.6 8.7 13 Biennial wormwood 21.9 2.3 10.3 0.1 0.6 0.8 7.7 14 Redroot pigweed 19.0 1.8 9.4 0.1 0.5 1.2 6.4 15 Yellow sweet-clover 6.3 3.2 50.0 0.2 3.0 3.0 6.0 16 Oats 6.3 3.2 50.0 0.2 2.4 2.4 5.7 17 Oak-leaved goosefoot 13.4 2.2 16.6 0.1 0.7 1.0 5.7 18 Rayless aster 6.3 2.9 45.0 0.2 2.6 2.6 5.5 19 Canada thistle 5.6 1.4 25.0 0.3 4.6 4.6 4.6 20 Field horsetail 6.3 1.6 25.0 0.1 1.8 1.8 3.8 21 Black medick 12.0 0.9 7.7 < 0.1 0.3 0.4 3.6 22 Marsh yellow cress 7.8 0.8 10.0 < 0.1 0.4 0.4 2.6 23 Sedge species 6.3 1.0 15.0 < 0.1 0.6 0.6 2.5 24 Foxtail barley 7.8 0.4 5.0 < 0.1 0.2 0.2 2.1 25 Wild oats 7.8 0.4 5.0 < 0.1 0.2 0.2 2.1 26 Dock species 7.8 0.4 5.0 < 0.1 0.2 0.2 2.1 27 Dog mustard 5.6 0.6 10.0 < 0.1 0.4 0.4 1.9 28 Wild mustard 5.6 0.6 10.0 < 0.1 0.4 0.4 1.9 29 Spiny annual sow-thistle 5.6 0.6 10.0 < 0.1 0.4 0.4 1.9 30 American vetch 6.3 0.3 5.0 < 0.1 0.2 0.2 1.7 31 Alfalfa 6.3 0.3 5.0 < 0.1 0.2 0.2 1.7 32 Nightshade species 6.3 0.3 5.0 < 0.1 0.2 0.2 1.7 33 Round-leaved mallow 5.6 0.3 5.0 < 0.1 0.2 0.2 1.5

Field Survey Summary Tables – Lake of the Woods Ecoregion
73
Table 38. 2016 Annual crops in the Lake of the Woods Ecoregion (11 fields) Frequency Field Uniformity Field Density (#/m2) Relative
Rank Species (%) All Occurrence All Occurrence High Abundance 1 Dandelion 45.6 18.6 40.9 2.9 6.3 24.6 38.0 2 Wild buckwheat 72.6 15.7 21.6 1.5 2.1 12.0 33.5 3 Broad-leaved plantain 45.3 16.0 35.4 2.1 4.5 16.4 31.6 4 Field horsetail 44.5 9.3 20.9 2.8 6.2 25.6 30.0 5 Perennial sow-thistle 9.5 8.6 90.0 2.3 24.2 24.2 20.6 6 Marsh yellow cress 44.5 8.1 18.1 0.9 2.0 4.8 19.1 7 Yellow foxtail 18.3 9.4 51.5 1.3 7.0 12.8 17.4 8 Wild oats 9.5 3.8 40.0 2.1 21.8 21.8 15.8 9 Canola/rapeseed 17.8 7.6 42.5 1.0 5.5 8.4 14.3 10 Lamb's-quarters 27.4 4.9 17.9 0.4 1.5 3.8 11.0 11 Barnyard grass species 18.3 5.9 32.4 0.4 2.4 3.2 10.2 12 Pale smartweed 27.8 3.3 11.9 0.1 0.5 1.0 8.3 13 Shepherd's-purse 17.5 3.9 22.5 0.2 1.1 2.0 7.3 14 Black medick 18.3 3.5 19.4 0.2 1.0 1.8 7.0 15 Spiny annual sow-thistle 18.6 1.4 7.4 0.1 0.3 0.4 4.8 16 Canada thistle 9.5 1.9 20.0 0.1 1.4 1.4 3.9 17 Redroot pigweed 8.7 1.7 20.0 0.1 1.0 1.0 3.4 18 Clover species 8.7 1.7 20.0 0.1 1.0 1.0 3.4 19 Night-flowering catchfly 8.7 0.9 10.0 0.1 0.8 0.8 2.7 20 Round-leaved mallow 9.1 0.9 10.0 < 0.1 0.4 0.4 2.6 21 Wild mustard 8.7 0.9 10.0 < 0.1 0.4 0.4 2.5 22 Hemp-nettle 9.5 0.5 5.0 < 0.1 0.2 0.2 2.2 23 Thyme-leaved spurge 9.5 0.5 5.0 < 0.1 0.2 0.2 2.2 24 Canada fleabane 8.7 0.4 5.0 < 0.1 0.4 0.4 2.1 25 Bladder campion 8.7 0.4 5.0 < 0.1 0.2 0.2 2.0 26 Purslane 8.7 0.4 5.0 < 0.1 0.2 0.2 2.0 27 Alfalfa 8.7 0.4 5.0 < 0.1 0.2 0.2 2.0

Field Survey Summary Tables – Density, Species Richness and Weed-Free Quadrats by Crop Reporting District
74
Table 39. Number of fields surveyed by crop in each crop reporting district Southwest Northwest Central Eastern Interlake Canola 78 48 50 15 15 Spring wheat 73 26 71 7 19 Soybean 9 8 59 23 19 Corn 8 2 20 8 3 Barley 16 3 13 2 1 Oat 6 3 9 3 2 Flax 10 0 9 0 2 Sunflower 4 0 11 1 2 Annual crops 204 90 242 59 63 Table 40. Density, species richness and weed-free quadrats in the surveyed crops in each crop reporting district Number of Density Species Weed-free fields surveyed (number/m2) (number/field) quadrats Area mean SE median mean SE % SE Southwest Annual crops 204 16.4 1.5 6.6 5.0 0.2 31.3 3.2 Canola 78 13.9 2.4 5.8 4.8 0.3 35.1 5.4 Spring wheat 73 16.7 2.2 6.3 5.1 0.3 30.3 5.4 Barley 16 12.8 4.8 6.7 5.2 0.5 32.6 11.7 Flax 10 22.2 5.7 15.2 7.5 1.0 8.9 9.0 Northwest Annual crops 90 13.9 2.6 4.8 4.2 0.4 48.7 5.3 Canola 48 11.6 2.6 3.5 3.7 0.5 52.5 7.2 Spring wheat 26 15.6 4.5 6.2 5.0 0.6 41.9 9.7 Central Annual crops 242 17.8 2.5 5.5 4.9 0.2 42.9 3.2 Canola 50 8.8 1.9 5.2 4.5 0.5 51.0 7.1 Spring wheat 71 19.9 4.3 3.9 4.3 0.4 48.0 5.9 Soybean 59 8.8 1.3 4.7 4.6 0.3 41.1 6.4 Corn 20 24.2 6.9 14.0 6.2 0.8 24.1 9.6 Barley 13 28.8 14.8 3.1 5.3 1.2 46.2 13.8 Sunflower 11 15.5 2.5 14.1 7.0 0.7 16.7 11.2 Eastern Annual crops 59 13.1 2.9 3.1 4.6 0.5 50.0 6.5 Canola 15 18.4 7.5 1.4 4.4 0.8 57.2 12.8 Soybean 23 12.8 4.0 5.4 5.7 0.9 40.3 10.2 Interlake Annual crops 63 7.3 1.8 1.9 3.4 0.4 59.7 6.2 Canola 15 10.1 5.6 1.5 4.0 1.0 63.5 12.4 Spring wheat 19 3.2 1.3 1.0 2.0 0.3 72.2 10.3 Soybean 19 5.8 1.7 2.1 3.4 0.7 58.3 11.3
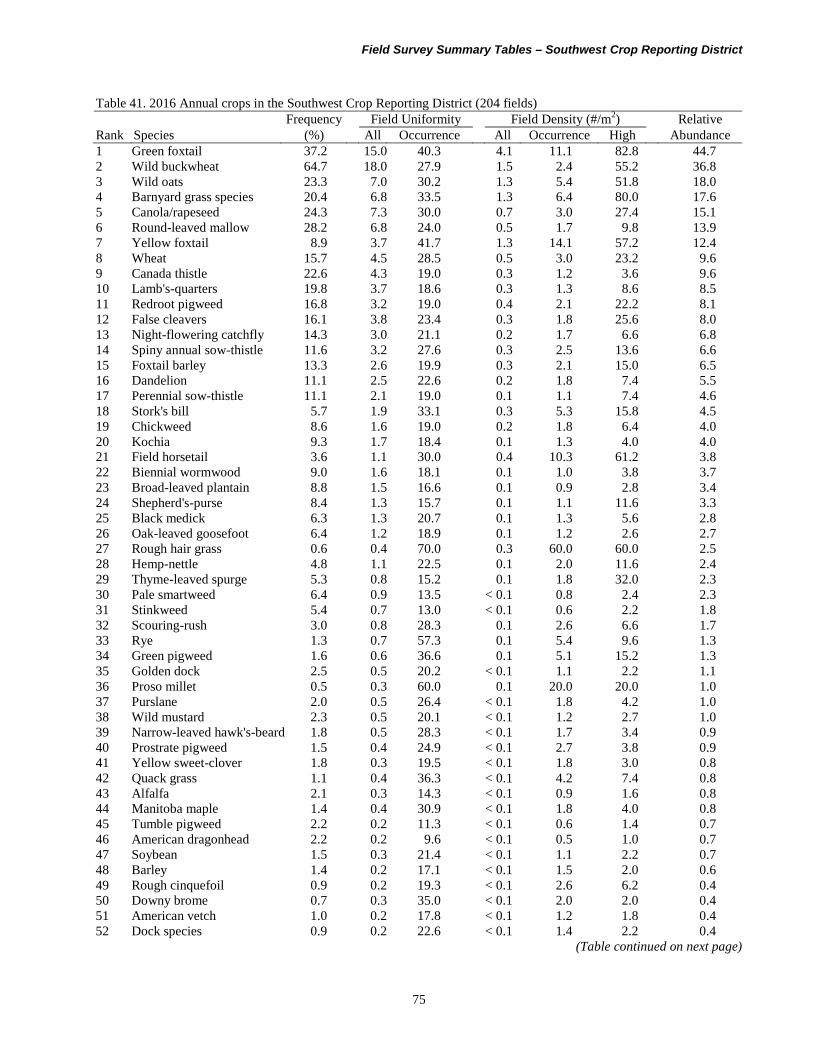
Field Survey Summary Tables – Southwest Crop Reporting District
75
Table 41. 2016 Annual crops in the Southwest Crop Reporting District (204 fields) Frequency Field Uniformity Field Density (#/m2) Relative
Rank Species (%) All Occurrence All Occurrence High Abundance 1 Green foxtail 37.2 15.0 40.3 4.1 11.1 82.8 44.7 2 Wild buckwheat 64.7 18.0 27.9 1.5 2.4 55.2 36.8 3 Wild oats 23.3 7.0 30.2 1.3 5.4 51.8 18.0 4 Barnyard grass species 20.4 6.8 33.5 1.3 6.4 80.0 17.6 5 Canola/rapeseed 24.3 7.3 30.0 0.7 3.0 27.4 15.1 6 Round-leaved mallow 28.2 6.8 24.0 0.5 1.7 9.8 13.9 7 Yellow foxtail 8.9 3.7 41.7 1.3 14.1 57.2 12.4 8 Wheat 15.7 4.5 28.5 0.5 3.0 23.2 9.6 9 Canada thistle 22.6 4.3 19.0 0.3 1.2 3.6 9.6 10 Lamb's-quarters 19.8 3.7 18.6 0.3 1.3 8.6 8.5 11 Redroot pigweed 16.8 3.2 19.0 0.4 2.1 22.2 8.1 12 False cleavers 16.1 3.8 23.4 0.3 1.8 25.6 8.0 13 Night-flowering catchfly 14.3 3.0 21.1 0.2 1.7 6.6 6.8 14 Spiny annual sow-thistle 11.6 3.2 27.6 0.3 2.5 13.6 6.6 15 Foxtail barley 13.3 2.6 19.9 0.3 2.1 15.0 6.5 16 Dandelion 11.1 2.5 22.6 0.2 1.8 7.4 5.5 17 Perennial sow-thistle 11.1 2.1 19.0 0.1 1.1 7.4 4.6 18 Stork's bill 5.7 1.9 33.1 0.3 5.3 15.8 4.5 19 Chickweed 8.6 1.6 19.0 0.2 1.8 6.4 4.0 20 Kochia 9.3 1.7 18.4 0.1 1.3 4.0 4.0 21 Field horsetail 3.6 1.1 30.0 0.4 10.3 61.2 3.8 22 Biennial wormwood 9.0 1.6 18.1 0.1 1.0 3.8 3.7 23 Broad-leaved plantain 8.8 1.5 16.6 0.1 0.9 2.8 3.4 24 Shepherd's-purse 8.4 1.3 15.7 0.1 1.1 11.6 3.3 25 Black medick 6.3 1.3 20.7 0.1 1.3 5.6 2.8 26 Oak-leaved goosefoot 6.4 1.2 18.9 0.1 1.2 2.6 2.7 27 Rough hair grass 0.6 0.4 70.0 0.3 60.0 60.0 2.5 28 Hemp-nettle 4.8 1.1 22.5 0.1 2.0 11.6 2.4 29 Thyme-leaved spurge 5.3 0.8 15.2 0.1 1.8 32.0 2.3 30 Pale smartweed 6.4 0.9 13.5 < 0.1 0.8 2.4 2.3 31 Stinkweed 5.4 0.7 13.0 < 0.1 0.6 2.2 1.8 32 Scouring-rush 3.0 0.8 28.3 0.1 2.6 6.6 1.7 33 Rye 1.3 0.7 57.3 0.1 5.4 9.6 1.3 34 Green pigweed 1.6 0.6 36.6 0.1 5.1 15.2 1.3 35 Golden dock 2.5 0.5 20.2 < 0.1 1.1 2.2 1.1 36 Proso millet 0.5 0.3 60.0 0.1 20.0 20.0 1.0 37 Purslane 2.0 0.5 26.4 < 0.1 1.8 4.2 1.0 38 Wild mustard 2.3 0.5 20.1 < 0.1 1.2 2.7 1.0 39 Narrow-leaved hawk's-beard 1.8 0.5 28.3 < 0.1 1.7 3.4 0.9 40 Prostrate pigweed 1.5 0.4 24.9 < 0.1 2.7 3.8 0.9 41 Yellow sweet-clover 1.8 0.3 19.5 < 0.1 1.8 3.0 0.8 42 Quack grass 1.1 0.4 36.3 < 0.1 4.2 7.4 0.8 43 Alfalfa 2.1 0.3 14.3 < 0.1 0.9 1.6 0.8 44 Manitoba maple 1.4 0.4 30.9 < 0.1 1.8 4.0 0.8 45 Tumble pigweed 2.2 0.2 11.3 < 0.1 0.6 1.4 0.7 46 American dragonhead 2.2 0.2 9.6 < 0.1 0.5 1.0 0.7 47 Soybean 1.5 0.3 21.4 < 0.1 1.1 2.2 0.7 48 Barley 1.4 0.2 17.1 < 0.1 1.5 2.0 0.6 49 Rough cinquefoil 0.9 0.2 19.3 < 0.1 2.6 6.2 0.4 50 Downy brome 0.7 0.3 35.0 < 0.1 2.0 2.0 0.4 51 American vetch 1.0 0.2 17.8 < 0.1 1.2 1.8 0.4 52 Dock species 0.9 0.2 22.6 < 0.1 1.4 2.2 0.4
(Table continued on next page)
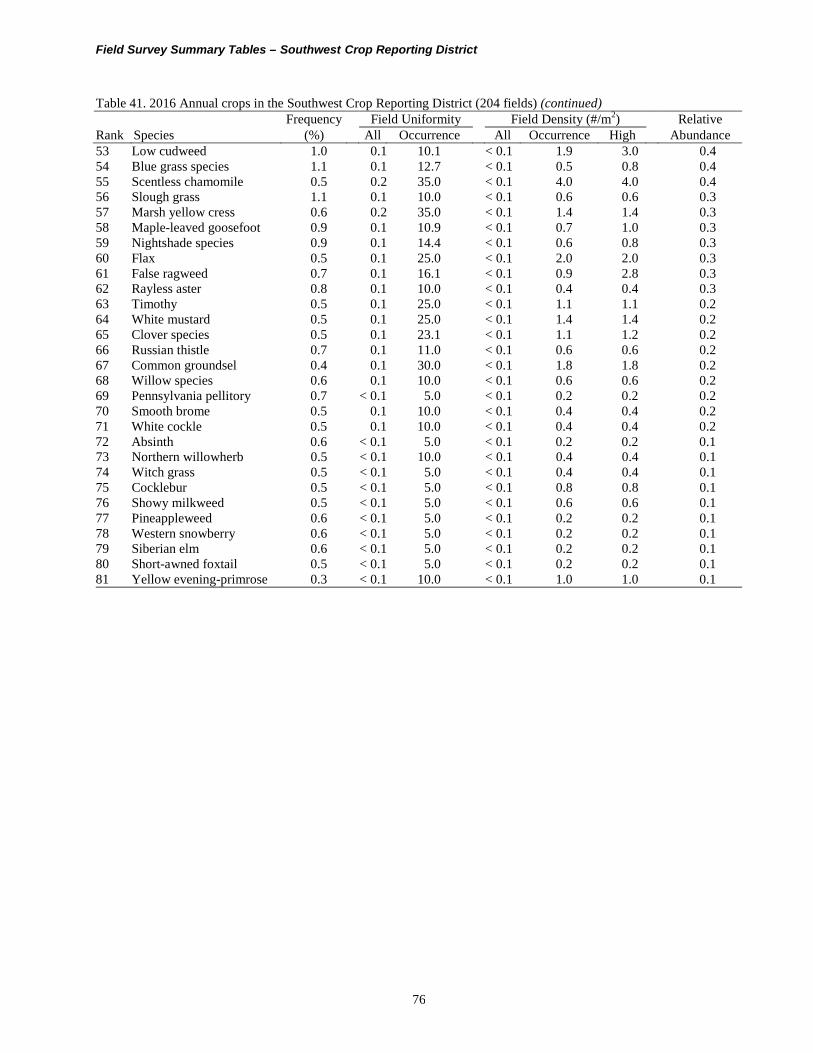
Field Survey Summary Tables – Southwest Crop Reporting District
76
Table 41. 2016 Annual crops in the Southwest Crop Reporting District (204 fields) (continued) Frequency Field Uniformity Field Density (#/m2) Relative
Rank Species (%) All Occurrence All Occurrence High Abundance 53 Low cudweed 1.0 0.1 10.1 < 0.1 1.9 3.0 0.4 54 Blue grass species 1.1 0.1 12.7 < 0.1 0.5 0.8 0.4 55 Scentless chamomile 0.5 0.2 35.0 < 0.1 4.0 4.0 0.4 56 Slough grass 1.1 0.1 10.0 < 0.1 0.6 0.6 0.3 57 Marsh yellow cress 0.6 0.2 35.0 < 0.1 1.4 1.4 0.3 58 Maple-leaved goosefoot 0.9 0.1 10.9 < 0.1 0.7 1.0 0.3 59 Nightshade species 0.9 0.1 14.4 < 0.1 0.6 0.8 0.3 60 Flax 0.5 0.1 25.0 < 0.1 2.0 2.0 0.3 61 False ragweed 0.7 0.1 16.1 < 0.1 0.9 2.8 0.3 62 Rayless aster 0.8 0.1 10.0 < 0.1 0.4 0.4 0.3 63 Timothy 0.5 0.1 25.0 < 0.1 1.1 1.1 0.2 64 White mustard 0.5 0.1 25.0 < 0.1 1.4 1.4 0.2 65 Clover species 0.5 0.1 23.1 < 0.1 1.1 1.2 0.2 66 Russian thistle 0.7 0.1 11.0 < 0.1 0.6 0.6 0.2 67 Common groundsel 0.4 0.1 30.0 < 0.1 1.8 1.8 0.2 68 Willow species 0.6 0.1 10.0 < 0.1 0.6 0.6 0.2 69 Pennsylvania pellitory 0.7 < 0.1 5.0 < 0.1 0.2 0.2 0.2 70 Smooth brome 0.5 0.1 10.0 < 0.1 0.4 0.4 0.2 71 White cockle 0.5 0.1 10.0 < 0.1 0.4 0.4 0.2 72 Absinth 0.6 < 0.1 5.0 < 0.1 0.2 0.2 0.1 73 Northern willowherb 0.5 < 0.1 10.0 < 0.1 0.4 0.4 0.1 74 Witch grass 0.5 < 0.1 5.0 < 0.1 0.4 0.4 0.1 75 Cocklebur 0.5 < 0.1 5.0 < 0.1 0.8 0.8 0.1 76 Showy milkweed 0.5 < 0.1 5.0 < 0.1 0.6 0.6 0.1 77 Pineappleweed 0.6 < 0.1 5.0 < 0.1 0.2 0.2 0.1 78 Western snowberry 0.6 < 0.1 5.0 < 0.1 0.2 0.2 0.1 79 Siberian elm 0.6 < 0.1 5.0 < 0.1 0.2 0.2 0.1 80 Short-awned foxtail 0.5 < 0.1 5.0 < 0.1 0.2 0.2 0.1 81 Yellow evening-primrose 0.3 < 0.1 10.0 < 0.1 1.0 1.0 0.1

Field Survey Summary Tables – Canola in the Southwest Crop Reporting District
77
Table 42. 2016 Canola in the Southwest Crop Reporting District (78 fields) Frequency Field Uniformity Field Density (#/m2) Relative
Rank Species (%) All Occurrence All Occurrence High Abundance 1 Wild buckwheat 58.1 15.8 27.2 1.1 1.9 14.4 34.0 2 Green foxtail 26.2 9.9 37.7 2.8 10.5 82.8 33.9 3 Wheat 24.9 8.4 33.7 1.0 4.0 23.2 19.7 4 Round-leaved mallow 37.0 7.8 21.2 0.5 1.3 3.8 17.9 5 Wild oats 21.6 5.9 27.2 0.8 3.5 27.2 15.0 6 Barnyard grass species 17.6 5.6 31.5 0.8 4.6 21.6 14.3 7 Yellow foxtail 9.1 3.1 33.8 1.0 11.5 47.4 12.1 8 Redroot pigweed 18.7 4.1 22.0 0.6 3.1 22.2 11.7 9 Lamb's-quarters 24.9 4.3 17.2 0.3 1.3 8.4 11.2 10 False cleavers 19.2 4.3 22.5 0.3 1.6 5.0 10.0 11 Canada thistle 19.4 3.9 20.2 0.2 1.1 3.6 9.0 12 Field horsetail 5.0 1.8 34.9 0.7 14.6 61.2 7.9 13 Rough hair grass 1.3 0.9 70.0 0.8 60.0 60.0 6.8 14 Perennial sow-thistle 15.3 2.7 18.0 0.1 0.9 3.2 6.6 15 Dandelion 10.3 3.0 28.6 0.3 2.5 7.4 6.6 16 Spiny annual sow-thistle 9.3 2.6 27.4 0.2 2.4 5.4 5.7 17 Kochia 11.5 2.1 18.7 0.2 1.4 4.0 5.4 18 Biennial wormwood 12.7 2.0 15.8 0.1 0.8 3.8 5.1 19 Chickweed 11.3 1.7 14.9 0.2 1.4 4.2 4.9 20 Stork's bill 6.2 2.1 34.1 0.2 3.3 10.2 4.6 21 Broad-leaved plantain 10.9 1.8 16.5 0.1 1.0 2.0 4.6 22 Oak-leaved goosefoot 9.2 1.9 20.7 0.1 1.2 2.6 4.4 23 Shepherd's-purse 10.3 1.4 13.2 0.1 0.8 1.6 3.9 24 Night-flowering catchfly 9.9 1.5 14.8 0.1 0.8 2.4 3.9 25 Black medick 8.4 1.3 15.0 0.1 0.8 3.6 3.3 26 Foxtail barley 7.8 1.3 16.7 0.1 0.9 2.2 3.3 27 Scouring-rush 3.0 1.7 57.1 0.1 4.6 6.6 3.1 28 Hemp-nettle 1.3 1.2 90.0 0.2 11.6 11.6 2.4 29 Pale smartweed 6.4 0.6 10.0 < 0.1 0.7 1.4 2.2 30 Rye 1.3 1.1 80.0 0.1 9.6 9.6 2.1 31 Stinkweed 6.0 0.6 10.4 < 0.1 0.4 0.7 2.0 32 Green pigweed 2.5 0.7 27.5 0.1 4.5 8.2 1.9 33 Quack grass 1.3 0.9 65.0 0.1 7.4 7.4 1.7 34 Purslane 2.6 0.8 31.7 0.1 2.3 4.2 1.7 35 Golden dock 3.9 0.6 14.9 < 0.1 0.9 1.6 1.6 36 Prostrate pigweed 2.5 0.6 22.5 0.1 2.4 3.8 1.4 37 Thyme-leaved spurge 3.7 0.4 10.1 < 0.1 1.1 2.8 1.4 38 Canola/rapeseed 3.9 0.5 11.9 < 0.1 0.5 0.9 1.4 39 American dragonhead 3.8 0.3 8.3 < 0.1 0.5 1.0 1.2 40 Downy brome 1.7 0.6 35.0 < 0.1 2.0 2.0 1.1 41 Narrow-leaved hawk's-beard 1.3 0.6 45.0 < 0.1 3.4 3.4 1.1 42 Marsh yellow cress 1.3 0.5 35.0 < 0.1 1.4 1.4 0.8 43 American vetch 1.2 0.4 30.0 < 0.1 1.8 1.8 0.7 44 Rough cinquefoil 0.8 0.3 35.0 < 0.1 6.2 6.2 0.7 45 Flax 1.2 0.3 25.0 < 0.1 2.0 2.0 0.7 46 Blue grass species 1.3 0.3 20.0 < 0.1 0.8 0.8 0.6 47 Maple-leaved goosefoot 1.3 0.2 15.0 < 0.1 1.0 1.0 0.5 48 Soybean 1.3 0.2 15.0 < 0.1 0.8 0.8 0.5 49 Tumble pigweed 1.4 0.1 10.0 < 0.1 0.4 0.4 0.5 50 Willow species 1.3 0.1 10.0 < 0.1 0.6 0.6 0.4 51 Alfalfa 1.2 0.1 10.0 < 0.1 0.8 0.8 0.4 52 Absinth 1.4 0.1 5.0 < 0.1 0.2 0.2 0.4
(Table continued on next page)

Field Survey Summary Tables – Canola in the Southwest Crop Reporting District
78
Table 42. 2016 Canola in the Southwest Crop Reporting District (78 fields) (continued) Frequency Field Uniformity Field Density (#/m2) Relative
Rank Species (%) All Occurrence All Occurrence High Abundance 53 Pineappleweed 1.3 0.1 5.0 < 0.1 0.2 0.2 0.4 54 Western snowberry 1.3 0.1 5.0 < 0.1 0.2 0.2 0.4 55 Siberian elm 1.3 0.1 5.0 < 0.1 0.2 0.2 0.4 56 Yellow sweet-clover 1.2 0.1 5.0 < 0.1 0.2 0.2 0.3

Field Survey Summary Tables – Spring Wheat in the Southwest Crop Reporting District
79
Table 43. 2016 Spring wheat in the Southwest Crop Reporting District (73 fields) Frequency Field Uniformity Field Density (#/m2) Relative
Rank Species (%) All Occurrence All Occurrence High Abundance 1 Green foxtail 50.8 20.9 41.1 5.8 11.4 71.6 61.8 2 Wild buckwheat 63.8 17.8 27.9 1.8 2.8 45.6 37.7 3 Wild oats 28.8 8.5 29.5 2.1 7.3 51.8 25.3 4 Canola/rapeseed 35.6 10.4 29.2 1.0 2.9 27.4 21.7 5 Round-leaved mallow 23.7 6.6 27.9 0.5 2.2 9.6 13.1 6 Barnyard grass species 20.7 4.4 21.1 0.6 2.7 10.4 11.0 7 Night-flowering catchfly 20.6 4.6 22.4 0.4 2.1 6.6 10.5 8 Foxtail barley 17.4 4.3 24.5 0.5 3.1 15.0 10.1 9 Canada thistle 24.5 4.1 16.9 0.3 1.1 3.2 9.8 10 Spiny annual sow-thistle 13.9 3.4 24.4 0.3 2.1 13.6 7.3 11 Lamb's-quarters 16.6 3.2 19.1 0.2 1.5 8.6 7.3 12 False cleavers 17.2 3.2 18.7 0.2 1.1 2.8 7.1 13 Dandelion 13.7 2.9 21.0 0.2 1.6 5.6 6.3 14 Chickweed 9.4 2.2 23.8 0.2 2.4 6.4 5.0 15 Yellow foxtail 6.7 1.8 26.7 0.3 4.9 18.6 4.8 16 Stork's bill 5.0 2.1 41.4 0.3 6.4 11.4 4.6 17 Kochia 10.5 2.0 19.2 0.1 1.3 3.2 4.5 18 Hemp-nettle 9.5 1.3 13.8 0.1 0.8 2.2 3.4 19 Redroot pigweed 8.1 1.3 15.7 0.1 1.4 3.6 3.3 20 Broad-leaved plantain 8.4 1.5 17.5 0.1 0.9 1.6 3.3 21 Shepherd's-purse 8.0 1.2 15.4 0.1 1.0 2.2 3.1 22 Biennial wormwood 6.8 1.2 18.1 0.1 1.3 3.0 2.8 23 Proso millet 1.4 0.9 60.0 0.3 20.0 20.0 2.7 24 Black medick 6.1 1.2 20.3 0.1 1.1 4.2 2.6 25 Perennial sow-thistle 5.4 0.9 16.1 < 0.1 0.8 2.0 2.0 26 Wild mustard 4.1 1.0 23.5 0.1 1.4 2.7 1.9 27 Manitoba maple 2.8 1.1 39.6 0.1 2.4 4.0 1.8 28 Pale smartweed 5.5 0.6 11.4 < 0.1 0.5 1.2 1.8 29 Stinkweed 4.1 0.7 16.7 < 0.1 0.8 1.0 1.6 30 Field horsetail 2.8 0.6 20.0 0.1 2.5 4.6 1.4 31 Wheat 4.2 0.6 13.4 < 0.1 0.5 0.8 1.4 32 Soybean 2.6 0.7 25.0 < 0.1 1.3 2.2 1.3 33 Narrow-leaved hawk's-beard 2.8 0.6 20.0 < 0.1 0.9 0.9 1.2 34 Low cudweed 2.8 0.3 10.1 0.1 1.9 3.0 1.1 35 Tumble pigweed 2.9 0.4 15.0 < 0.1 0.8 1.4 1.0 36 Oak-leaved goosefoot 2.8 0.3 10.0 < 0.1 1.4 2.6 1.0 37 Scentless chamomile 1.3 0.5 35.0 0.1 4.0 4.0 0.9 38 Slough grass 2.8 0.3 10.0 < 0.1 0.6 0.6 0.9 39 Dock species 1.4 0.5 35.0 < 0.1 2.2 2.2 0.9 40 Yellow sweet-clover 1.4 0.4 30.0 < 0.1 3.0 3.0 0.8 41 Prostrate pigweed 1.3 0.4 30.0 < 0.1 3.2 3.2 0.8 42 Alfalfa 2.5 0.3 10.0 < 0.1 0.6 0.6 0.8 43 Thyme-leaved spurge 2.7 0.1 5.0 < 0.1 0.2 0.2 0.7 44 Timothy 1.4 0.4 25.0 < 0.1 1.1 1.1 0.7 45 American dragonhead 1.4 0.2 15.0 < 0.1 0.8 0.8 0.5 46 Russian thistle 1.4 0.1 10.0 < 0.1 0.6 0.6 0.4 47 False ragweed 1.4 0.1 10.0 < 0.1 0.4 0.4 0.4 48 Smooth brome 1.4 0.1 10.0 < 0.1 0.4 0.4 0.4 49 Rough cinquefoil 1.4 0.1 10.0 < 0.1 0.4 0.4 0.4 50 White cockle 1.4 0.1 10.0 < 0.1 0.4 0.4 0.4 51 Golden dock 1.4 0.1 10.0 < 0.1 0.6 0.6 0.4 52 Quack grass 1.4 0.1 5.0 < 0.1 0.8 0.8 0.4
(Table continued on next page)
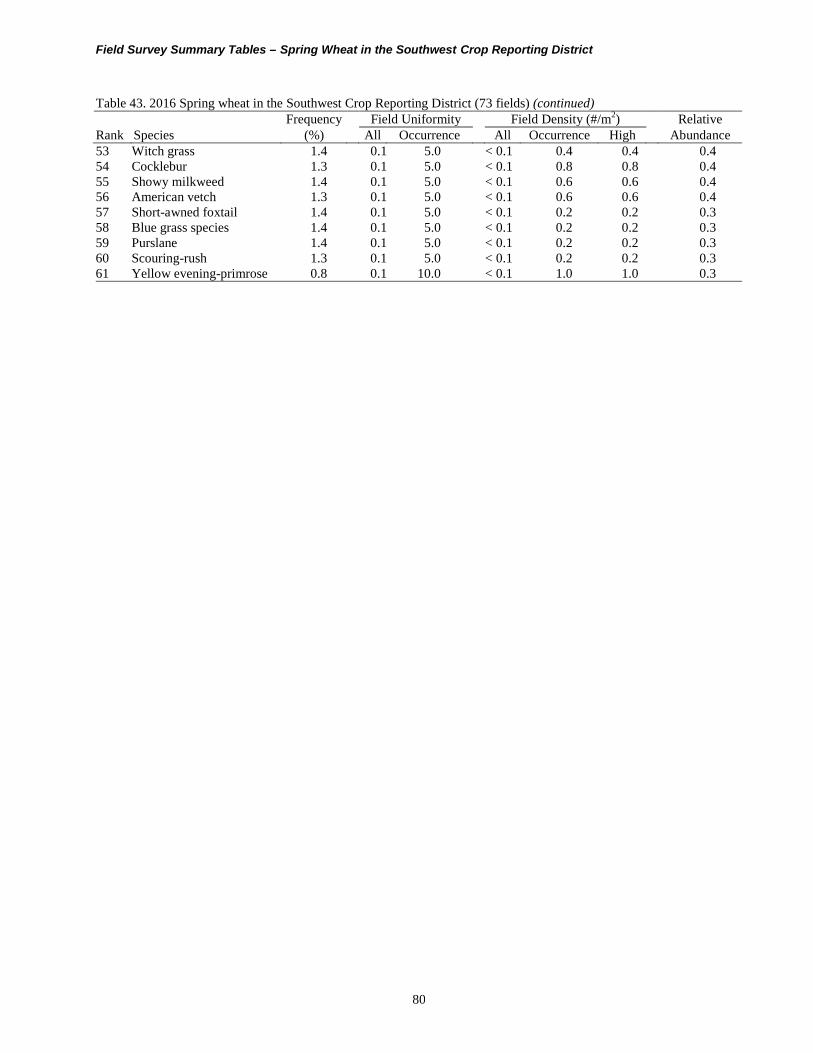
Field Survey Summary Tables – Spring Wheat in the Southwest Crop Reporting District
80
Table 43. 2016 Spring wheat in the Southwest Crop Reporting District (73 fields) (continued) Frequency Field Uniformity Field Density (#/m2) Relative
Rank Species (%) All Occurrence All Occurrence High Abundance 53 Witch grass 1.4 0.1 5.0 < 0.1 0.4 0.4 0.4 54 Cocklebur 1.3 0.1 5.0 < 0.1 0.8 0.8 0.4 55 Showy milkweed 1.4 0.1 5.0 < 0.1 0.6 0.6 0.4 56 American vetch 1.3 0.1 5.0 < 0.1 0.6 0.6 0.4 57 Short-awned foxtail 1.4 0.1 5.0 < 0.1 0.2 0.2 0.3 58 Blue grass species 1.4 0.1 5.0 < 0.1 0.2 0.2 0.3 59 Purslane 1.4 0.1 5.0 < 0.1 0.2 0.2 0.3 60 Scouring-rush 1.3 0.1 5.0 < 0.1 0.2 0.2 0.3 61 Yellow evening-primrose 0.8 0.1 10.0 < 0.1 1.0 1.0 0.3

Field Survey Summary Tables – Barley in the Southwest Crop Reporting District
81
Table 44. 2016 Barley in the Southwest Crop Reporting District (16 fields) Frequency Field Uniformity Field Density (#/m2) Relative
Rank Species (%) All Occurrence All Occurrence High Abundance 1 Wild buckwheat 94.4 26.6 28.2 1.8 1.9 7.8 52.5 2 Green foxtail 37.8 12.7 33.6 3.9 10.4 57.8 47.5 3 Canola/rapeseed 41.5 19.8 47.6 2.0 4.8 13.8 38.3 4 Canada thistle 44.8 9.9 22.0 0.6 1.3 2.8 20.7 5 Spiny annual sow-thistle 23.7 6.8 28.7 0.7 2.8 7.4 14.8 6 Redroot pigweed 27.4 4.9 17.9 0.5 1.7 4.0 12.5 7 Foxtail barley 24.7 4.8 19.6 0.4 1.8 4.4 11.9 8 Night-flowering catchfly 20.0 6.1 30.7 0.4 1.8 4.0 11.2 9 Round-leaved mallow 18.2 5.1 28.2 0.3 1.5 2.0 9.4 10 Barnyard grass species 17.3 4.6 26.7 0.3 1.5 2.2 8.8 11 Wild oats 17.9 4.5 25.0 0.2 1.3 3.0 8.7 12 Thyme-leaved spurge 13.9 3.4 24.2 0.3 2.4 3.2 7.8 13 Wheat 17.8 3.3 18.3 0.2 1.0 1.4 7.3 14 Lamb's-quarters 11.8 3.5 29.7 0.2 2.0 3.4 6.7 15 Pale smartweed 11.9 1.5 12.7 0.1 0.9 1.6 4.3 16 Wild mustard 11.8 1.5 12.8 0.1 0.8 1.4 4.2 17 White mustard 7.9 2.0 25.0 0.1 1.4 1.4 3.9 18 False cleavers 6.0 2.1 35.0 0.1 1.8 1.8 3.6 19 Oak-leaved goosefoot 6.1 1.8 30.0 0.1 1.8 1.8 3.4 20 Biennial wormwood 5.8 2.0 35.0 0.1 1.6 1.6 3.4 21 Hemp-nettle 7.9 1.2 15.0 0.1 0.8 0.8 2.9 22 Broad-leaved plantain 7.9 1.2 15.0 0.1 0.8 0.8 2.9 23 Stinkweed 5.6 1.1 20.0 0.1 2.2 2.2 2.9 24 Perennial sow-thistle 7.9 0.8 10.0 < 0.1 0.6 0.6 2.5 25 Shepherd's-purse 6.0 0.6 10.0 < 0.1 0.4 0.4 1.8 26 Dandelion 5.6 0.6 10.0 < 0.1 0.4 0.4 1.7 27 Kochia 6.1 0.3 5.0 < 0.1 0.2 0.2 1.5 28 Dock species 6.1 0.3 5.0 < 0.1 0.2 0.2 1.5 29 Manitoba maple 5.8 0.3 5.0 < 0.1 0.2 0.2 1.4

Field Survey Summary Tables – Flax in the Southwest Crop Reporting District
82
Table 45. 2016 Flax in the Southwest Crop Reporting District (10 fields) Frequency Field Uniformity Field Density (#/m2) Relative
Rank Species (%) All Occurrence All Occurrence High Abundance 1 False cleavers 51.7 25.9 50.1 4.4 8.6 25.6 38.6 2 Wild buckwheat 79.9 26.1 32.7 2.2 2.8 7.2 32.6 3 Green foxtail 41.0 22.5 54.8 3.3 8.1 14.4 30.5 4 Round-leaved mallow 60.8 16.3 26.8 2.1 3.5 9.8 25.0 5 Wheat 57.7 15.3 26.6 0.8 1.4 2.4 18.2 6 Shepherd's-purse 32.2 13.3 41.1 1.4 4.4 11.6 16.7 7 Canola/rapeseed 48.0 12.0 24.9 0.7 1.5 3.1 15.1 8 Redroot pigweed 37.6 8.0 21.2 1.0 2.7 6.6 13.2 9 Green pigweed 10.0 9.0 90.0 1.5 15.2 15.2 12.3 10 Pale smartweed 32.2 8.4 25.9 0.5 1.4 2.4 10.1 11 Wild oats 38.9 5.8 15.0 0.3 0.8 2.0 9.2 12 Night-flowering catchfly 31.6 6.2 19.6 0.4 1.3 1.8 8.8 13 Perennial sow-thistle 20.1 7.0 34.7 0.4 1.9 2.8 7.5 14 Chickweed 19.5 5.3 27.5 0.5 2.5 4.0 7.2 15 Rye 10.4 6.2 60.0 0.5 4.6 4.6 6.4 16 Alfalfa 20.4 4.6 22.5 0.2 1.2 1.2 5.9 17 Foxtail barley 29.2 2.9 10.0 0.1 0.4 0.6 5.8 18 Canada thistle 20.1 4.1 20.2 0.2 0.8 1.0 5.2 19 Thyme-leaved spurge 19.1 2.8 14.5 0.3 1.4 1.6 5.0 20 Spiny annual sow-thistle 9.7 3.9 40.0 0.4 3.8 3.8 4.7 21 Stinkweed 12.8 3.8 30.0 0.2 1.6 1.6 4.4 22 Broad-leaved plantain 9.7 2.4 25.0 0.3 2.8 2.8 3.6 23 Clover species 10.4 3.1 30.0 0.1 1.2 1.2 3.4 24 Dandelion 9.7 2.4 25.0 0.1 1.4 1.4 3.0 25 Kochia 9.7 1.9 20.0 0.1 0.8 0.8 2.5 26 Lamb's-quarters 9.7 1.0 10.0 < 0.1 0.4 0.4 1.9 27 American dragonhead 10.0 0.5 5.0 < 0.1 0.4 0.4 1.7 28 Hemp-nettle 9.7 0.5 5.0 < 0.1 0.2 0.2 1.6

Field Survey Summary Tables – Northwest Crop Reporting District
83
Table 46. 2016 Annual crops in the Northwest Crop Reporting District (90 fields) Frequency Field Uniformity Field Density (#/m2) Relative
Rank Species (%) All Occurrence All Occurrence High Abundance 1 Green foxtail 17.9 8.9 49.5 3.5 19.4 98.4 37.9 2 Wild buckwheat 47.9 10.4 21.7 0.7 1.5 7.8 26.7 3 Broad-leaved plantain 21.8 7.5 34.3 1.3 6.1 53.0 22.0 4 Barnyard grass species 20.5 7.3 35.4 1.3 6.2 33.4 21.1 5 Wild oats 23.8 6.9 29.0 1.2 4.9 69.6 20.8 6 Chickweed 18.7 6.4 34.3 1.0 5.4 23.2 18.0 7 False cleavers 23.2 6.7 28.9 0.5 2.3 16.8 15.9 8 Wheat 12.6 5.6 44.5 0.7 5.8 29.4 13.7 9 Dandelion 23.8 5.2 21.8 0.4 1.6 9.4 13.5 10 Pale smartweed 22.0 4.7 21.5 0.4 1.6 8.0 12.4 11 Spiny annual sow-thistle 11.9 3.9 32.7 0.4 3.4 17.0 9.5 12 Canada thistle 19.8 2.9 14.7 0.2 1.3 4.0 9.4 13 Canola/rapeseed 14.0 3.5 25.3 0.2 1.7 4.6 8.6 14 Golden dock 5.4 2.2 41.5 0.5 9.0 23.8 6.9 15 Redroot pigweed 12.8 1.9 15.1 0.1 0.9 3.4 5.8 16 Night-flowering catchfly 5.3 1.6 30.8 0.2 3.9 11.6 4.4 17 Perennial sow-thistle 8.5 1.5 17.9 0.1 1.3 3.6 4.3 18 Field horsetail 6.8 1.3 19.8 0.1 2.0 4.6 3.9 19 Lamb's-quarters 7.6 0.8 11.0 0.1 1.3 4.6 3.4 20 Clover species 5.3 1.2 22.4 0.1 2.4 10.8 3.3 21 Black medick 5.5 1.1 20.9 0.1 1.9 4.4 3.2 22 Yellow sweet-clover 4.8 1.1 23.4 0.1 1.2 3.0 2.7 23 Shepherd's-purse 5.9 0.8 13.8 < 0.1 0.7 1.8 2.5 24 Round-leaved mallow 3.6 0.8 21.0 0.1 1.5 5.0 2.0 25 Bicknell's geranium 3.8 0.7 17.5 < 0.1 1.1 2.2 1.9 26 Northern willowherb 5.0 0.5 9.4 < 0.1 0.5 1.0 1.8 27 Hemp-nettle 4.0 0.5 11.5 < 0.1 0.9 2.0 1.7 28 Biennial wormwood 3.5 0.6 16.2 < 0.1 1.0 1.6 1.6 29 Quack grass 0.8 0.6 70.0 0.1 13.4 13.4 1.6 30 Oak-leaved goosefoot 3.3 0.5 14.4 < 0.1 0.7 1.4 1.4 31 Alfalfa 3.0 0.4 14.8 < 0.1 1.0 1.6 1.3 32 American dragonhead 2.8 0.4 16.3 < 0.1 0.9 2.0 1.3 33 American vetch 3.9 0.2 6.2 < 0.1 0.2 0.4 1.3 34 Stinkweed 2.8 0.4 13.6 < 0.1 0.6 0.8 1.2 35 Tumble pigweed 2.0 0.4 22.1 < 0.1 1.4 1.4 1.1 36 Low cudweed 2.8 0.2 8.5 < 0.1 0.9 1.6 1.1 37 Maple-leaved goosefoot 2.9 0.2 7.5 < 0.1 0.6 0.6 1.0 38 Canada fleabane 2.3 0.3 12.3 < 0.1 0.7 1.6 0.9 39 Foxtail barley 2.7 0.1 5.0 < 0.1 0.6 1.0 0.9 40 Marsh yellow cress 1.5 0.4 25.0 < 0.1 1.8 1.8 0.9 41 Perennial rye grass 1.3 0.3 25.0 < 0.1 2.2 2.2 0.8 42 Flax 2.1 0.2 7.5 < 0.1 0.3 0.4 0.7 43 Proso millet 1.4 0.2 15.0 < 0.1 1.0 1.0 0.6 44 Thyme-leaved spurge 1.3 0.2 15.0 < 0.1 1.0 1.0 0.6 45 Wild mustard 1.2 0.2 15.0 < 0.1 1.0 1.0 0.5 46 Scouring-rush 1.2 0.1 5.0 < 0.1 0.6 0.6 0.4 47 Purslane speedwell 1.2 0.1 5.0 < 0.1 0.2 0.2 0.4 48 Soybean 1.2 0.1 5.0 < 0.1 0.2 0.2 0.4 49 Rayless aster 1.2 0.1 5.0 < 0.1 0.2 0.2 0.4 50 Corn spurry 0.9 0.1 10.0 < 0.1 0.4 0.4 0.3 51 Bladder campion 1.1 0.1 5.0 < 0.1 0.2 0.2 0.3 52 Stork's bill 1.1 0.1 5.0 < 0.1 0.2 0.2 0.3
(Table continued on next page)

Field Survey Summary Tables – Northwest Crop Reporting District
84
Table 46. 2016 Annual crops in the Northwest Crop Reporting District (90 fields) (continued) Frequency Field Uniformity Field Density (#/m2) Relative
Rank Species (%) All Occurrence All Occurrence High Abundance 53 Dock species 1.0 0.1 5.0 < 0.1 0.2 0.2 0.3 54 Rough cinquefoil 1.0 < 0.1 5.0 < 0.1 0.4 0.4 0.3 55 Smooth brome 0.8 0.1 10.0 < 0.1 0.4 0.4 0.3 56 Cocklebur 1.0 < 0.1 5.0 < 0.1 0.2 0.2 0.3 57 Northern bedstraw 0.8 < 0.1 5.0 < 0.1 0.4 0.4 0.3

Field Survey Summary Tables – Canola in the Northwest Crop Reporting District
85
Table 47. 2016 Canola in the Northwest Crop Reporting District (48 fields) Frequency Field Uniformity Field Density (#/m2) Relative
Rank Species (%) All Occurrence All Occurrence High Abundance 1 Green foxtail 10.8 7.8 72.2 2.8 25.7 73.6 35.3 2 Wheat 21.6 10.2 47.1 1.3 6.2 29.4 28.3 3 Wild buckwheat 39.2 8.2 21.0 0.6 1.6 6.6 24.7 4 Wild oats 29.2 8.3 28.4 0.8 2.7 9.8 23.5 5 Barnyard grass species 13.5 7.4 54.5 1.3 9.5 33.4 22.7 6 Broad-leaved plantain 21.0 6.6 31.5 0.8 3.6 12.2 19.3 7 Chickweed 21.2 5.8 27.3 0.5 2.6 9.2 16.6 8 False cleavers 23.0 5.4 23.5 0.4 1.7 8.2 15.3 9 Canada thistle 21.2 3.5 16.5 0.3 1.6 4.0 12.2 10 Dandelion 17.7 3.9 21.8 0.3 1.5 4.4 11.2 11 Pale smartweed 17.2 3.9 23.0 0.3 1.5 3.4 11.0 12 Spiny annual sow-thistle 10.5 3.6 34.2 0.5 4.4 17.0 10.7 13 Golden dock 4.6 2.0 43.1 0.6 12.5 23.8 8.4 14 Clover species 8.4 2.2 25.6 0.2 2.7 10.8 6.6 15 Field horsetail 10.6 1.8 16.8 0.2 1.5 3.4 6.1 16 Redroot pigweed 12.6 1.5 11.8 0.1 0.5 1.2 5.5 17 Bicknell's geranium 5.7 1.1 19.5 0.1 1.1 2.2 3.3 18 Canola/rapeseed 3.9 1.1 27.5 0.1 2.7 4.6 3.1 19 Oak-leaved goosefoot 6.3 0.9 14.4 < 0.1 0.7 1.4 3.0 20 Lamb's-quarters 5.8 0.7 11.8 0.1 0.9 1.4 2.7 21 Shepherd's-purse 5.9 0.5 8.3 < 0.1 0.4 0.6 2.3 22 Low cudweed 5.3 0.4 8.5 < 0.1 0.9 1.6 2.3 23 Perennial sow-thistle 4.8 0.5 10.7 < 0.1 0.7 0.8 2.1 24 Alfalfa 3.8 0.6 14.7 < 0.1 0.9 1.6 1.9 25 Stinkweed 3.8 0.6 15.0 < 0.1 0.7 0.8 1.9 26 Perennial rye grass 2.4 0.6 25.0 0.1 2.2 2.2 1.7 27 Biennial wormwood 2.3 0.6 25.0 < 0.1 1.6 1.6 1.5 28 Round-leaved mallow 3.5 0.3 9.4 < 0.1 0.6 1.0 1.5 29 Hemp-nettle 3.5 0.4 10.5 < 0.1 0.4 0.6 1.5 30 Flax 3.9 0.3 7.5 < 0.1 0.3 0.4 1.5 31 Yellow sweet-clover 3.5 0.3 9.4 < 0.1 0.4 0.6 1.4 32 Black medick 2.2 0.4 20.0 < 0.1 0.8 0.8 1.2 33 Thyme-leaved spurge 2.4 0.4 15.0 < 0.1 1.0 1.0 1.2 34 Canada fleabane 1.6 0.4 25.0 < 0.1 1.6 1.6 1.1 35 Tumble pigweed 1.6 0.4 25.0 < 0.1 1.4 1.4 1.0 36 Purslane speedwell 2.3 0.1 5.0 < 0.1 0.2 0.2 0.8 37 Northern willowherb 2.3 0.1 5.0 < 0.1 0.2 0.2 0.8 38 American vetch 2.0 0.1 5.0 < 0.1 0.2 0.2 0.7 39 Dock species 2.0 0.1 5.0 < 0.1 0.2 0.2 0.7 40 Rough cinquefoil 1.8 0.1 5.0 < 0.1 0.4 0.4 0.7 41 Smooth brome 1.6 0.2 10.0 < 0.1 0.4 0.4 0.6 42 Night-flowering catchfly 1.8 0.1 5.0 < 0.1 0.2 0.2 0.6 43 Cocklebur 1.8 0.1 5.0 < 0.1 0.2 0.2 0.6 44 Northern bedstraw 1.6 0.1 5.0 < 0.1 0.4 0.4 0.6 45 American dragonhead 1.6 0.1 5.0 < 0.1 0.2 0.2 0.5

Field Survey Summary Tables – Spring Wheat in the Northwest Crop Reporting District
86
Table 48. 2016 Spring wheat in the Northwest Crop Reporting District (26 fields) Frequency Field Uniformity Field Density (#/m2) Relative
Rank Species (%) All Occurrence All Occurrence High Abundance 1 Green foxtail 23.8 5.1 21.6 3.0 12.7 98.4 28.7 2 False cleavers 39.9 14.0 35.0 1.2 2.9 16.8 28.0 3 Broad-leaved plantain 20.7 7.8 37.5 2.6 12.6 53.0 27.8 4 Wild buckwheat 61.4 12.4 20.2 0.7 1.1 4.2 27.6 5 Barnyard grass species 29.6 9.6 32.3 1.9 6.3 25.2 26.5 6 Chickweed 24.2 9.5 39.3 1.9 7.9 23.2 25.6 7 Dandelion 30.7 6.9 22.4 0.6 2.0 9.4 16.3 8 Spiny annual sow-thistle 22.9 7.2 31.4 0.6 2.4 7.4 14.6 9 Canola/rapeseed 29.2 6.2 21.1 0.4 1.3 4.0 13.8 10 Pale smartweed 26.7 5.2 19.5 0.4 1.6 5.8 12.7 11 Night-flowering catchfly 10.4 4.4 42.4 0.7 6.4 11.6 10.4 12 Canada thistle 25.8 3.4 13.0 0.2 0.8 1.2 9.5 13 Wild oats 22.2 2.8 12.6 0.2 0.7 1.2 7.9 14 Lamb's-quarters 13.7 1.3 9.6 0.2 1.8 4.6 5.5 15 Redroot pigweed 12.7 1.9 15.0 0.1 1.1 3.4 5.1 16 Perennial sow-thistle 7.8 1.8 22.7 0.1 1.3 1.6 3.8 17 Shepherd's-purse 7.2 1.9 26.0 0.1 1.2 1.8 3.7 18 Field horsetail 4.0 1.4 35.0 0.2 4.6 4.6 3.3 19 Hemp-nettle 7.8 1.0 12.3 0.1 1.4 2.0 3.1 20 American vetch 10.5 0.7 6.7 < 0.1 0.3 0.4 2.9 21 Foxtail barley 9.9 0.5 5.0 0.1 0.6 1.0 2.8 22 Tumble pigweed 4.2 0.8 20.0 0.1 1.4 1.4 2.0 23 Wheat 4.3 0.9 20.0 < 0.1 1.0 1.0 1.9 24 Wild mustard 4.3 0.6 15.0 < 0.1 1.0 1.0 1.7 25 American dragonhead 2.9 0.9 30.0 0.1 2.0 2.0 1.7 26 Alfalfa 3.4 0.5 15.0 < 0.1 1.2 1.2 1.4 27 Round-leaved mallow 3.4 0.5 15.0 < 0.1 0.6 0.6 1.3 28 Scouring-rush 4.2 0.2 5.0 < 0.1 0.6 0.6 1.2 29 Northern willowherb 4.3 0.2 5.0 < 0.1 0.4 0.4 1.2 30 Soybean 4.3 0.2 5.0 < 0.1 0.2 0.2 1.1 31 Rayless aster 4.2 0.2 5.0 < 0.1 0.2 0.2 1.1 32 Corn spurry 3.4 0.3 10.0 < 0.1 0.4 0.4 1.1 33 Bladder campion 4.0 0.2 5.0 < 0.1 0.2 0.2 1.0 34 Stork's bill 4.0 0.2 5.0 < 0.1 0.2 0.2 1.0 35 Bicknell's geranium 2.9 0.3 10.0 < 0.1 0.8 0.8 1.0 36 Black medick 3.4 0.2 5.0 < 0.1 0.6 0.6 1.0 37 Stinkweed 2.9 0.3 10.0 < 0.1 0.4 0.4 0.9

Field Survey Summary Tables – Central Crop Reporting District
87
Table 49. 2016 Annual crops in the Central Crop Reporting District (242 fields) Frequency Field Uniformity Field Density (#/m2) Relative
Rank Species (%) All Occurrence All Occurrence High Abundance 1 Green foxtail 24.0 10.1 41.9 4.6 19.3 163.4 39.9 2 Wild buckwheat 46.7 12.7 27.2 1.0 2.2 13.8 26.8 3 Canola/rapeseed 27.7 8.0 29.0 1.0 3.5 35.6 18.3 4 Barnyard grass species 23.4 6.1 25.9 1.1 4.7 40.4 16.4 5 Redroot pigweed 28.4 7.1 24.9 0.7 2.5 16.6 16.2 6 Yellow foxtail 17.6 5.2 29.8 1.1 6.5 64.0 14.7 7 Dandelion 25.4 5.0 19.6 0.8 3.1 84.2 14.0 8 Wild oats 21.2 5.4 25.3 0.8 3.6 40.4 13.4 9 Pale smartweed 22.3 4.9 21.9 0.7 3.2 24.8 13.0 10 Round-leaved mallow 27.2 4.8 17.5 0.5 1.7 17.4 12.5 11 Wheat 15.9 3.9 24.6 0.5 3.3 39.4 9.7 12 Lamb's-quarters 15.6 3.6 23.1 0.5 3.2 43.0 9.3 13 Canada thistle 18.3 3.3 17.8 0.4 2.4 33.8 9.1 14 Broad-leaved plantain 7.5 2.3 30.5 0.6 8.0 57.4 7.0 15 Wild mustard 6.7 1.7 26.0 0.5 8.2 89.4 6.0 16 Spiny annual sow-thistle 12.1 2.4 19.9 0.2 1.4 11.2 5.6 17 Biennial wormwood 11.5 1.8 16.1 0.1 1.0 6.0 4.6 18 Night-flowering catchfly 9.0 1.5 17.0 0.1 1.5 9.4 3.9 19 Purslane 7.4 1.7 23.1 0.2 2.1 8.4 3.9 20 Perennial sow-thistle 7.7 1.4 18.2 0.1 1.5 6.8 3.5 21 Thyme-leaved spurge 7.3 1.0 14.3 0.1 1.0 3.0 2.8 22 Chickweed 5.2 1.1 20.4 0.1 2.5 23.0 2.8 23 Dock species 5.2 1.0 19.1 0.1 2.4 8.0 2.7 24 Black medick 4.9 0.9 19.1 0.1 1.5 6.0 2.3 25 Foxtail barley 5.8 0.7 11.8 0.1 1.4 6.4 2.3 26 Golden dock 3.8 0.8 20.1 0.1 2.9 11.4 2.1 27 Oak-leaved goosefoot 5.5 0.5 8.8 0.1 1.2 5.6 1.9 28 Witch grass 1.1 0.2 21.6 0.3 24.4 41.8 1.9 29 Northern willowherb 3.5 0.6 15.8 0.1 3.2 15.8 1.8 30 Field horsetail 2.8 0.4 15.5 0.1 4.8 11.4 1.7 31 Kochia 4.4 0.5 11.8 < 0.1 0.7 3.6 1.5 32 Tumble pigweed 3.8 0.6 16.1 < 0.1 0.9 1.8 1.5 33 Rough cinquefoil 2.9 0.7 22.8 0.1 2.1 9.2 1.5 34 Marsh yellow cress 3.3 0.6 18.0 < 0.1 1.2 3.6 1.4 35 Annual sow-thistle 1.0 0.5 50.6 0.1 11.0 22.6 1.3 36 Stinkweed 0.8 0.5 60.8 0.1 14.4 15.6 1.2 37 Soybean 1.9 0.5 25.3 0.1 2.9 11.4 1.1 38 Willow species 3.3 0.3 8.5 < 0.1 0.7 2.8 1.1 39 Yellow sweet-clover 3.1 0.2 8.1 < 0.1 0.4 2.0 0.9 40 Shepherd's-purse 2.3 0.3 11.1 < 0.1 0.7 1.4 0.8 41 Prostrate knotweed 1.9 0.3 13.8 < 0.1 1.4 3.4 0.8 42 Clover species 1.6 0.3 18.9 < 0.1 1.5 4.0 0.7 43 Maple-leaved goosefoot 2.5 0.2 7.0 < 0.1 0.4 1.0 0.7 44 American dragonhead 2.4 0.2 8.4 < 0.1 0.4 1.2 0.7 45 Stink grass 1.4 0.3 24.8 < 0.1 1.6 3.2 0.7 46 Absinth 1.2 0.2 14.6 0.1 4.4 17.6 0.7 47 Tartary buckwheat 0.8 0.4 44.4 < 0.1 4.2 10.2 0.7 48 Dog mustard 1.2 0.4 32.1 < 0.1 1.8 3.0 0.7 49 Hemp-nettle 2.0 0.2 11.3 < 0.1 0.7 2.4 0.7 50 Narrow-leaved hawk's-beard 1.6 0.2 13.1 < 0.1 0.8 1.4 0.6 51 Common pepper-grass 0.3 0.2 55.0 0.1 18.0 18.0 0.6 52 Showy milkweed 1.7 0.1 8.6 < 0.1 0.7 1.0 0.5
(Table continued on next page)

Field Survey Summary Tables –Central Crop Reporting District
88
Table 49. 2016 Annual crops in the Central Crop Reporting District (242 fields) (continued) Frequency Field Uniformity Field Density (#/m2) Relative
Rank Species (%) All Occurrence All Occurrence High Abundance 53 Stork's bill 1.2 0.2 17.4 < 0.1 1.3 1.6 0.5 54 Prostrate pigweed 1.7 0.1 5.9 < 0.1 0.2 0.4 0.4 55 Leafy spurge 0.5 0.2 50.0 < 0.1 4.4 4.4 0.4 56 Alfalfa 1.2 0.1 12.7 < 0.1 0.6 0.8 0.4 57 Canada fleabane 0.6 0.2 35.0 < 0.1 2.0 2.0 0.4 58 Purslane speedwell 0.3 0.1 40.0 < 0.1 10.4 10.4 0.4 59 Oats 0.5 0.2 42.9 < 0.1 2.1 2.6 0.4 60 Flodman's thistle 0.8 0.1 16.0 < 0.1 1.4 2.0 0.4 61 Siberian elm 1.1 0.1 7.6 < 0.1 0.5 1.2 0.3 62 Manitoba maple 1.2 0.1 5.0 < 0.1 0.4 0.6 0.3 63 Hedge bindweed 1.0 0.1 9.8 < 0.1 0.5 0.8 0.3 64 Perennial rye grass 0.4 0.2 40.0 < 0.1 3.8 3.8 0.3 65 Common yellow wood-sorrel 0.5 0.1 20.0 < 0.1 3.6 3.6 0.3 66 Green pigweed 0.5 0.1 27.6 < 0.1 1.8 1.8 0.3 67 Needle-and-thread grass 0.5 0.1 20.0 < 0.1 1.6 1.6 0.2 68 Clammy hedge-hyssop 0.8 < 0.1 5.0 < 0.1 0.8 1.2 0.2 69 Bicknell's geranium 0.5 0.1 21.2 < 0.1 1.3 1.6 0.2 70 Spear-leaved goosefoot 0.4 0.1 25.0 < 0.1 1.4 1.4 0.2 71 Silverweed 0.6 < 0.1 5.0 < 0.1 1.2 1.2 0.2 72 Aster species 0.5 0.1 15.0 < 0.1 1.2 1.2 0.2 73 Bur oak 0.5 0.1 15.0 < 0.1 0.6 0.6 0.2 74 Currant species 0.6 < 0.1 5.0 < 0.1 0.2 0.2 0.2 75 False ragweed 0.6 < 0.1 5.0 < 0.1 0.2 0.2 0.2 76 Barley 0.4 < 0.1 10.0 < 0.1 0.8 0.8 0.1 77 Goldenrod species 0.5 < 0.1 10.0 < 0.1 0.4 0.4 0.1 78 Rush species 0.5 < 0.1 10.0 < 0.1 0.4 0.4 0.1 79 Beggarticks species 0.5 < 0.1 10.0 < 0.1 0.4 0.4 0.1 80 Field bean 0.6 < 0.1 5.0 < 0.1 0.2 0.2 0.1 81 Prickly lettuce 0.5 < 0.1 5.0 < 0.1 0.8 0.8 0.1 82 False flax species 0.4 < 0.1 10.0 < 0.1 0.6 0.6 0.1 83 Flixweed 0.5 < 0.1 5.0 < 0.1 0.2 0.2 0.1 84 American vetch 0.5 < 0.1 5.0 < 0.1 0.2 0.2 0.1 85 Large crab grass 0.3 0.1 15.0 < 0.1 0.8 0.8 0.1 86 False cleavers 0.5 < 0.1 5.0 < 0.1 0.2 0.2 0.1 87 Cocklebur 0.5 < 0.1 5.0 < 0.1 0.2 0.2 0.1 88 Povertyweed 0.5 < 0.1 5.0 < 0.1 0.2 0.2 0.1 89 Scouring-rush 0.5 < 0.1 5.0 < 0.1 0.2 0.2 0.1 90 Buffalograss 0.5 < 0.1 5.0 < 0.1 0.2 0.2 0.1 91 Yellow toadflax 0.4 < 0.1 5.0 < 0.1 0.2 0.2 0.1 92 Wormseed mustard 0.3 < 0.1 10.0 < 0.1 0.6 0.6 0.1 93 Toad rush 0.1 < 0.1 40.0 < 0.1 3.4 3.4 0.1 94 Water smartweed 0.3 < 0.1 5.0 < 0.1 0.2 0.2 0.1 95 Corn 0.1 < 0.1 20.0 < 0.1 1.0 1.0 0.1 96 Quack grass 0.1 < 0.1 15.0 < 0.1 1.4 1.4 < 0.1 97 Common ragweed 0.1 < 0.1 5.0 < 0.1 0.2 0.2 < 0.1

Field Survey Summary Tables – Canola in the Central Crop Reporting District
89
Table 50. 2016 Canola in the Central Crop Reporting District (50 fields) Frequency Field Uniformity Field Density (#/m2) Relative
Rank Species (%) All Occurrence All Occurrence High Abundance 1 Green foxtail 19.4 6.3 32.4 1.8 9.4 65.2 33.0 2 Redroot pigweed 34.0 7.5 22.0 0.8 2.5 10.6 26.5 3 Wild buckwheat 39.5 6.4 16.3 0.4 1.1 4.2 21.7 4 Yellow foxtail 16.2 5.5 33.7 1.0 5.9 17.8 21.3 5 Wild oats 27.7 6.6 23.7 0.6 2.0 4.8 20.8 6 Wheat 28.5 6.4 22.3 0.5 1.8 7.6 20.4 7 Pale smartweed 23.5 3.6 15.5 0.4 1.7 10.0 14.4 8 Barnyard grass species 15.6 3.7 23.3 0.6 3.5 11.4 14.4 9 Round-leaved mallow 23.4 3.3 14.2 0.2 0.9 4.0 11.8 10 Canada thistle 18.0 3.1 17.5 0.2 1.3 4.8 10.7 11 Dandelion 15.8 3.2 20.4 0.3 1.7 4.4 10.6 12 Spiny annual sow-thistle 11.8 2.6 22.4 0.2 1.3 4.8 7.7 13 Dock species 8.4 1.3 15.0 0.2 2.8 8.0 6.2 14 Biennial wormwood 12.1 1.7 14.1 0.1 0.9 2.4 6.0 15 Oak-leaved goosefoot 7.7 1.0 12.8 0.2 2.4 5.6 5.1 16 Golden dock 6.4 1.5 22.8 0.2 2.4 6.6 5.0 17 Chickweed 5.9 1.6 26.3 0.1 2.5 5.4 5.0 18 Thyme-leaved spurge 8.0 1.2 15.2 0.1 1.3 3.0 4.5 19 Lamb's-quarters 12.0 0.9 7.3 < 0.1 0.3 0.8 4.2 20 Black medick 6.3 0.9 14.7 0.1 2.1 6.0 4.1 21 Night-flowering catchfly 8.2 1.0 11.6 < 0.1 0.6 1.2 3.6 22 Leafy spurge 2.1 1.0 50.0 0.1 4.4 4.4 2.8 23 Broad-leaved plantain 6.4 0.7 11.5 < 0.1 0.5 0.8 2.8 24 Foxtail barley 4.0 0.5 12.6 < 0.1 0.9 1.2 2.0 25 Common yellow wood-sorrel 2.1 0.4 20.0 0.1 3.6 3.6 1.8 26 Rough cinquefoil 1.9 0.6 30.0 0.1 3.0 3.0 1.8 27 Tumble pigweed 3.7 0.5 12.6 < 0.1 0.7 1.0 1.7 28 Willow species 4.1 0.4 10.0 < 0.1 0.6 1.0 1.7 29 Wild mustard 4.1 0.3 7.5 < 0.1 0.3 0.4 1.4 30 Flodman's thistle 2.1 0.4 20.0 < 0.1 2.0 2.0 1.4 31 Prostrate knotweed 4.0 0.3 7.6 < 0.1 0.3 0.4 1.4 32 Marsh yellow cress 3.9 0.3 7.5 < 0.1 0.4 0.4 1.4 33 Perennial sow-thistle 3.9 0.3 7.5 < 0.1 0.3 0.4 1.4 34 Shepherd's-purse 3.9 0.2 5.0 < 0.1 0.3 0.4 1.3 35 American dragonhead 4.0 0.2 5.0 < 0.1 0.2 0.2 1.2 36 Clover species 1.8 0.3 15.0 < 0.1 1.8 1.8 1.1 37 Aster species 1.9 0.3 15.0 < 0.1 1.2 1.2 1.1 38 Hedge bindweed 2.0 0.3 15.0 < 0.1 0.8 0.8 1.0 39 Stork's bill 1.9 0.2 10.0 < 0.1 1.2 1.2 0.9 40 Hemp-nettle 1.9 0.3 15.0 < 0.1 0.6 0.6 0.9 41 Bur oak 1.9 0.3 15.0 < 0.1 0.6 0.6 0.9 42 Showy milkweed 1.9 0.2 10.0 < 0.1 1.0 1.0 0.9 43 Clammy hedge-hyssop 1.9 0.1 5.0 < 0.1 1.2 1.2 0.8 44 Goldenrod species 1.9 0.2 10.0 < 0.1 0.4 0.4 0.8 45 Rush species 1.9 0.2 10.0 < 0.1 0.4 0.4 0.8 46 Beggarticks species 1.9 0.2 10.0 < 0.1 0.4 0.4 0.8 47 Prickly lettuce 1.9 0.1 5.0 < 0.1 0.8 0.8 0.7 48 Field bean 2.3 0.1 5.0 < 0.1 0.2 0.2 0.7 49 Yellow sweet-clover 2.3 0.1 5.0 < 0.1 0.2 0.2 0.7 50 Manitoba maple 2.3 0.1 5.0 < 0.1 0.2 0.2 0.7 51 Purslane 2.1 0.1 5.0 < 0.1 0.4 0.4 0.7 52 Flixweed 2.1 0.1 5.0 < 0.1 0.2 0.2 0.6
(Table continued on next page)

Field Survey Summary Tables – Canola in the Central Crop Reporting District
90
Table 50. 2016 Canola in the Central Crop Reporting District (50 fields) (continued) Frequency Field Uniformity Field Density (#/m2) Relative
Rank Species (%) All Occurrence All Occurrence High Abundance 53 American vetch 2.1 0.1 5.0 < 0.1 0.2 0.2 0.6 54 Kochia 2.0 0.1 5.0 < 0.1 0.2 0.2 0.6 55 False cleavers 2.0 0.1 5.0 < 0.1 0.2 0.2 0.6 56 Absinth 1.9 0.1 5.0 < 0.1 0.2 0.2 0.6 57 False ragweed 1.9 0.1 5.0 < 0.1 0.2 0.2 0.6 58 Cocklebur 1.9 0.1 5.0 < 0.1 0.2 0.2 0.6 59 Northern willowherb 1.9 0.1 5.0 < 0.1 0.2 0.2 0.6 60 Soybean 1.9 0.1 5.0 < 0.1 0.2 0.2 0.6
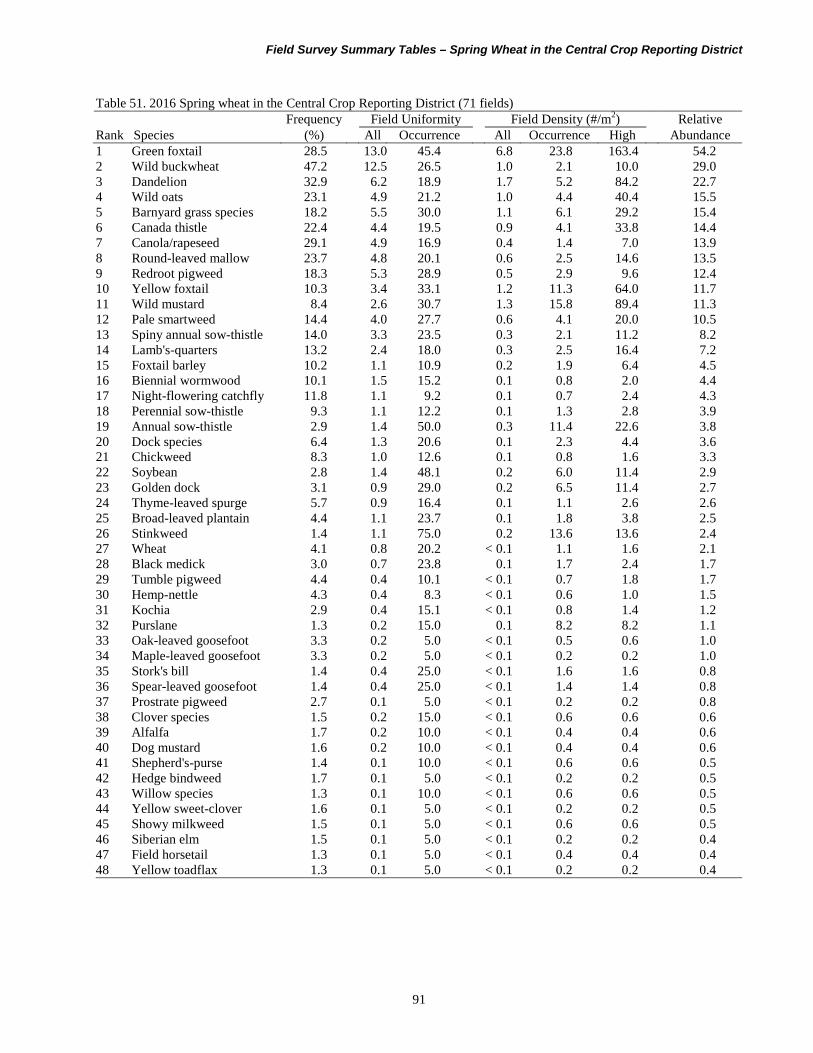
Field Survey Summary Tables – Spring Wheat in the Central Crop Reporting District
91
Table 51. 2016 Spring wheat in the Central Crop Reporting District (71 fields) Frequency Field Uniformity Field Density (#/m2) Relative
Rank Species (%) All Occurrence All Occurrence High Abundance 1 Green foxtail 28.5 13.0 45.4 6.8 23.8 163.4 54.2 2 Wild buckwheat 47.2 12.5 26.5 1.0 2.1 10.0 29.0 3 Dandelion 32.9 6.2 18.9 1.7 5.2 84.2 22.7 4 Wild oats 23.1 4.9 21.2 1.0 4.4 40.4 15.5 5 Barnyard grass species 18.2 5.5 30.0 1.1 6.1 29.2 15.4 6 Canada thistle 22.4 4.4 19.5 0.9 4.1 33.8 14.4 7 Canola/rapeseed 29.1 4.9 16.9 0.4 1.4 7.0 13.9 8 Round-leaved mallow 23.7 4.8 20.1 0.6 2.5 14.6 13.5 9 Redroot pigweed 18.3 5.3 28.9 0.5 2.9 9.6 12.4 10 Yellow foxtail 10.3 3.4 33.1 1.2 11.3 64.0 11.7 11 Wild mustard 8.4 2.6 30.7 1.3 15.8 89.4 11.3 12 Pale smartweed 14.4 4.0 27.7 0.6 4.1 20.0 10.5 13 Spiny annual sow-thistle 14.0 3.3 23.5 0.3 2.1 11.2 8.2 14 Lamb's-quarters 13.2 2.4 18.0 0.3 2.5 16.4 7.2 15 Foxtail barley 10.2 1.1 10.9 0.2 1.9 6.4 4.5 16 Biennial wormwood 10.1 1.5 15.2 0.1 0.8 2.0 4.4 17 Night-flowering catchfly 11.8 1.1 9.2 0.1 0.7 2.4 4.3 18 Perennial sow-thistle 9.3 1.1 12.2 0.1 1.3 2.8 3.9 19 Annual sow-thistle 2.9 1.4 50.0 0.3 11.4 22.6 3.8 20 Dock species 6.4 1.3 20.6 0.1 2.3 4.4 3.6 21 Chickweed 8.3 1.0 12.6 0.1 0.8 1.6 3.3 22 Soybean 2.8 1.4 48.1 0.2 6.0 11.4 2.9 23 Golden dock 3.1 0.9 29.0 0.2 6.5 11.4 2.7 24 Thyme-leaved spurge 5.7 0.9 16.4 0.1 1.1 2.6 2.6 25 Broad-leaved plantain 4.4 1.1 23.7 0.1 1.8 3.8 2.5 26 Stinkweed 1.4 1.1 75.0 0.2 13.6 13.6 2.4 27 Wheat 4.1 0.8 20.2 < 0.1 1.1 1.6 2.1 28 Black medick 3.0 0.7 23.8 0.1 1.7 2.4 1.7 29 Tumble pigweed 4.4 0.4 10.1 < 0.1 0.7 1.8 1.7 30 Hemp-nettle 4.3 0.4 8.3 < 0.1 0.6 1.0 1.5 31 Kochia 2.9 0.4 15.1 < 0.1 0.8 1.4 1.2 32 Purslane 1.3 0.2 15.0 0.1 8.2 8.2 1.1 33 Oak-leaved goosefoot 3.3 0.2 5.0 < 0.1 0.5 0.6 1.0 34 Maple-leaved goosefoot 3.3 0.2 5.0 < 0.1 0.2 0.2 1.0 35 Stork's bill 1.4 0.4 25.0 < 0.1 1.6 1.6 0.8 36 Spear-leaved goosefoot 1.4 0.4 25.0 < 0.1 1.4 1.4 0.8 37 Prostrate pigweed 2.7 0.1 5.0 < 0.1 0.2 0.2 0.8 38 Clover species 1.5 0.2 15.0 < 0.1 0.6 0.6 0.6 39 Alfalfa 1.7 0.2 10.0 < 0.1 0.4 0.4 0.6 40 Dog mustard 1.6 0.2 10.0 < 0.1 0.4 0.4 0.6 41 Shepherd's-purse 1.4 0.1 10.0 < 0.1 0.6 0.6 0.5 42 Hedge bindweed 1.7 0.1 5.0 < 0.1 0.2 0.2 0.5 43 Willow species 1.3 0.1 10.0 < 0.1 0.6 0.6 0.5 44 Yellow sweet-clover 1.6 0.1 5.0 < 0.1 0.2 0.2 0.5 45 Showy milkweed 1.5 0.1 5.0 < 0.1 0.6 0.6 0.5 46 Siberian elm 1.5 0.1 5.0 < 0.1 0.2 0.2 0.4 47 Field horsetail 1.3 0.1 5.0 < 0.1 0.4 0.4 0.4 48 Yellow toadflax 1.3 0.1 5.0 < 0.1 0.2 0.2 0.4

Field Survey Summary Tables – Soybean in the Central Crop Reporting District
92
Table 52. 2016 Soybean in the Central Crop Reporting District (59 fields) Frequency Field Uniformity Field Density (#/m2) Relative
Rank Species (%) All Occurrence All Occurrence High Abundance 1 Canola/rapeseed 47.1 14.9 31.6 1.8 3.9 30.6 47.9 2 Wild buckwheat 49.0 12.9 26.4 0.9 1.8 8.8 35.1 3 Barnyard grass species 25.7 6.4 25.0 0.8 3.0 19.4 21.6 4 Yellow foxtail 21.2 4.6 21.8 0.9 4.5 42.6 20.6 5 Redroot pigweed 29.2 7.2 24.5 0.4 1.5 4.8 19.4 6 Wild oats 15.3 3.6 23.4 0.6 4.1 23.6 14.5 7 Round-leaved mallow 28.2 3.4 12.2 0.3 1.1 5.8 13.6 8 Dandelion 26.6 4.1 15.4 0.3 1.0 6.4 13.6 9 Green foxtail 20.2 4.0 19.6 0.4 2.0 15.6 13.4 10 Wheat 20.5 4.4 21.2 0.3 1.6 4.8 13.1 11 Lamb's-quarters 16.0 3.3 20.5 0.2 1.1 2.8 9.2 12 Broad-leaved plantain 5.5 2.1 39.0 0.4 6.9 15.2 7.9 13 Pale smartweed 17.0 1.4 8.4 0.1 0.5 1.2 6.2 14 Biennial wormwood 12.2 1.5 12.2 0.1 0.8 1.2 5.4 15 Spiny annual sow-thistle 9.9 1.4 13.7 0.1 0.7 1.6 4.5 16 Field horsetail 5.1 0.7 13.0 0.2 4.2 7.4 4.3 17 Purslane 8.7 1.0 11.5 < 0.1 0.5 0.8 3.5 18 Chickweed 1.7 0.8 50.0 0.2 10.2 10.2 3.2 19 Marsh yellow cress 5.7 0.9 16.5 0.1 1.1 1.8 3.0 20 Willow species 6.9 0.5 7.3 0.1 0.8 2.8 2.7 21 Canada thistle 6.7 0.7 10.2 < 0.1 0.5 0.8 2.6 22 Night-flowering catchfly 4.9 0.7 13.5 0.1 1.1 2.6 2.4 23 Kochia 4.9 0.6 13.1 < 0.1 0.7 1.8 2.2 24 Black medick 3.5 0.9 24.9 < 0.1 1.1 1.4 2.2 25 Northern willowherb 6.8 0.3 5.0 < 0.1 0.3 0.6 2.1 26 Rough cinquefoil 3.9 0.6 15.0 < 0.1 1.0 1.0 2.0 27 Yellow sweet-clover 4.9 0.4 9.0 < 0.1 0.4 0.8 1.8 28 Oats 1.6 0.9 55.0 < 0.1 2.6 2.6 1.8 29 Narrow-leaved hawk's-beard 3.7 0.5 12.9 < 0.1 0.9 1.4 1.8 30 Thyme-leaved spurge 5.0 0.4 8.4 < 0.1 0.3 0.4 1.7 31 Perennial rye grass 1.6 0.6 40.0 0.1 3.8 3.8 1.7 32 Golden dock 3.9 0.3 7.5 < 0.1 0.5 0.8 1.4 33 Oak-leaved goosefoot 3.1 0.3 9.3 < 0.1 0.9 1.2 1.3 34 Tumble pigweed 2.0 0.5 25.0 < 0.1 1.2 1.2 1.3 35 Needle-and-thread grass 2.0 0.4 20.0 < 0.1 1.6 1.6 1.2 36 Perennial sow-thistle 3.1 0.3 10.0 < 0.1 0.6 1.0 1.2 37 Dock species 3.3 0.2 7.3 < 0.1 0.5 0.6 1.2 38 Shepherd's-purse 2.0 0.2 10.0 < 0.1 1.0 1.0 0.9 39 Maple-leaved goosefoot 2.0 0.1 5.0 < 0.1 1.0 1.0 0.8 40 Barley 1.7 0.2 10.0 < 0.1 0.8 0.8 0.7 41 Witch grass 1.8 0.2 10.0 < 0.1 0.6 0.6 0.7 42 Clover species 1.7 0.2 10.0 < 0.1 0.4 0.4 0.6 43 False flax species 1.6 0.2 10.0 < 0.1 0.6 0.6 0.6 44 Wild mustard 2.0 0.1 5.0 < 0.1 0.2 0.2 0.6 45 Prostrate pigweed 2.0 0.1 5.0 < 0.1 0.2 0.2 0.6 46 Povertyweed 1.8 0.1 5.0 < 0.1 0.2 0.2 0.5 47 Scouring-rush 1.8 0.1 5.0 < 0.1 0.2 0.2 0.5 48 Buffalograss 1.8 0.1 5.0 < 0.1 0.2 0.2 0.5 49 Absinth 1.7 0.1 5.0 < 0.1 0.2 0.2 0.5

Field Survey Summary Tables – Corn in the Central Crop Reporting District
93
Table 53. 2016 Corn in the Central Crop Reporting District (20 fields) Frequency Field Uniformity Field Density (#/m2) Relative
Rank Species (%) All Occurrence All Occurrence High Abundance 1 Lamb's-quarters 39.3 18.1 46.0 3.3 8.4 43.0 29.7 2 Canola/rapeseed 39.8 16.6 41.6 2.6 6.6 35.6 26.2 3 Wild buckwheat 50.4 20.0 39.7 1.7 3.5 7.8 26.0 4 Round-leaved mallow 64.5 16.4 25.5 1.6 2.5 17.4 25.9 5 Redroot pigweed 54.8 16.0 29.3 1.7 3.1 16.6 24.5 6 Green foxtail 10.5 8.3 78.5 3.9 37.4 74.0 22.3 7 Purslane 40.1 13.2 32.8 0.8 1.9 4.2 16.7 8 Barnyard grass species 33.8 7.9 23.5 0.9 2.7 7.0 13.4 9 Yellow foxtail 29.6 9.7 32.8 0.7 2.5 4.8 13.0 10 Pale smartweed 18.7 6.3 33.5 1.2 6.3 23.2 11.2 11 Dandelion 19.8 6.5 32.8 0.5 2.3 5.0 8.5 12 Stink grass 15.8 4.9 30.9 0.3 2.1 3.2 6.5 13 Common pepper-grass 5.1 2.8 55.0 0.9 18.0 18.0 6.1 14 Canada thistle 15.3 2.9 19.1 0.2 1.3 2.4 4.9 15 Stinkweed 4.6 1.8 40.0 0.7 15.6 15.6 4.7 16 Purslane speedwell 5.1 2.0 40.0 0.5 10.4 10.4 4.1 17 Rough cinquefoil 4.6 2.8 60.0 0.4 9.2 9.2 4.0 18 Broad-leaved plantain 14.7 1.7 11.9 0.1 0.9 1.2 3.9 19 Dock species 4.6 3.2 70.0 0.3 5.8 5.8 3.6 20 Foxtail barley 10.1 2.3 22.5 0.1 1.4 2.2 3.4 21 Thyme-leaved spurge 14.9 1.2 8.4 0.1 0.4 0.8 3.3 22 Biennial wormwood 10.1 2.0 20.0 0.1 0.9 1.0 3.1 23 Wheat 5.1 2.0 40.0 0.3 5.6 5.6 3.1 24 Marsh yellow cress 5.1 2.8 55.0 0.2 3.6 3.6 3.1 25 Narrow-leaved hawk's-beard 10.3 1.4 13.3 0.1 0.6 1.0 2.6 26 American dragonhead 9.5 1.2 12.7 0.1 0.7 1.2 2.4 27 Siberian elm 9.5 0.9 9.7 0.1 0.7 1.2 2.3 28 Field horsetail 5.1 0.8 15.0 0.2 4.2 4.2 2.1 29 Bicknell's geranium 5.7 1.4 25.0 0.1 1.6 1.6 2.0 30 Kochia 9.5 0.7 7.7 < 0.1 0.3 0.4 2.0 31 Green pigweed 5.1 1.3 25.0 0.1 1.8 1.8 1.9 32 Maple-leaved goosefoot 5.1 1.0 20.0 < 0.1 0.8 0.8 1.5 33 Wild mustard 5.1 1.0 20.0 < 0.1 0.8 0.8 1.5 34 Large crab grass 5.1 0.8 15.0 < 0.1 0.8 0.8 1.4 35 Spiny annual sow-thistle 5.1 0.8 15.0 < 0.1 0.8 0.8 1.4 36 Night-flowering catchfly 4.6 0.7 15.0 0.1 1.4 1.4 1.4 37 Flodman's thistle 5.1 0.5 10.0 < 0.1 0.4 0.4 1.2 38 Wormseed mustard 4.6 0.5 10.0 < 0.1 0.6 0.6 1.1 39 Tumble pigweed 4.7 0.5 10.0 < 0.1 0.4 0.4 1.1 40 Prostrate pigweed 4.6 0.5 10.0 < 0.1 0.4 0.4 1.1 41 Yellow sweet-clover 5.1 0.3 5.0 < 0.1 0.2 0.2 1.0 42 Clammy hedge-hyssop 5.1 0.3 5.0 < 0.1 0.2 0.2 1.0

Field Survey Summary Tables – Barley in the Central Crop Reporting District
94
Table 54. 2016 Barley in the Central Crop Reporting District (13 fields) Frequency Field Uniformity Field Density (#/m2) Relative
Rank Species (%) All Occurrence All Occurrence High Abundance 1 Green foxtail 28.6 18.7 65.3 8.6 30.2 98.0 46.6 2 Wild buckwheat 55.9 14.9 26.6 1.7 3.0 13.8 25.3 3 Canola/rapeseed 22.6 14.2 62.9 2.7 11.9 28.8 22.1 4 Pale smartweed 30.0 11.0 36.8 2.3 7.8 24.8 20.4 5 Barnyard grass species 30.9 9.5 30.8 1.7 5.4 18.4 17.4 6 Night-flowering catchfly 23.2 11.8 51.0 1.3 5.6 9.4 16.0 7 Dandelion 29.7 10.0 33.7 1.0 3.3 7.8 15.1 8 Canada thistle 30.5 8.2 26.9 0.8 2.6 8.8 13.4 9 Wild oats 22.7 8.8 38.6 1.0 4.5 6.2 13.1 10 Yellow foxtail 22.1 6.4 28.8 1.1 5.1 13.6 11.9 11 Broad-leaved plantain 7.2 5.7 80.0 1.6 21.6 21.6 10.2 12 Biennial wormwood 22.2 6.0 26.9 0.5 2.5 6.0 9.7 13 Redroot pigweed 22.6 5.2 23.1 0.6 2.5 6.0 9.4 14 Tartary buckwheat 7.2 6.5 90.0 0.7 10.2 10.2 7.8 15 Absinth 7.2 3.2 45.0 1.3 17.6 17.6 7.7 16 Wild mustard 16.2 4.5 27.5 0.2 1.3 1.8 6.5 17 Perennial sow-thistle 14.8 2.9 19.6 0.3 2.1 4.2 5.6 18 Clover species 7.2 3.2 45.0 0.3 4.0 4.0 4.3 19 Round-leaved mallow 15.5 1.1 7.4 0.1 0.6 1.0 3.9 20 Shepherd's-purse 7.9 2.7 35.0 0.1 1.4 1.4 3.5 21 Kochia 7.4 1.8 25.0 0.3 3.6 3.6 3.4 22 Soybean 13.8 0.7 5.0 < 0.1 0.2 0.2 3.1 23 Spiny annual sow-thistle 8.1 2.0 25.0 0.1 1.2 1.2 3.1 24 Yellow sweet-clover 7.2 1.4 20.0 0.1 2.0 2.0 2.7 25 Lamb's-quarters 7.2 1.1 15.0 0.1 1.4 1.4 2.4 26 Rough cinquefoil 7.2 1.1 15.0 0.1 0.8 0.8 2.2 27 Marsh yellow cress 7.6 0.8 10.0 0.1 0.8 0.8 2.1 28 Thyme-leaved spurge 7.6 0.8 10.0 < 0.1 0.4 0.4 2.0 29 Prostrate knotweed 7.2 0.7 10.0 0.1 0.8 0.8 2.0 30 Stink grass 7.9 0.4 5.0 < 0.1 0.2 0.2 1.8 31 Black medick 7.9 0.4 5.0 < 0.1 0.2 0.2 1.8 32 Water smartweed 7.6 0.4 5.0 < 0.1 0.2 0.2 1.7 33 Foxtail barley 6.2 0.6 10.0 < 0.1 0.6 0.6 1.7

Field Survey Summary Tables – Sunflower in the Central Crop Reporting District
95
Table 55. 2016 Sunflower in the Central Crop Reporting District (11 fields) Frequency Field Uniformity Field Density (#/m2) Relative
Rank Species (%) All Occurrence All Occurrence High Abundance 1 Green foxtail 36.4 18.7 51.4 2.5 6.9 17.6 32.4 2 Canola/rapeseed 35.7 14.2 39.8 1.3 3.6 8.0 21.9 3 Wild oats 26.5 10.8 40.9 1.7 6.4 12.2 21.2 4 Round-leaved mallow 54.5 11.2 20.5 0.8 1.4 3.8 19.5 5 Wild buckwheat 63.4 10.4 16.5 0.6 1.0 3.6 19.4 6 Biennial wormwood 36.0 13.0 36.2 0.8 2.1 4.4 17.8 7 Pale smartweed 35.7 7.2 20.0 0.8 2.2 6.2 14.5 8 Wheat 27.4 6.9 25.0 0.7 2.6 3.8 12.6 9 Perennial sow-thistle 35.8 7.2 20.2 0.3 1.0 1.6 11.6 10 Purslane 28.2 6.2 21.8 0.6 2.1 5.6 11.5 11 Field horsetail 9.2 5.1 55.0 1.1 11.4 11.4 11.1 12 Canada thistle 35.4 6.6 18.7 0.3 0.9 1.4 11.1 13 Spiny annual sow-thistle 17.8 7.1 40.0 0.5 3.0 5.4 10.3 14 Redroot pigweed 27.7 5.5 19.9 0.4 1.6 2.8 10.1 15 Annual sow-thistle 8.6 4.8 55.0 0.7 7.6 7.6 8.3 16 Barnyard grass species 18.2 4.6 25.2 0.3 1.5 2.4 7.1 17 Yellow foxtail 9.5 1.9 20.0 0.7 7.0 7.0 6.8 18 Wild mustard 18.2 4.1 22.6 0.2 1.1 1.6 6.4 19 Golden dock 19.0 3.8 20.0 0.2 1.1 1.8 6.3 20 Stork's bill 17.6 3.1 17.5 0.2 1.1 1.6 5.6 21 Toad rush 9.2 3.7 40.0 0.3 3.4 3.4 5.5 22 Lamb's-quarters 17.9 1.3 7.5 0.1 0.4 0.4 3.8 23 Marsh yellow cress 9.5 2.4 25.0 0.1 1.0 1.0 3.4 24 Kochia 17.9 0.9 5.0 < 0.1 0.2 0.2 3.3 25 Thyme-leaved spurge 17.8 0.9 5.0 < 0.1 0.2 0.2 3.3 26 Corn 9.2 1.8 20.0 0.1 1.0 1.0 3.0 27 Dandelion 8.6 1.7 20.0 0.1 0.8 0.8 2.7 28 Willow species 9.5 1.0 10.0 0.1 0.8 0.8 2.4 29 Oats 9.5 0.5 5.0 < 0.1 0.4 0.4 1.9 30 False ragweed 9.0 0.4 5.0 < 0.1 0.2 0.2 1.7 31 Foxtail barley 8.9 0.4 5.0 < 0.1 0.2 0.2 1.7 32 Common ragweed 8.9 0.4 5.0 < 0.1 0.2 0.2 1.7

Field Survey Summary Tables – Eastern Crop Reporting District
96
Table 56. 2016 Annual crops in the Eastern Crop Reporting District (59 fields) Frequency Field Uniformity Field Density (#/m2) Relative
Rank Species (%) All Occurrence All Occurrence High Abundance 1 Yellow foxtail 21.3 8.5 40.0 3.2 15.1 82.8 38.8 2 Wild buckwheat 54.7 9.4 17.1 0.7 1.2 12.0 27.7 3 Barnyard grass species 32.2 6.7 20.7 1.0 3.0 35.0 22.0 4 Broad-leaved plantain 25.8 7.2 28.0 0.9 3.6 32.2 20.9 5 Dandelion 25.1 7.0 28.0 0.9 3.5 24.6 20.1 6 Redroot pigweed 29.2 6.1 21.0 0.5 1.9 14.4 17.4 7 Wheat 23.1 5.0 21.5 0.5 2.0 5.8 14.1 8 Pale smartweed 32.5 3.3 10.2 0.2 0.5 1.8 12.1 9 Canola/rapeseed 17.2 4.1 24.0 0.4 2.5 10.4 11.7 10 Lamb's-quarters 21.1 3.7 17.8 0.3 1.5 4.8 11.2 11 Biennial wormwood 13.4 3.5 26.5 0.5 3.9 22.8 10.9 12 Night-flowering catchfly 5.5 1.3 23.5 0.8 15.1 52.0 9.1 13 Field horsetail 9.9 1.8 18.1 0.5 5.1 25.6 8.1 14 Oak-leaved goosefoot 10.9 2.1 19.6 0.4 3.3 16.2 7.5 15 Wild oats 10.9 1.4 12.5 0.4 4.0 21.8 7.3 16 Marsh yellow cress 12.1 1.8 14.8 0.2 1.4 4.8 6.0 17 Perennial sow-thistle 3.5 1.7 47.4 0.4 12.2 24.2 5.9 18 Round-leaved mallow 10.7 1.8 16.9 0.1 1.2 2.0 5.3 19 Green foxtail 6.0 1.1 18.8 0.3 5.1 18.4 4.9 20 Clover species 7.4 2.0 26.7 0.1 1.3 2.6 4.6 21 Spiny annual sow-thistle 9.0 1.3 14.4 0.1 0.7 1.6 3.9 22 Canada thistle 6.5 1.0 15.7 0.1 1.7 3.6 3.4 23 Shepherd's-purse 4.4 0.8 19.2 0.1 1.2 2.0 2.3 24 Dock species 5.5 0.5 9.3 < 0.1 0.5 1.2 2.0 25 Thyme-leaved spurge 6.4 0.3 5.0 < 0.1 0.2 0.2 1.9 26 Purslane 5.8 0.4 6.5 < 0.1 0.3 0.4 1.8 27 Golden dock 3.5 0.6 16.6 < 0.1 1.4 1.8 1.8 28 Cocklebur 1.8 0.8 45.0 0.1 3.8 3.8 1.8 29 Bird's-foot trefoil 3.7 0.5 14.8 < 0.1 1.1 1.4 1.7 30 Black medick 3.3 0.6 19.4 < 0.1 1.0 1.8 1.7 31 Rough cinquefoil 3.7 0.3 9.2 < 0.1 1.0 2.2 1.5 32 Soybean 3.4 0.5 14.3 < 0.1 0.8 1.4 1.5 33 Wild mustard 3.2 0.3 10.0 < 0.1 0.4 0.4 1.1 34 Alfalfa 2.9 0.1 5.0 < 0.1 0.2 0.2 0.8 35 Oats 1.8 0.3 15.0 < 0.1 0.8 0.8 0.8 36 Stinkweed 1.8 0.2 10.0 < 0.1 0.6 0.6 0.7 37 Quack grass 1.1 0.2 20.0 < 0.1 1.6 1.6 0.6 38 Manitoba maple 1.8 0.2 10.0 < 0.1 0.4 0.4 0.6 39 Foxtail barley 2.2 0.1 5.0 < 0.1 0.2 0.2 0.6 40 Blue-joint 1.6 0.1 5.0 < 0.1 1.6 1.6 0.6 41 American vetch 1.9 0.1 5.0 < 0.1 0.4 0.4 0.6 42 Hemp-nettle 1.7 0.1 5.0 < 0.1 0.2 0.2 0.5 43 Canada fleabane 1.6 0.1 5.0 < 0.1 0.4 0.4 0.5 44 Bladder campion 1.6 0.1 5.0 < 0.1 0.2 0.2 0.5 45 Orchard grass 1.6 0.1 5.0 < 0.1 0.2 0.2 0.5 46 Common ragweed 1.0 0.1 10.0 < 0.1 0.4 0.4 0.4 47 Sunflower 1.0 0.1 10.0 < 0.1 0.4 0.4 0.4

Field Survey Summary Tables – Canola in the Eastern Crop Reporting District
97
Table 57. 2016 Canola in the Eastern Crop Reporting District (15 fields) Frequency Field Uniformity Field Density (#/m2) Relative
Rank Species (%) All Occurrence All Occurrence High Abundance 1 Yellow foxtail 34.6 20.1 58.1 8.7 25.2 82.8 77.5 2 Wild buckwheat 58.7 9.8 16.7 1.1 1.8 12.0 29.9 3 Pale smartweed 52.6 5.9 11.2 0.3 0.5 1.6 19.9 4 Wheat 40.3 6.7 16.7 0.5 1.3 3.4 19.4 5 Barnyard grass species 39.7 6.2 15.6 0.4 1.0 3.2 18.0 6 Dandelion 25.7 6.6 25.5 0.5 1.8 6.0 15.7 7 Perennial sow-thistle 6.1 5.5 90.0 1.5 24.2 24.2 15.6 8 Oak-leaved goosefoot 15.0 4.8 31.8 1.1 7.6 16.2 14.9 9 Field horsetail 6.1 4.3 70.0 1.6 25.6 25.6 14.7 10 Wild oats 6.1 2.5 40.0 1.3 21.8 21.8 11.4 11 Broad-leaved plantain 20.6 3.8 18.5 0.3 1.5 3.2 10.6 12 Redroot pigweed 28.5 2.8 10.0 0.1 0.4 0.8 10.3 13 Canada thistle 12.8 2.6 20.0 0.3 2.5 3.6 7.5 14 Lamb's-quarters 21.2 1.1 5.0 0.1 0.6 0.8 6.6 15 Marsh yellow cress 6.1 1.5 25.0 0.2 3.4 3.4 4.2 16 Golden dock 8.3 1.2 15.0 0.1 1.2 1.2 3.8 17 Clover species 6.7 1.3 20.0 0.1 1.0 1.0 3.4 18 Bird's-foot trefoil 6.7 0.7 10.0 0.1 0.8 0.8 2.6 19 Night-flowering catchfly 8.3 0.4 5.0 < 0.1 0.2 0.2 2.4 20 Dock species 6.7 0.7 10.0 < 0.1 0.4 0.4 2.4 21 American vetch 6.7 0.3 5.0 < 0.1 0.4 0.4 2.0 22 Hemp-nettle 6.1 0.3 5.0 < 0.1 0.2 0.2 1.8 23 Black medick 6.1 0.3 5.0 < 0.1 0.2 0.2 1.8 24 Spiny annual sow-thistle 6.1 0.3 5.0 < 0.1 0.2 0.2 1.8 25 Thyme-leaved spurge 6.1 0.3 5.0 < 0.1 0.2 0.2 1.8

Field Survey Summary Tables – Soybean in the Eastern Crop Reporting District
98
Table 58. 2016 Soybean in the Eastern Crop Reporting District (23 fields) Frequency Field Uniformity Field Density (#/m2) Relative
Rank Species (%) All Occurrence All Occurrence High Abundance 1 Redroot pigweed 42.6 12.2 28.7 1.2 2.8 14.4 28.3 2 Dandelion 30.3 10.1 33.2 1.6 5.4 24.6 27.4 3 Barnyard grass species 32.3 6.6 20.5 1.6 4.9 35.0 24.3 4 Wild buckwheat 61.7 9.3 15.1 0.5 0.8 2.0 23.5 5 Biennial wormwood 26.9 7.8 28.9 1.2 4.5 22.8 21.5 6 Night-flowering catchfly 8.0 3.0 37.2 2.1 26.1 52.0 20.4 7 Broad-leaved plantain 25.1 8.1 32.5 0.9 3.5 16.4 18.9 8 Canola/rapeseed 33.2 7.3 22.0 0.7 2.0 10.4 17.9 9 Wheat 22.6 6.7 29.6 0.7 3.0 5.8 15.6 10 Marsh yellow cress 26.0 3.4 13.0 0.3 1.1 4.8 10.0 11 Pale smartweed 30.7 2.6 8.6 0.1 0.4 1.8 8.9 12 Clover species 13.9 4.0 29.0 0.2 1.4 2.6 7.7 13 Yellow foxtail 17.2 3.0 17.6 0.2 1.1 1.8 7.3 14 Lamb's-quarters 12.8 2.7 21.3 0.3 2.1 3.8 6.9 15 Field horsetail 20.5 1.4 7.0 0.2 0.7 1.4 6.1 16 Round-leaved mallow 12.4 2.0 16.1 0.1 1.0 1.6 5.1 17 Wild oats 17.8 0.9 5.0 < 0.1 0.2 0.4 4.3 18 Cocklebur 4.4 2.0 45.0 0.2 3.8 3.8 3.9 19 Shepherd's-purse 8.0 1.8 22.5 0.1 1.1 2.0 3.8 20 Oak-leaved goosefoot 9.9 1.6 16.1 0.1 0.6 1.0 3.7 21 Rough cinquefoil 9.4 0.9 9.2 0.1 1.0 2.2 3.2 22 Purslane 12.0 0.8 6.8 < 0.1 0.3 0.4 3.1 23 Spiny annual sow-thistle 8.0 1.3 16.2 0.1 0.8 1.6 3.1 24 Dock species 9.0 0.8 9.0 0.1 0.6 1.2 2.8 25 Black medick 4.0 1.4 35.0 0.1 1.8 1.8 2.6 26 Wild mustard 8.0 0.8 10.0 < 0.1 0.4 0.4 2.4 27 Thyme-leaved spurge 8.8 0.4 5.0 < 0.1 0.2 0.2 2.1 28 Bird's-foot trefoil 4.4 0.9 20.0 0.1 1.4 1.4 2.1 29 Green foxtail 8.0 0.4 5.0 < 0.1 0.3 0.4 2.0 30 Oats 4.4 0.7 15.0 < 0.1 0.8 0.8 1.7 31 Stinkweed 4.4 0.4 10.0 < 0.1 0.6 0.6 1.4 32 Canada thistle 4.4 0.4 10.0 < 0.1 0.6 0.6 1.4 33 Manitoba maple 4.4 0.4 10.0 < 0.1 0.4 0.4 1.3 34 Foxtail barley 5.5 0.3 5.0 < 0.1 0.2 0.2 1.3 35 Perennial sow-thistle 4.4 0.2 5.0 < 0.1 0.2 0.2 1.1 36 Canada fleabane 4.0 0.2 5.0 < 0.1 0.4 0.4 1.0 37 Bladder campion 4.0 0.2 5.0 < 0.1 0.2 0.2 1.0 38 Alfalfa 4.0 0.2 5.0 < 0.1 0.2 0.2 1.0

Field Survey Summary Tables – Interlake Crop Reporting District
99
Table 59. 2016 Annual crops in the Interlake Crop Reporting District (63 fields) Frequency Field Uniformity Field Density (#/m2) Relative
Rank Species (%) All Occurrence All Occurrence High Abundance 1 Wild buckwheat 42.7 6.0 14.1 0.3 0.8 3.6 27.2 2 Yellow foxtail 3.5 2.2 61.7 1.3 38.0 69.6 23.2 3 Canola/rapeseed 23.6 5.5 23.3 0.3 1.5 4.0 20.8 4 Barnyard grass species 25.9 4.5 17.3 0.4 1.6 7.0 20.7 5 Dandelion 28.6 4.7 16.5 0.3 1.0 5.0 20.2 6 Green foxtail 12.4 3.9 31.8 0.6 4.7 15.6 18.1 7 Wheat 10.5 3.4 32.5 0.6 5.6 22.0 16.9 8 Broad-leaved plantain 15.8 3.7 23.3 0.3 1.9 9.6 14.9 9 Wild oats 14.0 3.0 21.3 0.4 2.9 13.6 14.7 10 Quack grass 1.2 1.0 80.0 0.8 68.6 68.6 13.6 11 Perennial sow-thistle 8.0 3.3 41.4 0.2 3.0 5.8 11.1 12 Field horsetail 3.3 1.4 41.8 0.3 10.5 20.0 8.1 13 Redroot pigweed 11.0 2.0 17.9 0.1 0.9 4.0 7.9 14 Pale smartweed 13.3 1.5 11.0 0.1 0.5 1.2 7.4 15 Canada thistle 10.4 1.1 10.6 0.1 1.1 4.6 6.5 16 Biennial wormwood 6.8 1.5 21.7 0.1 1.9 8.0 6.2 17 Lamb's-quarters 9.1 1.3 14.6 0.1 0.9 3.2 6.0 18 Rough cinquefoil 4.9 0.9 18.8 0.1 2.0 2.8 4.3 19 Dock species 5.3 0.9 16.5 0.1 1.6 3.2 4.2 20 Shepherd's-purse 7.5 0.5 7.3 < 0.1 0.6 1.4 3.8 21 Night-flowering catchfly 5.3 0.8 14.6 0.1 1.0 2.6 3.6 22 Spiny annual sow-thistle 6.5 0.7 11.2 < 0.1 0.4 0.6 3.5 23 Oak-leaved goosefoot 6.8 0.6 9.0 < 0.1 0.4 0.6 3.5 24 Oats 3.6 1.0 26.7 < 0.1 1.3 2.4 3.3 25 Yellow sweet-clover 1.7 0.9 50.0 0.1 3.0 3.0 2.6 26 Rayless aster 2.2 0.8 36.3 < 0.1 2.1 2.6 2.6 27 Black medick 5.3 0.4 8.1 < 0.1 0.3 0.4 2.6 28 Foxtail barley 2.3 0.4 18.8 < 0.1 1.0 1.2 1.7 29 Alfalfa 3.6 0.3 7.6 < 0.1 0.4 0.6 1.7 30 Soybean 2.8 0.4 12.7 < 0.1 0.6 2.4 1.6 31 Clover species 2.2 0.4 17.2 < 0.1 1.2 2.6 1.6 32 Purslane 1.3 0.4 30.0 < 0.1 2.6 2.6 1.4 33 American vetch 3.5 0.2 5.0 < 0.1 0.2 0.2 1.4 34 Round-leaved mallow 3.2 0.2 5.0 < 0.1 0.3 0.4 1.4 35 Stinkweed 2.2 0.3 15.0 < 0.1 0.6 0.6 1.4 36 Sedge species 1.7 0.3 15.0 < 0.1 0.6 0.6 1.1 37 Willow species 2.1 0.2 8.9 < 0.1 0.4 0.4 1.1 38 False cleavers 2.0 0.2 8.9 < 0.1 0.4 0.4 1.0 39 Kochia 1.9 0.2 10.0 < 0.1 0.4 0.4 1.0 40 Thyme-leaved spurge 1.9 0.2 10.0 < 0.1 0.4 0.4 1.0 41 Bicknell's geranium 2.1 0.1 6.2 < 0.1 0.2 0.4 0.9 42 Dog mustard 1.5 0.2 10.0 < 0.1 0.4 0.4 0.8 43 Narrow-leaved hawk's-beard 1.9 0.1 5.0 < 0.1 0.2 0.2 0.8 44 Nightshade species 1.7 0.1 5.0 < 0.1 0.2 0.2 0.7 45 American dragonhead 1.7 0.1 5.0 < 0.1 0.2 0.2 0.7 46 Hemp-nettle 1.6 0.1 5.0 < 0.1 0.2 0.2 0.7 47 Aster species 0.5 < 0.1 10.0 < 0.1 0.4 0.4 0.3 48 Marsh yellow cress 0.4 < 0.1 5.0 < 0.1 0.2 0.2 0.2

Field Survey Summary Tables – Canola in the Interlake Crop Reporting District
100
Table 60. 2016 Canola in the Interlake Crop Reporting District (15 fields) Frequency Field Uniformity Field Density (#/m2) Relative
Rank Species (%) All Occurrence All Occurrence High Abundance 1 Yellow foxtail 13.4 8.3 61.7 5.1 38.0 69.6 65.1 2 Wild buckwheat 44.7 6.6 14.8 0.4 0.9 3.6 24.2 3 Broad-leaved plantain 23.5 7.5 31.8 0.8 3.5 9.6 24.1 4 Perennial sow-thistle 13.4 7.1 53.2 0.6 4.5 5.8 19.0 5 Pale smartweed 34.7 4.2 12.2 0.2 0.6 1.2 16.6 6 Barnyard grass species 26.9 4.3 16.2 0.3 1.2 3.2 15.8 7 Wild oats 20.5 4.2 20.4 0.3 1.5 2.0 13.9 8 Green foxtail 14.2 3.5 25.0 0.3 2.4 4.6 11.7 9 Dandelion 14.2 3.9 27.5 0.2 1.3 1.8 10.7 10 Wheat 13.4 3.2 23.5 0.3 2.2 4.0 10.6 11 Biennial wormwood 7.1 3.5 50.0 0.3 3.6 3.6 9.1 12 Dock species 14.2 2.1 15.0 0.2 1.7 3.2 8.9 13 Night-flowering catchfly 13.4 2.6 19.4 0.2 1.4 2.6 8.8 14 Redroot pigweed 17.1 2.3 13.5 0.1 0.7 1.4 8.7 15 Shepherd's-purse 13.5 1.0 7.7 0.1 1.0 1.4 6.2 16 Rough cinquefoil 7.1 1.8 25.0 0.2 2.8 2.8 6.2 17 Canada thistle 14.2 1.1 7.5 < 0.1 0.3 0.4 5.5 18 Spiny annual sow-thistle 12.7 1.3 10.0 0.1 0.4 0.6 5.4 19 Lamb's-quarters 13.4 0.7 5.0 < 0.1 0.3 0.4 4.7 20 Oak-leaved goosefoot 7.1 1.1 15.0 < 0.1 0.6 0.6 3.7 21 Alfalfa 7.1 0.7 10.0 < 0.1 0.6 0.6 3.2 22 Kochia 7.1 0.7 10.0 < 0.1 0.4 0.4 3.0 23 Thyme-leaved spurge 7.1 0.7 10.0 < 0.1 0.4 0.4 3.0 24 Willow species 6.3 0.6 10.0 < 0.1 0.4 0.4 2.7 25 Narrow-leaved hawk's-beard 7.2 0.4 5.0 < 0.1 0.2 0.2 2.4 26 Oats 7.1 0.4 5.0 < 0.1 0.2 0.2 2.4 27 Round-leaved mallow 6.3 0.3 5.0 < 0.1 0.4 0.4 2.3 28 American dragonhead 6.3 0.3 5.0 < 0.1 0.2 0.2 2.2

Field Survey Summary Tables – Spring Wheat in the Interlake Crop Reporting District
101
Table 61. 2016 Spring wheat in the Interlake Crop Reporting District (19 fields) Frequency Field Uniformity Field Density (#/m2) Relative
Rank Species (%) All Occurrence All Occurrence High Abundance 1 Field horsetail 5.1 3.0 60.0 1.0 20.0 20.0 44.1 2 Wild oats 11.4 3.7 32.5 0.8 7.2 13.6 43.0 3 Wild buckwheat 34.9 4.3 12.5 0.2 0.7 2.8 38.3 4 Lamb's-quarters 10.8 3.3 30.8 0.2 2.1 3.2 22.9 5 Dandelion 22.6 1.7 7.4 0.1 0.4 0.8 19.3 6 Canola/rapeseed 12.5 2.6 21.1 0.1 1.2 3.8 19.2 7 Broad-leaved plantain 15.2 1.5 10.0 0.1 0.5 1.0 14.6 8 Redroot pigweed 6.8 2.1 31.3 0.1 1.6 4.0 13.5 9 Foxtail barley 7.4 1.4 18.8 0.1 1.0 1.2 10.5 10 Soybean 7.4 1.1 14.2 0.1 0.7 2.4 8.6 11 Barnyard grass species 10.2 0.8 7.5 < 0.1 0.3 0.4 8.4 12 Dock species 5.1 1.0 20.0 0.1 1.4 1.4 8.0 13 Canada thistle 5.1 0.8 15.0 0.1 1.0 1.0 6.5 14 Spiny annual sow-thistle 5.1 0.8 15.0 < 0.1 0.6 0.6 5.9 15 Green foxtail 5.7 0.3 5.0 < 0.1 0.6 0.6 4.8 16 Black medick 5.1 0.5 10.0 < 0.1 0.4 0.4 4.8 17 Shepherd's-purse 5.1 0.5 10.0 < 0.1 0.4 0.4 4.8 18 False cleavers 5.1 0.5 10.0 < 0.1 0.4 0.4 4.8 19 Night-flowering catchfly 5.7 0.3 5.0 < 0.1 0.2 0.2 4.1 20 American vetch 5.7 0.3 5.0 < 0.1 0.2 0.2 4.1 21 Bicknell's geranium 5.1 0.3 5.0 < 0.1 0.2 0.2 3.6 22 Hemp-nettle 5.1 0.3 5.0 < 0.1 0.2 0.2 3.6 23 Biennial wormwood 1.7 0.3 20.0 < 0.1 1.6 1.6 2.8

Field Survey Summary Tables – Soybean in the Interlake Crop Reporting District
102
Table 62. 2016 Soybean in the Interlake Crop Reporting District (19 fields) Frequency Field Uniformity Field Density (#/m2) Relative
Rank Species (%) All Occurrence All Occurrence High Abundance 1 Canola/rapeseed 48.2 11.0 22.8 0.7 1.5 4.0 42.7 2 Wheat 20.8 7.2 34.7 1.5 7.1 22.0 42.5 3 Wild buckwheat 47.5 7.2 15.2 0.4 0.8 2.0 31.2 4 Dandelion 36.1 7.2 19.9 0.5 1.4 5.0 30.3 5 Barnyard grass species 31.1 4.9 15.6 0.4 1.4 3.4 23.7 6 Green foxtail 5.5 3.0 55.0 0.7 12.2 12.2 17.9 7 Perennial sow-thistle 11.0 3.6 32.5 0.2 2.0 3.6 12.5 8 Broad-leaved plantain 10.4 2.6 25.0 0.1 1.1 1.2 9.0 9 Yellow sweet-clover 5.5 2.8 50.0 0.2 3.0 3.0 8.6 10 Oats 5.5 2.8 50.0 0.1 2.4 2.4 8.1 11 Rayless aster 5.5 2.5 45.0 0.1 2.6 2.6 7.8 12 Rough cinquefoil 9.8 1.5 15.0 0.1 1.5 1.6 7.6 13 Canada thistle 4.9 1.2 25.0 0.2 4.6 4.6 7.2 14 Field horsetail 5.5 1.4 25.0 0.1 1.8 1.8 5.4 15 Oak-leaved goosefoot 10.4 0.8 7.6 < 0.1 0.4 0.6 5.0 16 Black medick 10.4 0.8 7.7 < 0.1 0.3 0.4 4.8 17 Pale smartweed 10.4 0.8 7.3 < 0.1 0.3 0.4 4.7 18 Biennial wormwood 11.0 0.5 5.0 < 0.1 0.3 0.4 4.6 19 Wild oats 5.5 1.1 20.0 0.1 1.0 1.0 4.2 20 Sedge species 5.5 0.8 15.0 < 0.1 0.6 0.6 3.4 21 Clover species 5.5 0.6 10.0 < 0.1 0.8 0.8 3.2 22 Dog mustard 4.9 0.5 10.0 < 0.1 0.4 0.4 2.5 23 Spiny annual sow-thistle 4.9 0.5 10.0 < 0.1 0.4 0.4 2.5 24 American vetch 5.5 0.3 5.0 < 0.1 0.2 0.2 2.2 25 Alfalfa 5.5 0.3 5.0 < 0.1 0.2 0.2 2.2 26 Nightshade species 5.5 0.3 5.0 < 0.1 0.2 0.2 2.2 27 Round-leaved mallow 4.9 0.2 5.0 < 0.1 0.2 0.2 2.0 28 Redroot pigweed 4.9 0.2 5.0 < 0.1 0.2 0.2 2.0

Field Survey Summary Tables – Number of Fields Surveyed by Municipality
103
Table 63. Number of fields surveyed in each municipality Crop Reporting District and Municipal Group Municipality Number of Fields Southwest Brenda-Waskada, Boissevain-Morton & Deloraine-Winchester Brenda-Waskada 8 Boissevain-Morton 7 Deloraine-Winchester 7 Elton 7 Elton & Cornwallis Cornwallis 4 Grassland Grassland 12 Harrison Park Harrison Park 10 Killarney-Turtle Mountain & Prairie Lakes Killarney-Turtle Mountain 9 Prairie Lakes 8 Minto-Odanah, Rosedale & Clanwilliam-Erickson Minto-Odanah 6 Rosedale 5 Clanwilliam-Erickson 1 North Cypress-Langford North Cypress-Langford 14 Oakland-Wawanesa & Glenboro-South Cypress Oakland-Wawanesa 6 Glenboro-South Cypress 5 Oakview & Hamiota Oakview 10 Hamiota 6 Pipestone, Souris-Glenwood & Sifton Pipestone 5 Souris-Glenwood 5 Sifton 3 Prairie View & Ellice-Archie Prairie View 14 Ellice-Archie 6 Riverdale & Whitehead Riverdale 5 Whitehead 5 Two Borders Two Borders 12 Wallace-Woodworth Wallace-Woodworth 12 Yellowhead Yellowhead 12 Northwest Gilbert Plains, Dauphin & Mossey River Gilbert Plains 6 Dauphin 4 Mossey River 3 Grandview & Ethelbert Grandview 8 Ethelbert 2 Minitonas-Bowsman, Mountain & Kelsey Minitonas-Bowsman 7 Mountain 4 Kelsey 1 Riding Mountain West, Roblin, Rossburn & Russell-Binscarth Riding Mountain West 14 Roblin 8 Rossburn 5 Russell-Binscarth 4 Ste. Rose, Lakeshore, McCreary & Alonsa Lakeshore 3 McCreary 3 Ste. Rose 3 Alonsa 2 Swan Valley West Swan Valley West 13
(Table continued on next page)
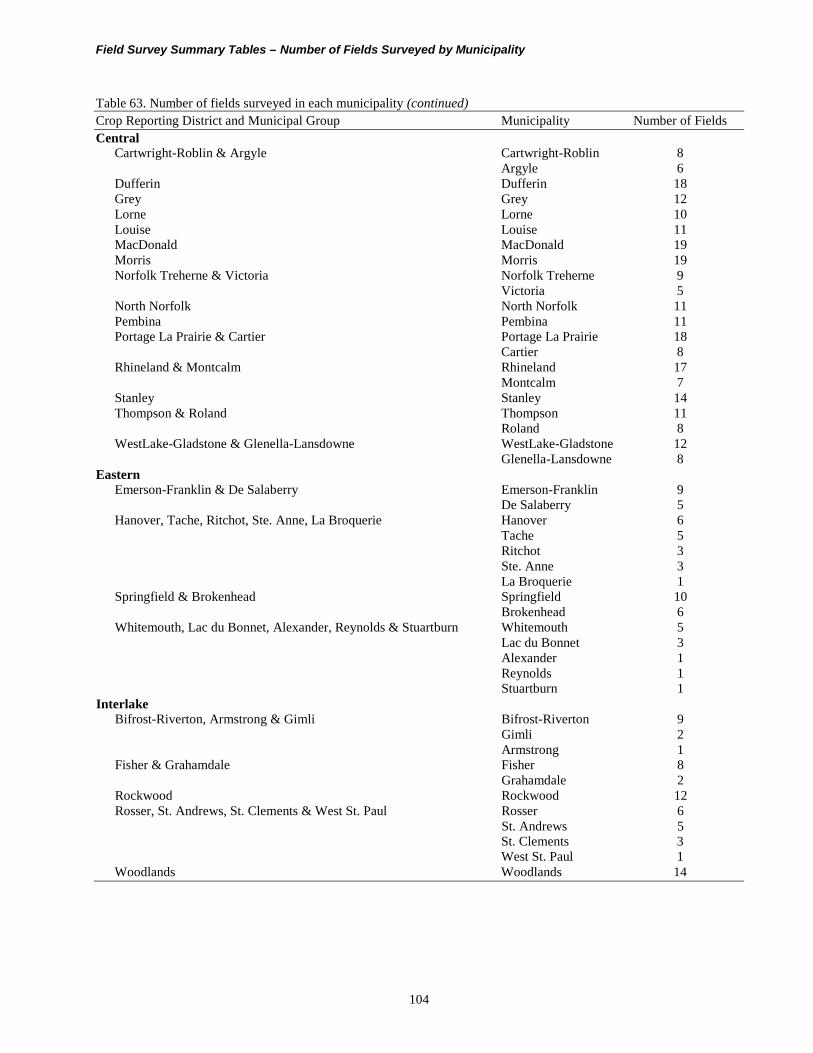
Field Survey Summary Tables – Number of Fields Surveyed by Municipality
104
Table 63. Number of fields surveyed in each municipality (continued) Crop Reporting District and Municipal Group Municipality Number of Fields Central Cartwright-Roblin & Argyle Cartwright-Roblin 8 Argyle 6 Dufferin Dufferin 18 Grey Grey 12 Lorne Lorne 10 Louise Louise 11 MacDonald MacDonald 19 Morris Morris 19 Norfolk Treherne & Victoria Norfolk Treherne 9 Victoria 5 North Norfolk North Norfolk 11 Pembina Pembina 11 Portage La Prairie & Cartier Portage La Prairie 18 Cartier 8 Rhineland & Montcalm Rhineland 17 Montcalm 7 Stanley Stanley 14 Thompson & Roland Thompson 11 Roland 8 WestLake-Gladstone & Glenella-Lansdowne WestLake-Gladstone 12 Glenella-Lansdowne 8 Eastern Emerson-Franklin & De Salaberry Emerson-Franklin 9 De Salaberry 5 Hanover, Tache, Ritchot, Ste. Anne, La Broquerie Hanover 6 Tache 5 Ritchot 3 Ste. Anne 3 La Broquerie 1 Springfield & Brokenhead Springfield 10 Brokenhead 6 Whitemouth, Lac du Bonnet, Alexander, Reynolds & Stuartburn Whitemouth 5 Lac du Bonnet 3 Alexander 1 Reynolds 1 Stuartburn 1 Interlake Bifrost-Riverton, Armstrong & Gimli Bifrost-Riverton 9 Gimli 2 Armstrong 1 Fisher & Grahamdale Fisher 8 Grahamdale 2 Rockwood Rockwood 12 Rosser, St. Andrews, St. Clements & West St. Paul Rosser 6 St. Andrews 5 St. Clements 3 West St. Paul 1 Woodlands Woodlands 14

Field Survey Summary Tables – Density, Species Richness and Weed-Free Quadrats by Municipality
105
Table 64. Density, species richness and weed-free quadrats in each municipality Number of Density Species Weed-free fields surveyed (number/m2) (number/field) quadrats Area mean SE median mean SE % SE Southwest Brenda-Waskada, Boissevain-Morton & Deloraine-Winchester 22 9.0 2.8 3.9 3.6 0.4 45.2 10.6 Elton & Cornwallis 11 5.4 0.7 4.6 4.0 0.3 31.6 14.0 Grassland 12 5.7 1.3 3.4 4.0 0.3 47.9 14.4 Harrison Park 10 25.7 6.5 18.9 6.6 0.7 15.7 11.5 Killarney-Turtle Mountain & Prairie Lakes 17 18.7 5.8 10.9 4.8 0.5 33.1 11.4 Minto-Odanah, Rosedale & Clanwilliam-Erickson 12 40.3 9.1 25.2 7.0 0.9 9.8 8.6 North Cypress-Langford 14 30.5 6.5 26.6 4.6 0.8 26.7 11.8 Oakland-Wawanesa & Glenboro-South Cypress 11 10.5 4.4 4.3 3.9 0.5 33.0 14.2 Oakview & Hamiota 16 22.9 7.1 12.6 7.0 0.8 24.3 10.7 Pipestone, Souris-Glenwood & Sifton 13 18.0 5.8 8.6 4.7 0.4 29.0 12.6 Prairie View & Ellice-Archie 20 5.5 0.7 5.3 5.3 0.4 37.0 10.8 Riverdale & Whitehead 10 11.6 3.9 5.1 5.0 0.7 21.1 12.9 Two Borders 12 18.0 6.1 3.4 3.9 0.4 36.4 13.9 Wallace-Woodworth 12 12.6 2.9 10.2 6.4 0.9 34.7 13.7 Yellowhead 12 16.2 8.2 5.7 5.0 0.7 30.2 13.3 Northwest Gilbert Plains, Dauphin & Mossey River 13 11.0 6.5 1.6 3.5 1.0 63.8 13.3 Grandview & Ethelbert 10 46.1 13.8 27.7 8.3 0.8 7.2 8.2 Minitonas-Bowsman, Mountain & Kelsey 12 4.1 1.6 0.7 1.7 0.4 67.5 13.5 Riding Mountain West, Roblin, Rossburn & Russell-Binscarth 31 12.0 2.1 7.3 5.3 0.4 31.2 8.3 Ste. Rose, Lakeshore, McCreary & Alonsa 11 18.0 8.1 1.9 4.0 1.2 57.5 14.9 Swan Valley West 13 3.5 1.6 0.2 2.1 0.6 72.3 12.4 Central Cartwright-Roblin & Argyle 14 13.5 3.5 8.3 5.2 0.4 27.3 11.9 Dufferin 18 13.1 4.3 5.3 5.3 0.8 37.6 11.4 Grey 12 9.1 3.5 2.8 3.9 0.8 45.4 14.4 Lorne 10 15.1 5.8 6.8 3.9 0.9 38.0 15.4 Louise 11 6.0 2.9 1.3 4.9 1.0 58.1 14.9 MacDonald 19 10.7 4.3 3.4 3.3 0.7 58.2 11.3 Morris 19 24.4 11.0 8.3 5.9 1.0 39.3 11.2 Norfolk Treherne & Victoria 14 30.5 11.4 10.3 6.4 1.0 28.1 12.0 North Norfolk 11 36.1 10.9 20.9 6.6 1.0 21.6 12.4 Pembina 11 19.0 9.6 4.8 5.2 1.0 37.4 14.6 Portage La Prairie & Cartier 26 8.0 3.4 1.4 2.8 0.4 66.4 9.3 Rhineland & Montcalm 24 3.5 0.7 2.6 2.9 0.5 60.8 10.0 Stanley 14 12.4 3.8 5.4 5.1 0.6 34.8 12.7 Thompson & Roland 19 10.1 2.4 6.0 4.8 0.4 31.0 10.6 WestLake-Gladstone & Glenella-Lansdowne 20 53.0 20.4 8.4 8.2 1.4 33.2 10.5
(Table continued on next page)

Field Survey Summary Tables – Density, Species Richness and Weed-Free Quadrats by Municipality
106
Table 64. Density, species richness and weed-free quadrats in each municipality (continued) Number of Density Species Weed-free fields surveyed (number/m2) (number/field) quadrats Area mean SE median mean SE % SE Eastern Emerson-Franklin & De Salaberry 14 9.3 2.6 2.3 6.3 1.2 43.7 13.3 Hanover, Tache, Ritchot, Ste. Anne, & La Broquerie 18 11.4 5.5 2.7 3.8 0.6 54.7 11.7 Springfield & Brokenhead 16 15.0 6.9 2.2 3.3 0.7 57.1 12.4 Whitemouth, Lac du Bonnet, Alexander, Reynolds & Stuartburn 11 18.4 6.7 4.7 5.3 1.1 40.2 14.8 Interlake Bifrost-Riverton, Armstrong & Gimli 12 9.4 2.8 2.1 4.3 0.8 46.4 14.4 Fisher & Grahamdale 10 6.3 2.1 2.3 5.7 1.0 44.5 15.7 Rockwood 12 9.9 6.7 1.3 2.7 0.7 64.8 13.8 Rosser, St. Andrews, St. Clements & West St. Paul 15 3.1 0.9 1.9 2.7 0.5 64.5 12.4 Woodlands 14 8.5 4.7 0.4 2.9 0.9 68.2 12.4

Field Survey Summary Tables – Brenda-Waskada, Boissevain-Morton & Deloraine-Winchester
107
Table 65. 2016 Annual crops in Brenda-Waskada, Boissevain-Morton & Deloraine-Winchester in the Southwest Crop Reporting District (22 fields)
Frequency Field Uniformity Field Density (#/m2) Relative Rank Species (%) All Occurrence All Occurrence High Abundance 1 Yellow foxtail 11.0 9.5 86.0 3.9 35.8 47.4 59.1 2 Wild buckwheat 69.4 15.1 21.7 0.9 1.3 4.4 48.2 3 Green foxtail 26.9 7.1 26.5 0.8 3.0 8.8 25.5 4 Round-leaved mallow 37.2 6.0 16.1 0.4 1.0 3.2 22.2 5 Kochia 18.5 5.1 27.5 0.4 2.1 4.0 15.9 6 Scouring-rush 6.6 5.3 80.0 0.4 6.6 6.6 13.4 7 Biennial wormwood 14.0 4.4 31.7 0.3 1.8 3.8 12.4 8 Wheat 14.0 3.3 23.3 0.3 2.0 5.2 11.2 9 Redroot pigweed 12.1 2.0 16.9 0.4 3.3 6.6 10.4 10 Canada thistle 21.4 2.4 11.0 0.1 0.5 0.6 10.1 11 Canola/rapeseed 13.2 2.9 21.7 0.2 1.1 1.6 9.0 12 Shepherd's-purse 14.0 1.6 11.7 0.1 0.6 1.4 6.9 13 Perennial sow-thistle 15.5 1.5 9.5 0.1 0.4 0.8 6.9 14 Purslane 4.7 2.3 50.0 0.2 4.2 4.2 6.5 15 Lamb's-quarters 9.0 1.4 15.2 0.1 1.2 2.0 5.5 16 Alfalfa 7.8 1.3 16.0 0.1 1.1 1.6 4.8 17 Stork's bill 4.7 1.9 40.0 0.1 1.8 1.8 4.6 18 Barnyard grass species 9.2 0.7 7.6 < 0.1 0.5 0.8 3.9 19 Thyme-leaved spurge 9.4 0.5 5.0 < 0.1 0.2 0.2 3.4 20 Golden dock 4.7 0.9 20.0 0.1 1.6 1.6 3.3 21 False cleavers 4.7 0.9 20.0 0.1 1.4 1.4 3.2 22 Foxtail barley 6.2 0.5 7.5 < 0.1 0.4 0.4 2.6 23 Black medick 4.7 0.5 10.0 < 0.1 0.4 0.4 2.1 24 Clover species 3.2 0.6 20.0 < 0.1 1.0 1.0 2.0 25 Northern willowherb 4.3 0.4 10.0 < 0.1 0.4 0.4 1.9 26 Cocklebur 4.5 0.2 5.0 < 0.1 0.8 0.8 1.9 27 Wild oats 4.7 0.2 5.0 < 0.1 0.2 0.2 1.7 28 Dandelion 3.1 0.3 10.0 < 0.1 0.4 0.4 1.4

Field Survey Summary Tables – Elton & Cornwallis
108
Table 66. 2016 Annual crops in Elton & Cornwallis in the Southwest Crop Reporting District (11 fields) Frequency Field Uniformity Field Density (#/m2) Relative
Rank Species (%) All Occurrence All Occurrence High Abundance 1 Wild buckwheat 60.3 18.9 31.3 0.9 1.4 2.2 52.1 2 Wheat 54.1 11.6 21.4 0.5 1.0 2.0 36.5 3 Canola/rapeseed 43.9 11.2 25.4 0.6 1.4 4.0 34.6 4 Yellow foxtail 25.9 7.9 30.4 0.4 1.5 1.8 22.4 5 Wild oats 16.7 7.3 43.9 0.4 2.3 3.0 19.3 6 Kochia 19.7 4.5 22.7 0.2 1.2 1.6 14.4 7 Purslane 17.0 4.3 25.1 0.2 1.4 2.6 13.5 8 Lamb's-quarters 20.3 4.1 20.0 0.2 0.8 1.0 12.6 9 Round-leaved mallow 9.2 3.7 40.0 0.3 3.0 3.0 11.6 10 Nightshade species 15.7 2.3 14.4 0.1 0.6 0.8 8.1 11 Biennial wormwood 9.3 2.8 30.0 0.1 1.4 1.4 7.9 12 Canada thistle 9.2 2.3 25.0 0.1 1.6 1.6 7.6 13 Black medick 9.5 2.4 25.0 0.1 1.4 1.4 7.5 14 Broad-leaved plantain 9.5 1.9 20.0 0.2 1.6 1.6 7.4 15 Green foxtail 9.5 2.4 25.0 0.1 1.2 1.2 7.2 16 Oak-leaved goosefoot 9.3 1.9 20.0 0.1 1.4 1.4 6.9 17 Perennial sow-thistle 10.2 2.0 20.0 0.1 1.0 1.0 6.7 18 Redroot pigweed 9.3 2.3 25.0 0.1 1.0 1.0 6.6 19 Common groundsel 6.9 2.1 30.0 0.1 1.8 1.8 6.3 20 Golden dock 10.2 2.0 20.0 0.1 0.8 0.8 6.3 21 Smooth brome 9.7 1.0 10.0 < 0.1 0.4 0.4 4.3

Field Survey Summary Tables – Grassland
109
Table 67. 2016 Annual crops in Grassland in the Southwest Crop Reporting District (12 fields) Frequency Field Uniformity Field Density (#/m2) Relative
Rank Species (%) All Occurrence All Occurrence High Abundance 1 Wild buckwheat 80.4 18.5 23.0 1.2 1.5 4.0 68.8 2 Redroot pigweed 43.6 7.4 17.0 0.7 1.7 4.0 34.9 3 Green pigweed 20.1 5.5 27.5 0.9 4.5 8.2 29.1 4 Round-leaved mallow 52.5 4.4 8.4 0.3 0.5 1.8 24.4 5 Prostrate pigweed 20.1 4.5 22.5 0.5 2.4 3.8 20.2 6 Green foxtail 15.5 4.6 29.9 0.5 3.5 9.0 20.1 7 Kochia 20.1 3.5 17.5 0.3 1.4 2.2 15.2 8 Stinkweed 16.2 2.8 17.0 0.2 1.5 2.2 12.4 9 Canada thistle 18.5 3.2 17.5 0.1 0.8 1.2 12.0 10 Foxtail barley 16.7 2.5 15.0 0.2 1.1 1.2 11.1 11 Barnyard grass species 16.2 2.1 13.2 0.1 0.7 1.4 9.2 12 White mustard 9.3 2.3 25.0 0.1 1.4 1.4 8.0 13 Canola/rapeseed 11.9 1.7 14.5 0.1 0.7 1.8 7.1 14 Lamb's-quarters 10.1 1.0 10.0 0.1 0.6 0.6 5.1 15 Perennial sow-thistle 10.1 1.0 10.0 0.1 0.6 0.6 5.1 16 Soybean 9.6 1.0 10.0 < 0.1 0.4 0.4 4.5 17 Scouring-rush 9.6 0.5 5.0 < 0.1 0.2 0.2 3.5 18 Wheat 2.7 0.9 35.0 0.1 2.4 2.4 3.2 19 Wild mustard 6.6 0.3 5.0 < 0.1 0.2 0.2 2.4 20 Thyme-leaved spurge 2.7 0.7 25.0 < 0.1 1.2 1.2 2.2 21 Night-flowering catchfly 2.7 0.3 10.0 < 0.1 1.2 1.2 1.7

Field Survey Summary Tables – Harrison Park
110
Table 68. 2016 Annual crops in Harrison Park in the Southwest Crop Reporting District (10 fields) Frequency Field Uniformity Field Density (#/m2) Relative
Rank Species (%) All Occurrence All Occurrence High Abundance 1 Canola/rapeseed 51.4 23.3 45.3 2.6 5.0 14.6 32.0 2 Field horsetail 9.2 7.9 85.0 5.7 61.2 61.2 28.2 3 Wild buckwheat 49.7 21.2 42.7 1.8 3.5 9.0 27.2 4 Barnyard grass species 32.1 16.1 50.1 3.2 9.9 21.6 26.9 5 Green foxtail 17.6 11.0 62.5 4.3 24.2 47.2 26.0 6 Chickweed 63.2 11.7 18.5 1.4 2.2 6.4 22.0 7 Lamb's-quarters 51.7 12.7 24.6 1.5 2.9 8.6 21.4 8 False cleavers 69.3 10.4 15.0 0.7 1.0 2.8 19.6 9 Wild oats 43.1 10.3 23.9 1.5 3.4 7.4 18.6 10 Dandelion 28.0 7.7 27.3 0.6 2.2 5.6 11.3 11 Canada thistle 19.2 6.4 33.5 0.6 2.9 3.2 9.0 12 Stork's bill 18.1 5.3 29.4 0.6 3.2 6.2 8.2 13 Night-flowering catchfly 28.5 3.0 10.4 0.1 0.5 0.8 6.7 14 American vetch 21.2 3.8 17.8 0.3 1.2 1.8 6.5 15 Pale smartweed 21.7 2.2 10.0 0.2 0.8 1.4 5.3 16 Spiny annual sow-thistle 21.2 2.1 10.1 0.2 0.8 1.4 5.2 17 Black medick 19.7 2.1 10.5 0.1 0.4 0.6 4.6 18 Foxtail barley 21.4 1.1 5.0 0.1 0.5 0.8 4.3 19 Flax 10.9 2.7 25.0 0.2 2.0 2.0 4.1 20 Shepherd's-purse 19.2 1.0 5.0 < 0.1 0.2 0.2 3.6 21 American dragonhead 10.9 1.6 15.0 0.1 1.0 1.0 3.1 22 Redroot pigweed 10.9 0.5 5.0 < 0.1 0.4 0.4 2.1 23 Broad-leaved plantain 11.0 0.6 5.0 < 0.1 0.2 0.2 2.1 24 Alfalfa 8.8 0.9 10.0 0.1 0.6 0.6 2.1

Field Survey Summary Tables – Killarney-Turtle Mountain & Prairie Lakes
111
Table 69. 2016 Annual crops in Killarney-Turtle Mountain & Prairie Lakes in the Southwest Crop Reporting District (17 fields)
Frequency Field Uniformity Field Density (#/m2) Relative Rank Species (%) All Occurrence All Occurrence High Abundance 1 Wild buckwheat 81.9 21.6 26.4 1.9 2.3 14.4 45.5 2 Green foxtail 24.3 7.7 31.7 4.8 19.8 71.6 37.3 3 Barnyard grass species 27.3 17.0 62.2 2.2 8.1 17.4 31.7 4 Round-leaved mallow 63.4 14.1 22.3 1.0 1.5 4.2 30.2 5 Wild oats 19.2 6.1 31.5 2.6 13.4 39.0 22.8 6 Wheat 19.7 8.3 42.2 1.1 5.6 9.2 17.0 7 Night-flowering catchfly 31.5 7.1 22.4 0.8 2.6 6.6 16.9 8 Yellow foxtail 31.5 4.6 14.5 0.9 2.8 10.0 15.1 9 Canada thistle 34.4 5.6 16.4 0.5 1.3 3.6 14.3 10 Proso millet 6.3 3.8 60.0 1.3 20.0 20.0 11.3 11 Spiny annual sow-thistle 13.4 6.4 47.4 0.4 3.0 3.6 10.3 12 Dandelion 12.0 4.8 40.0 0.4 3.7 6.8 8.9 13 Black medick 12.0 3.6 30.0 0.2 1.9 3.6 6.8 14 Canola/rapeseed 10.6 2.4 22.4 0.2 1.8 2.6 5.2 15 Lamb's-quarters 16.1 0.8 5.0 < 0.1 0.2 0.2 4.2 16 Biennial wormwood 11.7 1.5 12.7 0.1 0.7 1.2 4.2 17 Perennial sow-thistle 12.0 1.5 12.5 0.1 0.5 0.8 4.1 18 Redroot pigweed 12.0 0.9 7.5 < 0.1 0.3 0.4 3.5 19 Foxtail barley 6.3 0.3 5.0 0.1 2.0 2.0 2.3 20 Broad-leaved plantain 6.0 0.6 10.0 < 0.1 0.6 0.6 2.0 21 Absinth 6.9 0.3 5.0 < 0.1 0.2 0.2 1.8 22 Witch grass 6.3 0.3 5.0 < 0.1 0.4 0.4 1.7 23 Yellow sweet-clover 6.0 0.3 5.0 < 0.1 0.2 0.2 1.6 24 Pale smartweed 5.7 0.3 5.0 < 0.1 0.2 0.2 1.5

Field Survey Summary Tables – Minto-Odanah, Rosedale & Clanwilliam-Erickson
112
Table 70. 2016 Annual crops in Minto-Odanah, Rosedale & Clanwilliam-Erickson in the Southwest Crop Reporting District (12 fields)
Frequency Field Uniformity Field Density (#/m2) Relative Rank Species (%) All Occurrence All Occurrence High Abundance 1 Green foxtail 33.0 25.4 76.8 11.9 36.1 82.8 47.3 2 Wild oats 56.5 26.4 46.8 7.9 14.0 51.8 41.2 3 Wild buckwheat 67.0 20.2 30.2 1.6 2.4 7.6 23.9 4 Barnyard grass species 50.9 13.0 25.6 2.0 4.0 7.8 19.0 5 Rough hair grass 8.6 6.0 70.0 5.1 60.0 60.0 17.1 6 Hemp-nettle 31.0 11.7 37.6 1.3 4.1 11.6 13.6 7 Chickweed 49.1 8.9 18.1 0.7 1.5 2.6 13.5 8 Field horsetail 42.3 8.9 21.0 1.0 2.4 4.6 13.1 9 False cleavers 40.5 10.4 25.8 0.7 1.8 5.0 13.0 10 Stork's bill 32.9 9.7 29.6 1.1 3.3 11.4 12.4 11 Wheat 17.2 9.0 52.5 2.0 11.8 23.2 12.1 12 Dandelion 25.9 7.2 27.7 0.7 2.5 5.0 9.0 13 Canada thistle 41.4 4.7 11.4 0.2 0.6 1.4 9.0 14 Rye 8.6 6.9 80.0 0.8 9.6 9.6 6.8 15 Foxtail barley 7.7 4.2 55.0 1.2 15.0 15.0 6.1 16 Night-flowering catchfly 14.7 5.3 36.1 0.4 3.0 6.6 5.9 17 Canola/rapeseed 15.9 3.5 22.0 0.1 0.9 1.6 4.4 18 Shepherd's-purse 16.3 2.4 14.7 0.2 1.3 2.2 4.1 19 Slough grass 16.4 1.6 10.0 0.1 0.6 0.6 3.5 20 Lamb's-quarters 17.3 1.3 7.5 0.1 0.3 0.4 3.3 21 Scentless chamomile 7.7 2.7 35.0 0.3 4.0 4.0 3.2 22 Stinkweed 17.2 0.9 5.0 < 0.1 0.2 0.2 3.0 23 Barley 9.1 1.8 20.0 0.2 2.0 2.0 2.7 24 Low cudweed 8.2 1.2 15.0 0.2 3.0 3.0 2.4 25 Oak-leaved goosefoot 9.1 1.4 15.0 0.1 0.6 0.6 2.2 26 Pale smartweed 8.6 0.9 10.0 0.1 0.6 0.6 1.8 27 Willow species 8.6 0.9 10.0 0.1 0.6 0.6 1.8 28 Black medick 8.7 0.4 5.0 < 0.1 0.2 0.2 1.5 29 American dragonhead 8.6 0.4 5.0 < 0.1 0.2 0.2 1.5 30 Short-awned foxtail 8.2 0.4 5.0 < 0.1 0.2 0.2 1.4

Field Survey Summary Tables – North Cypress-Langford
113
Table 71. 2016 Annual crops in North Cypress-Langford in the Southwest Crop Reporting District (14 fields) Frequency Field Uniformity Field Density (#/m2) Relative
Rank Species (%) All Occurrence All Occurrence High Abundance 1 Green foxtail 70.6 49.7 70.4 15.7 22.3 57.8 98.4 2 Wild buckwheat 70.0 32.1 45.8 5.7 8.2 45.6 54.3 3 Canola/rapeseed 27.6 14.1 51.0 1.5 5.5 10.2 19.9 4 Spiny annual sow-thistle 13.6 10.7 78.7 1.5 11.1 13.6 14.6 5 Round-leaved mallow 13.6 8.7 63.7 0.9 6.5 9.6 11.3 6 Lamb's-quarters 33.4 3.3 9.9 0.2 0.5 1.8 10.0 7 Stork's bill 8.9 1.8 20.0 1.4 15.8 15.8 7.7 8 Canada thistle 22.9 2.7 11.6 0.2 0.8 1.0 7.3 9 Night-flowering catchfly 13.8 5.0 36.1 0.3 2.4 4.0 7.2 10 Redroot pigweed 21.1 2.7 12.8 0.1 0.7 1.2 6.8 11 Black medick 7.8 4.8 61.2 0.4 5.6 5.6 6.1 12 Wild oats 13.6 3.4 24.8 0.2 1.8 2.8 5.9 13 Thyme-leaved spurge 7.5 2.5 33.8 0.7 9.5 32.0 5.6 14 Yellow foxtail 15.5 2.0 12.6 0.2 1.1 1.8 5.2 15 Rye 8.9 3.1 35.0 0.1 1.6 1.6 4.4 16 Barnyard grass species 5.8 3.2 55.0 0.2 3.8 3.8 4.0 17 Field horsetail 5.8 1.7 30.0 0.5 8.2 8.2 3.9 18 Manitoba maple 8.1 1.6 20.0 0.1 0.8 0.8 3.0 19 Russian thistle 8.2 0.8 10.0 < 0.1 0.6 0.6 2.5 20 Rough cinquefoil 8.2 0.8 10.0 < 0.1 0.4 0.4 2.4 21 White cockle 8.2 0.8 10.0 < 0.1 0.4 0.4 2.4 22 Stinkweed 8.9 0.4 5.0 < 0.1 0.2 0.2 2.3 23 Hemp-nettle 8.2 0.4 5.0 < 0.1 0.2 0.2 2.1 24 Tumble pigweed 8.2 0.4 5.0 < 0.1 0.2 0.2 2.1 25 Yellow sweet-clover 5.8 0.9 15.0 0.1 1.2 1.2 2.1 26 American dragonhead 7.7 0.4 5.0 < 0.1 0.2 0.2 2.0 27 Broad-leaved plantain 5.8 0.6 10.0 < 0.1 0.4 0.4 1.7 28 Scouring-rush 5.8 0.3 5.0 0.1 1.2 1.2 1.7 29 Maple-leaved goosefoot 5.8 0.3 5.0 < 0.1 0.2 0.2 1.5 30 Perennial sow-thistle 5.8 0.3 5.0 < 0.1 0.2 0.2 1.5

Field Survey Summary Tables – Oakland-Wawanesa & Glenboro-South Cypress
114
Table 72. 2016 Annual crops in Oakland-Wawanesa & Glenboro-South Cypress in the Southwest Crop Reporting District (11 fields)
Frequency Field Uniformity Field Density (#/m2) Relative Rank Species (%) All Occurrence All Occurrence High Abundance 1 Wild buckwheat 75.8 23.1 30.5 2.9 3.8 55.2 67.9 2 Green foxtail 45.8 16.0 34.9 2.5 5.4 17.6 50.1 3 Canola/rapeseed 28.4 14.1 49.7 1.4 4.8 13.8 33.1 4 Lamb's-quarters 41.3 13.7 33.1 0.8 1.8 3.4 30.2 5 Spiny annual sow-thistle 28.2 11.1 39.2 0.6 2.2 3.2 23.1 6 Barnyard grass species 27.0 9.6 35.7 0.7 2.4 4.6 22.0 7 Thyme-leaved spurge 14.1 3.3 23.1 0.4 2.8 2.8 10.4 8 Golden dock 8.4 4.6 55.0 0.2 2.2 2.2 8.0 9 Wheat 12.5 2.5 20.0 0.2 1.6 1.6 7.4 10 Redroot pigweed 12.5 2.5 20.0 0.1 0.8 0.8 6.4 11 Kochia 11.9 2.4 20.0 0.1 1.0 1.0 6.4 12 Canada thistle 10.7 1.6 14.7 0.1 1.0 1.0 5.3 13 Tumble pigweed 12.5 1.2 10.0 < 0.1 0.4 0.4 4.9 14 Wild oats 10.7 1.1 10.0 < 0.1 0.4 0.4 4.2 15 Rye 3.4 2.0 60.0 0.2 4.6 4.6 4.1 16 False ragweed 2.9 1.2 40.0 0.1 2.8 2.8 2.6 17 Pale smartweed 7.4 0.4 5.0 < 0.1 0.2 0.2 2.4 18 Manitoba maple 7.4 0.4 5.0 < 0.1 0.2 0.2 2.4 19 Clover species 3.4 1.0 30.0 < 0.1 1.2 1.2 2.2 20 Alfalfa 3.4 0.8 25.0 < 0.1 1.2 1.2 2.0 21 Perennial sow-thistle 3.4 0.8 25.0 < 0.1 1.0 1.0 1.9 22 Narrow-leaved hawk's-beard 2.9 0.7 25.0 < 0.1 1.4 1.4 1.8 23 Russian thistle 2.9 0.4 15.0 < 0.1 0.6 0.6 1.3

Field Survey Summary Tables – Oakview & Hamiota
115
Table 73. 2016 Annual crops in Oakview & Hamiota in the Southwest Crop Reporting District (16 fields) Frequency Field Uniformity Field Density (#/m2) Relative
Rank Species (%) All Occurrence All Occurrence High Abundance 1 Green foxtail 49.3 21.3 43.1 7.2 14.5 54.0 50.8 2 Wild buckwheat 63.9 17.0 26.7 1.4 2.2 10.2 25.4 3 Barnyard grass species 48.0 11.4 23.7 1.5 3.2 10.4 20.3 4 Wild oats 37.7 10.6 28.0 1.6 4.4 18.8 18.8 5 Round-leaved mallow 38.8 12.1 31.3 1.0 2.7 9.8 17.2 6 Canola/rapeseed 44.1 7.9 17.8 0.6 1.3 3.4 13.5 7 Spiny annual sow-thistle 27.7 8.5 30.5 0.9 3.2 5.8 12.8 8 Redroot pigweed 9.0 6.3 69.4 1.7 18.9 22.2 12.4 9 Stork's bill 13.9 7.1 50.7 1.3 9.1 10.2 11.7 10 Night-flowering catchfly 34.6 6.5 18.8 0.6 1.9 5.4 11.6 11 False cleavers 24.9 8.2 33.0 0.7 3.0 15.8 11.6 12 Wheat 11.0 7.0 63.7 1.0 9.3 14.0 10.1 13 Broad-leaved plantain 29.7 5.0 16.9 0.3 1.1 2.8 8.6 14 Lamb's-quarters 15.8 5.8 36.9 0.6 4.0 8.4 8.4 15 Chickweed 22.3 4.7 21.3 0.5 2.2 4.0 8.1 16 Canada thistle 21.8 5.5 25.3 0.3 1.3 2.2 7.6 17 Oak-leaved goosefoot 21.3 3.9 18.3 0.2 1.0 1.2 6.3 18 Shepherd's-purse 17.7 3.5 19.8 0.4 2.0 11.6 6.2 19 Foxtail barley 24.1 3.3 13.8 0.1 0.6 0.8 6.0 20 Pale smartweed 24.5 2.1 8.7 0.1 0.5 1.0 5.3 21 Dandelion 20.7 2.1 10.1 0.1 0.4 0.6 4.5 22 Hemp-nettle 15.5 2.1 13.8 0.1 0.6 1.2 3.9 23 Biennial wormwood 14.2 1.8 12.5 0.1 0.4 0.7 3.4 24 Black medick 13.9 0.7 5.0 < 0.1 0.2 0.2 2.5 25 Yellow sweet-clover 4.8 1.4 30.0 0.1 3.0 3.0 2.2 26 Stinkweed 6.8 1.4 20.0 < 0.1 0.5 0.5 1.9 27 Soybean 7.1 1.1 15.0 0.1 0.8 0.8 1.9 28 Yellow foxtail 6.8 1.0 15.0 < 0.1 0.5 0.5 1.7 29 Alfalfa 6.8 0.7 10.0 < 0.1 0.6 0.6 1.5 30 Pineappleweed 7.1 0.4 5.0 < 0.1 0.2 0.2 1.3 31 Siberian elm 7.1 0.4 5.0 < 0.1 0.2 0.2 1.3 32 Blue grass species 6.8 0.3 5.0 < 0.1 0.2 0.2 1.2

Field Survey Summary Tables – Pipestone, Souris-Glenwood & Sifton
116
Table 74. 2016 Annual crops in Pipestone, Souris-Glenwood & Sifton in the Southwest Crop Reporting District (13 fields)
Frequency Field Uniformity Field Density (#/m2) Relative Rank Species (%) All Occurrence All Occurrence High Abundance 1 Green foxtail 59.2 26.9 45.5 5.2 8.7 24.8 64.9 2 Barnyard grass species 9.5 9.5 100.0 4.3 44.8 44.8 34.0 3 Yellow foxtail 16.1 12.9 80.3 3.3 20.2 28.6 32.8 4 Wild buckwheat 55.5 13.6 24.5 1.1 2.0 7.8 30.0 5 Redroot pigweed 45.5 7.2 15.9 0.4 0.9 3.8 18.4 6 Night-flowering catchfly 31.2 6.6 21.2 0.4 1.3 2.4 14.6 7 Canada thistle 24.5 4.2 17.2 0.3 1.3 2.4 10.7 8 Thyme-leaved spurge 19.2 4.3 22.2 0.3 1.5 3.2 9.5 9 Wild oats 14.7 3.6 24.2 0.6 3.8 10.8 9.4 10 Scouring-rush 19.7 3.1 15.7 0.3 1.7 1.8 8.8 11 Round-leaved mallow 22.1 2.9 13.3 0.1 0.7 1.0 8.1 12 Lamb's-quarters 17.0 3.3 19.4 0.2 1.5 1.8 7.9 13 Perennial sow-thistle 19.2 2.5 13.2 0.1 0.7 0.8 7.1 14 Foxtail barley 6.9 2.8 40.0 0.3 4.4 4.4 5.6 15 Kochia 15.6 1.1 7.4 0.1 0.5 0.8 4.8 16 Prostrate pigweed 7.2 2.1 30.0 0.2 3.2 3.2 4.7 17 Canola/rapeseed 15.6 1.1 7.4 < 0.1 0.3 0.4 4.6 18 Rough cinquefoil 4.6 1.6 35.0 0.3 6.2 6.2 4.0 19 Rayless aster 12.2 1.2 10.0 < 0.1 0.4 0.4 4.0 20 Dandelion 10.1 0.5 5.0 < 0.1 0.4 0.4 2.8 21 Hemp-nettle 6.9 1.0 15.0 0.1 0.8 0.8 2.7 22 Broad-leaved plantain 6.9 1.0 15.0 0.1 0.8 0.8 2.7 23 Quack grass 7.4 0.4 5.0 0.1 0.8 0.8 2.2 24 Showy milkweed 7.4 0.4 5.0 < 0.1 0.6 0.6 2.2 25 Black medick 4.6 0.5 10.0 < 0.1 0.6 0.6 1.6 26 Stinkweed 4.6 0.2 5.0 < 0.1 0.2 0.2 1.2 27 Wheat 1.9 0.3 15.0 < 0.1 1.6 1.6 0.8

Field Survey Summary Tables – Prairie View & Ellice-Archie
117
Table 75. 2016 Annual crops in Prairie View & Ellice-Archie in the Southwest Crop Reporting District (20 fields) Frequency Field Uniformity Field Density (#/m2) Relative
Rank Species (%) All Occurrence All Occurrence High Abundance 1 Round-leaved mallow 44.4 13.3 29.9 0.8 1.9 3.8 36.3 2 Green foxtail 43.7 7.6 17.5 0.5 1.1 2.8 23.8 3 Wild buckwheat 37.6 7.5 19.9 0.5 1.2 7.2 22.4 4 Wild oats 43.5 7.7 17.8 0.3 0.8 1.6 21.8 5 Lamb's-quarters 27.6 5.8 21.1 0.3 1.1 1.5 16.0 6 Broad-leaved plantain 22.4 5.6 24.9 0.3 1.3 2.0 14.9 7 Foxtail barley 34.7 4.6 13.2 0.2 0.6 1.5 14.9 8 Oak-leaved goosefoot 22.3 5.1 22.7 0.3 1.4 2.6 14.5 9 False cleavers 27.3 4.9 18.1 0.3 1.0 1.6 14.5 10 Redroot pigweed 22.4 4.5 20.1 0.2 0.9 1.1 12.1 11 Canola/rapeseed 23.5 4.0 17.1 0.1 0.6 0.9 10.8 12 Barnyard grass species 25.3 3.1 12.2 0.1 0.4 0.8 9.6 13 Spiny annual sow-thistle 19.9 3.1 15.4 0.1 0.6 0.8 8.8 14 Canada thistle 11.1 3.3 29.8 0.2 1.4 1.9 8.0 15 Stinkweed 16.6 2.8 16.7 0.1 0.7 0.8 7.8 16 Shepherd's-purse 11.1 2.8 25.1 0.1 1.2 1.5 7.2 17 Green pigweed 1.6 1.4 90.0 0.2 15.2 15.2 5.9 18 Narrow-leaved hawk's-beard 10.8 2.2 20.0 0.1 0.9 0.9 5.8 19 Pale smartweed 11.1 2.2 19.9 0.1 0.8 1.2 5.8 20 Wild mustard 5.4 1.9 35.0 0.1 2.7 2.7 5.5 21 Wheat 12.6 1.6 12.7 0.1 0.5 2.4 5.1 22 Dock species 5.4 1.9 35.0 0.1 2.2 2.2 4.9 23 Marsh yellow cress 5.7 2.0 35.0 0.1 1.4 1.4 4.3 24 Timothy 5.4 1.3 25.0 0.1 1.1 1.1 3.4 25 Stork's bill 5.4 1.3 25.0 0.1 0.9 0.9 3.2 26 Black medick 5.4 1.1 20.0 < 0.1 0.7 0.7 2.7 27 Perennial sow-thistle 5.4 0.8 15.0 < 0.1 0.7 0.7 2.5 28 False ragweed 5.5 0.6 10.0 < 0.1 0.4 0.4 2.0 29 Hemp-nettle 5.4 0.5 10.0 < 0.1 0.3 0.3 1.8 30 Kochia 5.4 0.3 5.0 < 0.1 0.3 0.3 1.5 31 Alfalfa 1.6 0.3 20.0 < 0.1 1.2 1.2 0.9 32 Thyme-leaved spurge 1.6 0.1 5.0 < 0.1 1.6 1.6 0.8 33 American dragonhead 1.6 0.1 5.0 < 0.1 0.4 0.4 0.5

Field Survey Summary Tables – Riverdale & Whitehead
118
Table 76. 2016 Annual crops in Riverdale & Whitehead in the Southwest Crop Reporting District (10 fields) Frequency Field Uniformity Field Density (#/m2) Relative
Rank Species (%) All Occurrence All Occurrence High Abundance 1 Wild oats 41.5 19.7 47.5 2.7 6.5 13.0 47.6 2 Canola/rapeseed 48.0 18.4 38.4 2.3 4.9 18.8 44.9 3 Wild buckwheat 57.6 16.3 28.2 0.8 1.3 2.0 31.2 4 Green foxtail 30.9 7.8 25.1 2.0 6.3 15.6 29.3 5 Wheat 38.7 11.5 29.8 0.7 1.7 2.6 22.9 6 Biennial wormwood 27.2 9.0 33.1 0.5 2.0 3.0 17.4 7 Kochia 31.8 6.4 20.0 0.5 1.7 3.2 16.2 8 Barnyard grass species 20.8 5.7 27.3 0.4 2.0 2.2 12.4 9 Dandelion 30.3 2.5 8.3 0.1 0.3 0.4 9.0 10 Tumble pigweed 20.8 3.2 15.3 0.2 0.8 1.4 8.2 11 Wild mustard 20.2 3.5 17.5 0.1 0.7 0.8 8.2 12 Round-leaved mallow 20.8 3.1 14.7 0.1 0.6 1.0 7.7 13 Lamb's-quarters 10.1 3.5 35.0 0.3 2.6 2.6 7.2 14 Yellow sweet-clover 10.1 3.0 30.0 0.3 3.0 3.0 7.1 15 Oak-leaved goosefoot 10.7 1.6 15.0 0.3 2.6 2.6 5.8 16 Perennial sow-thistle 10.6 1.6 15.0 0.1 0.8 0.8 4.1 17 American dragonhead 10.1 1.5 15.0 0.1 0.8 0.8 4.0 18 Thyme-leaved spurge 10.1 1.0 10.0 0.1 0.6 0.6 3.4 19 Foxtail barley 10.7 0.5 5.0 < 0.1 0.2 0.2 2.8 20 Night-flowering catchfly 10.7 0.5 5.0 < 0.1 0.2 0.2 2.8 21 Spiny annual sow-thistle 10.1 0.5 5.0 < 0.1 0.2 0.2 2.6 22 Canada thistle 10.1 0.5 5.0 < 0.1 0.2 0.2 2.6 23 Redroot pigweed 10.1 0.5 5.0 < 0.1 0.2 0.2 2.6

Field Survey Summary Tables – Two Borders
119
Table 77. 2016 Annual crops in Two Borders in the Southwest Crop Reporting District (12 fields) Frequency Field Uniformity Field Density (#/m2) Relative
Rank Species (%) All Occurrence All Occurrence High Abundance 1 Yellow foxtail 14.1 12.0 85.0 8.1 57.2 57.2 61.3 2 Green foxtail 43.5 18.4 42.2 5.2 11.9 39.4 59.9 3 Foxtail barley 35.9 13.1 36.4 1.6 4.4 12.4 32.2 4 Wild buckwheat 57.2 8.5 14.8 0.5 0.9 1.8 26.8 5 Night-flowering catchfly 20.0 4.2 20.9 0.3 1.3 1.8 11.1 6 Biennial wormwood 28.9 1.9 6.6 0.1 0.5 2.0 10.2 7 Downy brome 12.2 4.3 35.0 0.2 2.0 2.0 9.1 8 Lamb's-quarters 24.3 1.8 7.5 0.1 0.3 0.4 8.6 9 Round-leaved mallow 15.1 2.6 17.3 0.1 0.9 2.6 7.4 10 Barnyard grass species 5.3 3.5 65.0 0.4 7.6 7.6 7.4 11 Barley 14.1 2.1 15.0 0.2 1.2 1.2 6.8 12 Soybean 8.3 3.3 40.0 0.2 2.2 2.2 6.7 13 Black medick 5.1 3.1 60.0 0.2 4.2 4.2 5.8 14 Redroot pigweed 14.0 1.5 10.7 0.1 0.5 1.0 5.6 15 Wild oats 5.1 1.8 35.0 0.2 3.2 3.2 4.1 16 Kochia 5.1 1.8 35.0 0.1 2.4 2.4 3.9 17 Broad-leaved plantain 12.2 0.6 5.0 < 0.1 0.2 0.2 3.9 18 Shepherd's-purse 6.4 1.4 22.4 0.1 1.4 1.4 3.7 19 Canola/rapeseed 11.2 0.6 5.0 < 0.1 0.4 0.4 3.7 20 Pennsylvania pellitory 11.2 0.6 5.0 < 0.1 0.2 0.2 3.6 21 Stinkweed 6.4 1.3 20.2 0.1 1.0 1.6 3.4 22 Perennial sow-thistle 8.2 0.7 8.1 < 0.1 0.3 0.4 3.0 23 Wheat 8.6 0.4 5.0 < 0.1 0.2 0.2 2.8 24 Thyme-leaved spurge 8.3 0.4 5.0 < 0.1 0.2 0.2 2.6 25 Pale smartweed 3.3 1.1 35.0 0.1 2.4 2.4 2.5 26 Yellow evening-primrose 5.1 0.5 10.0 0.1 1.0 1.0 2.1 27 False cleavers 3.3 0.7 20.0 < 0.1 1.0 1.0 1.7

Field Survey Summary Tables – Wallace-Woodworth
120
Table 78. 2016 Annual crops in Wallace-Woodworth in the Southwest Crop Reporting District (12 fields) Frequency Field Uniformity Field Density (#/m2) Relative
Rank Species (%) All Occurrence All Occurrence High Abundance 1 Green foxtail 73.9 19.2 25.9 1.7 2.3 5.4 39.6 2 Canola/rapeseed 28.4 12.4 43.6 2.5 8.9 27.4 33.8 3 Wild buckwheat 72.7 14.8 20.3 0.9 1.3 5.4 29.8 4 Wheat 42.1 9.8 23.4 0.7 1.6 3.6 19.5 5 Wild oats 26.3 9.1 34.4 1.0 3.9 7.8 19.1 6 Dandelion 27.1 9.4 34.8 0.9 3.4 7.4 18.6 7 Redroot pigweed 26.2 7.8 30.0 1.0 4.0 5.8 18.4 8 Spiny annual sow-thistle 40.8 5.1 12.6 0.5 1.3 4.6 14.5 9 Quack grass 9.0 5.8 65.0 0.7 7.4 7.4 11.1 10 Night-flowering catchfly 23.9 5.2 21.9 0.2 1.0 1.6 9.6 11 False cleavers 26.9 3.2 11.8 0.3 1.2 3.0 9.2 12 Manitoba maple 8.2 4.9 60.0 0.3 4.0 4.0 7.7 13 Biennial wormwood 26.9 2.2 8.3 0.2 0.6 1.4 7.1 14 Barnyard grass species 17.7 3.1 17.6 0.2 1.2 1.6 6.8 15 Shepherd's-purse 17.9 1.3 7.5 0.2 0.9 1.6 5.1 16 Oak-leaved goosefoot 15.2 2.3 14.9 0.1 0.8 1.8 5.1 17 Foxtail barley 9.0 2.7 30.0 0.2 2.2 2.2 5.0 18 Golden dock 17.2 1.3 7.4 0.1 0.5 0.6 4.3 19 Canada thistle 17.4 1.3 7.6 0.1 0.3 0.4 4.1 20 Kochia 15.0 0.7 5.0 0.1 0.4 0.6 3.4 21 Blue grass species 9.0 1.8 20.0 0.1 0.8 0.8 3.3 22 Maple-leaved goosefoot 9.0 1.3 15.0 0.1 1.0 1.0 3.1 23 Pale smartweed 6.0 1.2 20.0 0.1 1.6 1.6 2.6 24 Wild mustard 6.0 1.2 20.0 0.1 1.4 1.4 2.5 25 Broad-leaved plantain 9.0 0.9 10.0 < 0.1 0.4 0.4 2.4 26 Low cudweed 8.2 0.4 5.0 0.1 0.8 0.8 2.1 27 Lamb's-quarters 9.0 0.4 5.0 < 0.1 0.4 0.4 2.0 28 Western snowberry 9.0 0.4 5.0 < 0.1 0.2 0.2 1.9 29 Perennial sow-thistle 9.0 0.4 5.0 < 0.1 0.2 0.2 1.9 30 Purslane 8.2 0.4 5.0 < 0.1 0.2 0.2 1.7 31 Thyme-leaved spurge 8.2 0.4 5.0 < 0.1 0.2 0.2 1.7 32 Round-leaved mallow 6.0 0.6 10.0 < 0.1 0.6 0.6 1.7 33 Dock species 6.0 0.3 5.0 < 0.1 0.2 0.2 1.3

Field Survey Summary Tables – Yellowhead
121
Table 79. 2016 Annual crops in Yellowhead in the Southwest Crop Reporting District (12 fields) Frequency Field Uniformity Field Density (#/m2) Relative
Rank Species (%) All Occurrence All Occurrence High Abundance 1 Wild buckwheat 79.4 32.9 41.4 2.1 2.6 6.8 47.8 2 Barnyard grass species 7.2 7.2 100.0 5.7 80.0 80.0 40.9 3 Canada thistle 79.4 23.6 29.7 1.3 1.7 2.8 38.0 4 False cleavers 61.2 21.7 35.5 1.8 3.0 25.6 36.3 5 Perennial sow-thistle 62.0 22.5 36.4 1.5 2.4 7.4 34.7 6 Round-leaved mallow 62.3 20.6 33.0 1.4 2.3 7.0 33.2 7 Dandelion 23.0 6.3 27.3 0.3 1.5 2.6 10.4 8 Canola/rapeseed 10.0 5.7 57.1 0.3 3.4 4.4 7.5 9 Shepherd's-purse 17.1 4.2 24.8 0.3 1.5 2.2 7.5 10 Narrow-leaved hawk's-beard 10.6 4.8 45.0 0.4 3.4 3.4 7.1 11 Foxtail barley 13.0 4.5 34.5 0.2 1.8 2.2 6.7 12 Wild oats 16.3 2.2 13.5 0.1 0.6 2.0 5.2 13 Chickweed 12.8 2.6 20.0 0.1 1.0 1.0 4.9 14 Broad-leaved plantain 10.1 2.5 25.0 0.1 1.4 1.4 4.4 15 Green pigweed 7.2 2.9 40.0 0.2 2.8 2.8 4.3 16 Pale smartweed 7.2 2.5 35.0 0.1 1.8 1.8 3.7 17 Lamb's-quarters 7.0 1.0 15.0 < 0.1 0.6 0.6 2.3 18 Wheat 5.7 1.3 22.5 0.1 1.0 1.6 2.3 19 Kochia 2.9 0.6 20.0 < 0.1 0.8 0.8 1.1 20 Night-flowering catchfly 2.9 0.4 15.0 < 0.1 0.6 0.6 0.9 21 Redroot pigweed 2.9 0.3 10.0 < 0.1 0.4 0.4 0.8

Field Survey Summary Tables – Gilbert Plains, Dauphin & Mossey River
122
Table 80. 2016 Annual crops in Gilbert Plains, Dauphin & Mossey River in the Northwest Crop Reporting District (13 fields)
Frequency Field Uniformity Field Density (#/m2) Relative Rank Species (%) All Occurrence All Occurrence High Abundance 1 Green foxtail 20.8 8.4 40.5 4.8 23.2 98.4 60.6 2 Wild buckwheat 37.0 7.9 21.3 0.6 1.5 4.8 25.7 3 Golden dock 16.1 6.5 40.1 1.0 6.0 11.8 21.6 4 Broad-leaved plantain 16.1 6.8 42.5 0.8 5.2 8.0 20.9 5 Perennial sow-thistle 24.9 3.7 14.7 0.4 1.4 3.6 15.1 6 Barnyard grass species 20.6 4.0 19.3 0.4 1.8 5.4 14.3 7 Yellow sweet-clover 16.1 5.2 32.4 0.3 1.7 3.0 13.7 8 Night-flowering catchfly 12.4 4.4 35.6 0.4 3.0 6.0 12.6 9 Dandelion 20.5 3.4 16.8 0.2 0.8 1.0 11.8 10 Wheat 6.9 3.8 55.0 0.5 7.2 7.2 11.3 11 Redroot pigweed 16.5 3.2 19.7 0.2 1.2 2.2 10.6 12 Black medick 8.1 3.6 45.0 0.4 4.4 4.4 10.1 13 Canola/rapeseed 8.1 3.6 45.0 0.3 3.2 3.2 9.3 14 Canada thistle 19.4 1.6 8.2 0.1 0.6 1.0 8.6 15 Maple-leaved goosefoot 16.2 1.2 7.5 0.1 0.6 0.6 7.1 16 Marsh yellow cress 8.1 2.0 25.0 0.1 1.8 1.8 6.2 17 Perennial rye grass 6.9 1.7 25.0 0.2 2.2 2.2 5.6 18 Pale smartweed 8.0 1.6 20.0 0.1 1.2 1.2 5.2 19 Northern willowherb 8.1 1.6 20.0 0.1 1.0 1.0 5.1 20 Biennial wormwood 8.1 1.2 15.0 0.1 1.0 1.0 4.6 21 Spiny annual sow-thistle 6.9 1.4 20.0 0.1 1.0 1.0 4.4 22 False cleavers 11.3 0.6 5.0 < 0.1 0.2 0.2 4.2 23 Lamb's-quarters 8.4 0.4 5.0 < 0.1 0.4 0.4 3.3 24 Canada fleabane 8.1 0.4 5.0 < 0.1 0.2 0.2 3.0 25 Chickweed 6.9 0.3 5.0 < 0.1 0.2 0.2 2.6 26 Wild oats 4.4 0.7 15.0 < 0.1 0.6 0.6 2.3

Field Survey Summary Tables – Grandview & Ethelbert
123
Table 81. 2016 Annual crops in Grandview & Ethelbert in the Northwest Crop Reporting District (10 fields) Frequency Field Uniformity Field Density (#/m2) Relative
Rank Species (%) All Occurrence All Occurrence High Abundance 1 Broad-leaved plantain 80.4 34.9 43.4 8.5 10.5 53.0 41.0 2 Chickweed 73.0 32.9 45.1 7.0 9.6 23.2 36.2 3 Wild oats 50.5 17.1 33.9 6.0 11.9 69.6 25.4 4 Green foxtail 30.8 15.6 50.6 5.5 18.0 57.8 21.5 5 Spiny annual sow-thistle 45.6 24.2 53.0 3.1 6.8 17.0 21.2 6 Wild buckwheat 69.6 19.1 27.4 1.6 2.3 7.8 18.9 7 Barnyard grass species 50.1 19.2 38.4 2.5 5.0 19.6 18.6 8 Dandelion 61.3 17.4 28.4 1.2 1.9 4.4 16.4 9 Pale smartweed 65.7 14.8 22.5 1.3 2.0 8.0 16.2 10 Wheat 30.9 15.6 50.5 2.7 8.6 29.4 15.3 11 Canada thistle 58.5 8.7 15.0 0.8 1.3 3.6 11.9 12 Golden dock 11.8 8.3 70.0 2.8 23.8 23.8 10.6 13 False cleavers 34.9 7.6 21.7 0.4 1.1 2.4 7.9 14 Quack grass 7.8 5.4 70.0 1.0 13.4 13.4 5.2 15 Clover species 15.7 3.9 25.0 0.3 1.7 3.2 3.9 16 Shepherd's-purse 11.3 4.5 40.0 0.2 1.8 1.8 3.5 17 Oak-leaved goosefoot 11.8 3.5 30.0 0.2 1.4 1.4 3.1 18 Field horsetail 7.9 2.8 35.0 0.3 3.4 3.4 2.5 19 Thyme-leaved spurge 11.8 1.8 15.0 0.1 1.0 1.0 2.3 20 Wild mustard 11.3 1.7 15.0 0.1 1.0 1.0 2.2 21 Bicknell's geranium 7.9 2.4 30.0 0.2 2.2 2.2 2.2 22 Canada fleabane 7.9 2.0 25.0 0.1 1.6 1.6 1.9 23 Tumble pigweed 7.9 2.0 25.0 0.1 1.4 1.4 1.9 24 Perennial sow-thistle 7.8 1.6 20.0 0.1 1.0 1.0 1.7 25 Northern willowherb 11.3 0.6 5.0 < 0.1 0.4 0.4 1.7 26 Soybean 11.3 0.6 5.0 < 0.1 0.2 0.2 1.6 27 Canola/rapeseed 11.3 0.6 5.0 < 0.1 0.2 0.2 1.6 28 Low cudweed 7.9 0.4 5.0 < 0.1 0.4 0.4 1.2 29 American dragonhead 7.9 0.4 5.0 < 0.1 0.2 0.2 1.1 30 Hemp-nettle 7.9 0.4 5.0 < 0.1 0.2 0.2 1.1

Field Survey Summary Tables – Minitonas-Bowsman, Mountain & Kelsey
124
Table 82. 2016 Annual crops in Minitonas-Bowsman, Mountain & Kelsey in the Northwest Crop Reporting District (12 fields)
Frequency Field Uniformity Field Density (#/m2) Relative Rank Species (%) All Occurrence All Occurrence High Abundance 1 Wild oats 41.4 9.6 23.1 1.0 2.5 8.8 70.4 2 Pale smartweed 24.0 9.7 40.2 0.8 3.3 5.8 54.7 3 Chickweed 16.7 8.4 50.0 0.8 4.7 9.2 47.1 4 False cleavers 8.4 7.9 95.0 0.7 8.2 8.2 38.8 5 Wild buckwheat 35.1 3.3 9.5 0.2 0.5 0.8 32.5 6 Field horsetail 8.0 2.8 35.0 0.4 4.6 4.6 19.7 7 Canola/rapeseed 7.7 3.5 45.0 0.2 2.0 2.0 15.7 8 Dandelion 11.1 0.6 5.0 < 0.1 0.2 0.2 8.3 9 Barnyard grass species 7.7 0.4 5.0 < 0.1 0.6 0.6 6.5 10 Broad-leaved plantain 8.4 0.4 5.0 < 0.1 0.2 0.2 6.3

Field Survey Summary Tables – Riding Mountain West, Roblin, Rossburn & Russell-Binscarth
125
Table 83. 2016 Annual crops in Riding Mountain West, Roblin, Rossburn & Russell-Binscarth in the Northwest Crop Reporting District (32 fields)
Frequency Field Uniformity Field Density (#/m2) Relative Rank Species (%) All Occurrence All Occurrence High Abundance 1 Barnyard grass species 26.4 11.5 43.6 2.4 9.0 33.4 35.0 2 Green foxtail 19.6 9.4 48.1 2.6 13.5 37.4 34.1 3 Wild buckwheat 62.3 14.8 23.7 0.9 1.5 6.6 32.5 4 False cleavers 39.5 9.9 25.1 0.6 1.4 5.0 21.0 5 Wheat 22.5 8.0 35.4 0.8 3.6 14.4 18.2 6 Wild oats 16.6 6.0 36.2 0.7 4.0 9.8 13.9 7 Broad-leaved plantain 19.5 5.6 28.8 0.6 3.1 6.4 13.7 8 Canola/rapeseed 22.0 5.4 24.7 0.4 2.0 4.6 12.6 9 Canada thistle 22.4 4.7 21.0 0.4 1.9 4.0 11.9 10 Spiny annual sow-thistle 18.9 3.5 18.5 0.2 1.0 2.6 8.3 11 Pale smartweed 16.2 3.6 22.2 0.2 1.4 3.2 8.1 12 Dandelion 17.9 3.0 17.0 0.2 1.2 1.6 7.9 13 Redroot pigweed 20.4 2.8 14.0 0.2 0.9 3.4 7.9 14 Clover species 11.7 2.5 21.3 0.3 2.7 10.8 7.0 15 Chickweed 13.5 2.5 18.7 0.2 1.8 3.4 6.8 16 Field horsetail 15.7 2.2 13.7 0.2 1.1 2.6 6.4 17 Round-leaved mallow 11.8 2.5 21.0 0.2 1.5 5.0 5.9 18 Lamb's-quarters 12.6 1.6 12.5 0.1 0.8 1.4 4.7 19 Shepherd's-purse 15.4 1.1 7.2 0.1 0.4 0.6 4.4 20 Alfalfa 9.7 1.4 14.8 0.1 1.0 1.6 3.9 21 Stinkweed 9.2 1.2 13.6 0.1 0.6 0.8 3.3 22 Black medick 9.5 1.1 11.1 0.1 0.6 0.8 3.2 23 Perennial sow-thistle 6.4 1.3 20.0 0.1 0.9 1.0 2.9 24 Foxtail barley 8.9 0.4 5.0 0.1 0.6 1.0 2.5 25 American vetch 9.2 0.6 6.7 < 0.1 0.3 0.4 2.5 26 Hemp-nettle 6.6 1.0 15.0 < 0.1 0.6 0.6 2.5 27 Low cudweed 6.4 0.6 10.0 0.1 1.1 1.6 2.4 28 Bicknell's geranium 5.8 0.6 10.0 < 0.1 0.7 0.8 1.9 29 Flax 6.8 0.5 7.5 < 0.1 0.3 0.4 1.9 30 Yellow sweet-clover 6.1 0.6 9.4 < 0.1 0.4 0.6 1.9 31 Night-flowering catchfly 6.3 0.5 7.4 < 0.1 0.3 0.4 1.8 32 Oak-leaved goosefoot 6.8 0.3 5.0 < 0.1 0.2 0.2 1.7 33 American dragonhead 2.6 0.8 30.0 0.1 2.0 2.0 1.6 34 Corn spurry 3.1 0.3 10.0 < 0.1 0.4 0.4 1.0 35 Rough cinquefoil 3.2 0.2 5.0 < 0.1 0.4 0.4 0.9 36 Dock species 3.4 0.2 5.0 < 0.1 0.2 0.2 0.9 37 Smooth brome 2.7 0.3 10.0 < 0.1 0.4 0.4 0.9 38 Cocklebur 3.2 0.2 5.0 < 0.1 0.2 0.2 0.8 39 Northern bedstraw 2.7 0.1 5.0 < 0.1 0.4 0.4 0.7 40 Biennial wormwood 2.6 0.1 5.0 < 0.1 0.2 0.2 0.7

Field Survey Summary Tables – Ste. Rose, Lakeshore, McCreary & Alonsa
126
Table 84. 2016 Annual crops in Ste. Rose, Lakeshore, McCreary & Alonsa in the Northwest Crop Reporting District (11 fields)
Frequency Field Uniformity Field Density (#/m2) Relative Rank Species (%) All Occurrence All Occurrence High Abundance 1 Green foxtail 27.8 21.0 75.6 9.3 33.6 73.6 78.8 2 Dandelion 51.1 13.3 25.9 1.2 2.3 9.4 32.0 3 Wild buckwheat 51.7 14.2 27.5 0.9 1.8 6.2 31.6 4 Barnyard grass species 18.4 7.4 40.1 1.6 8.5 13.8 20.3 5 Broad-leaved plantain 24.9 5.9 23.8 0.6 2.5 4.2 15.4 6 Night-flowering catchfly 9.0 5.4 60.0 1.0 11.6 11.6 13.2 7 Wheat 9.4 6.6 70.0 0.8 8.6 8.6 13.1 8 Redroot pigweed 28.2 3.8 13.3 0.2 0.7 1.2 11.6 9 Wild oats 18.4 3.7 20.2 0.2 0.9 1.2 9.1 10 False cleavers 9.0 3.6 40.0 0.3 2.8 2.8 7.1 11 Lamb's-quarters 9.0 1.8 20.0 0.4 4.6 4.6 6.3 12 Northern willowherb 18.1 0.9 5.0 < 0.1 0.2 0.2 5.6 13 Chickweed 9.0 2.3 25.0 0.2 2.2 2.2 5.5 14 Biennial wormwood 9.4 2.3 25.0 0.2 1.6 1.6 5.4 15 Perennial sow-thistle 9.0 2.3 25.0 0.1 1.6 1.6 5.2 16 Tumble pigweed 9.0 1.8 20.0 0.1 1.4 1.4 4.7 17 Bicknell's geranium 9.4 1.9 20.0 0.1 0.8 0.8 4.5 18 Black medick 8.7 1.3 15.0 0.2 2.0 2.0 4.4 19 Hemp-nettle 9.0 0.9 10.0 0.2 2.0 2.0 4.1 20 Golden dock 9.4 1.4 15.0 0.1 0.8 0.8 4.1 21 American dragonhead 8.8 1.3 15.0 0.1 0.6 0.6 3.8 22 Canada thistle 9.0 0.9 10.0 0.1 1.2 1.2 3.7 23 Scouring-rush 9.0 0.5 5.0 0.1 0.6 0.6 3.0 24 Purslane speedwell 9.4 0.5 5.0 < 0.1 0.2 0.2 2.9 25 Rayless aster 9.0 0.5 5.0 < 0.1 0.2 0.2 2.8 26 Pale smartweed 6.2 0.3 5.0 < 0.1 0.2 0.2 1.9

Field Survey Summary Tables – Swan Valley West
127
Table 85. 2016 Annual crops in Swan Valley West in the Northwest Crop Reporting District (13 fields) Frequency Field Uniformity Field Density (#/m2) Relative
Rank Species (%) All Occurrence All Occurrence High Abundance 1 Wild oats 31.4 9.4 29.8 1.1 3.5 9.6 71.7 2 False cleavers 21.6 8.5 39.5 1.3 5.9 16.8 70.1 3 Canola/rapeseed 25.6 4.9 19.3 0.3 1.1 1.8 33.7 4 Chickweed 15.1 4.6 30.6 0.3 2.2 2.6 29.4 5 Pale smartweed 31.8 2.7 8.5 0.1 0.4 0.8 26.2 6 Wild buckwheat 23.1 1.2 5.0 0.1 0.3 0.4 15.7 7 Proso millet 9.7 1.4 15.0 0.1 1.0 1.0 11.2 8 Canada thistle 14.9 1.1 7.3 < 0.1 0.3 0.4 11.2 9 Green foxtail 9.7 1.0 10.0 < 0.1 0.4 0.4 8.3 10 Lamb's-quarters 8.0 0.4 5.0 0.1 0.8 0.8 6.6 11 Bladder campion 8.0 0.4 5.0 < 0.1 0.2 0.2 5.2 12 Stork's bill 8.0 0.4 5.0 < 0.1 0.2 0.2 5.2 13 American vetch 8.0 0.4 5.0 < 0.1 0.2 0.2 5.2

Field Survey Summary Tables – Cartwright-Roblin & Argyle
128
Table 86. 2016 Annual crops in Cartwright-Roblin & Argyle in the Central Crop Reporting District (14 fields) Frequency Field Uniformity Field Density (#/m2) Relative
Rank Species (%) All Occurrence All Occurrence High Abundance 1 Green foxtail 47.6 24.5 51.5 5.5 11.5 41.8 71.9 2 Round-leaved mallow 66.2 16.7 25.2 1.9 2.9 14.6 42.0 3 Wild buckwheat 59.6 16.7 27.9 1.0 1.6 5.2 33.7 4 Wild oats 45.5 9.5 20.9 1.1 2.3 12.2 25.1 5 Canola/rapeseed 32.6 4.6 14.2 0.4 1.4 4.4 13.8 6 Night-flowering catchfly 35.0 3.5 10.0 0.3 0.7 3.0 11.8 7 Wheat 23.7 5.3 22.3 0.2 1.0 1.6 11.1 8 Yellow foxtail 16.5 3.3 20.0 0.6 3.6 3.8 10.5 9 Wild mustard 19.9 4.0 20.0 0.3 1.4 1.6 9.4 10 Biennial wormwood 13.8 3.9 28.4 0.4 2.7 6.0 8.9 11 Spiny annual sow-thistle 19.9 2.8 14.2 0.2 1.1 2.0 8.0 12 Redroot pigweed 22.7 2.2 9.7 0.1 0.5 1.0 7.1 13 Purslane 7.1 1.1 15.0 0.6 8.2 8.2 6.7 14 Oats 6.9 3.8 55.0 0.2 2.6 2.6 6.0 15 Dandelion 15.3 1.5 10.0 0.1 0.5 0.6 4.9 16 Chickweed 15.4 1.1 7.3 0.1 0.8 1.4 4.8 17 Barnyard grass species 7.1 1.1 15.0 0.2 2.2 2.2 3.5 18 Hedge bindweed 8.3 1.2 15.0 0.1 0.8 0.8 3.2 19 Clover species 8.2 1.2 15.0 < 0.1 0.6 0.6 3.0 20 Stork's bill 8.0 0.8 10.0 0.1 1.2 1.2 3.0 21 Perennial sow-thistle 8.9 0.6 7.3 < 0.1 0.3 0.6 2.5 22 False flax species 6.9 0.7 10.0 < 0.1 0.6 0.6 2.2 23 American dragonhead 8.3 0.4 5.0 < 0.1 0.2 0.2 2.1 24 Lamb's-quarters 6.9 0.3 5.0 < 0.1 0.6 0.6 1.9 25 Kochia 6.9 0.3 5.0 < 0.1 0.2 0.2 1.7 26 Canada thistle 2.0 0.5 25.0 < 0.1 1.4 1.4 1.0

Field Survey Summary Tables – Dufferin
129
Table 87. 2016 Annual crops in Dufferin in the Central Crop Reporting District (18 fields) Frequency Field Uniformity Field Density (#/m2) Relative
Rank Species (%) All Occurrence All Occurrence High Abundance 1 Yellow foxtail 22.8 13.1 57.5 5.4 23.6 64.0 58.0 2 Wild buckwheat 69.8 17.0 24.4 1.3 1.9 7.4 39.5 3 Wheat 31.2 8.4 26.9 0.9 3.0 5.6 21.1 4 Redroot pigweed 35.5 7.8 21.9 0.8 2.2 5.0 20.1 5 Canola/rapeseed 25.7 10.0 39.0 0.7 2.6 5.6 19.5 6 Barnyard grass species 17.8 8.3 46.3 1.1 6.0 11.4 19.4 7 Biennial wormwood 30.8 5.9 19.0 0.4 1.4 2.4 14.6 8 Green foxtail 22.6 4.9 21.6 0.3 1.4 8.2 11.4 9 Lamb's-quarters 25.0 3.8 15.2 0.2 0.9 3.4 10.1 10 Thyme-leaved spurge 23.0 3.5 15.4 0.2 0.8 1.4 9.1 11 Dandelion 13.5 3.8 28.5 0.3 2.4 4.4 8.7 12 Willow species 28.3 1.5 5.3 0.1 0.2 0.8 7.3 13 Pale smartweed 19.9 2.1 10.5 0.2 0.8 1.4 6.9 14 Golden dock 17.9 1.8 10.1 0.1 0.6 1.8 6.0 15 Spiny annual sow-thistle 14.7 2.1 14.2 0.1 0.9 5.4 5.8 16 Wild oats 14.3 1.1 7.5 0.2 1.4 2.6 5.3 17 Purslane 10.1 2.1 20.4 0.1 1.5 5.6 5.0 18 Common yellow wood-sorrel 7.1 1.4 20.0 0.3 3.6 3.6 4.6 19 Marsh yellow cress 8.3 1.8 21.1 0.1 0.8 1.0 3.8 20 Northern willowherb 12.9 0.6 5.0 0.1 0.4 0.6 3.5 21 Witch grass 6.5 0.6 10.0 < 0.1 0.6 0.6 2.1 22 Showy milkweed 6.7 0.3 5.0 < 0.1 0.6 0.6 1.9 23 Oak-leaved goosefoot 6.5 0.3 5.0 < 0.1 0.6 0.6 1.8 24 American dragonhead 7.1 0.4 5.0 < 0.1 0.2 0.2 1.8 25 Wild mustard 7.1 0.4 5.0 < 0.1 0.2 0.2 1.8 26 Narrow-leaved hawk's-beard 6.5 0.3 5.0 < 0.1 0.4 0.4 1.7 27 Dock species 6.5 0.3 5.0 < 0.1 0.4 0.4 1.7 28 Kochia 6.5 0.3 5.0 < 0.1 0.2 0.2 1.6 29 Scouring-rush 6.5 0.3 5.0 < 0.1 0.2 0.2 1.6 30 Buffalograss 6.5 0.3 5.0 < 0.1 0.2 0.2 1.6 31 Tumble pigweed 4.5 0.4 10.0 < 0.1 0.4 0.4 1.4 32 Round-leaved mallow 4.5 0.2 5.0 < 0.1 0.4 0.4 1.2

Field Survey Summary Tables – Grey
130
Table 88. 2016 Annual crops in Grey in the Central Crop Reporting District (12 fields) Frequency Field Uniformity Field Density (#/m2) Relative
Rank Species (%) All Occurrence All Occurrence High Abundance 1 Wild buckwheat 62.8 17.8 28.3 1.2 1.8 5.8 47.8 2 Green foxtail 28.4 6.9 24.4 1.2 4.2 32.2 27.9 3 Redroot pigweed 36.9 9.7 26.4 0.6 1.6 4.4 26.2 4 Canola/rapeseed 25.2 7.2 28.5 0.6 2.2 3.6 20.3 5 Barnyard grass species 20.6 6.8 33.2 0.7 3.4 7.0 20.2 6 Pale smartweed 32.1 5.5 17.2 0.4 1.3 3.0 18.9 7 Common pepper-grass 6.5 3.6 55.0 1.2 18.0 18.0 18.3 8 Marsh yellow cress 19.2 6.3 32.6 0.5 2.4 3.6 16.8 9 Lamb's-quarters 7.2 4.3 60.0 0.5 6.8 6.8 11.9 10 Purslane speedwell 6.5 2.6 40.0 0.7 10.4 10.4 11.9 11 Broad-leaved plantain 9.9 3.9 40.0 0.4 3.8 3.8 10.9 12 Biennial wormwood 16.3 2.3 14.0 0.1 0.6 1.0 7.8 13 Needle-and-thread grass 9.9 2.0 20.0 0.2 1.6 1.6 6.4 14 Yellow foxtail 9.9 2.0 20.0 0.1 1.0 1.0 5.7 15 Field horsetail 6.5 1.0 15.0 0.3 4.2 4.2 5.7 16 Purslane 7.2 2.2 30.0 0.1 1.2 1.2 5.1 17 Rough cinquefoil 12.7 0.6 5.0 0.1 0.8 1.0 5.1 18 Bicknell's geranium 7.2 1.8 25.0 0.1 1.6 1.6 5.1 19 Shepherd's-purse 9.9 1.0 10.0 0.1 1.0 1.0 4.7 20 Narrow-leaved hawk's-beard 7.2 1.4 20.0 0.1 1.0 1.0 4.2 21 Maple-leaved goosefoot 6.5 1.3 20.0 0.1 0.8 0.8 3.6 22 Wheat 10.5 0.5 5.0 < 0.1 0.2 0.2 3.5 23 Large crab grass 6.5 1.0 15.0 0.1 0.8 0.8 3.3 24 Prostrate pigweed 9.9 0.5 5.0 < 0.1 0.2 0.2 3.3 25 Stink grass 7.2 0.7 10.0 0.1 0.8 0.8 3.3 26 Round-leaved mallow 6.5 0.3 5.0 < 0.1 0.2 0.2 2.2

Field Survey Summary Tables – Lorne
131
Table 89. 2016 Annual crops in Lorne in the Central Crop Reporting District (10 fields) Frequency Field Uniformity Field Density (#/m2) Relative
Rank Species (%) All Occurrence All Occurrence High Abundance 1 Green foxtail 28.1 13.4 47.5 5.2 18.3 40.4 53.9 2 Chickweed 50.5 16.5 32.7 2.0 4.0 10.2 41.7 3 Wild buckwheat 44.3 19.2 43.3 1.8 4.0 8.6 41.1 4 Stinkweed 12.6 9.4 75.0 1.7 13.6 13.6 23.4 5 Canola/rapeseed 24.8 8.2 32.9 0.9 3.5 13.4 19.8 6 Dandelion 40.9 3.3 8.0 0.2 0.5 1.2 14.8 7 Yellow foxtail 12.6 5.0 40.0 0.7 5.8 5.8 12.8 8 Barnyard grass species 15.7 4.6 29.3 0.5 3.3 4.2 11.8 9 Wheat 19.1 2.7 14.2 0.5 2.7 10.4 10.9 10 Wild oats 13.2 4.6 35.0 0.2 1.6 1.6 9.1 11 Shepherd's-purse 25.8 1.9 7.4 0.1 0.4 0.6 9.0 12 Thyme-leaved spurge 12.6 3.1 25.0 0.3 2.6 2.6 8.3 13 Night-flowering catchfly 12.1 3.0 25.0 0.3 2.6 2.6 8.0 14 Spear-leaved goosefoot 12.6 3.1 25.0 0.2 1.4 1.4 7.3 15 Hemp-nettle 13.2 2.0 15.0 0.1 0.6 0.6 5.7 16 Pale smartweed 13.2 2.0 15.0 0.1 0.6 0.6 5.7 17 Lamb's-quarters 16.6 0.8 5.0 < 0.1 0.2 0.4 5.3 18 Canada thistle 12.6 0.6 5.0 < 0.1 0.2 0.2 4.0 19 Round-leaved mallow 3.4 1.7 50.0 0.1 3.8 3.8 3.3 20 Perennial sow-thistle 3.4 0.9 25.0 < 0.1 1.4 1.4 2.0 21 American dragonhead 3.6 0.2 5.0 < 0.1 0.2 0.2 1.1 22 False ragweed 3.4 0.2 5.0 < 0.1 0.2 0.2 1.1

Field Survey Summary Tables – Louise
132
Table 90. 2016 Annual crops in Louise in the Central Crop Reporting District (11 fields) Frequency Field Uniformity Field Density (#/m2) Relative
Rank Species (%) All Occurrence All Occurrence High Abundance 1 Green foxtail 26.4 9.7 36.6 1.5 5.9 15.8 44.3 2 Round-leaved mallow 80.9 9.0 11.1 0.5 0.6 1.6 37.3 3 Wild buckwheat 59.9 9.4 15.7 0.5 0.9 3.0 33.6 4 Canada thistle 17.4 6.4 36.7 0.6 3.6 8.8 22.6 5 Night-flowering catchfly 27.8 5.7 20.5 0.4 1.4 4.8 19.9 6 Redroot pigweed 27.3 5.4 19.6 0.4 1.3 2.4 19.0 7 Wild oats 20.9 3.7 17.5 0.4 2.0 3.8 16.2 8 Dandelion 16.9 4.3 25.2 0.3 1.5 2.6 13.5 9 Canola/rapeseed 39.6 2.5 6.2 0.1 0.2 0.4 13.1 10 Spiny annual sow-thistle 20.5 3.6 17.4 0.1 0.7 0.8 11.4 11 Shepherd's-purse 19.9 3.1 15.4 0.1 0.7 1.4 10.6 12 Stork's bill 10.0 2.5 25.0 0.2 1.6 1.6 8.1 13 Barnyard grass species 16.9 1.2 7.0 0.1 0.7 0.8 7.1 14 Chickweed 10.5 1.0 10.0 0.2 2.0 2.0 7.1 15 Pale smartweed 6.9 1.7 25.0 0.2 2.4 2.4 6.5 16 Foxtail barley 10.5 0.5 5.0 0.1 0.6 0.6 3.9 17 Kochia 10.5 0.5 5.0 < 0.1 0.2 0.2 3.2 18 Lamb's-quarters 10.5 0.5 5.0 < 0.1 0.2 0.2 3.2 19 False cleavers 10.5 0.5 5.0 < 0.1 0.2 0.2 3.2 20 Wheat 10.5 0.5 5.0 < 0.1 0.2 0.2 3.2 21 Dock species 10.5 0.5 5.0 < 0.1 0.2 0.2 3.2 22 Annual sow-thistle 10.0 0.5 5.0 < 0.1 0.2 0.2 3.0 23 Broad-leaved plantain 9.1 0.5 5.0 < 0.1 0.2 0.2 2.8 24 Green pigweed 2.6 0.9 35.0 < 0.1 1.8 1.8 2.5 25 Quack grass 2.6 0.4 15.0 < 0.1 1.4 1.4 1.6

Field Survey Summary Tables – MacDonald
133
Table 91. 2016 Annual crops in MacDonald in the Central Crop Reporting District (19 fields) Frequency Field Uniformity Field Density (#/m2) Relative
Rank Species (%) All Occurrence All Occurrence High Abundance 1 Canola/rapeseed 20.4 13.2 64.6 2.2 11.0 18.2 46.4 2 Green foxtail 5.8 5.2 90.0 3.8 65.2 65.2 44.7 3 Barnyard grass species 43.6 8.4 19.3 1.2 2.8 9.0 36.7 4 Pale smartweed 49.8 8.3 16.6 0.9 1.7 6.8 35.3 5 Wild oats 18.1 7.9 43.8 0.9 4.9 9.8 25.2 6 Wild buckwheat 35.3 6.0 17.0 0.3 1.0 3.6 22.5 7 Yellow foxtail 23.6 3.0 12.9 0.3 1.2 2.0 14.2 8 Redroot pigweed 19.6 3.8 19.3 0.2 1.1 2.2 13.5 9 Canada thistle 19.6 2.4 12.5 0.3 1.8 3.2 12.7 10 Foxtail barley 17.8 1.2 6.6 < 0.1 0.3 0.4 7.5 11 Round-leaved mallow 7.3 2.2 29.9 0.1 1.7 2.0 6.6 12 Perennial sow-thistle 11.6 0.9 7.5 < 0.1 0.3 0.4 5.1 13 Wheat 11.6 0.6 5.0 0.1 0.6 0.8 5.0 14 Tartary buckwheat 6.7 1.3 20.0 0.1 1.0 1.0 4.6 15 Dandelion 8.3 0.9 10.9 < 0.1 0.4 0.6 4.2 16 Oak-leaved goosefoot 5.8 0.6 10.0 < 0.1 0.8 0.8 3.0 17 Clammy hedge-hyssop 5.8 0.3 5.0 0.1 1.2 1.2 2.8 18 Marsh yellow cress 5.8 0.6 10.0 < 0.1 0.4 0.4 2.8 19 Prostrate knotweed 5.8 0.3 5.0 < 0.1 0.2 0.2 2.3 20 Dock species 5.5 0.3 5.0 < 0.1 0.2 0.2 2.2 21 Spiny annual sow-thistle 1.5 0.2 15.0 < 0.1 0.6 0.6 0.9 22 Stork's bill 1.5 0.2 15.0 < 0.1 0.6 0.6 0.9 23 Yellow sweet-clover 1.6 0.1 5.0 < 0.1 0.2 0.2 0.6 24 Thyme-leaved spurge 1.5 0.1 5.0 < 0.1 0.2 0.2 0.6

Field Survey Summary Tables – Morris
134
Table 92. 2016 Annual crops in Morris in the Central Crop Reporting District (19 fields) Frequency Field Uniformity Field Density (#/m2) Relative
Rank Species (%) All Occurrence All Occurrence High Abundance 1 Green foxtail 15.1 11.0 73.2 10.7 70.8 163.4 54.9 2 Dandelion 68.4 16.5 24.2 2.4 3.6 26.4 34.4 3 Wild buckwheat 53.6 14.5 27.0 1.3 2.4 8.8 25.5 4 Round-leaved mallow 35.5 10.4 29.4 1.6 4.5 14.2 20.6 5 Canola/rapeseed 27.1 7.1 26.2 2.1 7.7 30.6 18.6 6 Redroot pigweed 42.1 8.8 21.0 0.4 1.0 2.8 15.7 7 Wheat 31.9 8.0 25.2 0.7 2.1 7.0 14.4 8 Yellow foxtail 21.1 6.5 31.0 1.3 6.1 17.8 13.9 9 Biennial wormwood 42.0 5.8 13.8 0.3 0.8 4.4 13.0 10 Canada thistle 30.5 6.1 20.0 0.5 1.8 4.8 12.1 11 Pale smartweed 42.7 4.0 9.3 0.2 0.4 1.2 11.1 12 Lamb's-quarters 7.6 4.6 61.1 1.0 13.0 16.4 8.9 13 Thyme-leaved spurge 31.7 3.0 9.6 0.1 0.4 1.0 8.3 14 Spiny annual sow-thistle 8.0 5.2 65.7 0.4 4.5 4.8 6.9 15 Soybean 19.7 1.3 6.5 0.1 0.3 0.4 4.5 16 Rough cinquefoil 6.3 1.9 30.0 0.2 3.0 3.0 3.3 17 Oak-leaved goosefoot 6.3 0.9 15.0 0.4 5.6 5.6 3.2 18 Dock species 6.3 1.6 25.0 0.2 2.4 2.4 2.9 19 Wild mustard 7.6 1.4 18.9 0.1 0.9 1.0 2.7 20 Marsh yellow cress 10.4 0.7 7.0 0.1 0.6 0.8 2.6 21 Wild oats 4.9 1.2 25.0 0.1 1.8 1.8 2.1 22 Aster species 6.3 0.9 15.0 0.1 1.2 1.2 2.1 23 Tumble pigweed 6.3 0.9 15.0 0.1 1.0 1.0 2.0 24 Bur oak 6.3 0.9 15.0 < 0.1 0.6 0.6 1.9 25 Broad-leaved plantain 6.3 0.9 15.0 < 0.1 0.6 0.6 1.9 26 Showy milkweed 6.3 0.6 10.0 0.1 1.0 1.0 1.8 27 Goldenrod species 6.3 0.6 10.0 < 0.1 0.4 0.4 1.6 28 Rush species 6.3 0.6 10.0 < 0.1 0.4 0.4 1.6 29 Beggarticks species 6.3 0.6 10.0 < 0.1 0.4 0.4 1.6 30 Barnyard grass species 5.8 0.5 8.5 < 0.1 0.5 0.6 1.5 31 Northern willowherb 6.3 0.3 5.0 < 0.1 0.2 0.2 1.4 32 Foxtail barley 5.0 0.4 8.4 < 0.1 0.5 0.6 1.3 33 Perennial sow-thistle 5.7 0.3 5.0 < 0.1 0.2 0.2 1.2 34 Common ragweed 1.6 0.1 5.0 < 0.1 0.2 0.2 0.3

Field Survey Summary Tables – Norfolk Treherne & Victoria
135
Table 93. 2016 Annual crops in Norfolk Treherne & Victoria in the Central Crop Reporting District (14 fields) Frequency Field Uniformity Field Density (#/m2) Relative
Rank Species (%) All Occurrence All Occurrence High Abundance 1 Wild mustard 9.4 9.4 100.0 8.4 89.4 89.4 34.7 2 Pale smartweed 51.5 19.8 38.5 4.3 8.3 23.2 33.9 3 Redroot pigweed 40.8 18.9 46.4 3.1 7.7 16.6 28.0 4 Barnyard grass species 64.8 16.1 24.8 2.1 3.3 15.0 26.7 5 Canola/rapeseed 39.2 12.5 31.9 2.3 5.8 28.8 21.0 6 Wild buckwheat 48.2 12.6 26.2 1.4 2.9 13.8 19.6 7 Canada thistle 41.6 10.1 24.4 1.9 4.6 17.2 18.9 8 Wild oats 48.3 9.4 19.5 0.9 1.8 7.2 16.0 9 Lamb's-quarters 31.7 11.9 37.6 1.1 3.6 8.0 15.8 10 Green foxtail 38.2 6.7 17.4 0.5 1.3 4.6 11.5 11 Chickweed 12.1 4.7 39.3 0.8 6.3 23.0 7.2 12 Round-leaved mallow 24.9 4.0 16.1 0.3 1.0 3.0 7.1 13 Kochia 17.4 4.3 24.7 0.4 2.2 3.6 6.5 14 Stinkweed 6.4 2.6 40.0 1.0 15.6 15.6 5.8 15 Rough cinquefoil 6.4 3.8 60.0 0.6 9.2 9.2 5.2 16 Dock species 6.4 4.5 70.0 0.4 5.8 5.8 4.9 17 Wheat 23.8 1.5 6.1 0.1 0.3 1.4 4.8 18 Spiny annual sow-thistle 21.5 1.5 7.1 0.1 0.4 0.6 4.5 19 Prostrate pigweed 15.5 1.1 7.1 < 0.1 0.3 0.4 3.2 20 Dandelion 8.9 1.8 20.0 0.1 0.8 0.8 2.7 21 Yellow foxtail 6.4 1.6 25.0 0.2 3.0 3.0 2.6 22 Night-flowering catchfly 9.1 1.2 13.5 0.1 1.1 1.4 2.5 23 Prickly lettuce 9.8 0.5 5.0 0.1 0.8 0.8 2.1 24 Absinth 9.8 0.5 5.0 < 0.1 0.2 0.2 1.9 25 False ragweed 9.8 0.5 5.0 < 0.1 0.2 0.2 1.9 26 Annual sow-thistle 2.5 1.4 55.0 0.2 7.6 7.6 1.8 27 Wormseed mustard 6.4 0.6 10.0 < 0.1 0.6 0.6 1.5 28 Purslane 6.4 0.6 10.0 < 0.1 0.4 0.4 1.5 29 Broad-leaved plantain 6.4 0.3 5.0 0.1 0.8 0.8 1.4 30 American dragonhead 6.4 0.3 5.0 < 0.1 0.2 0.2 1.2 31 Narrow-leaved hawk's-beard 6.4 0.3 5.0 < 0.1 0.2 0.2 1.2 32 Hemp-nettle 2.6 0.8 30.0 0.1 2.4 2.4 1.1 33 Stork's bill 2.5 0.5 20.0 < 0.1 1.6 1.6 0.8 34 Biennial wormwood 2.5 0.2 10.0 < 0.1 0.4 0.4 0.6

Field Survey Summary Tables – North Norfolk
136
Table 94. 2016 Annual crops in North Norfolk in the Central Crop Reporting District (11 fields) Frequency Field Uniformity Field Density (#/m2) Relative
Rank Species (%) All Occurrence All Occurrence High Abundance 1 Green foxtail 50.4 22.8 45.3 10.6 21.0 74.0 49.2 2 Wheat 31.3 19.5 62.1 5.1 16.2 39.4 29.3 3 Wild buckwheat 42.7 21.8 51.2 3.1 7.2 12.6 26.8 4 Redroot pigweed 49.7 16.5 33.2 1.9 3.9 10.6 21.8 5 Canola/rapeseed 28.4 15.0 52.7 3.2 11.3 35.6 21.2 6 Lamb's-quarters 32.7 11.9 36.3 2.9 8.8 43.0 19.3 7 Pale smartweed 41.1 14.5 35.2 1.7 4.1 10.0 18.7 8 Perennial sow-thistle 39.0 12.1 30.9 1.3 3.4 6.8 16.0 9 Dock species 29.6 8.9 29.9 1.6 5.4 8.0 13.7 10 Yellow foxtail 29.2 8.4 28.6 0.8 2.7 5.0 11.1 11 Barnyard grass species 8.4 7.5 90.0 2.0 23.8 23.8 10.8 12 Golden dock 29.2 2.9 10.1 0.3 1.0 2.2 6.8 13 Broad-leaved plantain 21.5 4.9 22.7 0.2 1.1 1.2 6.5 14 American dragonhead 17.7 2.4 13.3 0.1 0.7 1.2 4.3 15 Manitoba maple 22.0 1.1 5.0 0.1 0.4 0.6 4.2 16 Biennial wormwood 9.7 3.9 40.0 0.2 2.0 2.0 4.1 17 Oak-leaved goosefoot 21.5 1.1 5.0 0.1 0.3 0.4 4.0 18 Wild oats 8.4 2.1 25.0 0.3 3.6 3.6 3.2 19 Canada thistle 14.6 1.1 7.6 0.1 0.8 1.4 3.2 20 Purslane 15.3 1.2 8.1 < 0.1 0.3 0.4 3.1 21 Round-leaved mallow 15.3 0.8 5.0 < 0.1 0.2 0.2 2.8 22 Black medick 9.7 1.5 15.0 0.1 1.2 1.2 2.6 23 Foxtail barley 9.7 0.5 5.0 0.2 1.6 1.6 2.2 24 Field bean 10.2 0.5 5.0 < 0.1 0.2 0.2 1.9 25 Hedge bindweed 9.7 0.5 5.0 < 0.1 0.2 0.2 1.8 26 Night-flowering catchfly 9.7 0.5 5.0 < 0.1 0.2 0.2 1.8 27 Maple-leaved goosefoot 9.7 0.5 5.0 < 0.1 0.2 0.2 1.8 28 Wild mustard 9.3 0.5 5.0 < 0.1 0.2 0.2 1.7 29 Yellow sweet-clover 9.3 0.5 5.0 < 0.1 0.2 0.2 1.7 30 Willow species 7.7 0.8 10.0 < 0.1 0.6 0.6 1.7 31 Chickweed 7.7 0.4 5.0 < 0.1 0.2 0.2 1.4 32 Dandelion 7.7 0.4 5.0 < 0.1 0.2 0.2 1.4

Field Survey Summary Tables – Pembina
137
Table 95. 2016 Annual crops in Pembina in the Central Crop Reporting District (11 fields) Frequency Field Uniformity Field Density (#/m2) Relative
Rank Species (%) All Occurrence All Occurrence High Abundance 1 Wild buckwheat 81.1 24.7 30.4 1.5 1.8 4.2 42.6 2 Green foxtail 27.1 9.9 36.6 4.6 17.1 51.0 37.2 3 Wild oats 63.6 15.5 24.4 1.8 2.8 9.4 33.7 4 Canada thistle 27.0 10.8 40.0 3.2 11.9 33.8 30.5 5 Canola/rapeseed 44.3 10.9 24.7 0.5 1.1 3.0 19.7 6 Annual sow-thistle 9.0 8.5 95.0 2.0 22.6 22.6 19.1 7 Spiny annual sow-thistle 18.4 10.4 56.6 1.1 6.1 11.2 17.5 8 Soybean 9.0 7.6 85.0 1.0 11.4 11.4 13.1 9 Night-flowering catchfly 35.6 4.9 13.8 0.4 1.1 2.4 12.7 10 Round-leaved mallow 35.3 3.1 8.7 0.3 1.0 3.2 11.0 11 Golden dock 9.0 4.0 45.0 1.0 11.4 11.4 10.3 12 Dandelion 27.1 2.7 10.0 0.3 0.9 2.4 8.6 13 Barnyard grass species 18.0 4.0 22.5 0.4 2.1 2.6 8.6 14 Hemp-nettle 27.0 2.2 8.3 0.2 0.6 1.0 7.8 15 Broad-leaved plantain 9.0 4.0 45.0 0.3 3.8 3.8 6.7 16 Yellow foxtail 26.6 1.3 5.0 0.1 0.2 0.2 6.4 17 Foxtail barley 9.0 0.9 10.0 0.1 1.4 1.4 3.1 18 Wheat 9.4 0.9 10.0 0.1 0.6 0.6 2.8 19 Pale smartweed 9.0 0.4 5.0 < 0.1 0.4 0.4 2.3 20 Thyme-leaved spurge 9.0 0.4 5.0 < 0.1 0.2 0.2 2.2 21 Biennial wormwood 9.0 0.4 5.0 < 0.1 0.2 0.2 2.2 22 Lamb's-quarters 8.7 0.4 5.0 < 0.1 0.2 0.2 2.1
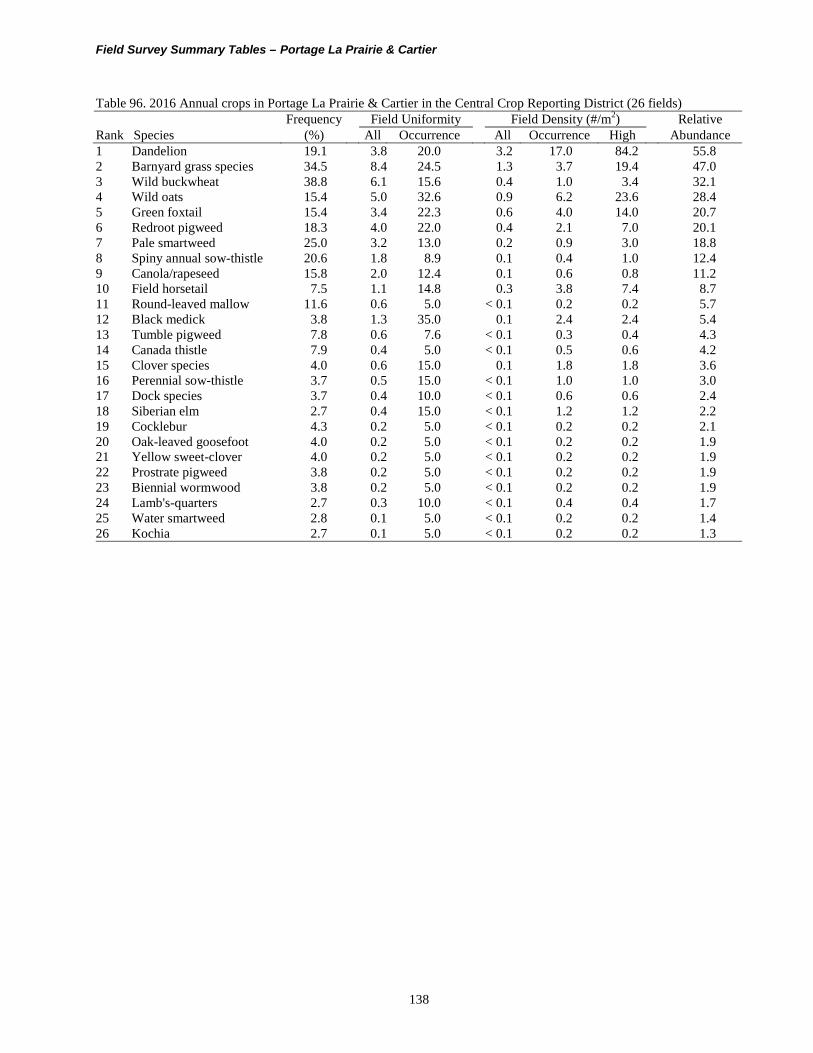
Field Survey Summary Tables – Portage La Prairie & Cartier
138
Table 96. 2016 Annual crops in Portage La Prairie & Cartier in the Central Crop Reporting District (26 fields) Frequency Field Uniformity Field Density (#/m2) Relative
Rank Species (%) All Occurrence All Occurrence High Abundance 1 Dandelion 19.1 3.8 20.0 3.2 17.0 84.2 55.8 2 Barnyard grass species 34.5 8.4 24.5 1.3 3.7 19.4 47.0 3 Wild buckwheat 38.8 6.1 15.6 0.4 1.0 3.4 32.1 4 Wild oats 15.4 5.0 32.6 0.9 6.2 23.6 28.4 5 Green foxtail 15.4 3.4 22.3 0.6 4.0 14.0 20.7 6 Redroot pigweed 18.3 4.0 22.0 0.4 2.1 7.0 20.1 7 Pale smartweed 25.0 3.2 13.0 0.2 0.9 3.0 18.8 8 Spiny annual sow-thistle 20.6 1.8 8.9 0.1 0.4 1.0 12.4 9 Canola/rapeseed 15.8 2.0 12.4 0.1 0.6 0.8 11.2 10 Field horsetail 7.5 1.1 14.8 0.3 3.8 7.4 8.7 11 Round-leaved mallow 11.6 0.6 5.0 < 0.1 0.2 0.2 5.7 12 Black medick 3.8 1.3 35.0 0.1 2.4 2.4 5.4 13 Tumble pigweed 7.8 0.6 7.6 < 0.1 0.3 0.4 4.3 14 Canada thistle 7.9 0.4 5.0 < 0.1 0.5 0.6 4.2 15 Clover species 4.0 0.6 15.0 0.1 1.8 1.8 3.6 16 Perennial sow-thistle 3.7 0.5 15.0 < 0.1 1.0 1.0 3.0 17 Dock species 3.7 0.4 10.0 < 0.1 0.6 0.6 2.4 18 Siberian elm 2.7 0.4 15.0 < 0.1 1.2 1.2 2.2 19 Cocklebur 4.3 0.2 5.0 < 0.1 0.2 0.2 2.1 20 Oak-leaved goosefoot 4.0 0.2 5.0 < 0.1 0.2 0.2 1.9 21 Yellow sweet-clover 4.0 0.2 5.0 < 0.1 0.2 0.2 1.9 22 Prostrate pigweed 3.8 0.2 5.0 < 0.1 0.2 0.2 1.9 23 Biennial wormwood 3.8 0.2 5.0 < 0.1 0.2 0.2 1.9 24 Lamb's-quarters 2.7 0.3 10.0 < 0.1 0.4 0.4 1.7 25 Water smartweed 2.8 0.1 5.0 < 0.1 0.2 0.2 1.4 26 Kochia 2.7 0.1 5.0 < 0.1 0.2 0.2 1.3

Field Survey Summary Tables – Rhineland & Montcalm
139
Table 97. 2016 Annual crops in Rhineland & Montcalm in the Central Crop Reporting District (24 fields) Frequency Field Uniformity Field Density (#/m2) Relative
Rank Species (%) All Occurrence All Occurrence High Abundance 1 Redroot pigweed 43.6 9.2 21.1 0.7 1.6 4.8 51.7 2 Canola/rapeseed 23.7 8.7 36.7 0.7 2.8 6.8 43.0 3 Round-leaved mallow 39.4 4.4 11.2 0.2 0.6 2.2 28.6 4 Barnyard grass species 18.1 4.8 26.8 0.2 1.2 2.0 21.3 5 Lamb's-quarters 25.5 4.0 15.6 0.2 0.7 2.8 21.2 6 Dandelion 16.5 3.5 21.5 0.2 1.3 3.4 18.3 7 Wild buckwheat 8.5 3.8 44.2 0.2 2.9 4.6 16.9 8 Spiny annual sow-thistle 13.8 3.2 23.1 0.2 1.5 1.8 16.4 9 Oak-leaved goosefoot 9.1 1.6 17.9 0.2 2.1 2.8 11.7 10 Pale smartweed 13.1 1.8 13.8 0.1 1.0 5.6 11.7 11 Purslane 12.5 2.2 17.6 0.1 0.9 1.8 11.6 12 Biennial wormwood 12.7 1.4 10.7 0.1 0.5 0.8 8.7 13 Yellow foxtail 9.4 1.0 10.8 0.1 0.8 1.4 7.2 14 Wild oats 8.5 0.4 5.0 0.1 1.1 1.4 6.4 15 Canada thistle 5.3 0.7 12.4 0.1 1.5 2.0 5.3 16 Willow species 5.4 0.8 15.0 0.1 1.0 1.0 4.9 17 Wild mustard 5.4 0.5 10.0 < 0.1 0.4 0.4 3.4 18 Povertyweed 4.9 0.2 5.0 < 0.1 0.2 0.2 2.4 19 Foxtail barley 3.9 0.2 5.0 < 0.1 0.4 0.4 2.1 20 Green foxtail 3.8 0.2 5.0 < 0.1 0.2 0.2 1.8 21 Yellow sweet-clover 3.6 0.2 5.0 < 0.1 0.2 0.2 1.8 22 Siberian elm 3.6 0.2 5.0 < 0.1 0.2 0.2 1.8 23 Bicknell's geranium 1.4 0.1 10.0 < 0.1 0.4 0.4 0.9 24 Oats 1.4 0.1 5.0 < 0.1 0.4 0.4 0.8

Field Survey Summary Tables – Stanley
140
Table 98. 2016 Annual crops in Stanley in the Central Crop Reporting District (14 fields) Frequency Field Uniformity Field Density (#/m2) Relative
Rank Species (%) All Occurrence All Occurrence High Abundance 1 Yellow foxtail 33.5 14.9 44.5 4.2 12.6 42.6 52.7 2 Round-leaved mallow 54.7 15.2 27.8 1.8 3.3 17.4 37.7 3 Canola/rapeseed 48.5 14.0 28.8 1.2 2.4 7.6 30.2 4 Wild buckwheat 49.1 12.9 26.2 0.9 1.8 4.4 27.1 5 Purslane 28.3 8.7 30.8 0.5 1.9 4.2 17.0 6 Redroot pigweed 15.5 6.9 44.2 0.5 3.5 4.2 13.0 7 Dandelion 21.8 6.2 28.5 0.3 1.5 1.8 12.0 8 Canada thistle 29.7 4.7 15.8 0.3 0.9 1.6 11.9 9 Lamb's-quarters 22.0 5.2 23.5 0.3 1.4 1.8 11.1 10 Black medick 17.6 4.4 24.9 0.2 1.1 1.4 8.6 11 Wheat 11.1 4.0 35.6 0.3 2.7 3.0 7.8 12 Spiny annual sow-thistle 24.7 2.4 9.6 0.1 0.4 0.8 7.6 13 Foxtail barley 13.1 3.0 22.5 0.2 1.4 2.2 6.5 14 Wild oats 11.9 3.0 24.9 0.2 1.5 1.8 6.1 15 Green foxtail 2.4 2.3 95.0 0.4 17.6 17.6 5.8 16 Broad-leaved plantain 13.1 2.0 15.0 0.1 1.0 1.2 5.2 17 Wild mustard 11.7 2.1 18.1 0.1 0.8 1.6 4.8 18 Tumble pigweed 9.3 1.9 20.0 0.2 1.8 1.8 4.7 19 Stink grass 6.6 2.3 35.0 0.2 2.4 2.4 4.4 20 Barley 8.7 0.9 10.0 0.1 0.8 0.8 3.0 21 Barnyard grass species 6.6 1.3 20.0 0.1 1.0 1.0 2.9 22 Clover species 8.7 0.9 10.0 < 0.1 0.4 0.4 2.7 23 Kochia 9.0 0.8 8.6 < 0.1 0.3 0.4 2.7 24 Night-flowering catchfly 9.4 0.5 5.0 < 0.1 0.4 0.4 2.5 25 Siberian elm 9.3 0.5 5.0 < 0.1 0.2 0.2 2.4 26 Biennial wormwood 6.2 0.9 15.0 < 0.1 0.6 0.6 2.3 27 Absinth 8.7 0.4 5.0 < 0.1 0.2 0.2 2.2 28 Northern willowherb 8.7 0.4 5.0 < 0.1 0.2 0.2 2.2 29 Perennial sow-thistle 2.4 0.9 35.0 < 0.1 1.6 1.6 1.5 30 Pale smartweed 2.4 0.2 10.0 < 0.1 1.0 1.0 0.9 31 Showy milkweed 2.5 0.3 10.0 < 0.1 0.4 0.4 0.8

Field Survey Summary Tables – Thompson & Roland
141
Table 99. 2016 Annual crops in Thompson & Roland in the Central Crop Reporting District (19 fields) Frequency Field Uniformity Field Density (#/m2) Relative
Rank Species (%) All Occurrence All Occurrence High Abundance 1 Yellow foxtail 40.3 13.6 33.6 1.4 3.4 13.6 34.1 2 Dandelion 42.1 10.6 25.0 0.9 2.2 7.8 27.5 3 Round-leaved mallow 36.2 7.9 21.7 0.5 1.5 4.0 19.8 4 Wild buckwheat 31.2 8.5 27.2 0.5 1.8 4.2 19.5 5 Green foxtail 12.6 7.0 55.6 1.1 8.4 14.0 19.3 6 Canada thistle 39.7 7.0 17.6 0.3 0.8 1.8 17.5 7 Purslane 12.6 6.7 53.4 0.7 5.9 8.4 16.0 8 Barnyard grass species 16.5 4.7 28.6 0.8 4.8 18.4 15.5 9 Canola/rapeseed 23.8 6.8 28.7 0.4 1.6 2.4 14.8 10 Wheat 24.1 3.4 14.3 0.2 0.9 2.4 10.2 11 Black medick 15.7 2.6 16.5 0.4 2.4 6.0 9.4 12 Wild oats 11.9 2.1 17.4 0.4 3.4 4.8 8.3 13 Golden dock 6.0 3.3 55.0 0.4 6.6 6.6 8.1 14 Thyme-leaved spurge 15.6 2.7 17.1 0.2 1.5 3.0 8.0 15 Kochia 18.0 2.4 13.1 0.1 0.6 1.4 7.0 16 Foxtail barley 11.8 2.6 22.4 0.2 1.7 2.2 6.8 17 Redroot pigweed 11.6 2.2 18.6 0.2 2.0 2.8 6.6 18 Wild mustard 13.8 2.8 20.1 0.1 0.9 1.8 6.6 19 Leafy spurge 6.0 3.0 50.0 0.3 4.4 4.4 6.6 20 Stink grass 7.9 2.2 28.1 0.1 1.7 3.2 5.0 21 Flodman's thistle 10.1 1.6 16.0 0.1 1.4 2.0 4.9 22 Spiny annual sow-thistle 12.4 1.2 10.0 < 0.1 0.4 0.4 4.2 23 Lamb's-quarters 11.6 0.6 5.0 < 0.1 0.2 0.2 3.1 24 Biennial wormwood 5.5 1.4 25.0 0.1 1.2 1.2 3.0 25 Field horsetail 1.5 0.8 55.0 0.2 11.4 11.4 2.8 26 Chickweed 5.4 1.1 20.0 0.1 1.0 1.0 2.6 27 Green pigweed 4.1 1.0 25.0 0.1 1.8 1.8 2.5 28 Prostrate knotweed 6.0 0.6 10.0 < 0.1 0.4 0.4 2.0 29 Oak-leaved goosefoot 7.0 0.3 5.0 < 0.1 0.2 0.2 1.9 30 Flixweed 6.0 0.3 5.0 < 0.1 0.2 0.2 1.6 31 American vetch 6.0 0.3 5.0 < 0.1 0.2 0.2 1.6 32 Toad rush 1.5 0.6 40.0 0.1 3.4 3.4 1.4 33 Clammy hedge-hyssop 4.1 0.2 5.0 < 0.1 0.2 0.2 1.1 34 Corn 1.5 0.3 20.0 < 0.1 1.0 1.0 0.7

Field Survey Summary Tables – WestLake-Gladstone & Glenella-Lansdowne
142
Table 100. 2016 Annual crops in WestLake-Gladstone & Glenella-Lansdowne in the Central Crop Reporting District (20 fields)
Frequency Field Uniformity Field Density (#/m2) Relative Rank Species (%) All Occurrence All Occurrence High Abundance 1 Green foxtail 54.4 27.1 49.9 19.1 35.2 98.0 55.9 2 Broad-leaved plantain 36.5 14.6 40.0 5.6 15.2 57.4 22.0 3 Wild oats 43.4 14.5 33.4 2.9 6.6 40.4 17.7 4 Barnyard grass species 40.1 9.7 24.3 4.1 10.2 40.4 17.3 5 Wild buckwheat 52.5 15.9 30.3 1.7 3.2 13.4 17.3 6 Redroot pigweed 44.9 11.3 25.1 1.5 3.5 12.0 13.8 7 Pale smartweed 21.4 10.8 50.6 2.6 12.4 24.8 12.9 8 Dandelion 53.2 8.5 16.0 0.7 1.3 5.0 11.9 9 Lamb's-quarters 30.8 7.7 25.1 1.4 4.6 17.8 10.2 10 Yellow foxtail 15.3 5.7 37.3 1.9 12.3 28.2 8.2 11 Perennial sow-thistle 31.0 4.9 15.7 0.3 1.1 4.2 6.8 12 Witch grass 6.4 1.9 30.0 2.7 41.8 41.8 6.8 13 Night-flowering catchfly 20.3 6.1 30.2 0.6 3.0 9.4 6.6 14 Northern willowherb 17.1 4.7 27.6 1.1 6.4 15.8 6.5 15 Wild mustard 13.0 5.2 40.4 1.1 8.7 16.2 6.3 16 Canola/rapeseed 23.7 4.3 18.3 0.3 1.2 2.0 5.5 17 Wheat 14.7 5.7 38.8 0.5 3.5 7.6 5.5 18 Canada thistle 28.8 2.6 8.9 0.2 0.8 2.0 5.2 19 Field horsetail 15.8 2.0 12.7 0.8 4.9 8.0 4.3 20 Tumble pigweed 17.1 3.5 20.8 0.2 1.1 1.8 4.2 21 Black medick 18.7 2.9 15.5 0.2 0.9 1.8 4.0 22 Dog mustard 11.9 3.8 32.1 0.2 1.8 3.0 3.7 23 Rough cinquefoil 14.8 3.1 20.8 0.1 0.9 1.0 3.5 24 Yellow sweet-clover 17.5 1.8 10.6 0.1 0.6 2.0 3.2 25 Thyme-leaved spurge 10.7 2.2 20.3 0.2 1.6 2.4 2.7 26 Maple-leaved goosefoot 16.9 0.8 5.0 0.1 0.4 1.0 2.6 27 Prostrate knotweed 9.4 1.9 20.3 0.2 2.6 3.4 2.5 28 Alfalfa 12.0 1.5 12.7 0.1 0.6 0.8 2.3 29 Tartary buckwheat 3.0 2.7 90.0 0.3 10.2 10.2 2.2 30 Canada fleabane 6.6 2.3 35.0 0.1 2.0 2.0 2.2 31 Oak-leaved goosefoot 11.7 0.9 7.7 0.1 0.9 1.2 2.1 32 Absinth 3.0 1.3 45.0 0.5 17.6 17.6 2.0 33 Purslane 11.7 0.9 7.8 0.1 0.5 0.8 2.0 34 Biennial wormwood 10.9 1.1 10.0 0.1 0.5 0.8 2.0 35 Spiny annual sow-thistle 5.3 2.1 40.0 0.1 2.8 2.8 2.0 36 Round-leaved mallow 12.0 0.6 5.0 < 0.1 0.4 0.6 1.8 37 Dock species 10.9 0.8 7.5 0.1 0.5 0.8 1.8 38 Foxtail barley 5.3 0.8 15.0 0.3 6.4 6.4 1.7 39 Perennial rye grass 4.1 1.7 40.0 0.2 3.8 3.8 1.6 40 Narrow-leaved hawk's-beard 5.2 1.0 20.0 0.1 1.4 1.4 1.3 41 Clover species 3.0 1.3 45.0 0.1 4.0 4.0 1.2 42 Showy milkweed 6.6 0.7 10.0 < 0.1 0.6 0.6 1.2 43 Silverweed 6.4 0.3 5.0 0.1 1.2 1.2 1.1 44 Willow species 4.1 0.6 15.0 0.1 2.8 2.8 1.0 45 Chickweed 6.4 0.3 5.0 < 0.1 0.4 0.4 1.0 46 Currant species 6.4 0.3 5.0 < 0.1 0.2 0.2 1.0 47 Marsh yellow cress 5.2 0.5 10.0 < 0.1 0.6 0.6 0.9 48 Yellow toadflax 4.3 0.2 5.0 < 0.1 0.2 0.2 0.6

Field Survey Summary Tables – Emerson-Franklin & De Salaberry
143
Table 101. 2016 Annual crops in Emerson-Franklin & De Salaberry in the Eastern Crop Reporting District (14 fields) Frequency Field Uniformity Field Density (#/m2) Relative
Rank Species (%) All Occurrence All Occurrence High Abundance 1 Redroot pigweed 61.0 17.9 29.3 1.7 2.8 14.4 45.6 2 Biennial wormwood 38.8 11.4 29.4 1.9 4.9 22.8 37.7 3 Wild buckwheat 77.9 11.0 14.1 0.7 0.9 2.4 30.1 4 Oak-leaved goosefoot 27.9 7.8 28.0 1.4 4.9 16.2 26.7 5 Wheat 39.1 9.9 25.4 0.9 2.4 5.8 25.8 6 Dandelion 31.6 7.3 23.2 0.6 2.1 8.2 19.1 7 Round-leaved mallow 31.5 5.9 18.7 0.4 1.3 2.0 15.0 8 Canola/rapeseed 37.1 4.4 11.7 0.2 0.5 1.0 12.2 9 Barnyard grass species 37.7 2.6 6.9 0.1 0.3 0.6 9.9 10 Clover species 8.8 4.8 55.0 0.2 2.6 2.6 8.5 11 Pale smartweed 36.5 1.8 5.0 0.1 0.2 0.2 8.4 12 Dock species 22.3 2.1 9.3 0.1 0.5 1.2 6.8 13 Broad-leaved plantain 14.6 3.1 21.0 0.1 0.8 1.0 6.6 14 Lamb's-quarters 14.2 2.1 15.0 0.2 1.3 2.4 6.3 15 Yellow foxtail 14.2 2.5 17.5 0.1 0.9 1.4 6.0 16 Spiny annual sow-thistle 12.9 2.1 16.2 0.1 0.8 1.6 5.2 17 Wild oats 21.7 1.1 5.0 < 0.1 0.2 0.2 5.0 18 Purslane 17.1 1.2 7.1 < 0.1 0.3 0.4 4.4 19 Green foxtail 12.9 0.6 5.0 < 0.1 0.3 0.4 3.1 20 Marsh yellow cress 8.8 0.9 10.0 < 0.1 0.4 0.4 2.6 21 Manitoba maple 7.1 0.7 10.0 < 0.1 0.4 0.4 2.1 22 Foxtail barley 8.8 0.4 5.0 < 0.1 0.2 0.2 2.0 23 Rough cinquefoil 8.8 0.4 5.0 < 0.1 0.2 0.2 2.0 24 Soybean 7.4 0.4 5.0 < 0.1 0.2 0.2 1.7 25 Perennial sow-thistle 7.1 0.4 5.0 < 0.1 0.2 0.2 1.6 26 Thyme-leaved spurge 7.1 0.4 5.0 < 0.1 0.2 0.2 1.6 27 Common ragweed 4.2 0.4 10.0 < 0.1 0.4 0.4 1.3 28 Sunflower 4.2 0.4 10.0 < 0.1 0.4 0.4 1.3 29 Canada thistle 4.2 0.4 10.0 < 0.1 0.4 0.4 1.3

Field Survey Summary Tables – Hanover, Tache, Ritchot, Ste. Anne, La Broquerie
144
Table 102. 2016 Annual crops in Hanover, Tache, Ritchot, Ste. Anne, La Broquerie in the Eastern Crop Reporting District (18 fields)
Frequency Field Uniformity Field Density (#/m2) Relative Rank Species (%) All Occurrence All Occurrence High Abundance 1 Yellow foxtail 28.0 14.0 50.1 7.3 26.0 82.8 92.1 2 Wild buckwheat 43.2 9.1 21.0 0.6 1.5 6.0 30.4 3 Barnyard grass species 42.4 6.0 14.2 0.4 1.0 3.2 23.6 4 Wheat 32.2 5.7 17.8 0.5 1.7 3.4 21.6 5 Pale smartweed 34.2 3.5 10.4 0.2 0.5 1.6 15.7 6 Dandelion 24.8 3.7 14.8 0.4 1.5 3.4 15.1 7 Canola/rapeseed 9.7 4.7 48.8 0.6 6.4 10.4 15.1 8 Lamb's-quarters 25.0 3.2 12.6 0.2 0.9 2.2 13.1 9 Redroot pigweed 29.5 2.7 9.1 0.1 0.5 1.4 12.9 10 Broad-leaved plantain 16.8 3.8 22.4 0.2 1.3 2.2 11.8 11 Clover species 11.7 1.5 12.8 0.1 0.6 1.0 5.9 12 Canada thistle 6.1 1.2 20.0 0.2 3.6 3.6 5.3 13 Oak-leaved goosefoot 12.7 0.6 5.0 0.1 0.4 0.6 4.7 14 Golden dock 7.6 1.1 15.0 0.1 1.2 1.2 4.5 15 Soybean 5.1 1.3 25.0 0.1 1.4 1.4 3.9 16 Biennial wormwood 6.9 1.0 15.0 0.1 0.8 0.8 3.8 17 Bird's-foot trefoil 6.1 0.6 10.0 < 0.1 0.8 0.8 2.9 18 Night-flowering catchfly 7.6 0.4 5.0 < 0.1 0.2 0.2 2.7 19 Stinkweed 5.6 0.6 10.0 < 0.1 0.6 0.6 2.6 20 Round-leaved mallow 4.1 0.6 15.0 0.1 1.6 1.6 2.6 21 Green foxtail 4.1 0.6 15.0 < 0.1 0.8 0.8 2.3 22 American vetch 6.1 0.3 5.0 < 0.1 0.4 0.4 2.3 23 Thyme-leaved spurge 5.6 0.3 5.0 < 0.1 0.2 0.2 2.0 24 Orchard grass 5.1 0.3 5.0 < 0.1 0.2 0.2 1.8 25 Alfalfa 4.1 0.2 5.0 < 0.1 0.2 0.2 1.5

Field Survey Summary Tables – Springfield & Brokenhead
145
Table 103. 2016 Annual crops in Springfield & Brokenhead in the Eastern Crop Reporting District (16 fields) Frequency Field Uniformity Field Density (#/m2) Relative
Rank Species (%) All Occurrence All Occurrence High Abundance 1 Broad-leaved plantain 34.3 10.9 31.7 2.0 5.7 32.2 37.1 2 Barnyard grass species 18.3 9.1 49.9 2.5 13.9 35.0 34.0 3 Wild buckwheat 40.2 8.7 21.6 1.0 2.4 12.0 29.5 4 Night-flowering catchfly 6.1 3.9 65.0 3.2 52.0 52.0 27.8 5 Perennial sow-thistle 6.7 6.1 90.0 1.6 24.2 24.2 20.5 6 Wild oats 15.2 3.3 21.6 1.5 10.2 21.8 19.1 7 Lamb's-quarters 18.2 5.2 28.4 0.5 2.7 4.8 15.2 8 Pale smartweed 23.5 4.2 17.8 0.2 1.0 1.8 13.9 9 Dandelion 11.2 3.5 30.9 0.4 3.2 6.8 10.1 10 Wheat 12.9 2.8 21.8 0.2 1.9 3.6 9.1 11 Marsh yellow cress 13.5 2.0 15.0 0.2 1.8 3.4 8.3 12 Redroot pigweed 12.9 2.2 17.4 0.2 1.7 2.2 8.2 13 Yellow foxtail 15.9 1.8 11.4 0.1 0.9 1.8 8.0 14 Cocklebur 6.8 3.1 45.0 0.3 3.8 3.8 7.6 15 Canada thistle 13.5 2.0 15.0 0.1 1.0 1.4 7.6 16 Spiny annual sow-thistle 9.4 2.0 21.8 0.1 1.2 1.4 6.2 17 Biennial wormwood 6.2 1.5 24.7 0.2 2.4 7.2 4.8 18 Bird's-foot trefoil 6.8 1.4 20.0 0.1 1.4 1.4 4.4 19 Rough cinquefoil 6.1 0.9 15.0 0.1 2.2 2.2 3.9 20 Oats 6.8 1.0 15.0 0.1 0.8 0.8 3.7 21 Canola/rapeseed 6.8 0.7 10.0 < 0.1 0.6 0.6 3.2 22 Golden dock 4.5 0.9 20.0 0.1 1.8 1.8 3.0 23 Quack grass 4.3 0.9 20.0 0.1 1.6 1.6 2.9 24 Wild mustard 6.1 0.6 10.0 < 0.1 0.4 0.4 2.8 25 Field horsetail 6.8 0.3 5.0 < 0.1 0.2 0.2 2.6 26 Black medick 6.7 0.3 5.0 < 0.1 0.2 0.2 2.6 27 Shepherd's-purse 4.5 0.4 10.0 0.1 1.6 1.6 2.4 28 Thyme-leaved spurge 4.5 0.2 5.0 < 0.1 0.2 0.2 1.7

Field Survey Summary Tables – Whitemouth, Lac du Bonnet, Alexander, Reynolds & Stuartburn
146
Table 104. 2016 Annual crops in Whitemouth, Lac du Bonnet, Alexander, Reynolds & Stuartburn in the Eastern Crop Reporting District (11 fields)
Frequency Field Uniformity Field Density (#/m2) Relative Rank Species (%) All Occurrence All Occurrence High Abundance 1 Yellow foxtail 27.0 16.8 62.1 4.8 17.8 41.0 45.1 2 Dandelion 36.5 17.4 47.7 2.8 7.7 24.6 36.6 3 Field horsetail 45.0 9.4 20.9 2.8 6.2 25.6 31.3 4 Broad-leaved plantain 44.7 13.7 30.7 1.8 4.0 16.4 29.4 5 Wild buckwheat 63.8 8.6 13.5 0.4 0.6 1.0 21.2 6 Barnyard grass species 27.0 9.8 36.4 0.9 3.3 5.4 18.1 7 Canola/rapeseed 18.0 7.7 42.5 1.0 5.5 8.4 15.1 8 Marsh yellow cress 35.3 5.7 16.3 0.6 1.6 4.8 14.5 9 Green foxtail 8.6 4.3 50.0 1.6 18.4 18.4 13.7 10 Lamb's-quarters 27.6 5.0 17.9 0.4 1.5 3.8 11.5 11 Pale smartweed 36.7 3.8 10.3 0.2 0.6 1.0 11.1 12 Shepherd's-purse 17.7 4.0 22.5 0.2 1.1 2.0 7.7 13 Black medick 8.8 3.1 35.0 0.2 1.8 1.8 5.1 14 Spiny annual sow-thistle 18.8 1.4 7.4 0.1 0.3 0.4 5.0 15 Redroot pigweed 8.8 1.8 20.0 0.1 1.0 1.0 3.6 16 Clover species 8.8 1.8 20.0 0.1 1.0 1.0 3.6 17 Wild oats 8.6 1.3 15.0 0.2 1.8 1.8 3.5 18 Night-flowering catchfly 8.8 0.9 10.0 0.1 0.8 0.8 2.8 19 Blue-joint 8.6 0.4 5.0 0.1 1.6 1.6 2.7 20 Round-leaved mallow 9.2 0.9 10.0 < 0.1 0.4 0.4 2.7 21 Wild mustard 8.8 0.9 10.0 < 0.1 0.4 0.4 2.6 22 Hemp-nettle 9.6 0.5 5.0 < 0.1 0.2 0.2 2.3 23 Thyme-leaved spurge 9.6 0.5 5.0 < 0.1 0.2 0.2 2.3 24 Canada fleabane 8.8 0.4 5.0 < 0.1 0.4 0.4 2.2 25 Bladder campion 8.8 0.4 5.0 < 0.1 0.2 0.2 2.1 26 Purslane 8.8 0.4 5.0 < 0.1 0.2 0.2 2.1 27 Alfalfa 8.8 0.4 5.0 < 0.1 0.2 0.2 2.1

Field Survey Summary Tables – Bifrost-Riverton, Armstrong & Gimli
147
Table 105. 2016 Annual crops in Bifrost-Riverton, Armstrong & Gimli in the Interlake Crop Reporting District (12 fields)
Frequency Field Uniformity Field Density (#/m2) Relative Rank Species (%) All Occurrence All Occurrence High Abundance 1 Broad-leaved plantain 45.5 14.3 31.5 1.3 2.7 9.6 41.8 2 Wheat 18.5 6.2 33.6 2.2 12.0 22.0 35.8 3 Field horsetail 9.0 5.4 60.0 1.8 20.0 20.0 28.1 4 Dandelion 38.9 6.7 17.3 0.4 1.1 1.8 21.9 5 Green foxtail 9.8 5.4 55.0 1.2 12.2 12.2 21.8 6 Wild buckwheat 45.2 5.8 12.9 0.3 0.7 1.2 21.3 7 Barnyard grass species 37.1 6.2 16.6 0.5 1.2 3.2 21.2 8 Perennial sow-thistle 19.3 4.8 24.7 0.3 1.7 3.0 13.9 9 Canola/rapeseed 18.9 4.3 22.6 0.3 1.5 2.0 12.8 10 Redroot pigweed 15.0 2.9 19.5 0.2 1.1 1.4 8.9 11 Night-flowering catchfly 9.5 2.8 30.0 0.2 2.6 2.6 8.4 12 Spiny annual sow-thistle 18.2 2.3 12.6 0.1 0.5 0.6 8.1 13 Canada thistle 11.6 1.6 13.9 0.1 0.9 1.0 5.8 14 Pale smartweed 12.4 1.0 8.1 < 0.1 0.4 1.0 4.6 15 False cleavers 11.6 1.0 8.9 < 0.1 0.4 0.4 4.4 16 Wild oats 9.5 0.9 10.0 0.1 0.8 0.8 4.2 17 Black medick 9.8 1.0 10.0 < 0.1 0.4 0.4 3.9 18 Willow species 9.5 0.9 10.0 < 0.1 0.4 0.4 3.8 19 Shepherd's-purse 9.0 0.9 10.0 < 0.1 0.4 0.4 3.6 20 Dog mustard 8.7 0.9 10.0 < 0.1 0.4 0.4 3.5 21 Biennial wormwood 9.8 0.5 5.0 < 0.1 0.2 0.2 3.1 22 Nightshade species 9.8 0.5 5.0 < 0.1 0.2 0.2 3.1 23 American dragonhead 9.5 0.5 5.0 < 0.1 0.2 0.2 3.0 24 Hemp-nettle 9.0 0.5 5.0 < 0.1 0.2 0.2 2.9 25 Oak-leaved goosefoot 8.7 0.4 5.0 < 0.1 0.2 0.2 2.8 26 Round-leaved mallow 8.7 0.4 5.0 < 0.1 0.2 0.2 2.8 27 Clover species 2.6 1.2 45.0 0.1 2.6 2.6 2.7 28 Marsh yellow cress 2.6 0.1 5.0 < 0.1 0.2 0.2 0.8 29 Soybean 2.6 0.1 5.0 < 0.1 0.2 0.2 0.8

Field Survey Summary Tables – Fisher & Grahamdale
148
Table 106. 2016 Annual crops in Fisher & Grahamdale in the Interlake Crop Reporting District (10 fields) Frequency Field Uniformity Field Density (#/m2) Relative
Rank Species (%) All Occurrence All Occurrence High Abundance 1 Dandelion 44.0 11.7 26.6 0.9 2.0 5.0 35.8 2 Wild buckwheat 60.4 6.9 11.4 0.4 0.6 2.8 25.0 3 Broad-leaved plantain 47.9 7.2 14.9 0.3 0.6 1.2 21.4 4 Redroot pigweed 30.5 7.9 26.1 0.4 1.3 4.0 20.7 5 Perennial sow-thistle 14.0 7.7 55.0 0.5 3.6 3.6 19.3 6 Yellow sweet-clover 14.0 7.0 50.0 0.4 3.0 3.0 17.1 7 Oats 14.0 7.0 50.0 0.3 2.4 2.4 15.7 8 Rayless aster 14.0 6.3 45.0 0.4 2.6 2.6 15.4 9 Canola/rapeseed 18.3 5.4 29.7 0.3 1.7 3.8 14.4 10 Wheat 25.9 3.2 12.2 0.2 0.8 1.4 11.7 11 Field horsetail 14.0 3.5 25.0 0.3 1.8 1.8 10.6 12 Spiny annual sow-thistle 26.4 2.6 9.9 0.1 0.4 0.6 9.5 13 Rough cinquefoil 12.4 3.1 25.0 0.2 1.6 1.6 9.0 14 Green foxtail 4.1 3.1 75.0 0.2 6.0 6.0 8.2 15 Black medick 25.3 1.9 7.5 0.1 0.3 0.4 8.1 16 Barnyard grass species 22.6 1.1 5.0 0.1 0.5 0.6 7.4 17 Shepherd's-purse 22.6 1.1 5.0 0.1 0.4 0.6 7.2 18 Sedge species 14.0 2.1 15.0 0.1 0.6 0.6 6.3 19 Clover species 14.0 1.4 10.0 0.1 0.8 0.8 6.0 20 Bicknell's geranium 17.0 1.1 6.2 < 0.1 0.2 0.4 5.1 21 Soybean 4.3 1.9 45.0 0.1 2.4 2.4 4.6 22 Lamb's-quarters 13.5 0.7 5.0 0.1 0.4 0.4 4.2 23 Round-leaved mallow 13.5 0.7 5.0 0.1 0.4 0.4 4.2 24 American vetch 14.0 0.7 5.0 < 0.1 0.2 0.2 3.9 25 Alfalfa 14.0 0.7 5.0 < 0.1 0.2 0.2 3.9 26 Biennial wormwood 4.3 0.9 20.0 0.1 1.6 1.6 2.9 27 Foxtail barley 4.3 0.6 15.0 0.1 1.2 1.2 2.4

Field Survey Summary Tables – Rockwood
149
Table 107. 2016 Annual crops in Rockwood in the Interlake Crop Reporting District (12 fields) Frequency Field Uniformity Field Density (#/m2) Relative
Rank Species (%) All Occurrence All Occurrence High Abundance 1 Yellow foxtail 8.6 7.8 90.0 6.0 69.6 69.6 77.6 2 Wild buckwheat 49.3 10.0 20.3 0.5 1.1 3.6 41.7 3 Wild oats 24.8 7.9 31.7 1.4 5.5 13.6 37.1 4 Canola/rapeseed 32.0 8.0 24.9 0.4 1.4 4.0 30.7 5 Wheat 16.6 7.4 44.8 0.6 3.4 4.0 25.2 6 Dandelion 25.5 5.6 21.8 0.3 1.0 1.8 22.1 7 Dock species 17.3 2.6 15.0 0.3 1.7 3.2 14.0 8 Pale smartweed 17.3 2.6 15.0 0.2 0.9 1.2 12.7 9 Green foxtail 16.9 0.8 5.0 0.1 0.4 0.6 8.5 10 Shepherd's-purse 8.7 0.9 10.0 0.1 1.4 1.4 6.1 11 Narrow-leaved hawk's-beard 8.7 0.4 5.0 < 0.1 0.2 0.2 4.2 12 Canada thistle 8.6 0.4 5.0 < 0.1 0.2 0.2 4.2 13 Oats 8.6 0.4 5.0 < 0.1 0.2 0.2 4.2 14 Biennial wormwood 7.9 0.4 5.0 < 0.1 0.4 0.4 4.0 15 Soybean 8.2 0.4 5.0 < 0.1 0.2 0.2 4.0 16 Barnyard grass species 7.9 0.4 5.0 < 0.1 0.2 0.2 3.8

Field Survey Summary Tables – Rosser, St. Andrews, St. Clements & West St. Paul
150
Table 108. 2016 Annual crops in Rosser, St. Andrews, St. Clements & West St. Paul in the Interlake Crop Reporting District (15 fields)
Frequency Field Uniformity Field Density (#/m2) Relative Rank Species (%) All Occurrence All Occurrence High Abundance 1 Barnyard grass species 41.3 10.7 25.9 1.1 2.7 7.0 76.7 2 Lamb's-quarters 28.2 4.7 16.8 0.3 1.1 3.2 31.5 3 Wild buckwheat 27.1 4.7 17.4 0.3 1.0 2.0 30.1 4 Canola/rapeseed 26.4 3.4 12.7 0.3 1.0 2.6 26.5 5 Canada thistle 14.1 1.9 13.3 0.3 2.1 4.6 19.5 6 Dandelion 26.2 1.7 6.6 0.1 0.4 0.6 17.1 7 Green foxtail 8.2 2.5 30.0 0.1 1.6 1.6 13.3 8 Pale smartweed 19.3 1.6 8.4 0.1 0.3 0.4 13.2 9 Yellow foxtail 6.4 1.9 30.0 0.2 2.6 2.6 12.3 10 Foxtail barley 6.8 1.4 20.0 0.1 1.0 1.0 8.0 11 Dock species 6.1 1.2 20.0 0.1 1.4 1.4 7.9 12 Stinkweed 8.2 1.2 15.0 < 0.1 0.6 0.6 7.7 13 Redroot pigweed 12.9 0.6 5.0 < 0.1 0.2 0.2 7.3 14 Oak-leaved goosefoot 7.1 1.1 15.0 < 0.1 0.6 0.6 6.6 15 Wild oats 8.2 0.8 10.0 < 0.1 0.4 0.4 6.1 16 Rough cinquefoil 5.8 0.3 5.0 0.1 1.4 1.4 5.5 17 Kochia 7.1 0.7 10.0 < 0.1 0.4 0.4 5.3 18 Thyme-leaved spurge 7.1 0.7 10.0 < 0.1 0.4 0.4 5.3

Field Survey Summary Tables – Woodlands
151
Table 109. 2016 Annual crops in Woodlands in the Interlake Crop Reporting District (14 fields) Frequency Field Uniformity Field Density (#/m2) Relative
Rank Species (%) All Occurrence All Occurrence High Abundance 1 Quack grass 5.5 4.4 80.0 3.8 68.6 68.6 54.2 2 Green foxtail 19.5 8.0 41.0 1.3 6.6 15.6 36.0 3 Wild buckwheat 42.8 3.4 8.0 0.2 0.4 1.2 23.1 4 Canola/rapeseed 19.0 6.6 34.9 0.4 2.1 4.0 23.0 5 Perennial sow-thistle 12.7 6.7 53.1 0.6 4.3 5.8 22.7 6 Biennial wormwood 12.7 5.4 42.3 0.5 3.8 8.0 19.6 7 Wild oats 21.8 4.1 18.8 0.4 1.7 3.2 19.3 8 Dandelion 17.7 1.9 10.9 0.1 0.5 1.2 10.5 9 Barnyard grass species 18.2 1.7 9.4 0.1 0.5 0.6 10.4 10 Rough cinquefoil 8.4 2.1 25.0 0.2 2.8 2.8 9.4 11 Night-flowering catchfly 16.3 1.2 7.6 < 0.1 0.3 0.4 8.5 12 Oak-leaved goosefoot 15.5 1.2 7.5 0.1 0.5 0.6 8.3 13 Broad-leaved plantain 8.4 1.3 15.0 0.2 2.6 2.6 7.7 14 Canada thistle 12.7 1.1 8.3 < 0.1 0.4 0.4 6.8 15 Pale smartweed 10.5 1.4 12.9 0.1 0.6 0.6 6.8 16 Purslane 5.6 1.7 30.0 0.1 2.6 2.6 6.7 17 Wheat 2.2 1.5 70.0 0.2 11.0 11.0 6.2 18 Redroot pigweed 5.6 1.4 25.0 0.1 1.4 1.4 5.4 19 Alfalfa 8.4 0.8 10.0 0.1 0.6 0.6 5.0 20 American vetch 8.0 0.4 5.0 < 0.1 0.2 0.2 3.7 21 Shepherd's-purse 5.6 0.3 5.0 < 0.1 0.2 0.2 2.6 22 Aster species 2.2 0.2 10.0 < 0.1 0.4 0.4 1.2 23 Rayless aster 2.2 0.1 5.0 < 0.1 0.2 0.2 1.0 24 Black medick 2.2 0.1 5.0 < 0.1 0.2 0.2 1.0 25 Willow species 2.2 0.1 5.0 < 0.1 0.2 0.2 1.0

Field Survey Summary Tables – Density, Species Richness and Weed-Free Quadrats by Decade
152
Table 110. Density, species richness and weed-free quadrats in each survey Number of Density Species Weed-free fields surveyed (number/m2) (number/field) quadrats Survey mean SE median mean SE % SE 1978-81 1424 108.8 4.2 49.8 7.3 0.1 9.7 0.8 1986 501 61.0 3.5 35.2 7.0 0.2 13.5 1.5 1997 452 56.4 6.2 23.9 7.1 0.2 20.1 1.9 2002 631 34.7 2.8 13.4 5.8 0.1 31.3 1.8 2016 658 15.4 1.1 5.2 4.7 0.1 42.5 1.9

Field Survey Summary Tables – 2002 Annual Crops
153
Table 111. 2002 Annual crops in Manitoba (631 fields) Frequency Field Uniformity Field Density (#/m2) Relative
Rank Species (%) All Occurrence All Occurrence High Abundance 1 Green foxtail 64.8 26.1 40.2 13.6 20.9 1070.0 69.8 2 Wild oats 56.1 19.7 35.1 6.7 11.9 449.8 43.6 3 Wild buckwheat 58.5 15.6 26.7 1.7 2.9 80.6 26.6 4 Barnyard grass species 25.7 6.6 25.9 3.8 14.8 582.8 20.4 5 Canada thistle 42.6 7.3 17.1 0.8 1.8 18.2 15.0 6 Redroot pigweed 28.6 6.1 21.3 1.0 3.5 48.2 12.3 7 Lamb's-quarters 25.1 5.3 21.3 0.7 2.9 59.6 10.4 8 Pale smartweed 28.3 5.3 18.7 0.5 1.9 27.0 10.4 9 Canola/rapeseed 17.7 3.4 19.3 0.5 3.0 86.0 7.1 10 Dandelion 21.1 3.4 16.0 0.3 1.5 20.8 7.1 11 Wild mustard 16.6 2.8 17.0 0.3 2.0 45.2 6.0 12 Wheat 15.7 2.9 18.3 0.3 2.1 21.0 5.8 13 Quack grass 13.3 2.1 16.0 0.6 4.3 139.8 5.5 14 Spiny annual sow-thistle 17.5 2.4 13.5 0.2 1.1 11.4 5.3 15 False cleavers 10.7 2.8 26.5 0.4 4.1 40.6 5.2 16 Round-leaved mallow 11.4 2.0 17.9 0.2 1.6 13.0 4.0 17 Kochia 7.2 1.3 18.1 0.4 5.8 197.0 3.4 18 Night-flowering catchfly 9.8 1.6 16.5 0.2 1.5 11.0 3.3 19 Stinkweed 8.7 1.3 15.3 0.3 3.1 74.2 3.3 20 Perennial sow-thistle 12.2 1.1 9.1 0.1 0.8 6.4 3.2 21 Thyme-leaved spurge 7.3 1.6 21.7 0.2 2.2 14.4 2.9 22 Chickweed 4.9 1.4 28.3 0.3 5.3 44.0 2.6 23 Field horsetail 5.9 0.9 15.3 0.3 4.5 96.6 2.5 24 Hemp-nettle 7.0 1.1 16.2 0.1 1.6 10.6 2.4 25 Flax 4.0 1.2 30.2 0.2 4.9 26.8 2.2 26 Barley 4.8 0.8 17.4 0.1 1.8 10.0 1.7 27 Shepherd's-purse 5.3 0.6 12.2 0.1 1.3 8.4 1.6 28 Black medick 2.6 0.5 20.9 0.1 3.0 15.6 1.1 29 Alfalfa 2.6 0.5 19.3 0.1 2.5 13.4 1.0 30 Yellow foxtail 2.2 0.3 16.0 0.1 4.6 28.6 0.9 31 Prostrate knotweed 3.0 0.4 13.4 < 0.1 1.0 4.4 0.9 32 Stork's bill 1.7 0.4 24.4 0.1 3.8 25.6 0.8 33 Common ragweed 1.9 0.3 14.3 < 0.1 1.7 7.2 0.6 34 Oats 1.1 0.3 24.1 0.1 5.7 15.4 0.6 35 Broad-leaved plantain 1.8 0.2 11.8 < 0.1 1.8 11.4 0.6 36 American dragonhead 2.1 0.2 10.4 < 0.1 0.7 3.4 0.6 37 Showy milkweed 1.7 0.2 13.8 < 0.1 1.3 4.4 0.5 38 Field bean 1.2 0.3 24.8 < 0.1 1.6 3.2 0.5 39 Buckwheat 0.1 0.1 100.0 0.1 96.6 96.6 0.5 40 Pineappleweed 0.9 0.1 15.9 < 0.1 4.5 19.8 0.4 41 Dog mustard 0.7 0.2 29.1 < 0.1 3.5 8.8 0.3 42 Dock species 1.4 0.1 7.5 < 0.1 0.5 1.6 0.3 43 Cocklebur 1.1 0.1 9.9 < 0.1 1.1 4.4 0.3 44 Water smartweed 1.1 0.1 10.8 < 0.1 1.0 2.0 0.3 45 Prostrate pigweed 1.2 0.1 8.1 < 0.1 0.5 1.0 0.3 46 Clover species 0.5 0.1 18.4 < 0.1 8.6 29.4 0.3 47 Yellow sweet-clover 0.7 0.2 22.3 < 0.1 2.1 5.8 0.3 48 Narrow-leaved hawk's-beard 0.9 0.1 13.5 < 0.1 1.0 2.8 0.3 49 Biennial wormwood 0.9 0.1 12.3 < 0.1 0.9 2.2 0.2 50 Common groundsel 0.7 0.1 13.8 < 0.1 1.9 7.0 0.2 51 White cockle 0.5 0.1 21.8 < 0.1 3.4 4.8 0.2 52 White mustard 0.2 0.2 80.0 < 0.1 10.8 10.8 0.2
(Table continued on next page)

Field Survey Summary Tables – 2002 Annual Crops
154
Table 111. 2002 Annual crops in Manitoba (631 fields) (continued) Frequency Field Uniformity Field Density (#/m2) Relative
Rank Species (%) All Occurrence All Occurrence High Abundance 53 Coriander 0.5 0.1 27.5 < 0.1 2.2 3.8 0.2 54 Flixweed 0.8 0.1 10.0 < 0.1 1.2 2.4 0.2 55 Wild tomato 0.4 0.1 25.4 < 0.1 4.6 11.2 0.2 56 Absinth 0.7 < 0.1 6.3 < 0.1 0.4 0.6 0.2 57 Russian thistle 0.6 0.1 8.1 < 0.1 1.0 2.8 0.2 58 Maple-leaved goosefoot 0.4 0.1 24.5 < 0.1 3.2 6.4 0.2 59 Perennial rye grass 0.4 0.1 28.1 < 0.1 2.3 3.8 0.2 60 Bluebur 0.4 0.1 22.4 < 0.1 2.5 3.0 0.2 61 Manitoba maple 0.7 < 0.1 5.0 < 0.1 0.2 0.2 0.1 62 American vetch 0.6 < 0.1 5.0 < 0.1 0.5 0.8 0.1 63 Purslane 0.5 0.1 10.4 < 0.1 0.8 1.2 0.1 64 Foxtail barley 0.4 0.1 13.3 < 0.1 2.0 4.6 0.1 65 Mouse-eared chickweed 0.5 < 0.1 6.7 < 0.1 0.9 1.4 0.1 66 Sunflower 0.5 < 0.1 8.8 < 0.1 0.6 1.0 0.1 67 Corn 0.5 < 0.1 10.4 < 0.1 0.7 1.2 0.1 68 Bicknell's geranium 0.5 < 0.1 8.6 < 0.1 0.9 1.8 0.1 69 Tansy 0.3 0.1 17.9 < 0.1 1.3 2.2 0.1 70 Blue grass species 0.4 < 0.1 5.0 < 0.1 0.8 1.2 0.1 71 Oak-leaved goosefoot 0.3 < 0.1 5.0 < 0.1 0.2 0.2 0.1 72 Cow cockle 0.2 < 0.1 25.0 < 0.1 2.6 2.6 0.1 73 Scentless chamomile 0.2 < 0.1 10.0 < 0.1 1.2 1.2 0.1 74 Black mustard 0.1 < 0.1 30.0 < 0.1 2.2 2.2 0.1 75 Henbit 0.3 < 0.1 5.0 < 0.1 1.3 1.8 0.1 76 Proso millet 0.2 < 0.1 15.0 < 0.1 2.6 2.6 0.1 77 Timothy 0.2 < 0.1 15.0 < 0.1 1.8 1.8 0.1 78 Bladder campion 0.2 < 0.1 10.0 < 0.1 0.6 0.6 0.1 79 Field pea 0.1 < 0.1 20.0 < 0.1 1.0 1.0 0.1 80 Purple milk-vetch 0.2 < 0.1 15.0 < 0.1 0.6 0.6 < 0.1 81 Leafy spurge 0.2 < 0.1 5.0 < 0.1 0.2 0.2 < 0.1 82 Silverberry 0.2 < 0.1 10.0 < 0.1 0.6 0.6 < 0.1 83 Witch grass 0.2 < 0.1 5.0 < 0.1 0.4 0.4 < 0.1 84 Goldenrod species 0.1 < 0.1 15.0 < 0.1 2.2 2.2 < 0.1 85 Common pepper-grass 0.2 < 0.1 5.0 < 0.1 0.2 0.2 < 0.1 86 Prickly lettuce 0.1 < 0.1 20.0 < 0.1 0.8 0.8 < 0.1 87 Slender wheat grass 0.2 < 0.1 5.0 < 0.1 0.4 0.4 < 0.1 88 Fababean 0.2 < 0.1 10.0 < 0.1 0.6 0.6 < 0.1 89 Rose species 0.1 < 0.1 15.0 < 0.1 1.2 1.2 < 0.1 90 Wild licorice 0.2 < 0.1 5.0 < 0.1 0.2 0.2 < 0.1 91 Ball mustard 0.2 < 0.1 5.0 < 0.1 0.2 0.2 < 0.1 92 Giant ragweed 0.2 < 0.1 5.0 < 0.1 0.6 0.6 < 0.1 93 Wormseed mustard 0.2 < 0.1 5.0 < 0.1 0.2 0.2 < 0.1 94 Scouring-rush 0.2 < 0.1 5.9 < 0.1 0.3 0.8 < 0.1 95 Canary grass 0.2 < 0.1 5.0 < 0.1 0.2 0.2 < 0.1 96 False ragweed 0.1 < 0.1 10.0 < 0.1 1.4 1.4 < 0.1 97 Tumble mustard 0.1 < 0.1 5.0 < 0.1 0.2 0.2 < 0.1 98 Poplar species 0.1 < 0.1 5.0 < 0.1 0.4 0.4 < 0.1

Field Survey Summary Tables – 1997 Annual Crops
155
Table 112. 1997 Annual crops in Manitoba (452 fields) Frequency Field Uniformity Field Density (#/m2) Relative
Rank Species (%) All Occurrence All Occurrence High Abundance 1 Green foxtail 72.5 35.9 49.5 29.1 40.1 1693.2 81.2 2 Wild oats 64.4 22.5 34.9 6.6 10.2 167.6 32.9 3 Wild buckwheat 68.3 24.2 35.5 2.7 3.9 41.0 27.5 4 Canada thistle 59.0 11.8 20.0 1.2 2.1 25.8 16.9 5 Redroot pigweed 39.8 9.5 23.9 1.6 4.0 63.8 13.6 6 Wild mustard 37.1 8.1 21.9 1.0 2.8 40.6 11.5 7 Pale smartweed 37.1 8.0 21.7 0.9 2.5 24.8 11.3 8 Perennial sow-thistle 35.1 6.5 18.6 0.8 2.3 35.2 10.0 9 Lamb's-quarters 29.9 5.8 19.5 0.8 2.5 65.0 8.7 10 Quack grass 26.7 4.9 18.5 1.3 4.8 44.8 8.7 11 Barnyard grass species 20.4 4.4 21.7 1.5 7.6 131.4 8.0 12 Chickweed 7.2 3.4 47.6 2.7 37.1 257.8 7.6 13 Shepherd's-purse 12.9 3.2 24.7 0.7 5.4 66.0 4.8 14 False cleavers 10.3 3.9 37.5 0.7 6.5 70.6 4.7 15 Night-flowering catchfly 12.9 3.4 26.7 0.5 4.2 25.6 4.6 16 Hemp-nettle 13.1 3.1 23.8 0.6 4.3 55.6 4.5 17 Stinkweed 13.4 2.4 17.9 0.3 2.5 21.0 3.8 18 Flax 6.9 2.2 31.8 0.8 11.3 70.8 3.6 19 Canola/rapeseed 9.7 2.4 24.9 0.3 3.6 39.4 3.3 20 Dandelion 14.0 1.9 13.7 0.1 1.0 9.2 3.3 21 Round-leaved mallow 13.4 1.8 13.7 0.2 1.2 11.4 3.2 22 Wheat 10.0 2.2 21.5 0.3 2.5 18.0 3.0 23 Thyme-leaved spurge 9.2 2.1 22.2 0.2 2.2 17.6 2.8 24 Kochia 6.8 1.4 20.6 0.3 4.0 50.8 2.2 25 American dragonhead 6.0 0.6 10.4 < 0.1 0.8 6.6 1.3 26 Field horsetail 5.2 0.6 11.9 0.1 2.0 6.6 1.2 27 Yellow foxtail 4.2 0.6 13.9 0.1 2.6 11.6 1.1 28 Prostrate knotweed 3.9 0.7 16.6 0.1 1.8 16.6 1.0 29 Barley 3.8 0.6 14.8 0.1 1.7 10.6 1.0 30 Alfalfa 3.5 0.6 17.2 0.1 1.5 9.0 0.9 31 Broad-leaved plantain 3.4 0.4 12.8 < 0.1 1.1 7.8 0.8 32 Common ragweed 2.5 0.4 15.5 0.1 2.6 14.6 0.7 33 Russian thistle 2.6 0.4 15.9 < 0.1 1.6 12.6 0.7 34 Clover species 2.3 0.4 16.6 0.1 2.6 30.6 0.7 35 Stork's bill 2.0 0.3 17.5 0.1 3.1 16.8 0.6 36 Spiny annual sow-thistle 2.0 0.4 17.3 < 0.1 1.3 5.0 0.5 37 Dog mustard 1.4 0.4 28.0 < 0.1 2.8 4.6 0.5 38 Showy milkweed 2.2 0.2 7.8 < 0.1 0.7 1.8 0.4 39 Indian mustard 1.4 0.3 18.1 < 0.1 1.2 2.6 0.4 40 Flixweed 1.3 0.2 16.5 < 0.1 2.8 10.2 0.4 41 Cocklebur 1.7 0.1 8.7 < 0.1 0.5 1.2 0.3 42 Narrow-leaved hawk's-beard 1.3 0.2 16.6 < 0.1 1.5 3.4 0.3 43 Absinth 1.4 0.2 13.3 < 0.1 1.2 3.8 0.3 44 Biennial wormwood 1.4 0.1 7.4 < 0.1 2.1 11.6 0.3 45 Rose species 1.7 0.1 5.6 < 0.1 0.4 1.0 0.3 46 Ball mustard 1.3 0.1 11.1 < 0.1 1.1 5.2 0.3 47 Tartary buckwheat 0.8 0.2 27.6 < 0.1 3.5 13.2 0.3 48 White mustard 0.2 0.2 85.0 0.1 31.2 31.2 0.2 49 Black medick 0.7 0.1 22.5 < 0.1 2.2 2.8 0.2 50 Buckwheat 0.4 0.2 50.0 < 0.1 7.2 7.2 0.2 51 Bluebur 0.7 0.1 21.5 < 0.1 1.4 4.4 0.2 52 Purslane 1.0 0.1 5.9 < 0.1 0.4 1.0 0.2
(Table continued on next page)

Field Survey Summary Tables – 1997 Annual Crops
156
Table 112. 1997 Annual crops in Manitoba (452 fields) (continued) Frequency Field Uniformity Field Density (#/m2) Relative
Rank Species (%) All Occurrence All Occurrence High Abundance 53 Nightshade species 0.2 0.2 70.0 < 0.1 10.6 10.6 0.2 54 Common groundsel 0.6 0.1 14.2 < 0.1 2.7 7.4 0.2 55 Dock species 0.8 < 0.1 5.0 < 0.1 0.8 1.2 0.1 56 Caraway 0.4 0.1 35.0 < 0.1 2.6 2.6 0.1 57 Proso millet 0.2 0.1 50.0 < 0.1 10.0 10.0 0.1 58 Bicknell's geranium 0.8 < 0.1 5.0 < 0.1 0.2 0.2 0.1 59 Manitoba maple 0.6 0.1 10.3 < 0.1 0.4 0.6 0.1 60 Two-grooved milk-vetch 0.4 0.1 22.5 < 0.1 2.9 5.4 0.1 61 Yellow sweet-clover 0.4 0.1 21.4 < 0.1 1.3 2.2 0.1 62 Low cudweed 0.4 < 0.1 7.9 < 0.1 4.0 6.0 0.1 63 Wild tomato 0.6 < 0.1 5.0 < 0.1 0.5 0.6 0.1 64 Sunflower 0.5 0.1 10.0 < 0.1 0.6 0.8 0.1 65 Water smartweed 0.5 < 0.1 6.5 < 0.1 0.6 1.2 0.1 66 Rough cinquefoil 0.5 < 0.1 7.6 < 0.1 0.4 0.6 0.1 67 Witch grass 0.4 < 0.1 10.9 < 0.1 0.6 0.8 0.1 68 American vetch 0.5 < 0.1 7.6 < 0.1 0.3 0.4 0.1 69 Spreading dogbane 0.4 < 0.1 5.0 < 0.1 0.5 0.6 0.1 70 Tumble pigweed 0.4 < 0.1 5.0 < 0.1 0.2 0.2 0.1 71 Wormseed mustard 0.2 < 0.1 20.0 < 0.1 1.6 1.6 0.1 72 Prostrate pigweed 0.3 < 0.1 7.3 < 0.1 0.7 1.2 0.1 73 Oak-leaved goosefoot 0.3 < 0.1 10.0 < 0.1 3.4 3.4 0.1 74 Marsh yellow cress 0.3 < 0.1 10.0 < 0.1 0.6 0.6 0.1 75 Silvery cinquefoil 0.3 < 0.1 10.0 < 0.1 0.4 0.4 0.1 76 Smooth brome 0.2 < 0.1 20.0 < 0.1 2.0 2.0 0.1 77 Giant ragweed 0.3 < 0.1 10.0 < 0.1 0.4 0.4 0.1 78 White cockle 0.2 < 0.1 10.0 < 0.1 0.8 0.8 < 0.1 79 Tansy 0.2 < 0.1 5.0 < 0.1 1.6 1.6 < 0.1 80 Leafy spurge 0.2 < 0.1 25.0 < 0.1 1.8 1.8 < 0.1 81 Bird's-foot trefoil 0.3 < 0.1 5.0 < 0.1 0.2 0.2 < 0.1 82 Persian darnel 0.2 < 0.1 5.0 < 0.1 1.2 1.2 < 0.1 83 Foxtail barley 0.3 < 0.1 5.0 < 0.1 0.2 0.2 < 0.1 84 Bladder campion 0.3 < 0.1 5.0 < 0.1 0.2 0.2 < 0.1 85 Soybean 0.3 < 0.1 5.0 < 0.1 0.2 0.2 < 0.1 86 Knawel 0.2 < 0.1 10.0 < 0.1 1.6 1.6 < 0.1 87 Cow cockle 0.2 < 0.1 5.0 < 0.1 0.2 0.2 < 0.1 88 Yellow nut sedge 0.2 < 0.1 5.0 < 0.1 0.2 0.2 < 0.1 89 Field bindweed 0.2 < 0.1 15.0 < 0.1 1.0 1.0 < 0.1 90 Poplar species 0.2 < 0.1 5.0 < 0.1 0.6 0.6 < 0.1 91 Pineappleweed 0.2 < 0.1 5.0 < 0.1 0.2 0.2 < 0.1 92 Corn spurry 0.2 < 0.1 5.0 < 0.1 0.2 0.2 < 0.1

Field Survey Summary Tables – 1986 Annual Crops
157
Table 113. 1986 Annual crops in Manitoba (501 fields) Frequency Field Uniformity Field Density (#/m2) Relative
Rank Species (%) All Occurrence All Occurrence High Abundance 1 Green foxtail 78.4 46.3 59.1 25.6 32.6 743.0 74.5 2 Wild oats 63.4 22.0 34.6 6.5 10.3 342.2 29.8 3 Wild buckwheat 70.6 26.3 37.3 3.6 5.0 69.6 28.0 4 Wild mustard 57.7 15.3 26.6 2.1 3.7 65.4 18.8 5 Pale smartweed 45.0 13.3 29.5 2.3 5.1 96.4 16.3 6 Lamb's-quarters 42.8 10.5 24.5 1.7 4.0 75.0 13.7 7 Flax 12.1 7.6 62.7 4.7 39.0 257.8 12.9 8 Redroot pigweed 40.0 9.7 24.1 1.6 4.0 86.8 12.8 9 Canada thistle 45.1 9.3 20.7 1.1 2.5 21.6 12.6 10 Stinkweed 27.9 6.4 22.8 1.3 4.5 113.4 9.0 11 Perennial sow-thistle 27.1 5.1 18.7 0.7 2.4 58.2 7.3 12 Quack grass 15.4 4.1 26.8 1.6 10.2 99.6 6.7 13 Night-flowering catchfly 15.9 4.9 30.7 0.7 4.5 38.0 5.7 14 Hemp-nettle 11.6 3.2 28.0 0.5 3.9 50.4 3.9 15 Chickweed 6.7 2.2 32.7 1.0 15.5 110.0 3.6 16 Barley 9.2 2.9 31.8 0.5 5.1 34.2 3.4 17 Shepherd's-purse 8.7 1.7 19.8 0.8 9.0 231.0 3.3 18 Field horsetail 9.2 1.8 19.5 0.5 5.4 50.4 3.0 19 Wheat 8.1 2.4 29.7 0.4 4.9 34.0 2.9 20 Dog mustard 5.4 2.2 40.9 0.5 9.5 69.2 2.6 21 False cleavers 5.6 1.7 30.1 0.4 6.3 51.4 2.2 22 Ball mustard 2.2 0.7 31.6 0.8 38.1 137.8 2.0 23 Round-leaved mallow 5.7 1.4 23.9 0.3 4.6 43.0 1.9 24 Russian thistle 7.4 1.1 15.4 0.1 1.8 12.8 1.8 25 Bluebur 6.5 1.2 19.2 0.1 1.7 22.6 1.7 26 Thyme-leaved spurge 5.4 1.3 24.2 0.2 3.2 31.0 1.7 27 Barnyard grass species 4.9 0.8 15.8 0.1 2.9 32.0 1.3 28 Canola/rapeseed 4.3 1.1 25.2 0.1 2.3 10.0 1.3 29 White cockle 3.8 0.8 21.3 0.2 5.1 46.4 1.2 30 Kochia 3.7 0.5 13.6 0.1 2.1 18.2 0.9 31 Rose species 4.2 0.4 9.3 < 0.1 0.7 3.4 0.8 32 American dragonhead 3.3 0.5 14.5 < 0.1 1.0 10.0 0.7 33 Alfalfa 2.0 0.5 24.6 0.1 3.6 25.4 0.6 34 Wormseed mustard 1.9 0.5 23.8 0.1 3.2 12.0 0.6 35 Narrow-leaved hawk's-beard 1.9 0.4 21.7 < 0.1 2.3 10.4 0.5 36 Dandelion 2.2 0.3 15.3 < 0.1 1.4 10.2 0.5 37 Water smartweed 2.5 0.2 6.2 < 0.1 1.3 4.6 0.5 38 Showy milkweed 2.1 0.2 10.7 < 0.1 1.1 4.4 0.5 39 Prostrate knotweed 2.2 0.2 9.9 < 0.1 0.5 1.2 0.4 40 Yellow foxtail 1.3 0.3 25.7 < 0.1 3.8 10.0 0.4 41 Clover species 1.8 0.2 13.2 < 0.1 1.6 5.6 0.4 42 Black medick 1.9 0.2 8.9 < 0.1 1.1 3.6 0.4 43 Mouse-eared chickweed 0.2 0.1 30.0 0.2 81.4 162.0 0.4 44 Yellow sweet-clover 1.6 0.2 15.4 < 0.1 0.8 5.2 0.4 45 Flixweed 1.5 0.2 16.2 < 0.1 0.9 3.2 0.4 46 American vetch 1.9 0.1 5.4 < 0.1 0.3 4.8 0.3 47 Corn 1.0 0.3 32.5 < 0.1 1.3 2.2 0.3 48 Bladder campion 0.7 0.3 41.9 < 0.1 7.0 14.4 0.3 49 Bicknell's geranium 1.3 0.2 16.5 < 0.1 0.8 3.8 0.3 50 Purslane 1.1 0.2 16.1 < 0.1 2.2 7.2 0.3 51 Corn spurry 0.4 0.2 55.8 0.1 14.4 27.4 0.3 52 Broad-leaved plantain 1.0 0.2 17.1 < 0.1 2.2 10.8 0.3
(Table continued on next page)

Field Survey Summary Tables – 1986 Annual Crops
158
Table 113. 1986 Annual crops in Manitoba (501 fields) (continued) Frequency Field Uniformity Field Density (#/m2) Relative
Rank Species (%) All Occurrence All Occurrence High Abundance 53 Rye 0.8 0.2 25.0 < 0.1 1.6 1.6 0.2 54 Foxtail barley 0.9 0.1 12.1 < 0.1 2.5 10.6 0.2 55 Biennial wormwood 1.0 0.1 12.0 < 0.1 0.7 2.0 0.2 56 Stork's bill 1.1 0.1 6.1 < 0.1 0.3 0.6 0.2 57 Yellow toadflax 0.2 0.1 80.0 0.1 27.0 27.0 0.2 58 Prairie sunflower 0.5 0.2 35.0 < 0.1 2.2 2.2 0.2 59 Manitoba maple 0.8 0.1 10.0 < 0.1 0.5 1.0 0.2 60 Bird's-foot trefoil 0.2 0.2 75.0 < 0.1 11.8 11.8 0.2 61 Rough cinquefoil 0.6 0.1 15.3 < 0.1 1.2 3.2 0.1 62 Orchard grass 0.2 0.1 70.0 < 0.1 12.6 12.6 0.1 63 Red goosefoot 0.2 0.1 60.0 < 0.1 9.6 9.6 0.1 64 Field bindweed 0.6 0.1 10.6 < 0.1 0.5 1.0 0.1 65 Cow cockle 0.5 0.1 13.3 < 0.1 1.2 5.0 0.1 66 Dock species 0.5 0.1 10.0 < 0.1 1.3 1.6 0.1 67 Prostrate pigweed 0.5 < 0.1 9.0 < 0.1 0.7 4.2 0.1 68 Henbit 0.3 0.1 24.9 < 0.1 2.0 4.8 0.1 69 Tartary buckwheat 0.4 0.1 15.0 < 0.1 1.0 1.2 0.1 70 Common groundsel 0.4 0.1 15.7 < 0.1 0.7 0.8 0.1 71 Proso millet 0.3 0.1 19.7 < 0.1 3.1 11.0 0.1 72 Field pea 0.2 0.1 25.0 < 0.1 5.3 10.4 0.1 73 Common ragweed 0.4 < 0.1 5.0 < 0.1 0.3 0.6 0.1 74 Spiny annual sow-thistle 0.3 < 0.1 10.6 < 0.1 0.8 1.0 0.1 75 Common pepper-grass 0.4 < 0.1 5.7 < 0.1 0.4 1.0 0.1 76 Vetchling species 0.4 < 0.1 5.0 < 0.1 0.2 0.2 0.1 77 Pineappleweed 0.2 0.1 25.0 < 0.1 1.8 1.8 0.1 78 Witch grass 0.2 0.1 25.0 < 0.1 1.6 1.6 0.1 79 Oats 0.2 < 0.1 20.0 < 0.1 1.4 1.4 0.1 80 Small bugloss 0.2 < 0.1 15.0 < 0.1 2.0 2.0 0.1 81 Biennial campion 0.2 < 0.1 15.0 < 0.1 4.2 4.2 < 0.1 82 Giant ragweed 0.2 < 0.1 15.0 < 0.1 0.8 0.8 < 0.1 83 Ground-ivy 0.2 < 0.1 15.0 < 0.1 0.6 0.6 < 0.1 84 Blue grass species 0.2 < 0.1 7.1 < 0.1 1.1 3.0 < 0.1 85 Prickly lettuce 0.2 < 0.1 5.0 < 0.1 0.4 0.4 < 0.1 86 Wild tomato 0.2 < 0.1 5.0 < 0.1 0.2 0.2 < 0.1 87 Poplar species 0.1 < 0.1 35.0 < 0.1 2.4 2.4 < 0.1 88 Absinth 0.2 < 0.1 5.0 < 0.1 0.2 0.2 < 0.1 89 Scentless chamomile 0.2 < 0.1 5.0 < 0.1 0.6 0.6 < 0.1 90 Two-grooved milk-vetch 0.2 < 0.1 5.0 < 0.1 0.2 0.2 < 0.1 91 Wood whitlow-grass 0.2 < 0.1 5.0 < 0.1 0.2 0.2 < 0.1 92 Western snowberry < 0.1 < 0.1 5.0 < 0.1 0.6 0.6 < 0.1 93 False flax species < 0.1 < 0.1 5.0 < 0.1 0.4 0.4 < 0.1 94 Green tansy mustard < 0.1 < 0.1 5.0 < 0.1 0.2 0.2 < 0.1 95 False ragweed < 0.1 < 0.1 5.0 < 0.1 0.2 0.2 < 0.1

Field Survey Summary Tables – 1978-81 Annual Crops
159
Table 114. 1978-81 Annual crops in Manitoba (1424 fields) Frequency Field Uniformity Field Density (#/m2) Relative
Rank Species (%) All Occurrence All Occurrence High Abundance 1 Green foxtail 84.7 56.8 67.1 66.1 78.0 1459.8 95.7 2 Wild oats 73.8 32.5 44.1 13.0 17.6 629.8 35.4 3 Wild buckwheat 78.1 34.2 43.8 5.7 7.3 288.8 30.0 4 Pale smartweed 44.0 15.5 35.1 4.7 10.6 228.8 16.7 5 Canada thistle 50.8 11.1 21.9 1.4 2.7 63.0 12.8 6 Wild mustard 40.4 9.6 23.8 1.4 3.5 262.6 10.8 7 Lamb's-quarters 36.8 9.9 26.8 1.8 5.0 460.8 10.8 8 Perennial sow-thistle 41.9 8.6 20.5 1.1 2.7 104.0 10.3 9 Redroot pigweed 38.3 8.4 21.9 1.2 3.2 77.6 9.8 10 Night-flowering catchfly 17.3 5.3 30.7 0.8 4.4 82.8 5.2 11 Stinkweed 20.9 4.0 19.2 0.6 2.9 105.0 5.1 12 Quack grass 13.7 3.1 23.0 1.2 8.8 300.8 4.3 13 Barnyard grass species 9.7 2.6 27.2 1.9 19.5 340.4 4.2 14 Russian thistle 13.0 3.4 25.9 0.5 4.1 64.4 3.7 15 Flax 7.9 3.1 39.6 1.3 17.0 297.2 3.6 16 Bluebur 11.0 2.8 25.8 0.4 3.2 48.8 3.0 17 Hemp-nettle 8.3 2.8 33.4 0.4 5.0 39.6 2.6 18 Field horsetail 9.3 2.1 22.6 0.5 5.5 66.4 2.6 19 Thyme-leaved spurge 8.1 2.2 27.4 0.3 3.6 66.4 2.3 20 Wheat 8.2 2.1 25.2 0.2 2.9 61.4 2.2 21 Shepherd's-purse 7.7 1.7 22.3 0.3 3.4 49.8 2.0 22 Barley 6.5 1.6 24.4 0.2 2.7 33.4 1.7 23 Cow cockle 5.4 1.5 27.5 0.3 5.1 167.2 1.6 24 Prostrate knotweed 6.3 1.3 20.2 0.2 2.5 37.8 1.5 25 Round-leaved mallow 5.4 0.9 16.5 0.1 1.8 10.6 1.2 26 Dandelion 5.2 0.8 14.4 0.1 1.4 13.2 1.1 27 Black medick 3.4 0.8 23.9 0.3 7.9 63.4 1.0 28 Rose species 4.9 0.7 13.5 0.1 1.7 33.6 1.0 29 Canola/rapeseed 3.7 0.9 24.7 0.1 4.0 47.4 1.0 30 Dog mustard 3.5 0.9 25.5 0.2 4.5 38.2 1.0 31 Kochia 2.3 0.8 32.9 0.4 16.4 252.0 1.0 32 Chickweed 3.1 0.6 20.2 0.2 7.4 96.6 0.9 33 Clover species 3.4 0.7 19.5 0.1 3.6 44.2 0.9 34 False cleavers 2.3 0.7 29.2 0.1 6.0 32.0 0.7 35 Flixweed 2.9 0.5 16.0 0.1 3.6 83.6 0.7 36 Yellow sweet-clover 2.5 0.5 19.7 0.1 3.5 58.2 0.6 37 Prostrate pigweed 2.2 0.6 26.4 0.1 2.5 11.6 0.6 38 Tartary buckwheat 2.0 0.5 26.7 0.1 3.8 34.6 0.6 39 Broad-leaved plantain 2.2 0.4 16.0 0.1 5.3 60.0 0.6 40 Ball mustard 2.1 0.4 20.5 0.1 3.9 32.0 0.5 41 Alfalfa 2.3 0.4 15.7 < 0.1 1.1 7.8 0.5 42 Purslane 1.8 0.4 19.3 < 0.1 2.3 17.4 0.4 43 Showy milkweed 2.2 0.2 11.3 < 0.1 1.6 8.4 0.4 44 American vetch 2.3 0.2 10.5 < 0.1 0.6 4.2 0.4 45 Biennial wormwood 2.0 0.3 14.6 < 0.1 1.8 10.8 0.4 46 Field bindweed 1.6 0.4 22.0 < 0.1 2.2 20.2 0.4 47 White cockle 1.2 0.4 32.4 < 0.1 4.0 21.4 0.4 48 Yellow foxtail 0.6 0.2 40.2 0.2 33.7 157.0 0.4 49 American dragonhead 1.6 0.3 17.8 < 0.1 1.1 6.2 0.3 50 Narrow-leaved hawk's-beard 1.1 0.3 27.9 < 0.1 4.0 16.2 0.3 51 Wormseed mustard 1.2 0.2 19.1 < 0.1 1.3 4.2 0.3 52 Water smartweed 1.1 0.2 13.7 < 0.1 2.0 10.4 0.2
(Table continued on next page)

Field Survey Summary Tables – 1978-81 Annual Crops
160
Table 114. 1978-81 Annual crops in Manitoba (1424 fields) (continued) Frequency Field Uniformity Field Density (#/m2) Relative
Rank Species (%) All Occurrence All Occurrence High Abundance 53 Bicknell's geranium 1.2 0.1 11.1 < 0.1 0.5 1.6 0.2 54 Oats 0.6 0.2 32.2 0.1 12.3 81.2 0.2 55 Common ragweed 1.0 0.2 15.9 < 0.1 2.1 16.0 0.2 56 Prairie sunflower 1.0 0.1 12.9 < 0.1 1.6 15.0 0.2 57 Cocklebur 0.8 0.1 17.8 < 0.1 1.6 6.6 0.2 58 False ragweed 0.6 0.2 29.5 < 0.1 2.7 14.4 0.2 59 Witch grass 0.5 0.2 34.4 < 0.1 9.3 50.2 0.2 60 Absinth 0.8 0.1 13.6 < 0.1 1.3 2.2 0.2 61 Leafy spurge 0.6 0.1 22.4 < 0.1 2.7 9.6 0.2 62 Bladder campion 0.5 0.2 30.4 < 0.1 3.2 11.6 0.1 63 Stork's bill 0.7 0.1 11.8 < 0.1 0.9 5.2 0.1 64 Aster species 0.7 0.1 10.1 < 0.1 1.0 5.6 0.1 65 Smooth brome 0.6 0.1 13.2 < 0.1 3.4 9.8 0.1 66 Spear-leaved goosefoot 0.5 0.1 14.1 < 0.1 2.4 10.2 0.1 67 Povertyweed 0.4 0.1 23.5 < 0.1 4.4 14.4 0.1 68 Common pepper-grass 0.6 < 0.1 6.6 < 0.1 0.4 1.2 0.1 69 False flax species 0.5 0.1 19.2 < 0.1 1.5 5.0 0.1 70 Large crab grass 0.3 0.1 28.9 < 0.1 4.7 7.8 0.1 71 Field mint 0.4 0.1 21.3 < 0.1 1.5 3.2 0.1 72 Marsh yellow cress 0.3 0.1 20.4 < 0.1 2.3 4.0 0.1 73 Manitoba maple 0.5 < 0.1 7.0 < 0.1 0.3 0.8 0.1 74 Tall hedge mustard 0.1 0.1 95.0 < 0.1 59.6 59.6 0.1 75 Wild tomato 0.3 0.1 18.2 < 0.1 1.6 5.4 0.1 76 Corn spurry 0.3 0.1 22.6 < 0.1 1.9 5.2 0.1 77 Spiny annual sow-thistle 0.2 0.1 45.0 < 0.1 4.9 6.8 0.1 78 Tall buttercup 0.4 < 0.1 10.0 < 0.1 0.7 1.4 0.1 79 Western snowberry 0.2 0.1 21.2 < 0.1 2.1 6.0 0.1 80 Slender wheat grass 0.1 0.1 95.0 < 0.1 28.6 28.6 0.1 81 Foxtail barley 0.3 < 0.1 8.2 < 0.1 0.9 2.0 0.1 82 Pineappleweed 0.2 < 0.1 8.6 < 0.1 7.1 19.8 0.1 83 Pygmyflower 0.3 < 0.1 8.3 < 0.1 0.6 1.8 < 0.1 84 Poplar species 0.2 < 0.1 25.0 < 0.1 2.1 3.2 < 0.1 85 Dock species 0.2 < 0.1 14.3 < 0.1 0.6 1.2 < 0.1 86 Scouring-rush 0.2 < 0.1 15.0 < 0.1 0.6 0.8 < 0.1 87 Rough cinquefoil 0.2 < 0.1 16.0 < 0.1 1.1 3.8 < 0.1 88 Spreading dogbane 0.2 < 0.1 13.8 < 0.1 4.1 7.0 < 0.1 89 Common burdock 0.2 < 0.1 8.3 < 0.1 0.5 0.8 < 0.1 90 Rye 0.2 < 0.1 18.6 < 0.1 1.1 1.4 < 0.1 91 Atriplex species 0.1 < 0.1 25.0 < 0.1 2.2 2.2 < 0.1 92 Maple-leaved goosefoot 0.2 < 0.1 5.0 < 0.1 0.2 0.2 < 0.1 93 Giant ragweed 0.1 < 0.1 20.4 < 0.1 1.1 2.2 < 0.1 94 Small bugloss 0.2 < 0.1 5.0 < 0.1 0.2 0.2 < 0.1 95 Common groundsel 0.2 < 0.1 8.3 < 0.1 1.1 3.4 < 0.1 96 Green tansy mustard 0.1 < 0.1 10.0 < 0.1 1.9 3.6 < 0.1 97 Tumble pigweed 0.1 < 0.1 7.4 < 0.1 0.4 0.4 < 0.1 98 Pennsylvania pellitory 0.1 < 0.1 25.0 < 0.1 9.8 9.8 < 0.1 99 Pasture sage 0.1 < 0.1 11.4 < 0.1 1.0 2.0 < 0.1 100 Russian pigweed 0.1 < 0.1 5.0 < 0.1 0.2 0.2 < 0.1 101 Prairie junegrass < 0.1 < 0.1 10.0 < 0.1 30.2 30.2 < 0.1 102 Wild radish 0.1 < 0.1 30.0 < 0.1 2.6 2.6 < 0.1 103 Bracted vervain 0.1 < 0.1 20.0 < 0.1 1.8 1.8 < 0.1 104 Corn 0.1 < 0.1 5.0 < 0.1 0.8 0.8 < 0.1
(Table continued on next page)

Field Survey Summary Tables – 1978-81 Annual Crops
161
Table 114. 1978-81 Annual crops in Manitoba (1424 fields) (continued) Frequency Field Uniformity Field Density (#/m2) Relative
Rank Species (%) All Occurrence All Occurrence High Abundance 105 White mustard 0.1 < 0.1 5.0 < 0.1 0.2 0.2 < 0.1 106 Canada fleabane 0.1 < 0.1 5.0 < 0.1 0.2 0.2 < 0.1 107 Tumble mustard 0.1 < 0.1 10.0 < 0.1 0.6 0.6 < 0.1 108 Field dodder 0.1 < 0.1 15.0 < 0.1 0.8 0.8 < 0.1 109 Northern bedstraw 0.1 < 0.1 6.2 < 0.1 0.3 0.6 < 0.1 110 Meadow rue species 0.1 < 0.1 18.3 < 0.1 1.1 2.2 < 0.1 111 Ground-ivy 0.1 < 0.1 20.0 < 0.1 2.0 2.0 < 0.1 112 Common yellow wood-sorrel 0.1 < 0.1 5.0 < 0.1 0.2 0.2 < 0.1 113 Field pea 0.1 < 0.1 5.0 < 0.1 0.2 0.2 < 0.1 114 Wild cucumber 0.1 < 0.1 5.0 < 0.1 0.4 0.4 < 0.1 115 Hairy-nerved carrionflower 0.1 < 0.1 5.0 < 0.1 0.2 0.2 < 0.1 116 Hare's-ear mustard 0.1 < 0.1 5.0 < 0.1 0.2 0.2 < 0.1 117 Henbit 0.1 < 0.1 5.0 < 0.1 0.2 0.2 < 0.1 118 Rough pennyroyal 0.1 < 0.1 5.0 < 0.1 0.2 0.2 < 0.1 119 Blue grass species < 0.1 < 0.1 20.0 < 0.1 2.3 4.2 < 0.1 120 Crested wheat grass 0.1 < 0.1 5.0 < 0.1 0.6 0.6 < 0.1 121 Timothy < 0.1 < 0.1 5.0 < 0.1 0.4 0.4 < 0.1 122 Scentless chamomile < 0.1 < 0.1 5.0 < 0.1 0.2 0.2 < 0.1 123 Common yarrow < 0.1 < 0.1 5.0 < 0.1 0.2 0.2 < 0.1 124 Persian darnel < 0.1 < 0.1 25.0 < 0.1 2.4 2.4 < 0.1 125 Prickly lettuce < 0.1 < 0.1 5.0 < 0.1 0.2 0.2 < 0.1 126 Purslane speedwell < 0.1 < 0.1 5.0 < 0.1 0.2 0.2 < 0.1 127 Yellow rocket < 0.1 < 0.1 5.0 < 0.1 0.8 0.8 < 0.1

162

163
Part V POPULATION SHIFTS 1978 TO 2016 Residual Weed Population Shifts in Manitoba – 1978 to 2016 Abstract for Poster Presented at Canadian Weed Science Society Annual Meeting, November 21 -24, 2016 The comparison of the relative abundance of weeds in Manitoba in 2016 with results from previous provincial surveys enables the identification of recent shifts in species ranks, life form density and relative abundance. In 2016, a total of 658 fields of canola, spring wheat, soybean, corn, barley, oat, flax and sunflower were surveyed. These fields were selected using a stratified random sampling procedure based on ecodistricts. In each field, weeds were counted in 20 quadrats (50 by 50 cm) in late summer. Weed data are summarized using a relative abundance index based on frequency, field uniformity and density. Green foxtail (Setaria viridis (L.) P. Beauv.) was the most abundant weed, wild buckwheat (Fallopia convolvulus (L.) Á.Löve) ranked second, barnyard grass species (Echinochloa spp.) ranked third and wild oats (Avena fatua L.) ranked fourth. The results from the 2016 survey are compared to results from surveys of 631 fields in 2002, 452 fields in 1997, 501 fields in 1986 and 1424 fields in 1978-1981. Nine species have been ranked amongst the top 20 most abundant species in each survey. Ten species have declined ten or more ranks since the 1970s. Nine of these species continued to decline in 2016: bluebur (Lappula squarrosa (Retz.) Dumort.), Russian thistle (Salsola tragus L.), flax (Linum usitatissimum L.), barley (Hordeum vulgare L.), dog mustard (Erucastrum gallicum (Willd.) O.E. Schultz), quack grass (Elymus repens (L.) Gould), stinkweed (Thlaspi arvense L), wild mustard (Sinapis arvensis L.), hemp-nettle (Galeopsis tetrahit L.). Perennial sow-thistle (Sonchus arvensis L.) declined in the 2002 survey, but did not decrease any further in the 2016 survey. Spiny annual sow-thistle (Sonchus asper (L.) Hill) has increased the most since the 1970s, most notably from 1997 to 2002; however, it declined slightly from 2002 to 2016. Yellow foxtail (Setaria pumila (Poir.) Roem. & Schult.) has been steadily increasing since the 1970s, and appeared in the top twenty for the first time in 2016. Broad-leaved plantain (Plantago major L.) and biennial wormwood (Artemisia biennis Willd.) also appeared in the top 20 in the most recent survey. Other species that have increased since the 1970s include: canola (Brassica napus L.), dandelion (Taraxacum officinale F. H. Wigg.), false cleavers (Galium spurium L.), round-leaved mallow (Malva pusilla Sm.), wheat (Triticum spp.), chickweed (Stellaria media (L.) Vill.) and barnyard grass species. The relative abundance of annual grasses was lowest in the 2016 survey, while relative abundances of perennials and facultative winter annuals were the highest on record. The densities of annual grass and annual broad-leaved weeds were the lowest ever recorded while the densities of perennials and facultative winter annuals were slightly higher in 2016 than in 2002.

1970s 1986 1997 2002 2016 Change Spiny annual sow-thistle 77 74 36 14 15 62 Yellow foxtail 48 40 27 30 6 42 Broad-leaved plantain 39 52 31 35 11 28 Biennial wormwood 45 55 44 49 20 25 Canola/rapeseed 29 28 19 9 5 24 Dandelion 26 36 20 10 7 19 False cleavers 34 21 14 15 17 17 Round-leaved mallow 25 23 21 16 10 15 Chickweed 32 15 12 22 18 14 Wheat 20 19 22 12 9 11 Barnyard grass species 13 27 11 4 3 10 Wild buckwheat 3 3 3 3 2 1 Redroot pigweed 9 8 5 6 8 1 Kochia 31 30 24 17 30 1 Green foxtail 1 1 1 1 1 0 Wild oats 2 2 2 2 4 -2 Field horsetail 18 18 26 23 21 -3 Night-flowering catchfly 10 13 15 18 16 -6 Shepherd's-purse 21 17 13 27 27 -6 Lamb's-quarters 7 6 9 7 14 -7 Canada thistle 5 9 4 5 13 -8 Pale smartweed 4 5 7 8 12 -8 Thyme-leaved spurge 19 26 23 21 28 -9 Perennial sow-thistle 8 11 8 20 19 -11 Hemp-nettle 17 14 16 24 33 -16 Wild mustard 6 4 6 11 23 -17 Stinkweed 11 10 17 19 34 -23 Quack grass 12 12 10 13 38 -26 Dog mustard 30 20 37 41 62 -32 Barley 22 16 29 26 69 -47 Flax 15 7 18 25 74 -59 Russian thistle 14 24 33 57 96 -82 Bluebur 16 25 51 60 - >-112
(%) (%) (m-2)
Objectives
Julia Y. Leeson1, Jeanette Gaultier2 and Laryssa Grenkow3 1Agriculture and Agri-Food Canada, Saskatoon, SK, 2Manitoba Agriculture, Carman, MB, 3Manitoba Pulse & Soybean Growers, Carman, MB JJulia Y. Leeson1, Jeanette Gaultier2 and Laryssa Grenkow3
Residual Weed Population Shifts in Manitoba – 1978 to 2016
The survey was funded by: Manitoba Agri-Research and Development Fund (GF2), Western Grains Research Foundation, Manitoba Pulse & Soybean Growers, Manitoba Wheat & Barley Growers Association, Manitoba Canola Growers, Manitoba Oat Growers Association, Manitoba Corn Growers Association, Manitoba Seed Growers Association, Manitoba Flax Growers Association and National Sunflower Association of Canada. We would like to thank the producers who granted us access to their land to conduct this survey. The survey would not be possible without the assistance of the many individuals who contacted producers, surveyed fields and entered data.
The survey was funded by: Manitoba Agri-Res
Acknowledgements
Species Shifts
Methods
Present the top twenty species in 2016 Manitoba provincial weed survey Compare the relative abundance of weeds in Manitoba in 2016 with results from the 2002, 1997, 1986 and 1978-1981 provincial surveys Identify shifts in life form density and relative abundance
Used a stratified random sampling procedure to select fields in ecodistricts shown on map Surveyed 658 fields of canola, spring wheat, soybean, corn, barley, oat, flax and sunflower Counted weeds in 20 quadrats (50 by 50 cm) per field in late summer (residual populations) Data weighted in analysis based on distribution of surveyed crops in 2011 census Summarized weed data using a relative abundance index based on frequency, field uniformity and density Frequency = % of fields in which species occurred Uniformity = % of quadrats in which species occurred Density = Average density of species in all fields Compared top twenty species from surveys of:
631 fields in 2002 452 fields in 1997 501 fields in 1986 1424 fields in 1970s (1978-1981)
Top 20 Species in 2016 Survey
Relative Abundance Index Weed Species Frequency Uniformity Density*
Green foxtail 24.4 10.0 14.6 Wild buckwheat 52.7 13.1 2.0 Barnyard grass species 23.0 6.4 4.8 Wild oats 20.7 5.6 4.4 Canola/rapeseed 23.2 6.5 2.9 Yellow foxtail 11.2 3.9 10.6 Dandelion 21.1 4.4 2.4 Redroot pigweed 20.9 4.5 2.1 Wheat 15.5 4.4 3.5 Round-leaved mallow 20.1 4.1 1.7 Broad-leaved plantain 12.5 3.4 4.5 Pale smartweed 17.5 3.2 2.0 Canada thistle 18.1 3.1 1.6 Lamb's-quarters 15.5 3.0 2.0 Spiny annual sow-thistle 11.1 2.6 2.0 Night-flowering catchfly 9.4 1.9 2.5 False cleavers 9.0 2.2 1.9 Chickweed 7.5 1.9 3.4 Perennial sow-thistle 8.5 1.8 1.8 Biennial wormwood 9.2 1.7 1.4
*Average density in occurrence fields
Relative Abundance Rank
*Species in italics have maintained a position in the top 20 since 1970s
Species Shifts Summary Spiny annual sow-thistle has increased the most since the 1970s; however, it did not increase from 2002 to 2016 Yellow foxtail, broad-leaved plantain and biennial wormwood appeared in the top twenty for the first time in 2016 Other species that have increased since the 1970s include: canola, dandelion, false cleavers, round-leaved mallow, chickweed, wheat and barnyard grass species Nine species have been in the top 20 since the 1970s Green foxtail has been ranked first in every survey Wild oats fell from the second most abundant species to the fourth surpassed by wild buckwheat and barnyard grass species Of the fourteen species with the largest decline, only perennial sow-thistle did not decrease in the most recent survey
Life Form Shifts Annual grass
Annual broad-leaved
Facultative winter annual
Perennial
Life Form Shift Summary The densities of annual grass and annual broad-leaved weeds in 2016 were the lowest ever recorded The relative abundance of annual grasses was lowest in the 2016 survey, while relative abundances of perennials and facultative winter annuals were the highest on record
Next Step Interpret shifts in terms of management practices based on information obtained from questionnaires completed by survey participants
Thomas, A.G. and R.F. Wise. 1984. Weed surveys of Manitoba cereal and oilseed crops in 1978, 1979 and 1981. Weed Survey Series Publication 84-1. Thomas, A.G. and R.F. Wise. 1988. Weed survey of cereal and oilseed crops in Manitoba (1986). Agriculture Canada Weed Survey Series Publication 88-1. Thomas, A.G., B.L. Frick, R.C. Van Acker, S.Z. Knezevic and D. Joosse. 1998. Manitoba survey of cereal and oilseed crops in 1997. Agriculture and Agri-Food Canada Weed Survey Series Publication 98-1. Leeson, J.Y., A.G. Thomas, T. Andrews, K.R. Brown and R.C. Van Acker. 2002. Weed survey of Manitoba cereal and oilseed crops in 2002. Agriculture and Agri-Food Canada Weed Survey Series Publication 02-2.
Thomas, A.G. and R.F. WiTh A G d R F Wi
Sources
2016 Manitoba Survey
Ecodistrict boundaries Sites surveyed in 2016
Winnipeg
40 30 20 10 0
Weeds that have increased the most since the 1970s. Left to right: Spiny annual sow-thistle, yellow foxtail, broad-leaved plantain, biennial wormwood
0
20
40
60
1970s 1986 1997 2002 2016
Average Density
(m-2)
Percent of Relative
Abundance 0
30
60
90
1970s 1986 1997 2002 2016
Average Density
(m-2)
Percent of Relative
Abundance 0
30
60
90
1970s 1986 1997 2002 20160
20
40
60
1970s 1986 1997 2002 2016
Average Density
(m-2)
Percent of Relative
Abundance 0
30
60
90
1970s 1986 1997 2002 20160
20
40
60
1970s 1986 1997 2002 2016
Average Density
(m-2)
Percent of Relative
Abundance 0
30
60
90
1970s 1986 1997 2002 20160
20
40
60
1970s 1986 1997 2002 2016
Brandon
Ecoregions
Interlake Plain Boreal Transition Mid-Boreal Uplands
Lake Manitoba Plain Aspen Parkland
Southwest Manitoba Uplands
Lake of the Woods Mid-Boreal Lowland

165
Part VI DISTRIBUTION MAPS
List of Distribution Maps Barnyard grass ........................................................................................................................................................... 167 Barnyard grass species ............................................................................................................................................... 168 Biennial wormwood .................................................................................................................................................. 169 Black medick ............................................................................................................................................................. 170 Broad-leaved plantain ................................................................................................................................................ 171 Canada thistle ............................................................................................................................................................ 172 Canola/rapeseed ......................................................................................................................................................... 173 Chickweed ................................................................................................................................................................. 174 Dandelion .................................................................................................................................................................. 175 Dock species .............................................................................................................................................................. 176 False cleavers ............................................................................................................................................................. 177 Field horsetail ............................................................................................................................................................ 178 Foxtail barley ............................................................................................................................................................. 179 Golden dock ............................................................................................................................................................... 180 Green foxtail .............................................................................................................................................................. 181 Hemp-nettle ............................................................................................................................................................... 182 Kochia ....................................................................................................................................................................... 183 Lamb's-quarters ......................................................................................................................................................... 184 Marsh yellow cress .................................................................................................................................................... 185 Night-flowering catchfly ........................................................................................................................................... 186 Oak-leaved goosefoot ................................................................................................................................................ 187 Pale smartweed .......................................................................................................................................................... 188 Perennial sow-thistle .................................................................................................................................................. 189 Purslane ..................................................................................................................................................................... 190 Redroot pigweed ........................................................................................................................................................ 191 Round-leaved mallow ................................................................................................................................................ 192 Shepherd's-purse ........................................................................................................................................................ 193 Spiny annual sow-thistle ............................................................................................................................................ 194 Stinkweed .................................................................................................................................................................. 195 Thyme-leaved spurge ................................................................................................................................................ 196 Western barnyard grass ............................................................................................................................................. 197 Wheat ......................................................................................................................................................................... 198 Wild buckwheat ......................................................................................................................................................... 199 Wild mustard ............................................................................................................................................................. 200 Wild oats .................................................................................................................................................................... 201 Yellow foxtail ............................................................................................................................................................ 202 Yellow sweet-clover .................................................................................................................................................. 203


Species Maps – Barnyard grass
Barnyard grass, Echinochloa crus-galli*
10.1 to 20.0% 30.1 to 40.0% 50.1 to 60.0% More than 70% Absent 0.1 to 10.0% 20.1 to 30.0% 40.1 to 50.0% 60.1 to 70.0% Not Surveyed
Frequency
167
2016
Winkler
Winnipeg
Steinbach
Dauphin
Selkirk Portage la Prairie
Brandon
*See barnyard grass species for previous survey maps

Species Maps – Barnyard grass species
Barnyard grass species, Echinochloa spp.
10.1 to 20.0% 30.1 to 40.0% 50.1 to 60.0% More than 70% Absent 0.1 to 10.0% 20.1 to 30.0% 40.1 to 50.0% 60.1 to 70.0% Not Surveyed
Frequency
168
Frequency Field Uniformity Field Density (#/m2) Relative Survey Rank (%) All Occurrence All Occurrence High Abundance
1978-81 13 9.7 2.6 27.2 1.9 19.5 340.4 4.2 1986 27 4.9 0.8 15.8 0.1 2.9 32.0 1.3 1997 11 20.4 4.4 21.7 1.5 7.6 131.4 8.0 2002 4 25.7 6.6 25.9 3.8 14.8 582.8 20.4 2016 3 23.0 6.4 27.8 1.1 4.8 80.0 18.2
2002
1997
1986
2016
1970s
Winkler
Winnipeg
Steinbach
Dauphin
Selkirk Portage la Prairie
Brandon
* Includes western barnyard grass and barnyard grass (Echinochloa muricata var. microstachya and E.crus-galli )

Species Maps – Biennial wormwood
Biennial wormwood, Artemisia biennis
10.1 to 20.0% 30.1 to 40.0% 50.1 to 60.0% More than 70% Absent 0.1 to 10.0% 20.1 to 30.0% 40.1 to 50.0% 60.1 to 70.0% Not Surveyed
Frequency
169
Frequency Field Uniformity Field Density (#/m2) Relative Survey Rank (%) All Occurrence All Occurrence High Abundance
1978-81 45 2.0 0.3 14.6 < 0.1 1.8 10.8 0.4 1986 55 1.0 0.1 12.0 < 0.1 0.7 2.0 0.2 1997 44 1.4 0.1 7.4 < 0.1 2.1 11.6 0.3 2002 49 0.9 0.1 12.3 < 0.1 0.9 2.2 0.2 2016 20 9.2 1.7 18.4 0.1 1.4 22.8 4.4
2002
1997
1986
2016
1970s
Winkler
Winnipeg
Steinbach
Dauphin
Selkirk Portage la Prairie
Brandon

Species Maps – Black medick
Black medick, Medicago lupulina
10.1 to 20.0% 30.1 to 40.0% 50.1 to 60.0% More than 70% Absent 0.1 to 10.0% 20.1 to 30.0% 40.1 to 50.0% 60.1 to 70.0% Not Surveyed
Frequency
170
Frequency Field Uniformity Field Density (#/m2) Relative Survey Rank (%) All Occurrence All Occurrence High Abundance
1978-81 27 3.4 0.8 23.9 0.3 7.9 63.4 1.0 1986 42 1.9 0.2 8.9 < 0.1 1.1 3.6 0.4 1997 49 0.7 0.1 22.5 < 0.1 2.2 2.8 0.2 2002 28 2.6 0.5 20.9 0.1 3.0 15.6 1.1 2016 25 5.4 1.0 19.0 0.1 1.4 6.0 2.6
2002
1997
1986
2016
1970s
Winkler
Winnipeg
Steinbach
Dauphin
Selkirk Portage la Prairie
Brandon

Species Maps – Broad-leaved plantain
Broad-leaved plantain, Plantago major*
10.1 to 20.0% 30.1 to 40.0% 50.1 to 60.0% More than 70% Absent 0.1 to 10.0% 20.1 to 30.0% 40.1 to 50.0% 60.1 to 70.0% Not Surveyed
Frequency
171
Frequency Field Uniformity Field Density (#/m2) Relative Survey Rank (%) All Occurrence All Occurrence High Abundance
1978-81 39 2.2 0.4 16.0 0.1 5.3 60.0 0.6 1986 52 1.0 0.2 17.1 < 0.1 2.2 10.8 0.3 1997 31 3.4 0.4 12.8 < 0.1 1.1 7.8 0.8 2002 35 1.8 0.2 11.8 < 0.1 1.8 11.4 0.6 2016 11 12.5 3.4 27.4 0.6 4.5 57.4 9.6
2002
1997
1986
2016
1970s
Winkler
Winnipeg
Steinbach
Dauphin
Selkirk Portage la Prairie
Brandon
* Includes other plantain species

Species Maps – Canada thistle
Canada thistle, Cirsium arvense
10.1 to 20.0% 30.1 to 40.0% 50.1 to 60.0% More than 70% Absent 0.1 to 10.0% 20.1 to 30.0% 40.1 to 50.0% 60.1 to 70.0% Not Surveyed
Frequency
172
Frequency Field Uniformity Field Density (#/m2) Relative Survey Rank (%) All Occurrence All Occurrence High Abundance
1978-81 5 50.8 11.1 21.9 1.4 2.7 63.0 12.8 1986 9 45.1 9.3 20.7 1.1 2.5 21.6 12.6 1997 4 59.0 11.8 20.0 1.2 2.1 25.8 16.9 2002 5 42.6 7.3 17.1 0.8 1.8 18.2 15.0 2016 13 18.1 3.1 17.3 0.3 1.6 33.8 8.7
2002
1997
1986
2016
1970s
Winkler
Winnipeg
Steinbach
Dauphin
Selkirk Portage la Prairie
Brandon

Species Maps – Canola/rapeseed
Canola/rapeseed, Brassica napus and B. rapa
10.1 to 20.0% 30.1 to 40.0% 50.1 to 60.0% More than 70% Absent 0.1 to 10.0% 20.1 to 30.0% 40.1 to 50.0% 60.1 to 70.0% Not Surveyed
Frequency
173
Frequency Field Uniformity Field Density (#/m2) Relative Survey Rank (%) All Occurrence All Occurrence High Abundance
1978-81 28 4.0 1.0 24.2 0.2 3.9 47.4 1.1 1986 27 4.7 1.2 25.2 0.1 2.3 10.0 1.4 1997 16 12.5 3.1 25.0 0.4 3.6 39.4 4.1 2002 9 20.7 4.1 19.5 0.6 3.1 86.0 8.2 2016 3 34.3 9.8 28.5 1.0 3.0 35.6 21.7
2002
1997
1986
2016
1970s
Winkler
Winnipeg
Steinbach
Dauphin
Selkirk Portage la Prairie
Brandon
* Data only includes fields not seeded to canola

Species Maps – Chickweed
Chickweed, Stellaria media
10.1 to 20.0% 30.1 to 40.0% 50.1 to 60.0% More than 70% Absent 0.1 to 10.0% 20.1 to 30.0% 40.1 to 50.0% 60.1 to 70.0% Not Surveyed
Frequency
174
Frequency Field Uniformity Field Density (#/m2) Relative Survey Rank (%) All Occurrence All Occurrence High Abundance
1978-81 32 3.1 0.6 20.2 0.2 7.4 96.6 0.9 1986 15 6.7 2.2 32.7 1.0 15.5 110.0 3.6 1997 12 7.2 3.4 47.6 2.7 37.1 257.8 7.6 2002 22 4.9 1.4 28.3 0.3 5.3 44.0 2.6 2016 18 7.5 1.9 25.5 0.3 3.4 23.2 5.1
2002
1997
1986
2016
1970s
Winkler
Winnipeg
Steinbach
Dauphin
Selkirk Portage la Prairie
Brandon

Species Maps – Dandelion
Dandelion, Taraxacum officinale*
10.1 to 20.0% 30.1 to 40.0% 50.1 to 60.0% More than 70% Absent 0.1 to 10.0% 20.1 to 30.0% 40.1 to 50.0% 60.1 to 70.0% Not Surveyed
Frequency
175
Frequency Field Uniformity Field Density (#/m2) Relative Survey Rank (%) All Occurrence All Occurrence High Abundance
1978-81 26 5.2 0.8 14.4 0.1 1.4 13.2 1.1 1986 36 2.2 0.3 15.3 < 0.1 1.4 10.2 0.5 1997 20 14.0 1.9 13.7 0.1 1.0 9.2 3.3 2002 10 21.1 3.4 16.0 0.3 1.5 20.8 7.1 2016 7 21.1 4.4 21.0 0.5 2.4 84.2 11.9
2002
1997
1986
2016
1970s
Winkler
Winnipeg
Steinbach
Dauphin
Selkirk Portage la Prairie
Brandon
* Includes red-seeded dandelion (Taraxacum erythrospermum)

Species Maps – Dock species
Dock species, Rumex spp.*
10.1 to 20.0% 30.1 to 40.0% 50.1 to 60.0% More than 70% Absent 0.1 to 10.0% 20.1 to 30.0% 40.1 to 50.0% 60.1 to 70.0% Not Surveyed
Frequency
176
Frequency Field Uniformity Field Density (#/m2) Relative Survey Rank (%) All Occurrence All Occurrence High Abundance
1978-81 85 0.2 < 0.1 14.3 < 0.1 0.6 1.2 < 0.1 1986 66 0.5 0.1 10.0 < 0.1 1.3 1.6 0.1 1997 55 0.8 < 0.1 5.0 < 0.1 0.8 1.2 0.1 2002 42 1.4 0.1 7.5 < 0.1 0.5 1.6 0.3 2016 32 3.3 0.6 16.9 0.1 1.8 8.0 1.6
2002
1997
1986
2016
1970s
Winkler
Winnipeg
Steinbach
Dauphin
Selkirk Portage la Prairie
Brandon
* Includes curled and willow-leaved dock (Rumex crispus and R. triangulivalvis)

Species Maps – False cleavers
False cleavers, Galium spurium*
10.1 to 20.0% 30.1 to 40.0% 50.1 to 60.0% More than 70% Absent 0.1 to 10.0% 20.1 to 30.0% 40.1 to 50.0% 60.1 to 70.0% Not Surveyed
Frequency
177
Frequency Field Uniformity Field Density (#/m2) Relative Survey Rank (%) All Occurrence All Occurrence High Abundance
1978-81 34 2.3 0.7 29.2 0.1 6.0 32.0 0.7 1986 21 5.6 1.7 30.1 0.4 6.3 51.4 2.2 1997 14 10.3 3.9 37.5 0.7 6.5 70.6 4.7 2002 15 10.7 2.8 26.5 0.4 4.1 40.6 5.2 2016 17 9.0 2.2 25.1 0.2 1.9 25.6 5.1
2002
1997
1986
2016
1970s
Winkler
Winnipeg
Steinbach
Dauphin
Selkirk Portage la Prairie
Brandon
* May include cleavers (Galium aparine)

Species Maps – Field horsetail
Field horsetail, Equisetum arvense
10.1 to 20.0% 30.1 to 40.0% 50.1 to 60.0% More than 70% Absent 0.1 to 10.0% 20.1 to 30.0% 40.1 to 50.0% 60.1 to 70.0% Not Surveyed
Frequency
178
Frequency Field Uniformity Field Density (#/m2) Relative Survey Rank (%) All Occurrence All Occurrence High Abundance
1978-81 18 9.3 2.1 22.6 0.5 5.5 66.4 2.6 1986 18 9.2 1.8 19.5 0.5 5.4 50.4 3.0 1997 26 5.2 0.6 11.9 0.1 2.0 6.6 1.2 2002 23 5.9 0.9 15.3 0.3 4.5 96.6 2.5 2016 21 4.3 1.0 22.5 0.3 5.9 61.2 3.5
2002
1997
1986
2016
1970s
Winkler
Winnipeg
Steinbach
Dauphin
Selkirk Portage la Prairie
Brandon
* Includes species (species and species)

Species Maps – Foxtail barley
Foxtail barley, Hordeum jubatum
10.1 to 20.0% 30.1 to 40.0% 50.1 to 60.0% More than 70% Absent 0.1 to 10.0% 20.1 to 30.0% 40.1 to 50.0% 60.1 to 70.0% Not Surveyed
Frequency
179
Frequency Field Uniformity Field Density (#/m2) Relative Survey Rank (%) All Occurrence All Occurrence High Abundance
1978-81 81 0.3 < 0.1 8.2 < 0.1 0.9 2.0 0.1 1986 54 0.9 0.1 12.1 < 0.1 2.5 10.6 0.2 1997 83 0.3 < 0.1 5.0 < 0.1 0.2 0.2 < 0.1 2002 64 0.4 0.1 13.3 < 0.1 2.0 4.6 0.1 2016 22 6.9 1.1 16.1 0.1 1.7 15.0 3.3
2002
1997
1986
2016
1970s
Winkler
Winnipeg
Steinbach
Dauphin
Selkirk Portage la Prairie
Brandon

Species Maps – Golden dock
Golden dock, Rumex fueginus
10.1 to 20.0% 30.1 to 40.0% 50.1 to 60.0% More than 70% Absent 0.1 to 10.0% 20.1 to 30.0% 40.1 to 50.0% 60.1 to 70.0% Not Surveyed
Frequency
180
Frequency Field Uniformity Field Density (#/m2) Relative Survey Rank (%) All Occurrence All Occurrence High Abundance
1978-81 - - - - - - - - 1986 - - - - - - - - 1997 - - - - - - - - 2002 - - - - - - - - 2016 26 3.3 0.8 25.4 0.1 3.9 23.8 2.3
2002
1997
1986
2016
1970s
Winkler
Winnipeg
Steinbach
Dauphin
Selkirk Portage la Prairie
Brandon

Species Maps – Green foxtail
Green foxtail, Setaria viridis
10.1 to 20.0% 30.1 to 40.0% 50.1 to 60.0% More than 70% Absent 0.1 to 10.0% 20.1 to 30.0% 40.1 to 50.0% 60.1 to 70.0% Not Surveyed
Frequency
181
Frequency Field Uniformity Field Density (#/m2) Relative Survey Rank (%) All Occurrence All Occurrence High Abundance
1978-81 1 84.7 56.8 67.1 66.1 78.0 1459.8 95.7 1986 1 78.4 46.3 59.1 25.6 32.6 743.0 74.5 1997 1 72.5 35.9 49.5 29.1 40.1 1693.2 81.2 2002 1 64.8 26.1 40.2 13.6 20.9 1070.0 69.8 2016 1 24.4 10.0 41.1 3.6 14.6 163.4 37.7
2002
1997
1986
2016
1970s
Winkler
Winnipeg
Steinbach
Dauphin
Selkirk Portage la Prairie
Brandon

Species Maps – Hemp-nettle
Hemp-nettle, Galeopsis tetrahit
10.1 to 20.0% 30.1 to 40.0% 50.1 to 60.0% More than 70% Absent 0.1 to 10.0% 20.1 to 30.0% 40.1 to 50.0% 60.1 to 70.0% Not Surveyed
Frequency
182
Frequency Field Uniformity Field Density (#/m2) Relative Survey Rank (%) All Occurrence All Occurrence High Abundance
1978-81 17 8.3 2.8 33.4 0.4 5.0 39.6 2.6 1986 14 11.6 3.2 28.0 0.5 3.9 50.4 3.9 1997 16 13.1 3.1 23.8 0.6 4.3 55.6 4.5 2002 24 7.0 1.1 16.2 0.1 1.6 10.6 2.4 2016 33 3.1 0.5 16.0 < 0.1 1.3 11.6 1.4
2002
1997
1986
2016
1970s
Winkler
Winnipeg
Steinbach
Dauphin
Selkirk Portage la Prairie
Brandon
* Includes species (species and species)

Species Maps – Kochia
Kochia, Bassia scoparia
10.1 to 20.0% 30.1 to 40.0% 50.1 to 60.0% More than 70% Absent 0.1 to 10.0% 20.1 to 30.0% 40.1 to 50.0% 60.1 to 70.0% Not Surveyed
Frequency
183
Frequency Field Uniformity Field Density (#/m2) Relative Survey Rank (%) All Occurrence All Occurrence High Abundance
1978-81 31 2.3 0.8 32.9 0.4 16.4 252.0 1.0 1986 30 3.7 0.5 13.6 0.1 2.1 18.2 0.9 1997 24 6.8 1.4 20.6 0.3 4.0 50.8 2.2 2002 17 7.2 1.3 18.1 0.4 5.8 197.0 3.4 2016 30 4.6 0.7 15.8 < 0.1 1.1 4.0 2.0
2002
1997
1986
2016
1970s
Winkler
Winnipeg
Steinbach
Dauphin
Selkirk Portage la Prairie
Brandon

Species Maps – Lamb's-quarters
Lamb's-quarters, Chenopodium album*
10.1 to 20.0% 30.1 to 40.0% 50.1 to 60.0% More than 70% Absent 0.1 to 10.0% 20.1 to 30.0% 40.1 to 50.0% 60.1 to 70.0% Not Surveyed
Frequency
184
Frequency Field Uniformity Field Density (#/m2) Relative Survey Rank (%) All Occurrence All Occurrence High Abundance
1978-81 7 36.8 9.9 26.8 1.8 5.0 460.8 10.8 1986 6 42.8 10.5 24.5 1.7 4.0 75.0 13.7 1997 9 29.9 5.8 19.5 0.8 2.5 65.0 8.7 2002 7 25.1 5.3 21.3 0.7 2.9 59.6 10.4 2016 14 15.5 3.0 19.3 0.3 2.0 43.0 8.2
2002
1997
1986
2016
1970s
Winkler
Winnipeg
Steinbach
Dauphin
Selkirk Portage la Prairie
Brandon
* Includes other goosefoot species (Chenopodium spp.)

Species Maps – Marsh yellow cress
Marsh yellow cress, Rorippa palustris
10.1 to 20.0% 30.1 to 40.0% 50.1 to 60.0% More than 70% Absent 0.1 to 10.0% 20.1 to 30.0% 40.1 to 50.0% 60.1 to 70.0% Not Surveyed
Frequency
185
Frequency Field Uniformity Field Density (#/m2) Relative Survey Rank (%) All Occurrence All Occurrence High Abundance
1978-81 72 0.3 0.1 20.4 < 0.1 2.3 4.0 0.1 1986 - - - - - - - - 1997 74 0.3 < 0.1 10.0 < 0.1 0.6 0.6 0.1 2002 - - - - - - - - 2016 36 2.7 0.5 18.2 < 0.1 1.3 4.8 1.3
2002
1997
1986
2016
1970s
Winkler
Winnipeg
Steinbach
Dauphin
Selkirk Portage la Prairie
Brandon

Species Maps – Night-flowering catchfly
Night-flowering catchfly, Silene noctiflora
10.1 to 20.0% 30.1 to 40.0% 50.1 to 60.0% More than 70% Absent 0.1 to 10.0% 20.1 to 30.0% 40.1 to 50.0% 60.1 to 70.0% Not Surveyed
Frequency
186
Frequency Field Uniformity Field Density (#/m2) Relative Survey Rank (%) All Occurrence All Occurrence High Abundance
1978-81 10 17.3 5.3 30.7 0.8 4.4 82.8 5.2 1986 13 15.9 4.9 30.7 0.7 4.5 38.0 5.7 1997 15 12.9 3.4 26.7 0.5 4.2 25.6 4.6 2002 18 9.8 1.6 16.5 0.2 1.5 11.0 3.3 2016 16 9.4 1.9 20.4 0.2 2.5 52.0 5.3
2002
1997
1986
2016
1970s
Winkler
Winnipeg
Steinbach
Dauphin
Selkirk Portage la Prairie
Brandon
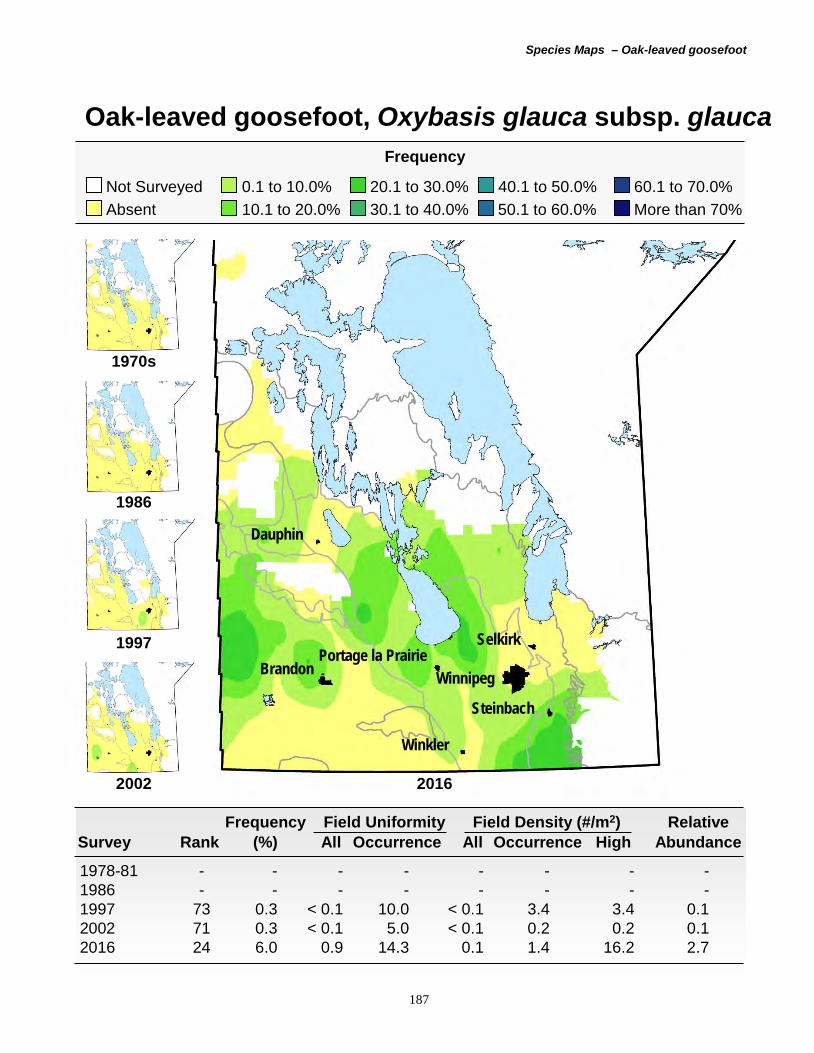
Species Maps – Oak-leaved goosefoot
Oak-leaved goosefoot, Oxybasis glauca subsp. glauca
10.1 to 20.0% 30.1 to 40.0% 50.1 to 60.0% More than 70% Absent 0.1 to 10.0% 20.1 to 30.0% 40.1 to 50.0% 60.1 to 70.0% Not Surveyed
Frequency
187
Frequency Field Uniformity Field Density (#/m2) Relative Survey Rank (%) All Occurrence All Occurrence High Abundance
1978-81 - - - - - - - - 1986 - - - - - - - - 1997 73 0.3 < 0.1 10.0 < 0.1 3.4 3.4 0.1 2002 71 0.3 < 0.1 5.0 < 0.1 0.2 0.2 0.1 2016 24 6.0 0.9 14.3 0.1 1.4 16.2 2.7
2002
1997
1986
2016
1970s
Winkler
Winnipeg
Steinbach
Dauphin
Selkirk Portage la Prairie
Brandon

Species Maps – Pale smartweed
Pale smartweed, Persicaria lapathifolia*
10.1 to 20.0% 30.1 to 40.0% 50.1 to 60.0% More than 70% Absent 0.1 to 10.0% 20.1 to 30.0% 40.1 to 50.0% 60.1 to 70.0% Not Surveyed
Frequency
188
Frequency Field Uniformity Field Density (#/m2) Relative Survey Rank (%) All Occurrence All Occurrence High Abundance
1978-81 4 44.0 15.5 35.1 4.7 10.6 228.8 16.7 1986 5 45.0 13.3 29.5 2.3 5.1 96.4 16.3 1997 7 37.1 8.0 21.7 0.9 2.5 24.8 11.3 2002 8 28.3 5.3 18.7 0.5 1.9 27.0 10.4 2016 12 17.5 3.2 18.3 0.4 2.0 24.8 9.0
2002
1997
1986
2016
1970s
Winkler
Winnipeg
Steinbach
Dauphin
Selkirk Portage la Prairie
Brandon
* Includes lady's-thumb (Persicaria maculosa )

Species Maps – Perennial sow-thistle
Perennial sow-thistle, Sonchus arvensis
10.1 to 20.0% 30.1 to 40.0% 50.1 to 60.0% More than 70% Absent 0.1 to 10.0% 20.1 to 30.0% 40.1 to 50.0% 60.1 to 70.0% Not Surveyed
Frequency
189
Frequency Field Uniformity Field Density (#/m2) Relative Survey Rank (%) All Occurrence All Occurrence High Abundance
1978-81 8 41.9 8.6 20.5 1.1 2.7 104.0 10.3 1986 11 27.1 5.1 18.7 0.7 2.4 58.2 7.3 1997 8 35.1 6.5 18.6 0.8 2.3 35.2 10.0 2002 20 12.2 1.1 9.1 0.1 0.8 6.4 3.2 2016 19 8.5 1.8 21.4 0.2 1.8 24.2 4.5
2002
1997
1986
2016
1970s
Winkler
Winnipeg
Steinbach
Dauphin
Selkirk Portage la Prairie
Brandon
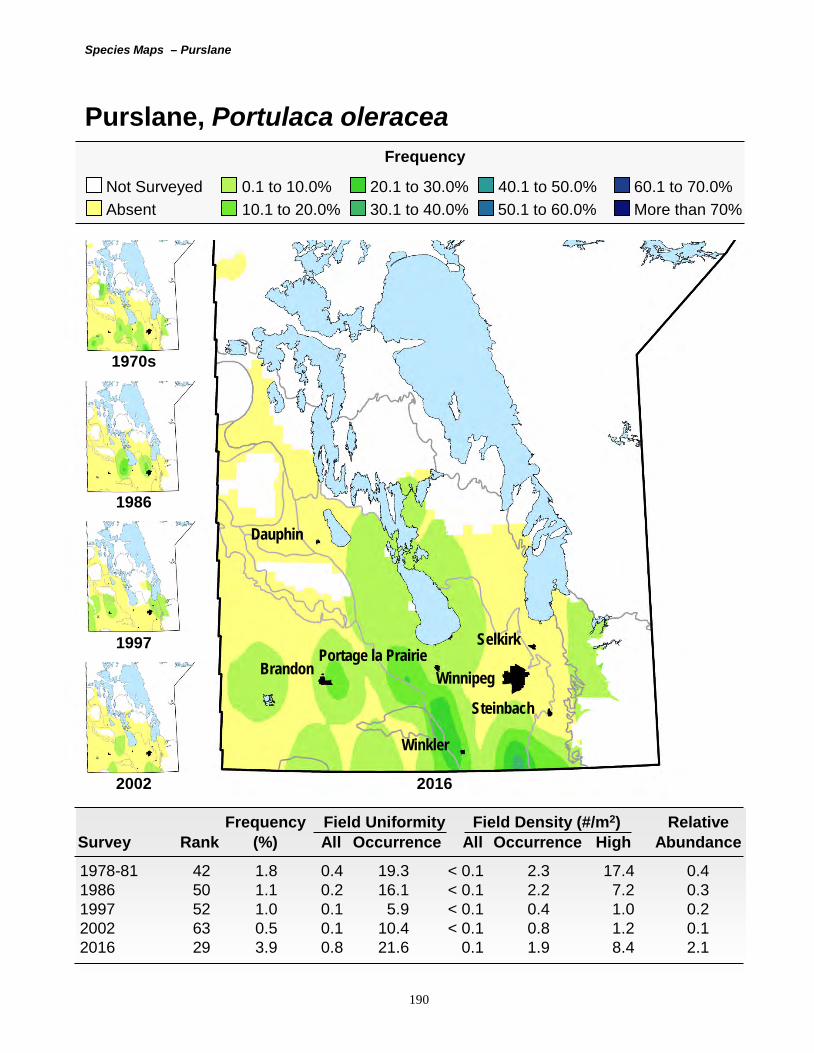
Species Maps – Purslane
Purslane, Portulaca oleracea
10.1 to 20.0% 30.1 to 40.0% 50.1 to 60.0% More than 70% Absent 0.1 to 10.0% 20.1 to 30.0% 40.1 to 50.0% 60.1 to 70.0% Not Surveyed
Frequency
190
Frequency Field Uniformity Field Density (#/m2) Relative Survey Rank (%) All Occurrence All Occurrence High Abundance
1978-81 42 1.8 0.4 19.3 < 0.1 2.3 17.4 0.4 1986 50 1.1 0.2 16.1 < 0.1 2.2 7.2 0.3 1997 52 1.0 0.1 5.9 < 0.1 0.4 1.0 0.2 2002 63 0.5 0.1 10.4 < 0.1 0.8 1.2 0.1 2016 29 3.9 0.8 21.6 0.1 1.9 8.4 2.1
2002
1997
1986
2016
1970s
Winkler
Winnipeg
Steinbach
Dauphin
Selkirk Portage la Prairie
Brandon

Species Maps – Redroot pigweed
Redroot pigweed, Amaranthus retroflexus
10.1 to 20.0% 30.1 to 40.0% 50.1 to 60.0% More than 70% Absent 0.1 to 10.0% 20.1 to 30.0% 40.1 to 50.0% 60.1 to 70.0% Not Surveyed
Frequency
191
Frequency Field Uniformity Field Density (#/m2) Relative Survey Rank (%) All Occurrence All Occurrence High Abundance
1978-81 9 38.3 8.4 21.9 1.2 3.2 77.6 9.8 1986 8 40.0 9.7 24.1 1.6 4.0 86.8 12.8 1997 5 39.8 9.5 23.9 1.6 4.0 63.8 13.6 2002 6 28.6 6.1 21.3 1.0 3.5 48.2 12.3 2016 8 20.9 4.5 21.7 0.4 2.1 22.2 11.6
2002
1997
1986
2016
1970s
Winkler
Winnipeg
Steinbach
Dauphin
Selkirk Portage la Prairie
Brandon

Species Maps – Round-leaved mallow
Round-leaved mallow, Malva pusilla
10.1 to 20.0% 30.1 to 40.0% 50.1 to 60.0% More than 70% Absent 0.1 to 10.0% 20.1 to 30.0% 40.1 to 50.0% 60.1 to 70.0% Not Surveyed
Frequency
192
Frequency Field Uniformity Field Density (#/m2) Relative Survey Rank (%) All Occurrence All Occurrence High Abundance
1978-81 25 5.4 0.9 16.5 0.1 1.8 10.6 1.2 1986 23 5.7 1.4 23.9 0.3 4.6 43.0 1.9 1997 21 13.4 1.8 13.7 0.2 1.2 11.4 3.2 2002 16 11.4 2.0 17.9 0.2 1.6 13.0 4.0 2016 10 20.1 4.1 20.1 0.3 1.7 17.4 10.3
2002
1997
1986
2016
1970s
Winkler
Winnipeg
Steinbach
Dauphin
Selkirk Portage la Prairie
Brandon
* Includes common mallow (Malva neglecta )

Species Maps – Shepherd's-purse
Shepherd's-purse, Capsella bursa-pastoris
10.1 to 20.0% 30.1 to 40.0% 50.1 to 60.0% More than 70% Absent 0.1 to 10.0% 20.1 to 30.0% 40.1 to 50.0% 60.1 to 70.0% Not Surveyed
Frequency
193
Frequency Field Uniformity Field Density (#/m2) Relative Survey Rank (%) All Occurrence All Occurrence High Abundance
1978-81 21 7.7 1.7 22.3 0.3 3.4 49.8 2.0 1986 17 8.7 1.7 19.8 0.8 9.0 231.0 3.3 1997 13 12.9 3.2 24.7 0.7 5.4 66.0 4.8 2002 27 5.3 0.6 12.2 0.1 1.3 8.4 1.6 2016 27 5.4 0.7 13.9 < 0.1 0.9 11.6 2.2
2002
1997
1986
2016
1970s
Winkler
Winnipeg
Steinbach
Dauphin
Selkirk Portage la Prairie
Brandon

Species Maps – Spiny annual sow-thistle
Spiny annual sow-thistle, Sonchus asper
10.1 to 20.0% 30.1 to 40.0% 50.1 to 60.0% More than 70% Absent 0.1 to 10.0% 20.1 to 30.0% 40.1 to 50.0% 60.1 to 70.0% Not Surveyed
Frequency
194
Frequency Field Uniformity Field Density (#/m2) Relative Survey Rank (%) All Occurrence All Occurrence High Abundance
1978-81 77 0.2 0.1 45.0 < 0.1 4.9 6.8 0.1 1986 74 0.3 < 0.1 10.6 < 0.1 0.8 1.0 0.1 1997 36 2.0 0.4 17.3 < 0.1 1.3 5.0 0.5 2002 14 17.5 2.4 13.5 0.2 1.1 11.4 5.3 2016 15 11.1 2.6 23.7 0.2 2.0 17.0 6.3
2002
1997
1986
2016
1970s
Winkler
Winnipeg
Steinbach
Dauphin
Selkirk Portage la Prairie
Brandon

Species Maps – Stinkweed
Stinkweed, Thlaspi arvense
10.1 to 20.0% 30.1 to 40.0% 50.1 to 60.0% More than 70% Absent 0.1 to 10.0% 20.1 to 30.0% 40.1 to 50.0% 60.1 to 70.0% Not Surveyed
Frequency
195
Frequency Field Uniformity Field Density (#/m2) Relative Survey Rank (%) All Occurrence All Occurrence High Abundance
1978-81 11 20.9 4.0 19.2 0.6 2.9 105.0 5.1 1986 10 27.9 6.4 22.8 1.3 4.5 113.4 9.0 1997 17 13.4 2.4 17.9 0.3 2.5 21.0 3.8 2002 19 8.7 1.3 15.3 0.3 3.1 74.2 3.3 2016 34 2.7 0.5 17.8 0.1 2.0 15.6 1.4
2002
1997
1986
2016
1970s
Winkler
Winnipeg
Steinbach
Dauphin
Selkirk Portage la Prairie
Brandon

Species Maps – Thyme-leaved spurge
Thyme-leaved spurge, Euphorbia serpillifolia
10.1 to 20.0% 30.1 to 40.0% 50.1 to 60.0% More than 70% Absent 0.1 to 10.0% 20.1 to 30.0% 40.1 to 50.0% 60.1 to 70.0% Not Surveyed
Frequency
196
Frequency Field Uniformity Field Density (#/m2) Relative Survey Rank (%) All Occurrence All Occurrence High Abundance
1978-81 19 8.1 2.2 27.4 0.3 3.6 66.4 2.3 1986 26 5.4 1.3 24.2 0.2 3.2 31.0 1.7 1997 23 9.2 2.1 22.2 0.2 2.2 17.6 2.8 2002 21 7.3 1.6 21.7 0.2 2.2 14.4 2.9 2016 28 5.2 0.7 13.5 0.1 1.1 32.0 2.1
2002
1997
1986
2016
1970s
Winkler
Winnipeg
Steinbach
Dauphin
Selkirk Portage la Prairie
Brandon
* May include ridge-seeded spurge (Euphorbia glyptosperma )

Species Maps – Western barnyard grass
Western barnyard grass, Echinochloa muricata*
10.1 to 20.0% 30.1 to 40.0% 50.1 to 60.0% More than 70% Absent 0.1 to 10.0% 20.1 to 30.0% 40.1 to 50.0% 60.1 to 70.0% Not Surveyed
Frequency
197
2016
Winkler
Winnipeg
Steinbach
Dauphin
Selkirk Portage la Prairie
Brandon
*See barnyard grass species for previous survey maps

Species Maps – Wheat
Wheat, Triticum aestivum*
10.1 to 20.0% 30.1 to 40.0% 50.1 to 60.0% More than 70% Absent 0.1 to 10.0% 20.1 to 30.0% 40.1 to 50.0% 60.1 to 70.0% Not Surveyed
Frequency
198
Frequency Field Uniformity Field Density (#/m2) Relative Survey Rank (%) All Occurrence All Occurrence High Abundance
1978-81 14 14.7 3.7 25.4 0.4 3.0 61.4 4.0 1986 13 16.7 5.1 30.8 0.8 5.1 34.0 6.2 1997 13 18.2 4.0 21.8 0.5 2.6 18.0 5.9 2002 9 24.9 4.7 18.7 0.5 2.1 21.0 9.0 2016 5 20.8 6.1 29.4 0.8 3.7 39.4 15.0
2002
1997
1986
2016
1970s
Winkler
Winnipeg
Steinbach
Dauphin
Selkirk Portage la Prairie
Brandon
* Data only includes fields not seeded to wheat

Species Maps – Wild buckwheat
Wild buckwheat, Fallopia convolvulus
10.1 to 20.0% 30.1 to 40.0% 50.1 to 60.0% More than 70% Absent 0.1 to 10.0% 20.1 to 30.0% 40.1 to 50.0% 60.1 to 70.0% Not Surveyed
Frequency
199
Frequency Field Uniformity Field Density (#/m2) Relative Survey Rank (%) All Occurrence All Occurrence High Abundance
1978-81 3 78.1 34.2 43.8 5.7 7.3 288.8 30.0 1986 3 70.6 26.3 37.3 3.6 5.0 69.6 28.0 1997 3 68.3 24.2 35.5 2.7 3.9 41.0 27.5 2002 3 58.5 15.6 26.7 1.7 2.9 80.6 26.6 2016 2 52.7 13.1 24.8 1.0 2.0 55.2 30.3
2002
1997
1986
2016
1970s
Winkler
Winnipeg
Steinbach
Dauphin
Selkirk Portage la Prairie
Brandon
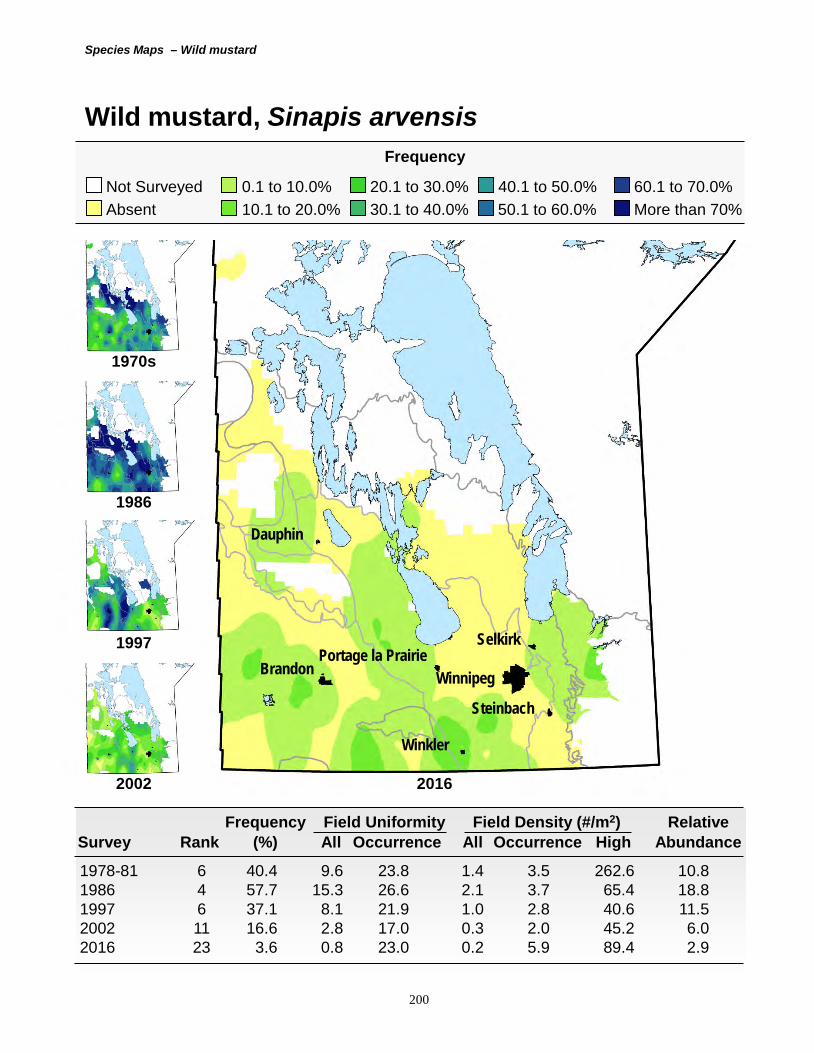
Species Maps – Wild mustard
Wild mustard, Sinapis arvensis
10.1 to 20.0% 30.1 to 40.0% 50.1 to 60.0% More than 70% Absent 0.1 to 10.0% 20.1 to 30.0% 40.1 to 50.0% 60.1 to 70.0% Not Surveyed
Frequency
200
Frequency Field Uniformity Field Density (#/m2) Relative Survey Rank (%) All Occurrence All Occurrence High Abundance
1978-81 6 40.4 9.6 23.8 1.4 3.5 262.6 10.8 1986 4 57.7 15.3 26.6 2.1 3.7 65.4 18.8 1997 6 37.1 8.1 21.9 1.0 2.8 40.6 11.5 2002 11 16.6 2.8 17.0 0.3 2.0 45.2 6.0 2016 23 3.6 0.8 23.0 0.2 5.9 89.4 2.9
2002
1997
1986
2016
1970s
Winkler
Winnipeg
Steinbach
Dauphin
Selkirk Portage la Prairie
Brandon

Species Maps – Wild oats
Wild oats, Avena fatua
10.1 to 20.0% 30.1 to 40.0% 50.1 to 60.0% More than 70% Absent 0.1 to 10.0% 20.1 to 30.0% 40.1 to 50.0% 60.1 to 70.0% Not Surveyed
Frequency
201
Frequency Field Uniformity Field Density (#/m2) Relative Survey Rank (%) All Occurrence All Occurrence High Abundance
1978-81 2 73.8 32.5 44.1 13.0 17.6 629.8 35.4 1986 2 63.4 22.0 34.6 6.5 10.3 342.2 29.8 1997 2 64.4 22.5 34.9 6.6 10.2 167.6 32.9 2002 2 56.1 19.7 35.1 6.7 11.9 449.8 43.6 2016 4 20.7 5.6 26.8 0.9 4.4 69.6 15.6
2002
1997
1986
2016
1970s
Winkler
Winnipeg
Steinbach
Dauphin
Selkirk Portage la Prairie
Brandon

Species Maps – Yellow foxtail
Yellow foxtail, Setaria pumila
10.1 to 20.0% 30.1 to 40.0% 50.1 to 60.0% More than 70% Absent 0.1 to 10.0% 20.1 to 30.0% 40.1 to 50.0% 60.1 to 70.0% Not Surveyed
Frequency
202
Frequency Field Uniformity Field Density (#/m2) Relative Survey Rank (%) All Occurrence All Occurrence High Abundance
1978-81 48 0.6 0.2 40.2 0.2 33.7 157.0 0.4 1986 40 1.3 0.3 25.7 < 0.1 3.8 10.0 0.4 1997 27 4.2 0.6 13.9 0.1 2.6 11.6 1.1 2002 30 2.2 0.3 16.0 0.1 4.6 28.6 0.9 2016 6 11.2 3.9 35.2 1.2 10.6 82.8 13.8
2002
1997
1986
2016
1970s
Winkler
Winnipeg
Steinbach
Dauphin
Selkirk Portage la Prairie
Brandon

Species Maps – Yellow sweet-clover
Yellow sweet-clover, Melilotus officinalis*
10.1 to 20.0% 30.1 to 40.0% 50.1 to 60.0% More than 70% Absent 0.1 to 10.0% 20.1 to 30.0% 40.1 to 50.0% 60.1 to 70.0% Not Surveyed
Frequency
203
Frequency Field Uniformity Field Density (#/m2) Relative Survey Rank (%) All Occurrence All Occurrence High Abundance
1978-81 36 2.5 0.5 19.7 0.1 3.5 58.2 0.6 1986 44 1.6 0.2 15.4 < 0.1 0.8 5.2 0.4 1997 61 0.4 0.1 21.4 < 0.1 1.3 2.2 0.1 2002 47 0.7 0.2 22.3 < 0.1 2.1 5.8 0.3 2016 37 2.6 0.5 17.6 < 0.1 1.1 3.0 1.2
2002
1997
1986
2016
1970s
Winkler
Winnipeg
Steinbach
Dauphin
Selkirk Portage la Prairie
Brandon
* Includes white sweet-clover (Melilotus albus )