mandible shape modeling using the second eigenfunction · pdf filemandible shape modeling...
TRANSCRIPT

Mandible shape modeling using the secondeigenfunction of the Laplace-Beltrami operator
Seongho Seoa, Moo K. Chungabcd, Brian J. Whymsd, and Houri K. Vorperiand
aDepartment of Brain and Cognitive Sciences, Seoul National University, KoreabDepartment of Biostatistics and Medical Informatics,cWaisman Laboratory for Brain Imaging and Behavior,dVocal Tract Development Laboratory, Waisman Center,
University of Wisconsin, Madison, WI, USA.
ABSTRACT
The second Laplace-Beltrami eigenfunction provides an intrinsic geometric way of establishing natural coordi-nates for elongated 3D anatomical structures obtained from medical images. The approach is used to establishthe centerline of the human mandible from CT and provides automated anatomical landmarks across subjects.These landmarks are then used to quantify the growth pattern of the mandible between ages 0 and 20.
Keywords: centerline, heat kernel smoothing, Laplace-Beltrami eigenfunction, mandible growth, morphometry
1. INTRODUCTION
The skull consists of the craniofacial complex and the mandible. The craniofacial complex includes the craniumand the face. Although the cranium and the face are closely located anatomically, they have different growthpatterns.1 The cranium follows a neural growth pattern where it is considered to be very close to its mature sizeby about the age of six years. The face, on the other hand, specifically the middle and lower anterior regions ofthe face (eyes to chin), follows the general somatic or skeletal growth curve and continues to grow till about age18 years. The growth of the mandible, a U-shaped bone (superior view) that forms the lower jaw, contributesto the maturation of the face. It consists of a body and a pair of rami that articulate with the cranium at thetemporomandibular joints. So, while its vertical growth appears to follow a somatic or skeletal growth pattern,its lateral growth is expected to follow more of a neural growth pattern particularly at the condylar level (level oftemporomandibular joint) but not necessarily at the lingual (tongue) level. The growth of the human mandiblehas been characterized to consist of a general increase in size as well as remodeling where there is simultaneousgrowth forward and downward,2–4 and also bilateral growth.5 The mandible is a moving bone, and its growth andremodeling is dependent on the growth and biomechanical forces of all other component structures (bony and softtissue structures) in the craniofacial complex. Thus the purpose of this paper is to quantitatively characterizethe 3D growth of the mandible while accounting for the gender difference using an intrinsic geometric approach.
For a 3D growth pattern analysis of the mandible, it is desirable to represent mandibular shape in a conciseform while preserving essential shape properties. As 3D models become common in many disciplines, curveskeleton or centerline has been developed for a wide range of applications, since it captures the essential topologyof a 3D object as a 1D representation.6 Recently, several methods based on Reeb graphs have been developedto extract the centerline.6–10 The Reeb graph captures the topology of an arbitrary manifold by describing theconnectivity of the level sets of a function defined on the manifold. Various functions can be used in obtainingReeb graphs. For instance, a surface coordinate function8,9 leads to a centerline dependent on orientation.6 Onepromising choice is the second eigenfunction of Laplace-Beltrami operator, since its Reeb graph is pose-invariant.Motivated by this property, Shi et al.10 proposed to use Reeb graph of the second eigenfunction for an extractionof the skeleton from a simply connected 2D surface patch.
Send correspondence to Moo K. Chung. 1500 Highland Ave. Madison, WI. 53705. USA. Moo K. Chung: E-mail:[email protected].
Medical Imaging 2011: Image Processing, edited by Benoit M. Dawant, David R. Haynor, Proc. of SPIE Vol. 7962, 79620Z · © 2011 SPIE · CCC code: 1605-7422/11/$18 · doi: 10.1117/12.877537
Proc. of SPIE Vol. 7962 79620Z-1
Downloaded from SPIE Digital Library on 22 Apr 2011 to 108.77.59.121. Terms of Use: http://spiedl.org/terms

Figure 1. The second eigenfunction ψ1 for different mandibles. ψ1 for an elongated object is a smooth monotonicfunction increasing from one part of the symmetry to the other part. The surfaces are colored according to the value ofeigenfunctions.
In this paper, we propose to extract the centerline of 3D mandible using the level sets of the second eigenfunc-tion of the Laplace-Beltrami operator. We then apply the extracted centerline shape to characterize the growthpattern of the mandible. The paper is organized as follows. We first describe our image data for the study ofmandibular growth pattern in Sec. 2. Then we introduce eigenfunctions of Laplace-Beltrami operator in Sec. 3,emphasizing the geometrical advantage of the second eigenfunction. In Sec. 4, we describe in detail our centerlineextraction approach based on the second eigenfunction and use the resulting centerline as anatomical landmarksto quantify mandibular shape. Finally in Sec. 5, we apply this proposed framework to model mandibular growth.
2. IMAGE ACQUISITION AND PREPROCESSING
Our imaging data set consists of 76 mandibles (40 male mandibles, and 36 female mandibles). The age distributionwas 11.33 ± 5.60 years for the female group, and 9.54 ± 5.71 years for the male group. The CT images wereobtained using several different models of GE multi-slice helical CT scanners. The CT scans were acquireddirectly in the axial plane with 13–25 cm field of view (FOV), a matrix size of 512×512, and an image resolutionin the range of 0.25 to 0.49 mm. Next, the CT images were converted to DICOM format and the biomedicalimaging software Analyze 8.1 (AnalyzeDirect, Inc., Overland Park, KS) was used to segment binary mandibularstructure by thresholding the image intensity.
By checking the Euler characteristic, holes in the mandible images were first automatically filled up usingmorphological operations to make the mandible binary volume topologically equivalent to a solid sphere. Then,the hole-filled images were converted to surface meshes via the marching cubes algorithm. Lastly, the surfacemeshes are aligned to a randomly selected subject using rigid-body registration.
3. EIGENFUNCTIONS OF LAPLACE-BELTRAMI OPERATOR
Eigenfunctions ψj of Laplace-Beltrami operator ΔM on an arbitrary anatomical manifold M satisfy
ΔMψj = −λψj, (1)
and form an orthonormal basis for the space of square integrable functions defined on the manifold.11,12 Weorder the eigenfunctions ψ0, ψ1, ψ2, · · · corresponding to the increasing order of eigenvalues
0 = λ0 < λ1 ≤ λ2 ≤ · · · .
Since the closed form expression for the Laplace-Beltrami eigenfunctions on an arbitrary surface is unknown,we need to numerically compute the eigenfunctions. Using the cotan formulation,13–15 (1) is simplified as thegeneralized eigenvalue problem:
Cψ = λAψ, (2)
where C is the stiffness matrix, A is the mass matrix, and ψ is the unknown eigenfunction evaluated at meshvertices. Because C and A are large sparse matrices, we solved (2) using the Implicitly Restarted Arnoldi
Proc. of SPIE Vol. 7962 79620Z-2
Downloaded from SPIE Digital Library on 22 Apr 2011 to 108.77.59.121. Terms of Use: http://spiedl.org/terms

Figure 2. The centerline of a mandible surface with different number of level bands k: 50, 100, 200 and 300. As k isincreased, the centerline introduces more noise.
Method16,17 without consuming large amount of memory and time for zero entries. The MATLAB code can beobtained from http://brainimaging.waisman.wisc.edu/~chung/lb.
Given that these eigenfunctions provide geometric and topological information of the manifold, they havebeen utilized to handle various types of problems.11 Qiu et al.14 constructed splines on a manifold using theLaplace-Beltrami eigenfunctions, while Seo et al.15 proposed a different smoothing framework where heat kernelsmoothing is analytically represented as a series expansion of the eigenfunctions. Dong et al.18 proposed aquadrangular re-meshing method based on the eigenfunction.
The second eigenfunction ψ1 exhibits an interesting characteristic that can be used to establish the intrinsiccoordinate system for elongated tubular structures like the hippocampus or the bundle of white matter fibertracts. The maximum and the minimum of ψ1 usually occurs at the two extremes of an elongated object (Fig.1). So the gradient of the second eigenfunction follows the shape of elongated objects.11 This is related to thehot spots conjecture of J. Rauch.19 Therefore, the second eigenfunction provides an intrinsic geometric wayof establishing natural coordinates for elongated objects. Note that the second eigenfunction is similar to aharmonic map obtained by solving a Laplace equation with the Dirichlet boundary condition on its surface,an approach that has been used for surface parametrization.20,21 However, the second eigenfunction approachavoids the pole selection step which is required in constructing the harmonic map.
4. CENTERLINE OF MANDIBLE
Image acquisition, preprocessing and surface mesh construction introduce geometric noise to the mesh coordi-nates. To reduce mesh noise, we applied heat kernel smoothing15 with σ = 0.5 to all 76 mandibular surfaces.The heat kernel smoothing was done as a weighted series expansion involving the eigenfunctions of the Laplace-Beltraimi operator. The Fourier coefficients for the finite expansion of heat kernel smoothing were estimatedusing the least-squares method. The degree of expansion was fixed at 230. Subsequently we obtained the secondeigenfunction ψ1 of Laplace-Beltrami operator Δ
˜M on the smoothed mandible surface ˜M. Fig. 1 shows thesecond eigenfunctions for different mandibles which are smooth monotonic functions. The level contours of thesecond eigenfunctions line up along the direction of elongation.
The mandible centerline was obtained by connecting the centroids of the successive level contours of thesecond eigenfunction ψ1.
7,10 The centroids were computed as the average of all points p at the same levelcontour ψ(p) = c for some fixed c. Due to the discrete nature of mesh coordinates, stable results were difficultto obtain by simply averaging the points along the level contours. We therefore opted to average all points p inthe same level band given by
c− ε ≤ ψ(p) ≤ c+ ε for small ε. (3)
Fig. 2 shows the resulting centerline of a mandible surface for a various number of bands k. We fixed k to be 100for all mandibles, because as k was increased, the centerline fluctuated more rapidly introducing noise. Even for
Proc. of SPIE Vol. 7962 79620Z-3
Downloaded from SPIE Digital Library on 22 Apr 2011 to 108.77.59.121. Terms of Use: http://spiedl.org/terms

(a) (b)Figure 3. (a) From the centerline model, we obtain the angle θc between two tips p1 and pn of condylar processes, whichare the end points of the centerline, and the the center of the symmetry pc, which is obtained as the point with thesmallest z coordinate value. (b) Centerlines of all subjects (female = red, male = blue). Each centerline was extractedfrom k = 100 level bands and further smoothed using the 29-th degree cosine series representation.
k = 100, we still observe sharp corners and zig-zag pattern. To smooth out the centerline, we used the cosineseries representation.22 By representing the coordinates as linear combinations of smooth basis functions, thecosine representation enabled us to get more smooth centerline by reducing the fluctuations. The cosine seriesrepresentation of all subjects are shown in Fig. 3b. The MATLAB implementation of the cosine series representationis given at http://brainimaging.waisman.wisc.edu/~chung/tracts.
To quantify mandibular growth, we used two morphometric measures: length lc of the mandible and angleθc between the two condylar processes p1 and pn, and the center of symmetry pc (Fig. 3a). The length lc is thetotal arc-length of the centerline between the tips of condylar processes p1 and pn and it is approximated as
lc =
n∑
i=2
‖pi − pi−1, ‖, (4)
where pi are the average of all points along the i-th level band. The angle θc was computed using the formula:
θc = cos−1 〈p1 − pc, pn − pc〉‖p1 − pc‖‖pn − pc‖ , (5)
and given in terms of degree (◦).
5. MANDIBLE GROWTH MODEL
To analyze the development of the mandible in terms of mandibular condylar length and angle, we first measuredlc and θc from the centerline model. The length distribution was 77.33±10.82 mm for females and 75.71±11.70mm for males (Fig. 4a). The angle was 77.40± 1.54◦ for females, and 77.74± 1.51◦ for males (Fig. 4b) . Then,we fitted a linear growth model of the form
length, angle = β0 + β1 gender+ β2 age+ β3 gender · age+ ε,
Proc. of SPIE Vol. 7962 79620Z-4
Downloaded from SPIE Digital Library on 22 Apr 2011 to 108.77.59.121. Terms of Use: http://spiedl.org/terms
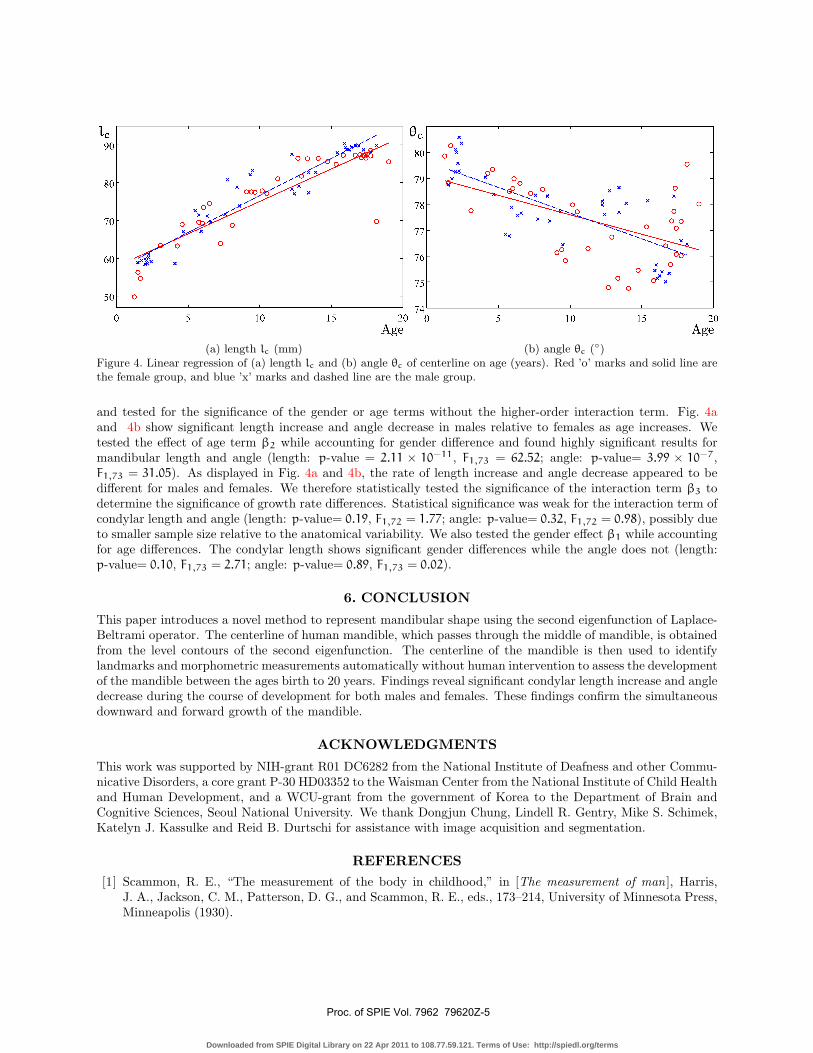
(a) length lc (mm) (b) angle θc (◦)Figure 4. Linear regression of (a) length lc and (b) angle θc of centerline on age (years). Red ’o’ marks and solid line arethe female group, and blue ’x’ marks and dashed line are the male group.
and tested for the significance of the gender or age terms without the higher-order interaction term. Fig. 4aand 4b show significant length increase and angle decrease in males relative to females as age increases. Wetested the effect of age term β2 while accounting for gender difference and found highly significant results formandibular length and angle (length: p-value = 2.11 × 10⁻¹¹, F1,73 = 62.52; angle: p-value= 3.99 × 10⁻⁷,F1,73 = 31.05). As displayed in Fig. 4a and 4b, the rate of length increase and angle decrease appeared to bedifferent for males and females. We therefore statistically tested the significance of the interaction term β3 todetermine the significance of growth rate differences. Statistical significance was weak for the interaction term ofcondylar length and angle (length: p-value= 0.19, F1,72 = 1.77; angle: p-value= 0.32, F1,72 = 0.98), possibly dueto smaller sample size relative to the anatomical variability. We also tested the gender effect β1 while accountingfor age differences. The condylar length shows significant gender differences while the angle does not (length:p-value= 0.10, F1,73 = 2.71; angle: p-value= 0.89, F1,73 = 0.02).
6. CONCLUSION
This paper introduces a novel method to represent mandibular shape using the second eigenfunction of Laplace-Beltrami operator. The centerline of human mandible, which passes through the middle of mandible, is obtainedfrom the level contours of the second eigenfunction. The centerline of the mandible is then used to identifylandmarks and morphometric measurements automatically without human intervention to assess the developmentof the mandible between the ages birth to 20 years. Findings reveal significant condylar length increase and angledecrease during the course of development for both males and females. These findings confirm the simultaneousdownward and forward growth of the mandible.
ACKNOWLEDGMENTS
This work was supported by NIH-grant R01 DC6282 from the National Institute of Deafness and other Commu-nicative Disorders, a core grant P-30 HD03352 to the Waisman Center from the National Institute of Child Healthand Human Development, and a WCU-grant from the government of Korea to the Department of Brain andCognitive Sciences, Seoul National University. We thank Dongjun Chung, Lindell R. Gentry, Mike S. Schimek,Katelyn J. Kassulke and Reid B. Durtschi for assistance with image acquisition and segmentation.
REFERENCES
[1] Scammon, R. E., “The measurement of the body in childhood,” in [The measurement of man ], Harris,J. A., Jackson, C. M., Patterson, D. G., and Scammon, R. E., eds., 173–214, University of Minnesota Press,Minneapolis (1930).
Proc. of SPIE Vol. 7962 79620Z-5
Downloaded from SPIE Digital Library on 22 Apr 2011 to 108.77.59.121. Terms of Use: http://spiedl.org/terms

[2] Scott, J. H., [Dento-facial Development and Growth ], Pergamon Press, Oxford (1976).
[3] Smartt Jr., J. M., Low, D. W., and Bartlett, S. P., “The pediatric mandible: I. A primer on growth anddevelopment,” Plast. Reconstr. Surg. 116, 14e–23e (July 2005).
[4] Walker, G. F. and Kowalski, C. J., “On the growth of the mandible,” American Journal of Physical An-thropology 36, 111–118 (January 1972).
[5] Enlow, D. H. and Hans, M. G., [Essentials of Facial Growth ], W.B. Saunders Company, Philadelphia (1996).
[6] Cornea, N. D., Silver, D., and Min, P., “Curve-skeleton properties, applications, and algorithms,” IEEETransactions on Visualization and Computer Graphics 13(3), 530–548 (2007).
[7] Lazarus, F. and Verroust, A., “Level set diagrams of polyhedral objects,” in [Proceedings of the fifth ACMsymposium on Solid modeling and applications ], 130–140 (1999).
[8] Xiao, Y., Siebert, P., and Werghi, N., “A discrete Reeb graph approach for the segmentation of human bodyscans,” in [Fourth International Conference on 3-D Digital Imaging and Modeling ], 378–385 (2003).
[9] Attene, M., Biasotti, S., and Spagnuolo, M., “Shape understanding by contour-driven retiling,” The VisualComputer 19(2), 127–138 (2003).
[10] Shi, Y., Lai, R., Krishna, S., Sicotte, N., Dinov, I., and Toga, A. W., “Anisotropic Laplace-Beltramieigenmaps: Bridging Reeb graphs and skeletons,” in [Proceedings of Mathematical Methods in BiomedicalImage Analysis (MMBIA) ], 1–7 (2008).
[11] Levy, B., “Laplace-Beltrami Eigenfunctions: Towards an Algorithm that Understands Geometry,” in [IEEEInternational Conference on Shape Modeling and Applications ], 13 (2006).
[12] Rosenberg, S., [The Laplacian on a Riemannian Manifold ], Cambridge University Press (1997).
[13] Chung, M. K., Statistical Morphometry in Neuroanatomy, PhD thesis, McGill University (2001).
[14] Qiu, A., Bitouk, D., and Miller, M. I., “Smooth functional and structural maps on the neocortex viaorthonormal bases of the Laplace-Beltrami operator,” IEEE Transactions on Medical Imaging 25, 1296–1306 (2006).
[15] Seo, S., Chung, M., and Vorperian, H., “Heat kernel smothing using Laplace-Beltrami eigenfunctions,” in[Medical Image Computing and Computer-Assisted Intervention – MICCAI 2010 ], Lecture Notes in Com-puter Science 6363, 505–512 (2010).
[16] Hernandez, V., Roman, J. E., Tomas, A., and Vidal, V., “A survey of software for sparse eigen-value problems,” Tech. Rep. STR-6, Universidad Politecnica de Valencia (2006). Available athttp://www.grycap.upv.es/slepc.
[17] Lehoucq, R., Sorensen, D., and Yang, C., [ARPACK Users’ Guide: Solution of Large-Scale EigenvalueProblems with Implicitly Restarted Arnoldi Methods ], SIAM Publications, Philadelphia (1998).
[18] Dong, S., Bremer, P.-T., Garland, M., Pascucci, V., and Hart, J. C., “Quadrangulating a mesh usingLaplacian eigenvectors,” Tech. Rep. UIUCDCS-R-2005-2583, Department of Computer Science, Universityof Illinois at Urbana-Champaign (June 2005).
[19] Banuelos, R. and Burdzy, K., “On the Hot Spots Conjecture of J Rauch,” Journal of Functional Analy-sis 164, 1–33 (1999).
[20] Brechbuhler, C., Gerig, G., and Kubler, O., “Parametrization of closed surfaces for 3-D shape description,”Computer Vision and Image Understanding 61, 154–170 (1995).
[21] Zhu, L. and Jiang, T., “Parameterization of 3D brain structures for statistical shape analysis,” in [MedicalImaging 2004: Image Processing ], Proc. SPIE 5370, 1254–1261 (2004).
[22] Chung, M. K., Adluru, N., Lee, J. E., Lazar, M., Lainhart, J. E., and Alexander, A. L., “Cosine seriesrepresentation of 3D curves and its application to white matter fiber bundles in diffusion tensor imaging,”Statistics and Its Interface 3, 69–80 (2010).
Proc. of SPIE Vol. 7962 79620Z-6
Downloaded from SPIE Digital Library on 22 Apr 2011 to 108.77.59.121. Terms of Use: http://spiedl.org/terms