manav vikas mission- bihar 2013-2017 - home - igc · manav vikas mission- bihar 2013-17 and...
TRANSCRIPT
MANAV VIKAS MISSION- BIHAR 2013-17 and 2017-2022
(Population, Health, Malnutrition related issues)
HEALTH SECTOR VISION & COMMITMENT Mission statement:
Bihar Health, Population and Nutrition Sector will compliment the Manav Vikas Mission Goals by
• Identifying and providing solutions for implementation bottlenecks, • Introducing out of the box interventions and processes for better
outcomes • Fast tracking of development of infrastructure and human resources • Coordinating for improved intersectoral convergence • Partnering with communities and strengthening community systems • Optimal utilization of available resources
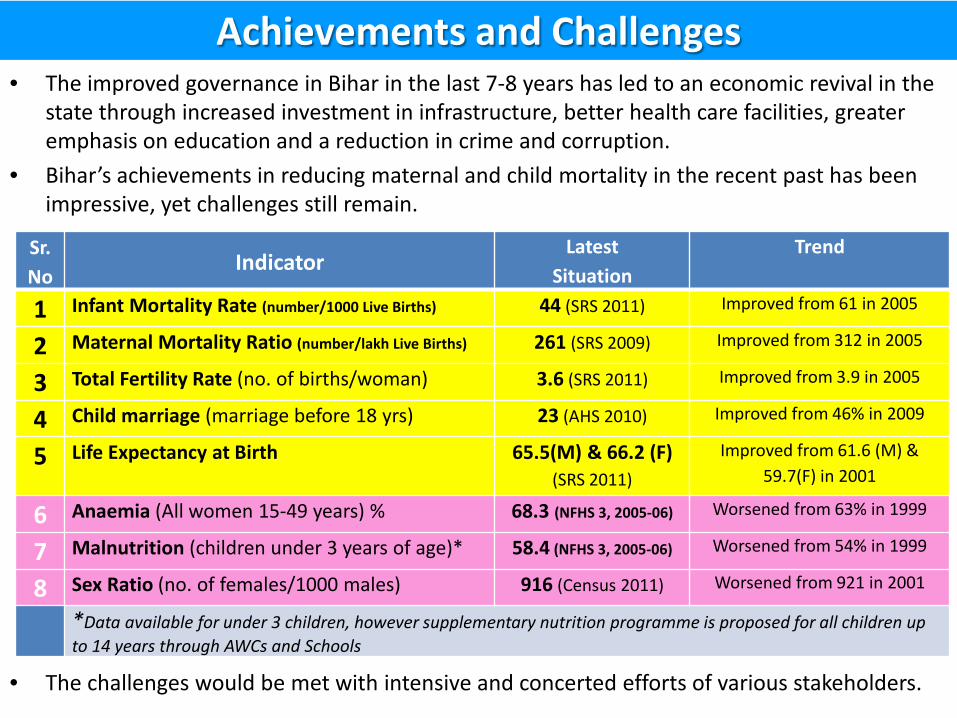
Achievements and Challenges • The improved governance in Bihar in the last 7-8 years has led to an economic revival in the
state through increased investment in infrastructure, better health care facilities, greater emphasis on education and a reduction in crime and corruption.
• Bihar’s achievements in reducing maternal and child mortality in the recent past has been impressive, yet challenges still remain.
• The challenges would be met with intensive and concerted efforts of various stakeholders.
Sr. No
Indicator Latest
Situation Trend
1 Infant Mortality Rate (number/1000 Live Births) 44 (SRS 2011) Improved from 61 in 2005
2 Maternal Mortality Ratio (number/lakh Live Births) 261 (SRS 2009) Improved from 312 in 2005
3 Total Fertility Rate (no. of births/woman) 3.6 (SRS 2011) Improved from 3.9 in 2005
4 Child marriage (marriage before 18 yrs) 23 (AHS 2010) Improved from 46% in 2009
5 Life Expectancy at Birth 65.5(M) & 66.2 (F) (SRS 2011)
Improved from 61.6 (M) & 59.7(F) in 2001
6 Anaemia (All women 15-49 years) % 68.3 (NFHS 3, 2005-06) Worsened from 63% in 1999
7 Malnutrition (children under 3 years of age)* 58.4 (NFHS 3, 2005-06) Worsened from 54% in 1999
8 Sex Ratio (no. of females/1000 males) 916 (Census 2011) Worsened from 921 in 2001
*Data available for under 3 children, however supplementary nutrition programme is proposed for all children up to 14 years through AWCs and Schools

Health, Population and Nutrition Sector- Goals S.N
Indicators Latest situation Target by 2017
Target by 2022
1 Infant Mortality Rate (IMR) (number/1000 Live Births)
44 (SRS 2011) 26 <20
2 Maternal Mortality Ratio (MMR) (number/Lakh Live Births -LLB)
261 (SRS 2009) 119 <90
3 Total Fertility Rate (TFR) (number of births/woman)
3.6 (SRS 2011) 2.9** 2.1
4 Malnutrition (children under 3 years)%* 58.4 (NFHS-3, 2005-07) 29 <18%
5 Anaemia (All women 15-49 years)% 68.3 (NFHS-3, 2005-07) 34 <20%
6 Life Expectancy at Birth (years) (SRS 2011)
M – 65.5; F- 66.2
M- 68.6 F-68.7
M- 69.6 F- 70.2
7 Sex Ratio (no. of females/1000 males) 916 (Census 2011) 930 960
8 Child Marriage (marriage before 18 yrs)% 20.2 (AHS 2010) 14** <10
The targets given by MoHFW, GoI (12th Five Year Plan targets-Page-4 &16). **GoB estimates *Data available for under 3 children, however malnutrition seems to be a problem amongst school age children
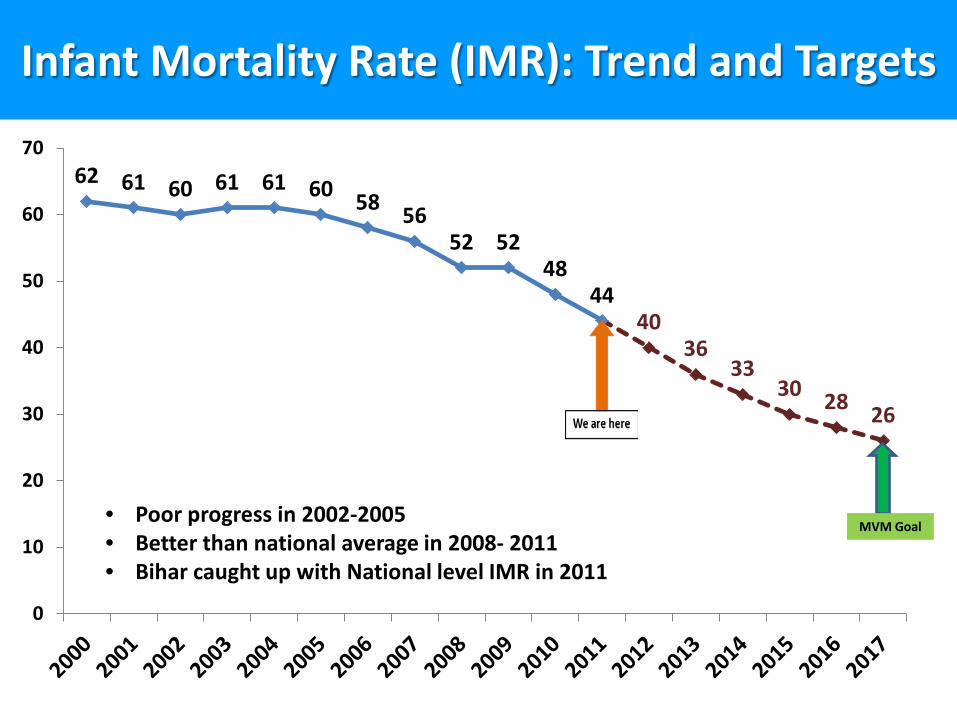
Infant Mortality Rate (IMR): Trend and Targets
• Poor progress in 2002-2005 • Better than national average in 2008- 2011 • Bihar caught up with National level IMR in 2011
62 61 60 61 61 60 58 56 52 52
48 44
40 36
33 30 28 26
0
10
20
30
40
50
60
70
MVM Goal

Maternal Mortality Ratio (MMR): Trend and Targets
Good progress of reduction of MMR after 2005
531
400 371
312
261
201 183
165 149 133 119
0
100
200
300
400
500
600
MVM Goal

Total Fertility Rate (TFR) : Trend and Targets Total fertility rate in Bihar is one and half times of All India average and is the highest
5.7
4.8
4.0 3.7
3.9 3.7 3.6
3.4 3.2 3.1 3.0 2.9
0
1
2
3
4
5
6
1980 1990 NFHS-I(92-93)
NFHS-II(98-99)
NFHS-III(05-06)
2009-10 2011-12 2013 2014 2015 2016 2017
MVM Goal
Pursuing formal Education of Girls up to 10+2 will facilitate Reduction of Fertility Rate by 70%

Malnutrition: Trend and Targets
National Undernutrition Rate reduced by 2.3 % whereas in Bihar it increased by 4.1% between NFHS II and NFHS III a gap of 7 years
54.3 58.4
49 42
37 33
29
0
10
20
30
40
50
60
70
NFHS -2(1998-99)
NFHS -3(2005-06)
2013 2014 2015 2016 2017
Child Undernutrition Index HIGHEST in Bihar
Malnutrition associated with 54% of Under Five Year Children Deaths
Data available for under 3 children, however malnutrition seems to be a problem amongst school age children

Anaemia: Trend and Targets
National and Bihar Anaemia rate has increased by 4% between NFHS II and NFHS III a gap of 7 years
63.4 68.3
57
49 43
38 34
0.0
10.0
20.0
30.0
40.0
50.0
60.0
70.0
80.0
NFHS -2(1998-99)
NFHS -3(2005-06)
2013 2014 2015 2016 2017
MVM Goal
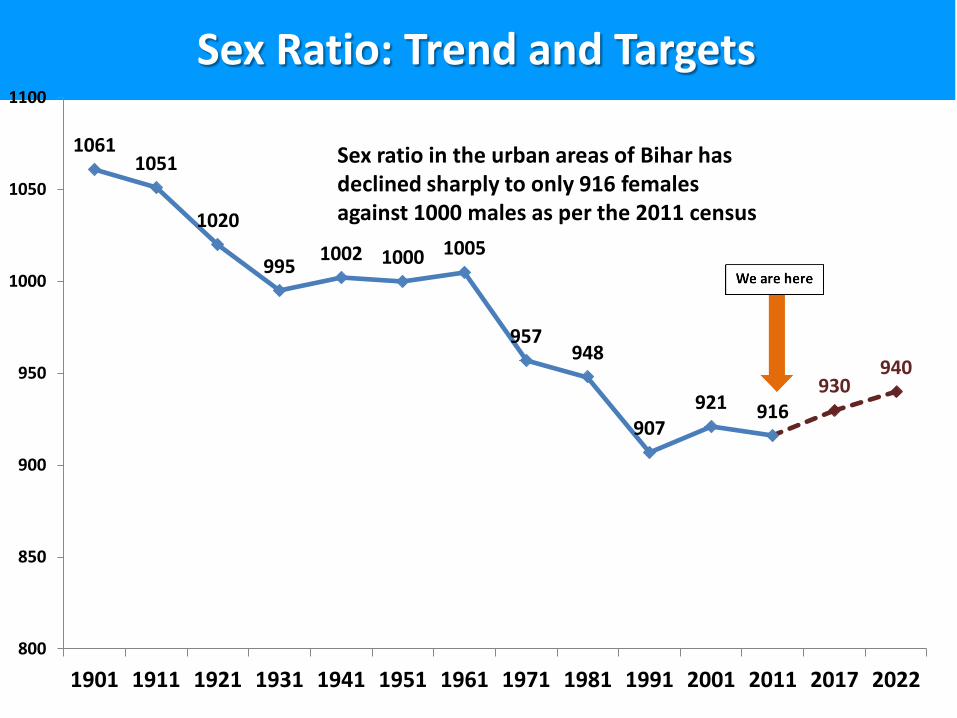
Sex Ratio: Trend and Targets
Sex ratio in the urban areas of Bihar has declined sharply to only 916 females against 1000 males as per the 2011 census
1061 1051
1020
995 1002 1000 1005
957 948
907 921 916
930 940
800
850
900
950
1000
1050
1100
1901 1911 1921 1931 1941 1951 1961 1971 1981 1991 2001 2011 2017 2022
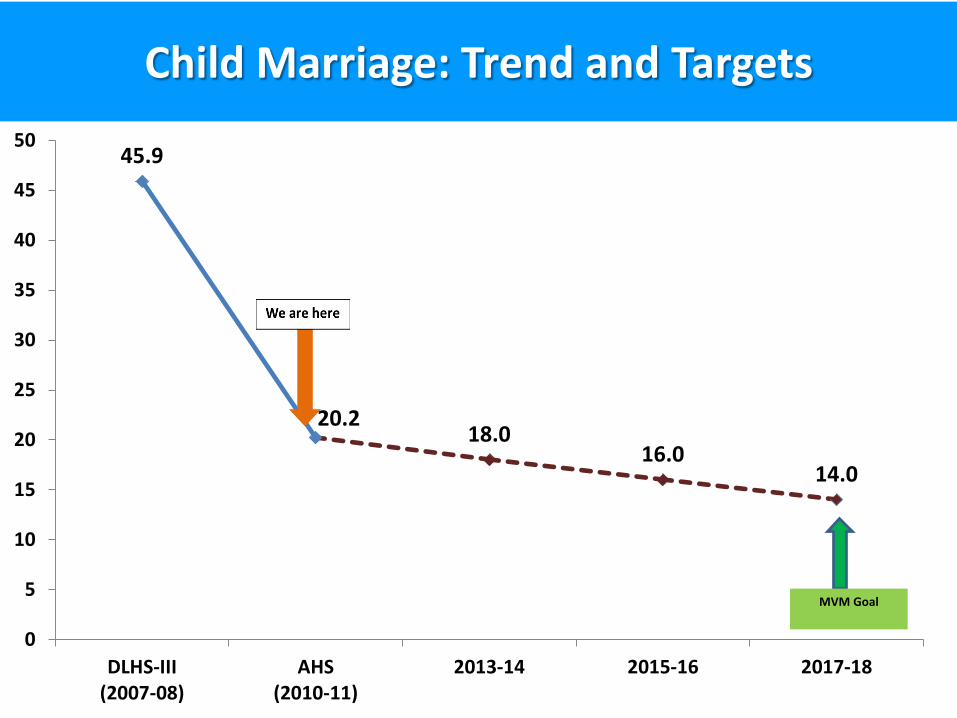
Child Marriage: Trend and Targets
45.9
20.2 18.0
16.0 14.0
0
5
10
15
20
25
30
35
40
45
50
DLHS-III(2007-08)
AHS(2010-11)
2013-14 2015-16 2017-18
MVM Goal

Life Expectancy at Birth: Trend and Targets
2001-05 2006-10 2011-15 2016-20Male 62.0 65.5 68.6 69.6Female 60.1 66.2 68.7 70.2
62.0 65.5
68.6 69.6
60.1
66.2
68.7
70.2
54.0
56.0
58.0
60.0
62.0
64.0
66.0
68.0
70.0
72.0

Expand Human Resources in Health ( Recommendations of High Level Expert Group Report-
Universal Health Coverage(UHC) As per WHO norms:
1. Human Resources (HR): 100 Medical Officers; 300 nurses (ANM+GNMs); 230 health workers per 100,000 population. As of now, Bihar has only 4 Medical Officers; 18 Nurses and 22 health workers per lakh population.
2. Hospital Beds: 100 beds per 1 lakh population. As of now, Bihar has 26,896 beds (as against 1,00,000 beds)
The shortage of manpower in the Department is enormous, but the Department systematically envisages the gaps and has planned to bridge them in phased manner. Steps in this direction would include
o Opening new medical colleges, both govt. and private o Increasing the number of seats of existing colleges- o Upgrading district hospitals into teaching hospitals o Expanding PG seats to provide faculty and also specialty care o Introduce Public Health Cadre first line supervisors
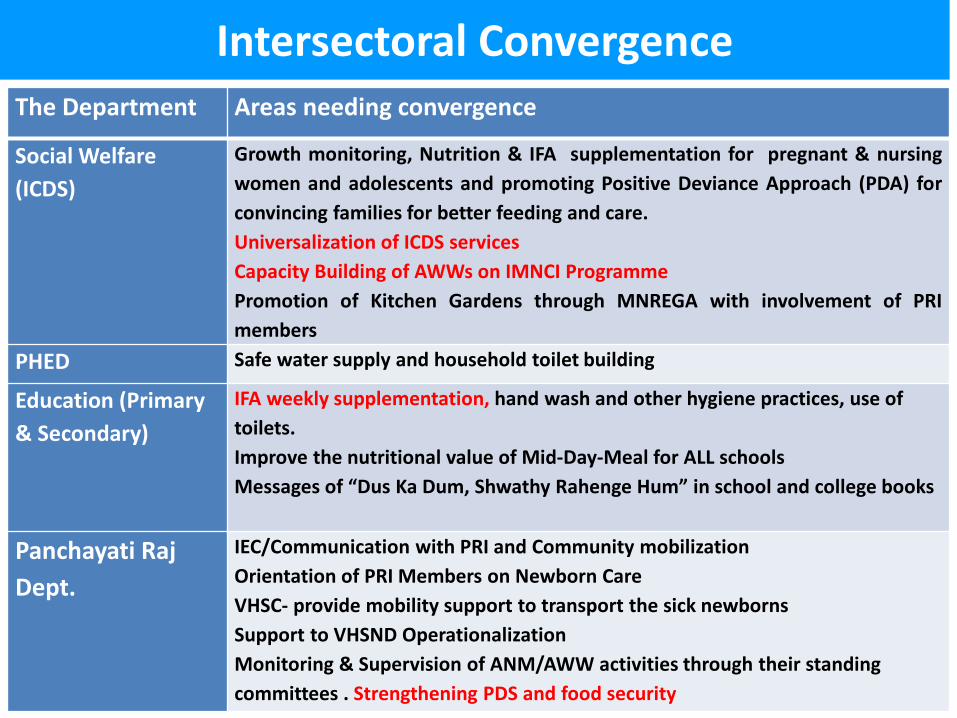
The Department Areas needing convergence
Social Welfare (ICDS)
Growth monitoring, Nutrition & IFA supplementation for pregnant & nursing women and adolescents and promoting Positive Deviance Approach (PDA) for convincing families for better feeding and care. Universalization of ICDS services Capacity Building of AWWs on IMNCI Programme Promotion of Kitchen Gardens through MNREGA with involvement of PRI members
PHED Safe water supply and household toilet building
Education (Primary & Secondary)
IFA weekly supplementation, hand wash and other hygiene practices, use of toilets. Improve the nutritional value of Mid-Day-Meal for ALL schools Messages of “Dus Ka Dum, Shwathy Rahenge Hum” in school and college books
Panchayati Raj Dept.
IEC/Communication with PRI and Community mobilization Orientation of PRI Members on Newborn Care VHSC- provide mobility support to transport the sick newborns Support to VHSND Operationalization Monitoring & Supervision of ANM/AWW activities through their standing committees . Strengthening PDS and food security
Intersectoral Convergence

A ONGOING INTERVENTIONS
1Infrastructure
(Upgradation of PHC to CHC; Establishment of SNCU/NBSU; L1 centers etc)
20,156
2Human Resources
(Medical Officers, Specialist, ANMs, Staff Nurses, Paramedics etc)
1,412
3 Drugs and Consumables (SNCU/ICU/Emergency/FP etc)
653
4 Equipments & Diagnostics (MH,CH,FP,Training etc)
21
5Capacity Development
(Maternal health, Child Health, PNDT,FP,ARSH,WIFS etc)
63
6 Patient Transport Services (Ambulances-102/108)
1,551
SUB TOTAL 23,856B NEWER INTERVENTION
1 The Bihar Model of Preventive Health Care(Dus Ka Dum (DKD) – Swasth Rahengey Hum) 10
2 Common Minimum Programme-Innovative Solutions (DPF) 61
3 Mukhya Mantri Kanya Suraksha Yojna (Bihar) Proposed revision… 9,600
4 Nutrition Care (Nanny’s at AWC) 36
5 Promote Directly Observed Consumption (DOC) of IFA supplementation in Schools: 1
SUB TOTAL 9,707
GRAND TOTAL 33,563
Sr. No. Major Heads Total Cost (in Cores)

Policy considerations: • Integrated Health Policy including mainstreaming
of AYUSH • State Health Human Resource policy • State nutrition policy • State Nutrition Mission • Policy to encourage private sector participation
in health sector
