managing up leading your executive council or board …€¦ · managing up leading your executive...
TRANSCRIPT
Managing Up
Leading Your Executive Council or Board on Enrollment Issues
2011 AACRAO--Managing Up--Cornell and Lingrell
Craig CornellVice Provost for Enrollment Management
Ohio University
Scot Lingrell, Associate VP of Enrollment Management
University of West Georgia

Types of Executive Leadership Structures• Institution Level—Local Boards
• Boards of Trustees (private)—Many members
• Appointed Boards of Trustees (public)
• Executive Council/President’s Advisory Council
• Institutional Leadership
• State Governing Boards
• Coordinating Boards
• Consolidated Governing Boards

Key Distinctions of Local Boards
• Boards of Trustees (Private)
• Many members—sometimes 50+
• Most are Alumnae
• Key donors and benefactors
• Successful Business and Civic Leaders
• Generally have influence in many areas of public
• Charged to lead the institution for the good of the institution

Key Distinctions of Local Boards
• Boards of Trustees (Public)
• Appointed in Political Process (Governor, Legislature)
• Connected politically in Region or City
• Successful Business and Civic Leaders
• May or may not be Alumnae
• May or may not be donors or benefactors
• Charged to help lead the institution for the public good

Key Distinctions of Local Boards
• Campus-Level Executive Council
• Campus Leadership
• President, Vice Presidents, Deans, etc.
• Enrollment Manager may or may not be on Council
• Develop institutional strategic plan and direction
• Make resource decisions
• Charged to lead the institution and assure continued growth and success
2011 AACRAO--Managing Up--Cornell and Lingrell
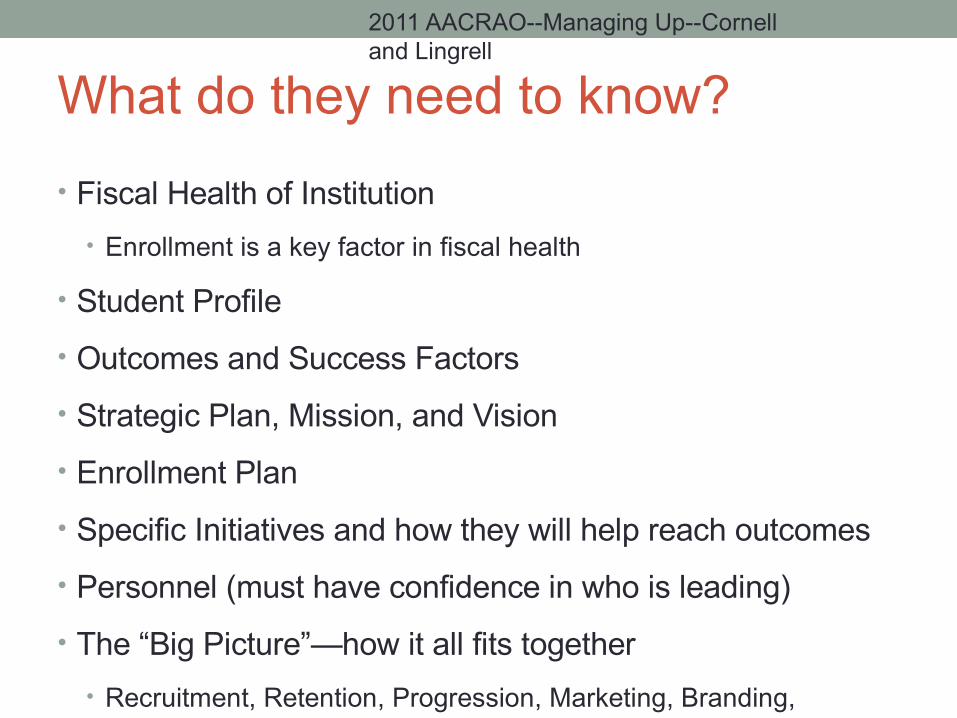
What do they need to know?
• Fiscal Health of Institution
• Enrollment is a key factor in fiscal health
• Student Profile
• Outcomes and Success Factors
• Strategic Plan, Mission, and Vision
• Enrollment Plan
• Specific Initiatives and how they will help reach outcomes
• Personnel (must have confidence in who is leading)
• The “Big Picture”—how it all fits together
• Recruitment, Retention, Progression, Marketing, Branding, Campus Amenities and Services, Generational Issues, etc.
2011 AACRAO--Managing Up--Cornell and Lingrell

Let’s Get Political
• Need to find out what drives them
• What do they care most about?
• What are their Pet projects?
• Why did they want to be on the board in the first place?
• What angles are they taking on which issues?
• Listen to what questions they ask
• Learn what resonates with them
• Find how you can help them accomplish their priorities
• Always remember that they have only a limited view—but think they know everything
• Find out their other sources for information
• Gently guide them to discovery if they are misguided
2011 AACRAO--Managing Up--Cornell and Lingrell

Enrollment Manager’s Role
• Start and End with Data
• EMs Role to analyze and interpret data and turn it into information
• Constantly have to confront myths and misinformation
• Do not deal in anecdote—Theirs may come from media or may be years old (their own experience)
• Must relate everything to the “Bottom Line”
• Everything at an institution affects or is affected by enrollment
• Institutional health is directly related to enrollment
• They care about other factors, but fiscal factors trump everything
• They are especially sensitive to “waste”
2011 AACRAO--Managing Up--Cornell and Lingrell

Enrollment Manager’s Role
• Position yourself as the “go to” person
• Tackle big problems
• Become the Internal Consultant on all enrollment-related issues
• Know the data; follow the trends; seek info from the front lines
• Stay current on national/state issues and trends
• If you are the source of their information, they will put other trusts in you too
• Be both Critic and Cheerleader
• Stockdale Principle—Good to Great (Collins)
• Face the stark reality, but never give up hope
• Don’t forget your role in Leading your departments
• Key are of influence and where you can get the most progress
2011 AACRAO--Managing Up--Cornell and Lingrell

• 4 year public institution in SE Ohio.
• Approximately 22,000 students at our main Athens, Ohio Campus and 10,000 students at 5 regional campuses
• Very traditional with 8,000 students in our residence halls, but significantly growing online e-learning.
• Enrollment management a relatively new concept at Ohio University
• Position created 3 years ago
• Once standing presidential enrollment committee was in place meeting maybe 4 -6 times a year
• Created several new committees
Ohio University

Strategic Enrollment Management Committee Structure
Vice Provost, Enrollment
ManagementStrategy

Why Data?
• Notice- still going to meetings, so it is not ALL data, just data as a tool, but the primary tool. We could easily do an entire session on “it’s all about building relationships”
• Consider the source- first lesson I learned in graduate school. Different populations will want different data, it is your job to know their penchant based on the context
• Data tells a story and legitimizes your thoughts or ideas, especially in relation to #1
• Never show up to a meeting, any meeting, without some relevant data in hand
Examples
“Data in Hand”?

Data in Hand
• Know where your sources of data lie- make IR your best friend or create your own team
• Become familiar with Institutional, Regional, State, and National Data sources
• Especially ones that are able to give you insight into the “secret sauce” of your comparative and competitive institutions
• Find out what sources of data your programs, schools and colleges reference
• 3 examples:

EXAMPLE #1- Data in HandProjected Number of Ohio High School Graduating Senior Populations 2001-2017
120000
125000
130000
135000
140000
10% decline
Actual
Projected

CONFIDENTIAL and PROPRIETARY
Ohio University Enrollment Management Planning and Tracking Document - Vice Provost, Enrollment Management
As of 2/4/2011Undergraduate Students
Fall 2010 - EOY Finals SEMP Goals 2010-11 2011-12 Difference (#) Difference (%)
Actual as of Sept. 2010 Fall 2011 Actual as of 2/5/2010 Actual as of 2/4/2011 Actual as of 5/5/2010 Actual as of 5/5/2010 Applicants 13,366 12,372 13,234 862 6.97% Admits 11,372 8,216 8,798 582 7.08% Final Admits 4,085 410 469 59 14.39% Freshmen Class final end of year 3,976 4,005 Targeted Enrollment Areas of Interest for Entering Freshman Class (Vision Ohio, Etc.)* Enrolled Enrolled Apply Admit Deposit Apply Admit Deposit Apply Admit Deposit Apply Admit Deposit In State 3,540 3,585 10,153 6,941 361 10,893 7,412 402 740 471 41 7.3% 6.8% 11.4% Out of State (includes international) 436 420 2,219 1,275 49 2,341 1,386 67 122 111 18 5.5% 8.7% 36.7%Special Populations International 82 82 503 67 0 576 65 0 73 (2) 0 14.5% -3.0% 0.0% Transfer** 495 520 na na na na na na na na na na na na Multicultural*** 477 487 1,718 870 20 1,800 907 23 82 37 3 4.8% 4.3% 15.0%Targeted Enrollment Quality (Vision Ohio, Etc.) Applicants Applicants Applicants Applicants ACT Composite / High School GPA 24.0 24.1 24.27 3.45 na na na na na na
* included in overall numbers above `
** Not included in overall numbers above
*** This category includes: Hispanic, American Indian, Asian American, African American, Hawaiian/Pacific Islander and "Two or More Races"
EXAMPLE #2- Data in Hand

EX
AM
PLE
#3-
Dat
a in
Han
d

Answering Specific Board questions with data
Question #1 - How can we be sure if we have to raise tuition we will remain affordable?

Ohio School Cost Comparison- TotalTuition/Fees + Room/Board Combined Costs – 2010-11
0
5000
10000
15000
20000
$22,440
$17,214
$19,767
$13,860 $13,678$13,146
$19,224
$18,503 $18,407 $18,375
$14,800
$17,407$18,294

0
500
1000
1500
2000
2500
3000
3500
4000
4,056
Ohio University – Athens Campus“Out of Pocket Costs” – Population #1- Aid Applicants with Need
Of our 4,056 new freshmen in 2009-10 – those who applied for aid and had need:
• 98% were awarded aid
• 94% received a need-based scholarship or grant
• The average aid award was $8,272 before any secondary loan options (Parent, Alternative or Unsubsidized Loans)
• This covers 86% of Tuition/Fees
• This leaves an “Out-of-Pocket” cost for tuition and fees to be $1,331 on average for the students of need at Ohio University
*excludes resources used to replace EFC (PLUS, Unsubsidized and Private Alternative Loans)
3,685
2,453
2,411
2,312
Common Data Set H2(a) Common Data
Set H2(b)
Common Data Set H2(c)
Common Data Set H2(d) Common Data
Set H2(e)

Ohio University – Athens Campus% of Needy Students Awarded a Scholarship or Grant-
Aid Applicants with Need
*excludes resources used to replace EFC (PLUS, Unsubsidized and Private Alternative Loans)

Ohio University – Athens Campus“Out of Pocket Costs” based on average aid award*
Aid Applicants with Need
*excludes resources used to replace EFC (PLUS, Unsubsidized and Private Alternative Loans)
Common Data Sets from all other Schools and calculated from previous cost slides
Question #2 - How can we develop a scholarship program and not give away more money than is necessary?
Answering Specific Board questions with data


Example 3
Request for Funding
2011 AACRAO--Managing Up--Cornell and Lingrell

University of West Georgia
• 4 year public institution 45 mi West of Atlanta.
• Approximately 11,250 students (90% Undergrads)
• Very Traditional—89% UGs are 18-24 yrs old
• One of 35 Public institutions in Georgia
• Approximately 3000 students in Residence Halls.
• 5 years under Enrollment Management structure
• New Student Enrollment is strong—population growth
• Focus is on terrible Graduation Rates--RPG
• 73% Retention Rate
• 13% 4-year Graduation Rate
• 36% 6-year Graduation Rate
2011 AACRAO--Managing Up--Cornell and Lingrell

Getting Funded
• Simple Process
• Find out what they are concerned about: Graduation Rates
• Focus efforts on those priorities
• Start and End with Data
• Be Entrepreneurial—get Creative
• Make reasonable assumptions and projections
• Do the math
2011 AACRAO--Managing Up--Cornell and Lingrell

Problem: Time to Degree
• Average time to degree: 12.2 Terms
• Issues
• Not enough Core Curriculum seats
• Complex pathways to degrees—to many “it depends” going on
• Inconsistent exceptions management—course substitutions, etc.
• Degree Audit system with major flaws
• No real projection of Course Demand--bottlenecks
• No clear understanding of Gateway Courses and their effect
• Degree Audit system unwieldy and not used as Advising Tool
• Pockets of Poor Academic Advising—yet universal Advising Hold
• No Curriculum Planning
2011 AACRAO--Managing Up--Cornell and Lingrell

Solution: Degree Audit Tool
• Proposed a Comprehensive Degree Audit tool
• Acts as both a Degree Audit tool and Advising Tool
• Clearly communicates progress towards degree
• Has a “What-If” option for those considering changing majors
• Provides a Curriculum Planning Tool (for students/advisors)
• Provides a Course Planning Tool (for academic admin)
• Provides an Exception Management Tool
• Allows “Progress Checks” and intervention for those that are “Off Track”
2011 AACRAO--Managing Up--Cornell and Lingrell

Cost: $125,000
• $125,000 year ONE (software, hardware, implementation)
• $20,000 each year (maintenance)
• Justification
• Cost a factor, but not the main factor
• Reasonable expectation of increased graduation rate
• Expectation of smoother systems and better advising
• Projection of Course Needs
2011 AACRAO--Managing Up--Cornell and Lingrell

The SimpleMath
System Costs$125,000
6 yrs of Maint $120,000
Total 6 yr Costs $245,000
2011 AACRAO--Managing Up--Cornell and Lingrell
Year 1 Year 2 Year 3 Year 4 Total
Ave. Direct Revenue Per Student (per year)
$9000 $9500 $10,000 $10,500 $39,000
Divided by Costs $245,000
Students 6.2
Initial Class is 1800 students
Needed .3% increase in Graduation
Expected Graduation Rate Increase
2% (36) X $39,000 $1.4 Million

Questions and Answers
Craig Cornell
Vice Provost for Enrollment Management
Ohio University
Scot Lingrell,
Associate VP of Enrollment Management
University of West Georgia
2011 AACRAO--Managing Up--Cornell and Lingrell