managing nutrient removal at a four-sludge bnr facility
TRANSCRIPT

Managing Nutrient Removal at a Four-Sludge BNR Facility James Ervin1, Simret Yigzaw1, Kelley Mayne2 1City of San Jose, 2San Jose-Santa Clara Regional Wastewater Facility * Email: [email protected] ABSTRACT The San Jose-Santa Clara Regional Wastewater Facility employs Biological Nutrient Removal (BNR) as its secondary return activated sludge process. BNR treatment was attained through adaptation of a large existing facility. The Facility was originally constructed in 1956 for primary treatment. Secondary treatment, with mirror image A-side and B-side, was added in 1964. Nitrification aeration basins and clarifiers were added in 1979. In the 1990s, Secondary and Nitrification areas were modified to perform parallel BNR treatment. Primary effluent flows are step-fed to first and third quad tanks in basins in both areas. Second and fourth quads are aerobic. Dissolved oxygen is continuously monitored at the end of the second and fourth quads to regulate aeration. Secondary/BNR treatment is accomplished via four autonomous treatment areas. A-sides and B-sides of two areas are operated to discharge similar concentrations of BOD, TSS, and ammonia. The physical layout and operating experience and parameters are reviewed. KEYWORDS: Activated sludge, Biological Nutrient Removal. INTRODUCTION The Facility and Receiving Water The San Jose-Santa Clara Regional Wastewater Facility provides tertiary treatment of domestic, commercial, and industrial wastewater for a total service area population of approximately 1.4 million. The Facility serves multiple cities and wastewater districts: the cities of San José, Santa Clara, and Milpitas; Santa Clara County Sanitation Districts No. 2 and No. 3; the West Valley Sanitation District, including Campbell, Los Gatos, Monte Sereno, and Saratoga; and the Cupertino, Burbank, and Sunol Sanitary Districts. Each associated satellite collection system is owned, operated, and maintained independently from the discharger, and collects wastewater from its respective service area (Figure 1). The wastewater treatment process includes screening and grit removal, primary sedimentation, secondary treatment by activated sludge process, secondary clarification, filtration, disinfection, and dechlorination. The Facility has an average dry weather flow design capacity of 167 million gallons per day (MGD) and a 271 MGD peak hourly flow capacity for full tertiary treatment.

Figure 1. The tributary agencies served by the Facility. Primary treatment (settling or skimming) removes a significant percentage of both organic and inorganic solids from wastewater. Secondary treatment employing activated sludge removes fine suspended solids, dispersed solids, and dissolved organics through volatilization, biodegradation, and incorporation into sludge. Tertiary (advanced) treatment includes nitrification (the biological oxidation of ammonium with oxygen, then into ammonium, then into nitrite followed by the oxidation of these nitrites into nitrates) and filtration (the removal of minute solids to further improve the effluent quality before it is discharged to the receiving environment). Biological Nutrient Removal (BNR) removes total nitrogen (TN) and total phosphorus (TP) from wastewater, through the use of microorganisms under aerobic and anaerobic conditions in the treatment process. Nitrification and denitrification are the specific biological processes for removing nitrogen. During nitrification, ammonium is oxidized to nitrite, after which nitrite is then oxidized to nitrate under aerobic conditions. Denitrification involves biological reduction of nitrate to nitric oxide, nitrous oxide, and nitrogen gas, under anaerobic conditions. Biological phosphorus removal relies on phosphorus uptake by aerobic heterotrophs capable of storing orthophosphate in excess of their biological growth requirements (Metcalf & Eddy, 2003). The Facility discharges to the Lower South San Francisco Bay (LSB). The LSB area extends from the Dumbarton Bridge south to the Southern Pacific Railroad Bridge across Coyote Creek. Treated wastes are discharged to Artesian Slough (also called Mallard Slough, 37° 26'23.38" Latitude and 121° 57' 29.18" Longitude), from where it flows by way of Coyote Creek, to the main body of South San Francisco Bay (Consoer, Townsend and Associates, 1968, p. 25). The discharge point is situated approximately two miles from the Creek, 6.5 miles from South Bay proper (Larry Walker Associates, 1987, 1-4). TREATMENT PLANT UPGRADES AND POLLUTANT REDUCTION The San Jose-Santa Clara Regional Wastewater Facility (formerly known as the San Jose/Santa Clara Water Pollution Control Plant) was constructed or modified in four successive phases starting in 1956. The Facility operated as strictly as a primary treatment plant from 1957 to January 1964. From that point until February 1979 single-stage return activated sludge was employed to provide secondary treatment. The Facility initiated new nitrification aeration basins
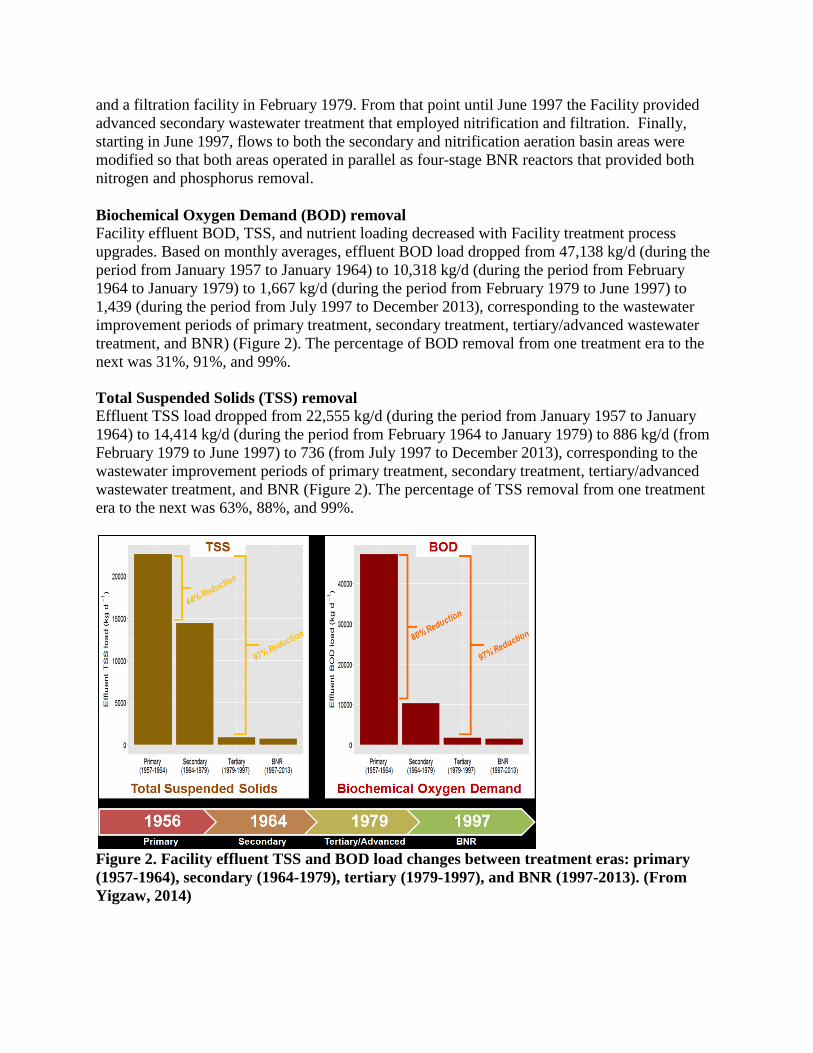
and a filtration facility in February 1979. From that point until June 1997 the Facility provided advanced secondary wastewater treatment that employed nitrification and filtration. Finally, starting in June 1997, flows to both the secondary and nitrification aeration basin areas were modified so that both areas operated in parallel as four-stage BNR reactors that provided both nitrogen and phosphorus removal. Biochemical Oxygen Demand (BOD) removal Facility effluent BOD, TSS, and nutrient loading decreased with Facility treatment process upgrades. Based on monthly averages, effluent BOD load dropped from 47,138 kg/d (during the period from January 1957 to January 1964) to 10,318 kg/d (during the period from February 1964 to January 1979) to 1,667 kg/d (during the period from February 1979 to June 1997) to 1,439 (during the period from July 1997 to December 2013), corresponding to the wastewater improvement periods of primary treatment, secondary treatment, tertiary/advanced wastewater treatment, and BNR) (Figure 2). The percentage of BOD removal from one treatment era to the next was 31%, 91%, and 99%. Total Suspended Solids (TSS) removal Effluent TSS load dropped from 22,555 kg/d (during the period from January 1957 to January 1964) to 14,414 kg/d (during the period from February 1964 to January 1979) to 886 kg/d (from February 1979 to June 1997) to 736 (from July 1997 to December 2013), corresponding to the wastewater improvement periods of primary treatment, secondary treatment, tertiary/advanced wastewater treatment, and BNR (Figure 2). The percentage of TSS removal from one treatment era to the next was 63%, 88%, and 99%.
Figure 2. Facility effluent TSS and BOD load changes between treatment eras: primary (1957-1964), secondary (1964-1979), tertiary (1979-1997), and BNR (1997-2013). (From Yigzaw, 2014)
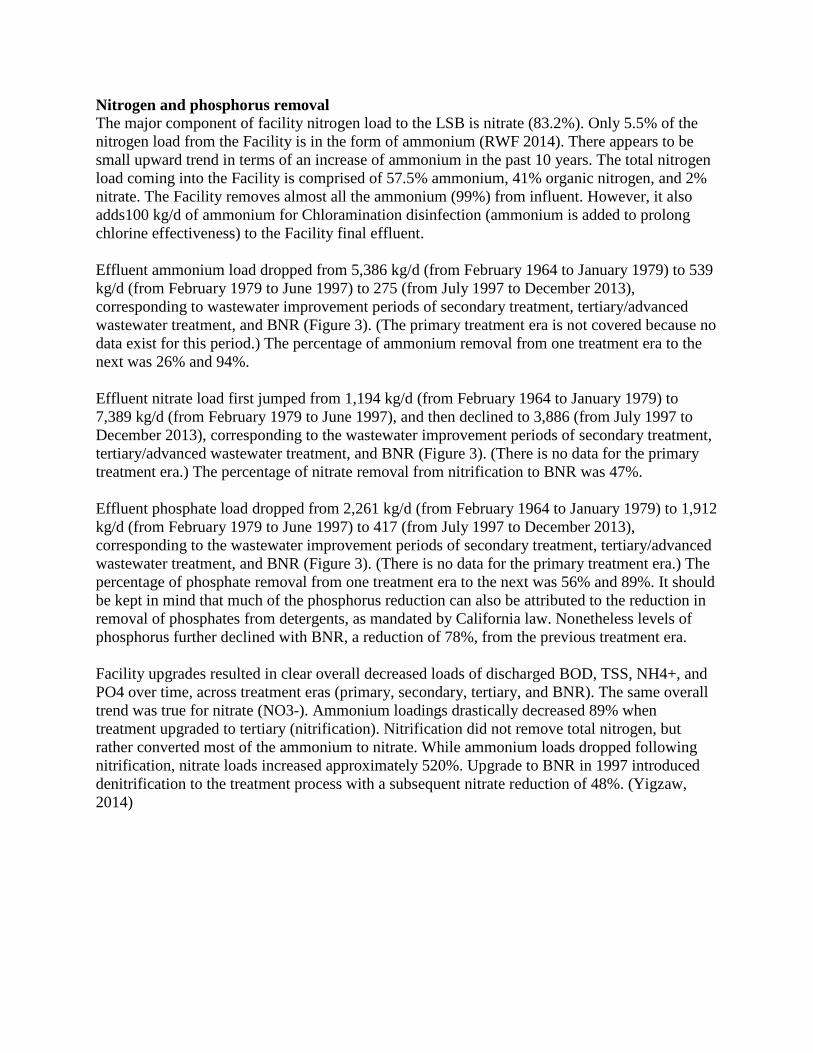
Nitrogen and phosphorus removal The major component of facility nitrogen load to the LSB is nitrate (83.2%). Only 5.5% of the nitrogen load from the Facility is in the form of ammonium (RWF 2014). There appears to be small upward trend in terms of an increase of ammonium in the past 10 years. The total nitrogen load coming into the Facility is comprised of 57.5% ammonium, 41% organic nitrogen, and 2% nitrate. The Facility removes almost all the ammonium (99%) from influent. However, it also adds100 kg/d of ammonium for Chloramination disinfection (ammonium is added to prolong chlorine effectiveness) to the Facility final effluent. Effluent ammonium load dropped from 5,386 kg/d (from February 1964 to January 1979) to 539 kg/d (from February 1979 to June 1997) to 275 (from July 1997 to December 2013), corresponding to wastewater improvement periods of secondary treatment, tertiary/advanced wastewater treatment, and BNR (Figure 3). (The primary treatment era is not covered because no data exist for this period.) The percentage of ammonium removal from one treatment era to the next was 26% and 94%. Effluent nitrate load first jumped from 1,194 kg/d (from February 1964 to January 1979) to 7,389 kg/d (from February 1979 to June 1997), and then declined to 3,886 (from July 1997 to December 2013), corresponding to the wastewater improvement periods of secondary treatment, tertiary/advanced wastewater treatment, and BNR (Figure 3). (There is no data for the primary treatment era.) The percentage of nitrate removal from nitrification to BNR was 47%. Effluent phosphate load dropped from 2,261 kg/d (from February 1964 to January 1979) to 1,912 kg/d (from February 1979 to June 1997) to 417 (from July 1997 to December 2013), corresponding to the wastewater improvement periods of secondary treatment, tertiary/advanced wastewater treatment, and BNR (Figure 3). (There is no data for the primary treatment era.) The percentage of phosphate removal from one treatment era to the next was 56% and 89%. It should be kept in mind that much of the phosphorus reduction can also be attributed to the reduction in removal of phosphates from detergents, as mandated by California law. Nonetheless levels of phosphorus further declined with BNR, a reduction of 78%, from the previous treatment era. Facility upgrades resulted in clear overall decreased loads of discharged BOD, TSS, NH4+, and PO4 over time, across treatment eras (primary, secondary, tertiary, and BNR). The same overall trend was true for nitrate (NO3-). Ammonium loadings drastically decreased 89% when treatment upgraded to tertiary (nitrification). Nitrification did not remove total nitrogen, but rather converted most of the ammonium to nitrate. While ammonium loads dropped following nitrification, nitrate loads increased approximately 520%. Upgrade to BNR in 1997 introduced denitrification to the treatment process with a subsequent nitrate reduction of 48%. (Yigzaw, 2014)

Figure 3. Facility effluent NH4+ and NO3- loads and PO4 load changes between three treatment eras: secondary (1964-1979), tertiary (1979-1997), and BNR (1997-2013). (From Yigzaw, 2014) Effect of Seasons As is the case with influent load, effluent load (containing BOD, TSS, NH4+, NO3-, and PO4) shows seasonal variability. During the dry season, with BNR treatment operating efficiently, PO4 removal from influent to effluent can exceed 90%. During the dry season, phosphorus in effluent was very low. In 2012 and 2013, for example, the wet season drop in phosphorus removal corresponded with rains, cooler temperatures, and changes to process operations in response to seasonal changes. Like phosphorus, both nitrification and denitrification are affected by temperature and therefore subject to seasonal effects (San Jose-Santa Clara RWF, 2014a). BNR AERATION AREAS Following primary clarification, wastewater flow is split and directed to both BNR aeration areas: BNR 1 and BNR 2. These areas continue to be commonly referred to by their former names and former functions as “Secondary” and “Nitrification” areas. After construction of the nitrification aeration basins in 1979 until the 1997 adoption of the BNR process, the facility operated as a two-stage activated sludge process. The two aeration areas operated in series. The BNR 1 “Secondary” area was aerated vigorously and maintained 1.5 to 2 day solids retention time (SRT) to provide carbonaceous BOD removal. Secondary effluent then passed to the BNR 2 “Nitrification” aeration basins that afforded up to 15 day SRT to accommodate a nitrification process (oxidation of ammonia to nitrate). From 1993 through 1996, the facility (at that time known as the San Jose/Santa Clara Water Pollution Control Plant (SJ/SC WPCP)) undertook a series of studies to evaluate optimization of the then existing two-stage activated sludge process (City of San Jose 1998). Ironically, the goal

at that time was not to enhance removal of nutrients, but rather to determine empirically if a BNR process would provide a reliable level of copper removal. In 1994 and 1995, aeration basins were pilot tested in four and eight tank configurations. The study determined that reconfiguring all existing aeration basins to a step-feed four-tank (or “quad”) configuration employing an anaerobic, aerobic, anoxic, and aerobic aeration scheme afforded a number of benefits in addition to slightly reducing overall effluent copper concentrations. Conversion to the BNR aeration process added greater protection against bulking and foaming, afforded greater hydraulic flow through the units, and recovered some amount of oxygen and alkalinity. It was recognized at the time that the BNR process also reduced effluent nitrogen and phosphorus loads, but since there were no regulatory concerns about those constituents, this was not considered a significant factor for adopting BNR in the later 1990s. (City of San Jose 1998) Thus, the two BNR aeration areas, BNR 1 and BNR 2, are today operated as parallel, theoretically identical, processes. Each of the 24 aeration basins (16 in BNR 1 and 8 in BNR 2) are configured as four tanks referred to as “quads” or “passes.” Primary effluent and Return Activated Sludge (RAS) is introduced into the first tank with a low rate of aeration to maintain mixing but afford as little free oxygen as possible. This creates an anaerobic selector zone that discourages fast growing filamentous bacteria in favor of slower growing nitrifying bacteria and Phosphorus Accumulating Organisms (PAOs). Wastewater progresses through the next tank which is vigorously aerated to stimulate both carbonaceous BOD removal and nitrification. Primary effluent is step-fed to the third tank along with a low rate of aeration to create an anoxic zone that facilitates denitrification. The final fourth tank is again vigorously aerated to remove additional carbonaceous BOD and ammonia. Mixed liquor channels convey wastewater from the final aeration tank to the secondary clarifiers. Mixed liquor channels are also aerated to maintain mixing and this affords additional aeration treatment, albeit not entirely intended. Any small amount of oxygen and nitrate remaining in the RAS is substantially removed by microorganisms during the clarification process before the RAS is circulated back to the first tank in the BNR basins. Because they were built at different times and for different purposes, the size and configuration of BNR aeration tanks differs between the two areas. BNR 1 was constructed as 16 basins in a four-tank configuration optimized to remove an enormous quantity of BOD using 2-day or less SRT. The BNR 2 area was originally operated as 16, two-tank, basins with a 15-day SRT. As a result of the conversion to parallel BNR processes, BNR 2 was reconfigured into 8 four-tank basins to mirror the process and configuration of BNR 1. Both areas are now generally operated with an SRT of 8 to 10 days. The two BNR areas attain similar levels of wastewater treatment performance even though the tank volumes, aeration efficiency, and flow throughputs vary between the units. The total aerator volume in BNR 1 area is 44 million gallons compared to 24 million gallons in BNR 2. As a result, BNR 1 generally treats about 60 percent of primary effluent with BNR 2 treating the remaining 40% (Figure 4). In practice, the flow split will vary widely depending on availability of aerators, incoming wastewater loads, and time of year. Additionally, both BNR areas were each constructed as two mirror image sides for reliability and redundancy: an “A-side” and a “B-side.” RAS is not exchanged between the BNR areas or sides, which means that the four aeration basin segments operate with independent microbial populations, or “four sludges.”
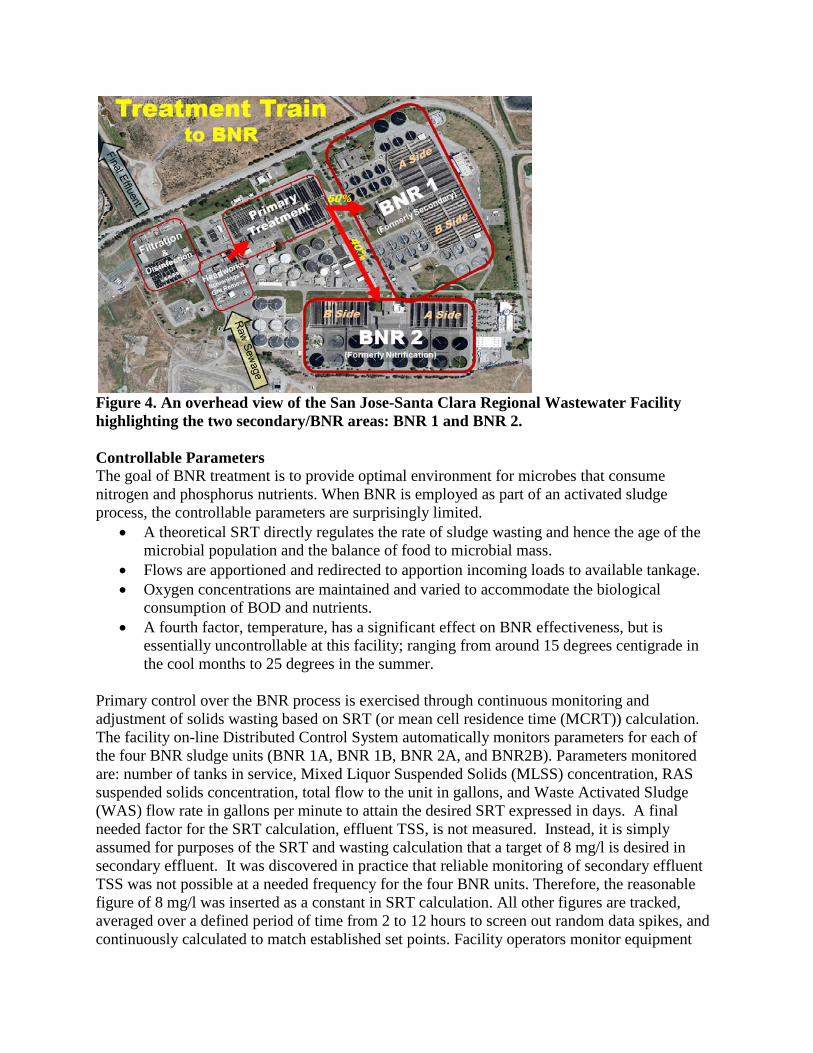
Figure 4. An overhead view of the San Jose-Santa Clara Regional Wastewater Facility highlighting the two secondary/BNR areas: BNR 1 and BNR 2. Controllable Parameters The goal of BNR treatment is to provide optimal environment for microbes that consume nitrogen and phosphorus nutrients. When BNR is employed as part of an activated sludge process, the controllable parameters are surprisingly limited.
• A theoretical SRT directly regulates the rate of sludge wasting and hence the age of the microbial population and the balance of food to microbial mass.
• Flows are apportioned and redirected to apportion incoming loads to available tankage. • Oxygen concentrations are maintained and varied to accommodate the biological
consumption of BOD and nutrients. • A fourth factor, temperature, has a significant effect on BNR effectiveness, but is
essentially uncontrollable at this facility; ranging from around 15 degrees centigrade in the cool months to 25 degrees in the summer.
Primary control over the BNR process is exercised through continuous monitoring and adjustment of solids wasting based on SRT (or mean cell residence time (MCRT)) calculation. The facility on-line Distributed Control System automatically monitors parameters for each of the four BNR sludge units (BNR 1A, BNR 1B, BNR 2A, and BNR2B). Parameters monitored are: number of tanks in service, Mixed Liquor Suspended Solids (MLSS) concentration, RAS suspended solids concentration, total flow to the unit in gallons, and Waste Activated Sludge (WAS) flow rate in gallons per minute to attain the desired SRT expressed in days. A final needed factor for the SRT calculation, effluent TSS, is not measured. Instead, it is simply assumed for purposes of the SRT and wasting calculation that a target of 8 mg/l is desired in secondary effluent. It was discovered in practice that reliable monitoring of secondary effluent TSS was not possible at a needed frequency for the four BNR units. Therefore, the reasonable figure of 8 mg/l was inserted as a constant in SRT calculation. All other figures are tracked, averaged over a defined period of time from 2 to 12 hours to screen out random data spikes, and continuously calculated to match established set points. Facility operators monitor equipment

operation at all times, make adjustments as needed, and take manual control if or when the automated system is not able to adjust to demands. Flow equalization is employed to balance flows to the BNR units throughout the 24 hour cycle. Primary effluent flows are partially directed to a 16 million gallon equalization basin during the high flow periods: from 10:00 AM to 2:00 AM the following day. As flows decrease, from 2:00 AM to 10:00 AM, the equalization basin is drained of “settled sewage” that now flows back to the BNR units with continuously incoming primary effluent. The equalization basin provides a good deal of stability for the downstream BNR units. However, owing to the closer proximity of the BNR 1 area and the pre-existing alignment of plumbing, distribution and mixing of settled sewage with primary effluent is less uniform in the BNR 1 aeration basins. Primary effluent, in combination with settled sewage from the equalization basin, is delivered to the first and third tanks in the BNR 1 and BNR 2 basins. This is a step-feed process whereby roughly 60 percent of incoming primary effluent/settled sewage enters the first quad tank and the remaining 40 percent is fed to the third quad. Minimal aeration is provided to the first and third tanks, enough to provide mixing, but not enough to sustain significant carbonaceous BOD removal. The anaerobic conditions in the first tank stimulate PAO-type microbes to release phosphates to power minimal metabolism while growth of most other forms of bacteria is seriously inhibited. The second tank in each aeration basin is vigorously aerated to a set dissolved oxygen concentration of 2.5 mg/l. The oxygenated environment supports both carbonaceous BOD consumption and nitrification. During this phase, the PAOs also accumulate and store polyphosphates from the wastewater. In the third tank, the combination of low rate of aeration (dissolved oxygen concentration target is 0.5 mg/l), and incoming primary effluent/settled sewage, stimulates rapid depletion of remaining dissolved oxygen. Carbonaceous BOD removal and nitrification continue only to the extent that dissolved oxygen concentrations support those processes. Microbes that can exploit nitrate (NO3) as an electron acceptor are now favored, and the majority of the denitrification (conversion of nitrate to nitrogen gas) occurs in the third quad tank. The fourth tank is again vigorously aerated to facilitate additional BOD removal and nitrification. Mixed liquor from the aeration basin fourth tank then passes to the secondary clarifier. Any remaining dissolved oxygen or nitrate is consumed from the sludge blanket in the clarifier before RAS returns to the aeration basin first tank. (Figure 5)

Figure 5. A schematic depiction of the four-stage, step-feed, BNR process. The arrangement of tanks in this diagram matches the BNR 1 area. Adapted from San Jose-Santa Clara RWF 2013 Annual Self Monitoring Report, p.22. The facility air distribution system could be considered antiquated. Two parallel stainless steel headers in each of the 96 BNR 1 and BNR 2 tanks are connected to Sanitaire coarse bubble diffusers or EDI FlexAir fine bubble diffusers. The number of diffusers in each tank varies from 268 in the shorter BNR 2 tanks to 324 in BNR 1 tanks 2 and 4, and 460 diffusers in BNR 1 tanks 1 and 3. One control valve regulates air flow to both headers in each tank. Meters located near the end of the second and fourth tanks monitor dissolved oxygen concentrations against the established set points of 2.5 and 4.5 mg/l for tanks 2 and 4, respectively. Until the early 2000s, Sanitaire stainless steel coarse bubble diffusers were exclusively used to disperse air into BNR tanks. In 2002, the facility began pilot testing EDI FlexAir T-Series fine bubble diffusers consisting of 2 and 4 foot PVC tubes of 3-inch diameter encased in perforated polypropylene sleeves. The fine bubble diffusers were adopted to more efficiently distribute air in the aerobic tanks (tanks 2 and 4 in both BNR 1 and BNR 2 areas). The PVC tube design was incorporated because these diffusers could be retrofitted into existing coarse bubble diffuser fittings with no other modifications. The existing system creates a “dual spiral roll” of turbulence in the tanks to mix and distribute air. A disadvantage of this retrofit design is that polypropylene sleeves have a short operational life of between 3 to 5 years, must be protected from extensive UV exposure at all times, and they are not as efficient as newer membrane disc designs. Pulse aeration, blowing air intermittently to accommodate mixing while reducing air flow, has been employed in the anaerobic and anoxic first and third quad tanks since 2008. This was adopted as an energy saving practice. Theoretically, the anaerobic and anoxic tanks would be better served with mechanical mixers to prevent solids settling without wasting air. Pulse aeration affords a compromise that avoids completely replacing existing aeration basin

infrastructure. The durable stainless steel coarse bubble diffusers are not adversely affected by the varying air flows. Monitoring Performance Monitoring of BNR performance is carried out by both continuous monitors and hand sampling or calculation.
• As mentioned above, dissolved oxygen concentration is continuously monitored in the second and fourth quad tanks of each aeration basin. The continuous monitoring equipment is verified with a hand-held meter once per day. DO concentrations are used to regulate air flow to the basin.
• Mixed Liquor Suspended Solids (MLSS) is also monitored continuously in the mixed liquor channel of each of the four BNR units: BNR 1A and B, BNR 2 A and B. A hand-held MLSS meter is used to check continuous results twice per day. Both MLSS and volatile solids are tested in the facility laboratory twice per week as another check on the continuous results.
• Depth of secondary clarifier sludge blanket is measured daily using a clarifier sludge judge.
• Filament counts and microbial composition evaluations are performed by microscope twice per week to determine sludge age and assess the condition of the microbial population in each of the four BNR units.
• Sludge Volume Index (SVI), using the 30-minute settling test, is measured and calculated three times per day.
• Daily 24 hour composite samples of influent and effluent of the four BNR units are measured for chloride, ammonia, nitrite, nitrate, sulfate, TSS, and turbidity.
In addition to the above readings, operators continuously monitor flows and compare them to valve readings. This is to check the validity of the automated monitoring systems. It is not uncommon, almost inevitable, that at some point a mechanical or electrical failure will occur. Frequently, the difference between inconvenience or disaster is the amount of time that passes between the failure and its detection by staff. (Lemma, 2013) For 24-hour operations, the Facility maintains a continuous monitoring system that tracks flows, water levels, and operations of all valves, pumps, blowers, and other equipment. This function is performed by the Facility’s Distributed Control System (DCS) which is in the process of being upgraded to an 800xA ABB hardware and software platform. Data displayed by this system is watched at all times by a control room operator, as well as by BNR area operators on duty. (San Jose-Santa Clara RWF, 2014a) Control Options Just as the list of BNR controllable parameters is limited, so too are the options that can be exercised to manipulate the BNR process. Ammonia breakthrough is the greatest concern. Ammonia is the only nutrient parameter regulated by the Facility’s NPDES permit. Also, incomplete nitrification in the BNR areas results in elevated concentrations of nitrite (NO2+) which disrupts the downstream chlorine disinfection process. For these reasons, Facility operators respond quickly to indications of ammonia or nitrite breakthrough.

The initial response when ammonia or nitrite concentrations start to elevate is to increase aeration. In practice, this means that aeration is increased in the third, anaerobic quad tanks of the affected BNR unit. Typically, the third tank will be taken out of pulse aeration mode and aeration will be run continuously to enhance oxidation of ammonia and nitrite. If simply increasing aeration does not appear to solve the problem, the next change to operations that is typically considered is to reduce the amount of primary effluent/settled sewage feed flowing to the BNR unit. If feed cannot be simply shunted over to other units, Facility operators may decide to cut off step-feed (primary effluent feed to the third anoxic tank) and run the affected basins in “plug flow” mode. In plug flow, all primary effluent is fed to the first quad tank, and usually, tanks 2 through 4 are continuously aerated at increased air volume. After aeration, adjustment of sludge wasting is the next control option. Regular twice per week microscopic examination of mixed liquor should detect gross changes to the microbial population, but ammonia breakthrough or other signs of upset may trigger reevaluation. Ideally, RAS and SRT are controlled to maintain sludge at an ideal log growth phase, neither too young, nor too old. Solids wasting can be increased or decreased to adjust sludge age. And, finally additional BNR basins can be put into service, or taken out, if the source of the problem is overall facility loads. Tracking Nitrogen Trends An example of long-term performance of the facility’s four BNR units is seen in the charted ten-day running average measurements of nitrite, ammonia, and nitrate concentrations (Figure 6). “Good” BNR performance, with respect to nitrogen species typically results in no detectable concentrations of nitrite or ammonia. As the chart shows, the best, consistent performance is usually seen in the later, warmest months of the year. Ammonia and nitrite spikes are more likely to occur and persist in the cooler month when lower temperatures prevent microbes from regenerating as rapidly. It is also evident that the four BNR units occasionally perform differently. Ammonia and nitrite spikes never occur in all four units simultaneously at the same magnitude, which is a very good thing. Viewing data charted over the past 30 months, it is apparent that the “Nitrification B-side,” otherwise known as BNR 2B has been more prone to nitrite and ammonia breakthrough (bright green trend line in figure 6). This has been a long running issue attributed to differences in hydraulic flow, but more recently exacerbated by the fact that BNR 2B is the last of the four units on the rolling 5-year fine bubble diffuser replacement cycle. Hence, when breakthroughs have occurred in BNR 2B, they tend to be a little more intense and take a little longer to resolve. For example, the initial ammonia breakthrough shown in late January 2013 occurred as a result of a mechanical valve failure that was quickly discovered. A second bigger spike occurred in May as BNR 2B tanks were brought back in service following valve replacement and the new BNR 2B sludge required aging before efficient nitrification could be resumed. A similar event occurred in January 2015. It was discovered that the data system was reading incorrect effluent valve positions in one basin of BNR 2B. This led to over wasting of BNR 2B sludge and partial nitrification leading to a nitrite spike. Subsequent ammonia and nitrite spikes reflect draining the affected tanks and manipulation of flows to restore the proper sludge age.

Some caution must be exercised when tracking nitrogen species discharged from a BNR process. The output depends on stability and sludge age. Under good conditions, the microbial population responds to changes over the course of one or two SRT cycles. (e.g. SRT of 8 to 10 days at this Facility). Thus, responding to short duration ammonia or nitrite spikes is not advisable. The ten-day running average of nitrogen data is used so that the results reflect the output of the entire sludge age cohort under the general conditions. It is expected that final resolution of nitrite or ammonia breakthrough in any BNR unit will usually take 10 to 20 days, or longer during the cool season.
Figure 6. Ten-day running average concentrations of nitrite, ammonia, and nitrate for each of the Facility’s BNR units: Secondary A-side (aka: BNR 1A), Secondary B-side (aka: BNR 1B), Nitrification A-side (aka: BNR 2A), and Nitrification B-side (aka: BNR 2B) The ten-day nitrogen trend data is a central feature of a weekly operations area supervisors’ meeting. The scheduled meeting is the main venue for reviewing microbial trends and discussing response options. Frequently, a response to problems or significant maintenance requires shifting wastewater loads from one BNR unit to another. A weekly assessment of the status of microbial population is essential to the smooth running of the facility, particularly during the cool season. Future As service population increases, so will influent flow and load. The San Jose-Santa Clara RWF has been embarked in a master planning process since 2007. The “Plant Master Plan (PMP),” as

it is called, is used to plan and coordinate major infrastructure repair and upgrade over the next 3 decades. (San Jose-Santa Clara RWF, 2013b). According to the PMP, the current step-feed mode of operation will have insufficient capacity around 2026, assuming projected increases in load and flow. At that point the facility may have to transition to Nitrifying Activated Sludge (NAS) mode. If future regulations require more stringent nitrogen limits, then the current BNR units may have to be upgraded to a modified Ludsack-Ettinger (MLE) or other type of BNR process requiring internal recycle of mixed liquor and changes to the aeration scheme. A recently concluded PMP project involved evaluation of current and future year 2040 aeration demands for the BNR units. A process simulator was used to examine three different aeration configurations under current (year 2014) and future (year 2040) influent conditions. The results of this evaluation will provide a first step in determining optimal upgrades that may be required. (R. Appleton, personal communication) SUMMARY AND CONCLUSIONS The San Jose-Santa Clara Regional Wastewater Facility operates a very effective BNR treatment process, albeit with no chemical addition, and using 1964 and 1979 infrastructure that was not designed to perform as a BNR plant. The Facility has undergone a series of three significant upgrades since original construction as a primary treatment plant: first to secondary, then to add nitrification and filtration, and ultimately to convert to four-stage, step-feed BNR. Each upgrade or modification has resulted in significant reduction in conventional pollutant and nutrient loads. Implementation of a 4-stage BNR aeration process involves adaptation of existing infrastructure to balance flows and loads that favor nutrient removal microorganisms. At times, this can be frustrating: tiny upsets can seem to linger for weeks and months. Other times it seems uncanny that the microbes seem to know what to do. Manipulation of four independent sludges is coordinated on at least a weekly basis by senior operators who monitor the process. The current BNR system is more than adequate to handle current loads and requirements, however, long term planners understand that the sewer service area is not static. Population is expected to grow. Our existing BNR facility has limited growth potential and even more limited lifespan, having been built 35 to 55 years ago. Thus our planning includes process simulation and evaluation of alternative aeration schemes to accommodate future loads. ACKNOWLEDGEMENTS The authors wish to acknowledge the contributions of Dr. Alex Ekster who, as principal process engineer, developed and managed the mid-1990s implementation of the current 4-stage, step-feed, BNR treatment process. We also thank our facility’s current process engineers, Dr. Issayas Lemma and Dr. Rong Liu, performed studies and compile on-going data analysis that support the bulk of our findings.
REFERENCES City of San Jose. (1998). In-Plant Copper Reduction and Treatment Process Optimization Program at the San Jose/Santa Clara Water Pollution Control Plant. Unpublished Manuscript. Consoer & Tower and Associates. (1968). A Comprehensive Study of the Waste Treatment Requirements for the Cities of San Jose and Santa Clara and Tributary Agencies: Phase 1. Assimilative Capacity of South San Francisco Bay. San Jose, CA. Larry Walker Association and Kinetic Laboratories Incorporated. (1987). South Bay Dischargers Authority Water Quality Monitoring Program. (Final Technical Report December 1981-November 1986). Lemma, Issayas. (2013). Facility Training. San Jose-Santa Clara Regional Wastewater Facility. Unpublished Manuscript. Metcalf & Eddy. (2003). In Tchobanoglous G., Burton, F.L. and Stensel H. D. and Stensel H. D. (Eds.), Wastewater Engineering: Treatment and Reuse. (4th ed.). New York: McGraw Hill. San Jose-Santa Clara Regional Wastewater Facility (RWF). (2013a). 2013 Annual Self Monitoring Report. http://www.sanjoseca.gov/Archive.aspx?AMID=161&Type=&ADID= San Jose-Santa Clara Regional Wastewater Facility (RWF). (2013b). Plant Master Plan, November 2013. http://www.sanjoseca.gov/plantmasterplan San Jose-Santa Clara Regional Wastewater Facility (RWF). (2014a). 2014 Annual Self Monitoring Report. http://www.sanjoseca.gov/Archive.aspx?AMID=161&Type=&ADID= San Jose-Santa Clara Regional Wastewater Facility (RWF). (2014b). Nutrient 13267 Monitoring Final Report. San Jose-Santa Clara Water Pollution Control Plant (WPCP). Brief Historical Background. Unpublished Manuscript. San Jose/Santa Clara Water Pollution Control Plant (WPCP). (1997). Santa Clara’s Relationship with San Jose Concerning Ownership and Operation of the San Jose/Santa Clara Water Pollution Control Plant. Unpublished Manuscript. Yigzaw, Simret Kesete. (2014) Wastewater and Water Quality Changes in Lower South San Francisco Bay, 1957-2013. Environmental Studies., San Jose State University.