managing liquidity risk in a volatile market – and improving returns
TRANSCRIPT

1Managing liquidity risk in a volatile market — and improving returns |
Managing liquidity risk in a volatile market — and improving returnsInsights from EY Global Liquidity Risk Management Survey 2016 for insurers

| Managing liquidity risk in a volatile market — and improving returns2
Contents
Executive summary . . . . . . . . . . . . . . . . . . . . . . . . . . . . . . . . . . .3
About this survey — methodology . . . . . . . . . . . . . . . . . . . . . . . .4
Section 1: Key themes . . . . . . . . . . . . . . . . . . . . . . . . . . . . . . . . 6
Section 2: Policy and governance . . . . . . . . . . . . . . . . . . . . . . . 8
Section 3: Measurement and infrastructure . . . . . . . . . . . . . . 15
Section 4: Stress and scenario testing . . . . . . . . . . . . . . . . . . 27
Conclusion . . . . . . . . . . . . . . . . . . . . . . . . . . . . . . . . . . . . . . . . . 35
How EY can help . . . . . . . . . . . . . . . . . . . . . . . . . . . . . . . . . . . . 36
Key contacts . . . . . . . . . . . . . . . . . . . . . . . . . . . . . . . . . . . . . . . 38
3Managing liquidity risk in a volatile market — and improving returns |
We surveyed some of the world’s largest insurance groups to determine their priorities and concerns. Three key themes emerged from our discussions:
1. Governance, roles and responsibilities in liquidity management are not always clearly defined. Tasks are being more clearly allocated, and the definition of committees, approvals and escalation processes are being enhanced. More frequent review by senior management of cash flow projections, risk tolerances, compliance with risk limits, stress testing results, and effectiveness of contingency funding plans is being developed to establish more robust governance of liquidity risk.
2. Liquidity risk management infrastructure relies heavily on spreadsheet solutions based on manual input. In the future, there will be a shift toward greater automation to improve visibility on liquidity positions. Steps also are being taken to generate comprehensive cash flow projections and establish and monitor liquidity risk tolerance, both of which will benefit from improved infrastructure.
3. Stress testing, metrics and consistency need to be enhanced. As comprehensive cash flow projections, tracking cash flow mismatches and stressing cash flows across both shorter and longer time horizons are critical to help insurers effectively manage liquidity risk, there is room for development in these activities. Using stress tests to determine the level of liquid assets required to meet net cash outflow needs over multiple time horizons gives insurers a better chance of surviving a crisis in a downturn and optimizing excess liquidity in business as usual.
It is clear that strides made in improving visibility will help insurers not only survive a crisis but also improve their risk-adjusted return on capital by optimizing use of liquid assets.This report presents the findings of our survey and insights for insurers as they look to enhance their liquidity risk management frameworks.
Executive summary
Historically, insurers have regarded liquidity risk as a benign risk, given the nature of the business model. For example, it often takes liabilities longer to mature than it takes assets; life insurers receive upfront periodic payments; general insurers receive premiums before claims are paid; and, in general, assets are relatively liquid.
Recently, regulators have become increasingly concerned about liquidity risk management issues, such as insurance cycles where companies sell assets in a downturn and search for yield in an upturn, increased liquidity exposures through margin calls on derivatives, mass lapses where surrender penalties are low, insufficient working capital to fund critical services in a crisis and the inability to service debt due to trapped liquidity.

| Managing liquidity risk in a volatile market — and improving returns4
About this survey — methodology
Over a period of 12 months, we surveyed 17 insurance groups worldwide for EY Global Liquidity Risk Management Survey 2016. The participants include 66% of the Financial Stability Board’s (FSB’s) designated global systemically important insurers (G-SIIs), as well as other large insurance companies that either operate internationally or are major players in their respective domestic markets, including life, non-life, multi-line and reinsurers. The results highlight key areas of liquidity risk management.
Two methods were used for the survey: a quantitative and qualitative questionnaire was distributed to the participants and was completed by senior liquidity risk management; and participants responded by completing the survey and participating in multiple interviews.
The survey was based on guidance from the International Association of Insurance Supervisors (IAIS) and discussions with EY clients about how they compare with their peers on these topics. Three areas of focus were selected:
1 . Policy and governance
2 . Measurement and infrastructure
3 . Stress and scenario testing
The objective was to provide liquidity risk management benchmarks on a global level to support peer comparisons and consider what level of enhancements might be appropriate and proportionate to each company’s business model.
EY’s point of view is represented in these gray boxes throughout the document.

5Managing liquidity risk in a volatile market — and improving returns |
• Prudential Plc – UK• PZU Group – Poland• Royal London – UK• Swiss Re – Switzerland• Zurich Insurance Group –
Switzerland
Europe
• Admiral – UK• Aegon N.V. – Netherlands• Ageas – Belgium• Allianz – Germany• Assicurazioni Generali – Italy • Legal and General – UK• Lloyds Banking Group
Insurance – UK
Africa and Asia-Pacific
• Liberty – South Africa • QBE Insurance Group –
Australia • Ping An Insurance Company
of China – China
North America
• Metropolitan Life Insurance Company – US
• Prudential Financial – US
to senior executives from the following companies who contributed and shared their perspectives
Thank you . . .

| Managing liquidity risk in a volatile market — and improving returns6
Three themes resonate throughout our survey and provide insight for insurers as they enhance their liquidity risk management frameworks .
Key themes1
1 Governance roles and responsibilities
The multifunctional inputs to manage liquidity risk vary across firms. However, typically, the Treasury function steers and manages an organization’s short-term liquidity under both normal and stressed conditions . The Risk function develops models and calculates the implications of insurance and financial risk on capital and investments. And, the Investment Management function is accountable for managing and monitoring investment portfolios in line with asset allocation targets and agreements .
Closer interaction between Risk and Treasury is required to confirm:
• Consistency in the severity of stress testing of insurance and financial risk categories across legal entities
• Optimization of liquid assets to improve risk-adjusted returns where possible
• Efficient handoffs and a leaner process to:
• Reduce the cost
• Improve the speed
• More frequent review by senior management from risk and treasury functions of insurers’ cash flow projections, risk tolerances, compliance with risk limits, stress testing results and effectiveness of contingency funding plans

7Managing liquidity risk in a volatile market — and improving returns |
2 Liquidity risk management infrastructure
Ineffective handoffs between functions and stakeholders lengthen the lead time to develop liquidity reporting . When a liquidity crisis occurs, the impact can be fast and the need for timely and accurate information becomes crucial .
There is room for improvement to industrialize the processes between Risk, Treasury and Investment Management to enable more frequent and up-to-date liquidity reporting and reconciliation to ledgers . Consistency in reporting across legal entities and more robust tools simplify aggregation of data and create better visibility .
Improved liquidity risk management infrastructure supports the allocation of funding costs across business units and legal entities .
Better visibility creates a platform for sustainable optimization if there is excess liquidity, and clarity in a crisis during if liquidity is impaired .
3 Stress testing, metrics and consistency
While many insurers monitor liquidity at the group and legal entity levels, many others monitor liquidity at the group level only. As regulatory and board focus turns to liquidity management, more insurers are developing stresses and monitoring at both group and legal entity levels. Both approaches have their benefits: the group-wide stresses highlight the lack of fungibility of liquidity, while the local tailored stresses support development of an early warning indicator framework and assist in preventing contagion if mitigated in time . A liquidity risk management framework without one or the other would fall short of emerging good practice .
It also is clear that stress test definitions should be aligned with risk tolerances to outline consistent liquidity buffers and a limit framework .
There is an expectation from regulators and boards that insurers use scenarios to validate contingent funding plans. In this context, the stresses should be calibrated to identify available mitigating liquidity options at various levels of severity (e.g,. as buffers deplete or when the liquidity coverage ratio is breached) . Features of the stress testing also should assess the liquidity impact and options under different types of stress and time horizons .
If insurers can assess how much buffer to hold at group and legal entity levels through stress testing and consistent liquidity metrics, they will achieve three commercial benefits: a better chance of increased agility in a crisis, the opportunity to optimize excess liquidity and scale efficiencies.

| Managing liquidity risk in a volatile market — and improving returns8
Policy and governance2

9Managing liquidity risk in a volatile market — and improving returns |
Group liquidity risk policy — tolerances 1.1 Are the tolerances (risk appetite) defined in a policy?
Findings reveal that the majority of respondents include risk appetite and tolerance statements in their liquidity risk policy document. Where there are exceptions, such statements are usually contained in ancillary documents that have similar standing to a policy in the document hierarchy. Variations to this may raise challenges in the current regulatory environment, particularly under Solvency II.
We observe that financial institutions, including insurance companies, generally develop overall tolerance parameters at group and legal entity levels.
Figure: Q1.1
Yes, consistently defined at group and legal entity level
Yes, at group level
Yes, but defined independently at group and legal entity level
No
47%
24%
17%
12%
Group liquidity policy — core components 1.2 and 1.4 Which of the following does the group
liquidity policy (or group contingency funding plan) contain?
Respondents’ policy structures are fairly standardized. The liquidity policy and/or the contingency funding plan (CFP) usually include the strategy to manage liquidity risk, roles and responsibilities for liquidity and liquidity risk management, liquidity risk tolerance definitions, liquidity targets or limits, stress tests and scenarios, early warning indicators, reporting requirements, escalation process, and contingency and communication plans.
Regulators and boards are seeking the practical application of policies on a consistent basis across the group. Our discussions revealed that visibility of results at the legal entity level is not always consistent or adequate to demonstrate appropriate application of the policies. While legal entities are held to standards, they are rarely required by groups or central teams to evidence these standards.
Figure: Q1.2 and Q1.4
100%
94%
94%
88%
88%
88%
88%
88%
71%
71%
35%
24%
Reporting
Liquidity targets/limits
Roles and responsibilities (CFP)
Liquidity risk tolerance definition
Strategy to manage liquidity risk
Stress tests and stress scenarios
EWI (e.g., definition of thresholds) (CFP)
Escalation process (CFP)
Contingency plan
Communication plan (CFP)
Intra-group transactions
Funds and liquidity transfer pricing

| Managing liquidity risk in a volatile market — and improving returns10
Section 2: Policy and governance
Group liquidity policy — liquidity measures 1.3 Which liquidity measures are included in the
group liquidity policy?
The majority of respondents include a liquidity coverage ratio (LCR) as a measure in their liquidity policy. However, while the majority of respondents track minimum liquidity requirements, fewer track excess liquidity.
In discussions with survey participants, it has become apparent that some are in the process of linking liquidity and investment management to optimize their liquidity position. A key consideration in developing these measures, for example, is whether to include cash pooling balances.
Figure: Q1.3: The category “funding concentrations” refers to the monitoring of limited funding sources
82%
59%
53%
24%
Liquidity coverage ratio
Minimum liquidity reserves
Excess liquidity
Funding concentrations
Group liquidity policy — metrics 1.5 Does the liquidity policy articulate quantitative
metrics and qualitative processes at the group level?
1.6 Does the liquidity policy articulate quantitative metrics and qualitative processes at the legal entity level?
While all respondents stated that the group level liquidity policy articulates metrics and quantitative or qualitative processes at the group level, only half agree that the policy articulates metrics and processes at the legal entity level.
For both groups, the risk appetite statement has been evaluated to have equal standing with the liquidity policy document. In cases where the legal entity metrics and processes are not prescribed within the group policy, we would expect the metrics and processes to be entirely consistent with the principles and approach adopted at the group level.
In a principles-based framework such as this, regulators and boards expect that the reviews and controls are robust.
A lack of explicit quantitative metrics and qualitative processes in the liquidity policy at the legal entity level indicates that regular reviews should be introduced so that the implied processes, measures and controls are cascaded down and embedded appropriately. In addition, insurers may want to consider including explicit references to legal entity metrics and processes in the group liquidity policy.
Figure: Q1.5 and Q1.6
94%
6%
No
Yes
13%
31%56%
YesNo
Quantitative “yes,” qualitative “no”

11Managing liquidity risk in a volatile market — and improving returns |
Liquidity roles and responsibilities for treasury and asset management
1.7 and 1.8 List the liquidity roles and responsibilities for treasury and asset management
The majority of respondents cite specific roles allocated to treasury and asset management:
• Key accountabilities assigned to the treasury function include embedding the liquidity management strategy, managing and monitoring liquidity and compliance with the policy, establishing the liquidity contingency funding plan, reporting on liquidity shortfalls, stress testing and proposing mitigation steps to re-establish the group’s available liquidity and contingent liquidity sources.
• Key accountabilities for asset management include monitoring and managing cash balances in investment portfolios, in line with investment management agreements (IMAs); managing the short-term portfolio liquidity, based on cash targets set by treasury; managing the portfolios’ highly liquid assets to meet the liquidity needs in the mid- to longer-term and, under stressed conditions, managing and executing the liquidation of invested assets that provide the primary source of cash.
Insurers deploy a number of different operating models for liquidity risk management. Leading practices include establishing a liquidity working group (LWG) — a cross-functional structure that includes asset management, treasury and risk. Roles and responsibilities include the following:
• Treasury monitors compliance with liquidity risk limits under normal and stressed conditions and reports to the LWG.
• The LWG reviews requests for limit changes in conjunction with treasury.
• The LWG has oversight of updates to contingent funding sources made by treasury.
In stressed conditions, treasury has the first-line role to implement the contingency funding plan and estimates the impact of the liquidity stress (cause, severity and duration) and assesses timing, cost and availability of mitigating actions.
• Risk management often develops the models and calculates the insurance and financial risk implications for capital and investments (which in turn drives the liquidity valuation and excess liquidity measure).
• Risk management also tends to develop the stress testing methodology and parameters to calculate potential loss stemming from insurance and financial risk. These parameters are then applied by treasury for monitoring purposes.
Liquidity-related activities at legal entities 1.9 Which liquidity-related activities take place at the
legal entity level?
Liquidity reserves and buffers are managed by most insurers at a legal entity level.
Liquidity measures also are calculated at the legal entity level by operating entities for most insurers.
However, only two-thirds of respondents indicate that stresses are defined at the legal entity level and at group level. For the remaining third, stresses are defined at the group level only.
For large groups where the stresses are set at the group level only, this may indicate that additional work is required to achieve a more robust framework: arguably, stresses also should be developed locally to reflect local business vulnerabilities and market conditions.
Figure: Q1.9
82%
65%
Management of liquidity reserves or buffers
Calculation of liquidity measures
Definition of stress tests
94%
Quantitative “yes,” qualitative “no”

| Managing liquidity risk in a volatile market — and improving returns12
Section 2: Policy and governance
Group policy — asset quality requirements 1.10 Does the group policy define quality requirements
for liquidity held at legal entity level?
Of survey respondents, 44% define quality requirements for liquidity held at the legal entity level in their group policy, while the remainder do not.
While Solvency II requires insurers to consider the appropriateness of the composition of assets in terms of nature, duration and liquidity to meet obligations as they fall due, it does not require a group level definition of quality. There is evidence, however, that the definition of quality of liquid assets is found in other framework documents and not necessarily in a policy: liquidity model output for the vast majority of respondents (71%) categorizes the quality of available liquidity sources.
Liquidity reporting framework 2.1 What is included in the liquidity reporting framework?
On balance, most insurers could benefit from better defined roles and accountabilities, particularly in relation to the information handoffs between treasury, risk, actuarial and finance. The nature of liquidity management of asset and liability matching in insurance requires the handoffs to be clearly defined for the liquidity gap to be estimated appropriately.
A “best practice” liquidity reporting framework would include:
• Liquidity targets or limits and usage (at group and legal entity level)
• Available liquidity following impact of predefined stress scenarios (behavioral cash flows)
• Excess liquidity
• Cash flow projections (segregated by operating, investment and funding activities)
• Liquidity coverage ratios (defined as the ratio between liquidity sources and liquidity needs)
• Contingency funding sources
Our observations are that typically, stress scenario assumptions (financial, market and insurance) are applied to models to test asset and liability data at the legal entity level. The results are summarized by legal entity and on a consolidated basis. Tasks include updating cash flow projections across all activities, applying ongoing concern and stress assumptions, and calculating the liquidity coverage ratio and the liquidity gap (the difference between liquidity needs and sources).
Figure: Q2.1
94%
94%
35%
59%
82%
82%
88%
88%
Liquidity targets, limits and usage (e.g., group, legal entity)
Available liquidity following impact of predefined stress scenarios (behavioral cash flows)
Excess (available) liquidity
Cash inflow and outflow projections (e.g., segregated by operating, investment and funding activities)
Liquidity coverage ratio
Contingency funding sources
Available liquidity segregated by asset class before and after haircut
Funding concentrations

13Managing liquidity risk in a volatile market — and improving returns |
Liquidity reporting framework — governance
2.2 Who receives the full liquidity report? Who receives the summary report?
2.3 Does the board approve the liquidity risk policy?
2.4 What are the review periods for the risk appetite statement?
Survey results indicate that the governance for liquidity reporting is not as consistent for insurers as it is for banks. For some insurers, the reporting lines are clear, with first-and second-line executive committees (e.g., investments, balance sheets, capital management, executive risk committees) reviewing the full liquidity reports, and boards (and subcommittees) reviewing summaries. Reporting lines on liquidity will often follow reporting lines in treasury, finance or capital teams.
Liquidity is a key enabler for doing business, in the same way as capital, but it has a “real time” dimension that capital and broader finance frequently do not. As a result, clear reporting lines and delegated authority structures are, if anything, even more important for liquidity.
In banks, liquidity reports are submitted to the first-and second-line executive committees (asset and liability, as well as risk committees) and to the board (and subcommittees). Public disclosure of the liquidity coverage ratio is phased in, as required by Basel III.
From a liquidity policy approval perspective, there is a distinct trend for policies to be approved by the board or one of its subcommittees, as required by Solvency II regulation. Liquidity has taken on added importance since 2008 and is a prominent issue for regulators. Consideration of liquidity at senior levels is likely to be viewed favorably, especially where companies are looking to capture a liquidity premium by providing liquidity or funding to outside parties through investment activity.
Survey respondents were almost unanimous in stating the use of annual review periods, and some insurers specified that ad hoc reviews, as needed, were also possible.
In banks, liquidity risk policies, including risk tolerance statements and global limits, are approved by the board or by the risk subcommittee of the board. Executive committees generally approve liquidity limit frameworks within the global limits set by the board.
Liquidity reporting framework — escalation 2.5 Who approves actions taken upon breaches of
liquidity triggers (e.g., the risk committee)?
2.6 How often does the authorizing committee convene?
2.7 What is the process at group and legal entity level in case of breach of threshold (escalation, cure period, exceptions)?
For the vast majority of insurers, actions to resolve breaches of liquidity triggers are signed off through an escalation process that depends on the materiality of the breach. Actions to resolve material breaches are generally approved by a first-line executive committee or the board, with notification given to second-line risk committees. In only one instance were actions approved by the chief executive officer. A key issue is whether this process is followed in all cases regardless of materiality.
For many insurers, a breach of risk appetite at the legal entity level would involve escalation to group or group level committees in a timely manner, dependent on the materiality of the breach.
The vast majority of respondents say that authorizing committees meet at least quarterly, as required, suggesting that the governance mechanisms are flexible enough to respond to a crisis. The specific processes and parties involved depend on the nature and materiality of the breach: a breach of a liquidity risk appetite trigger or limit would require a different course of action than deviation from an expected timing of cash flows.
A mature escalation process and control framework would involve monitoring and reporting potential and actual breaches at the legal entity level by the first line. The first line should have responsibility for developing mitigating actions via a cross-functional LWG comprised of asset liability management (ALM), treasury, risk and finance. These mitigating actions should be submitted for approval by the relevant first-line committees or the board, depending upon materiality.
The first line should outline the impact of the mitigating actions in the stressed conditions of the breach and the time-line for implementation. Some insurers specify standard time periods within which mitigating actions should be submitted for approval after a breach. They also provide alternative time periods within which to submit the mitigating actions in accordance with policies for specific risk types. Approval by the group board may be required for certain breaches based on materiality.

| Managing liquidity risk in a volatile market — and improving returns14
Section 2: Policy and governance
Liquidity reporting framework — intervention
2.8 Are there intervention points before reaching the minimum level (breach of framework), such as trigger points or early warning indicators?
Twelve percent of insurers in the survey do not have intervention points in place that would lead to escalation. This highlights an area where further work is needed to support the robustness of the liquidity risk management framework.
Where intervention points are in place, they include early warning indicators and risk appetite triggers related to liquidity, capital triggers and other financial market indicators contained in the group recovery plan.
Group liquidity — dividend up-streaming 3.1 Rank common constraints faced by legal entities in
relation to dividend up-streaming
Local solvency requirements are cited as the most common constraint faced by legal entities in relation to group liquidity dividend up-streaming.
In some cases, insurers have an internal direct cash pool arrangement that allows them to up-stream cash on a local basis to a cash pool within the group. This has no impact on the local liquidity buffer because it is still deemed to be part of the legal entity’s liquidity.
A number of insurers are taking steps to improve cash pooling arrangements by widening the scope of entities contributing cash to the internal cash pool. Trapped cash in times of crisis is a key consideration, and a number of groups are considering ways in which they can centralize liquidity to create greater fungibility.
Figure: Q3.1
91%
83%
71%
76%
79%
Local solvency requirements
Other regulatory requirements
Retained earnings
Local liquidity buffer
Withholding tax
Investment guidelines for legal entity liquidity reserves
3.2 Are investment guidelines in place for liquidity reserves at the legal entity level?
It is notable that 24% of insurers do not have investment guidelines for liquidity reserves at the legal entity level. This is indicative of an investment policy that does not distinguish between tiers of liquidity sources.
Typically, investment guidelines at the legal entity level define the allocation of asset classes, as indicated by the response rate of 76%.The response of 24% may indicate that there is no formal section in the investment guidelines at the legal entity level that refers to the investment of liquidity buffers and, potentially, also no segregation of the liquidity buffer in a separate portfolio.
Liquidity model results 3.3 How are the liquidity model results used?
For the majority of insurers, achieving compliance is the baseline driver for running liquidity models. As expected for the majority of respondents, the liquidity model drives investment decisions for the liquidity reserves. Surprisingly, in a low interest rate environment, there is not a tighter connection between the use of model results and investment decisions. We would have expected closer to 100% rather than 75% of respondents to confirm that the model drives investment decisions to some extent.
Discussions as part of this survey have indicated a growing shift to optimize liquidity in investment decisions, with greater integration between asset management and liquidity risk management. Often, this integration includes work to define liquidity buffers under business-as-usual and stressed conditions, providing greater clarity to asset managers of their scope to optimize asset allocation.
In addition, understanding the runoff profile of liabilities in a stress scenario allows companies to estimate the maximum proportion of illiquid assets that can be held in order to capture illiquidity premium in the portfolio.
Figure: Q3.3
88%
76%
53%
To ensure compliance
To drive investment decisions for the liquidity reserves
To provide input into capital action decisions (M&A, external dividends, share buybacks)

15Managing liquidity risk in a volatile market — and improving returns |
3 Measurement and infrastructure
Section 3: Measurement and infrastructure
| Managing liquidity risk in a volatile market — and improving returns16
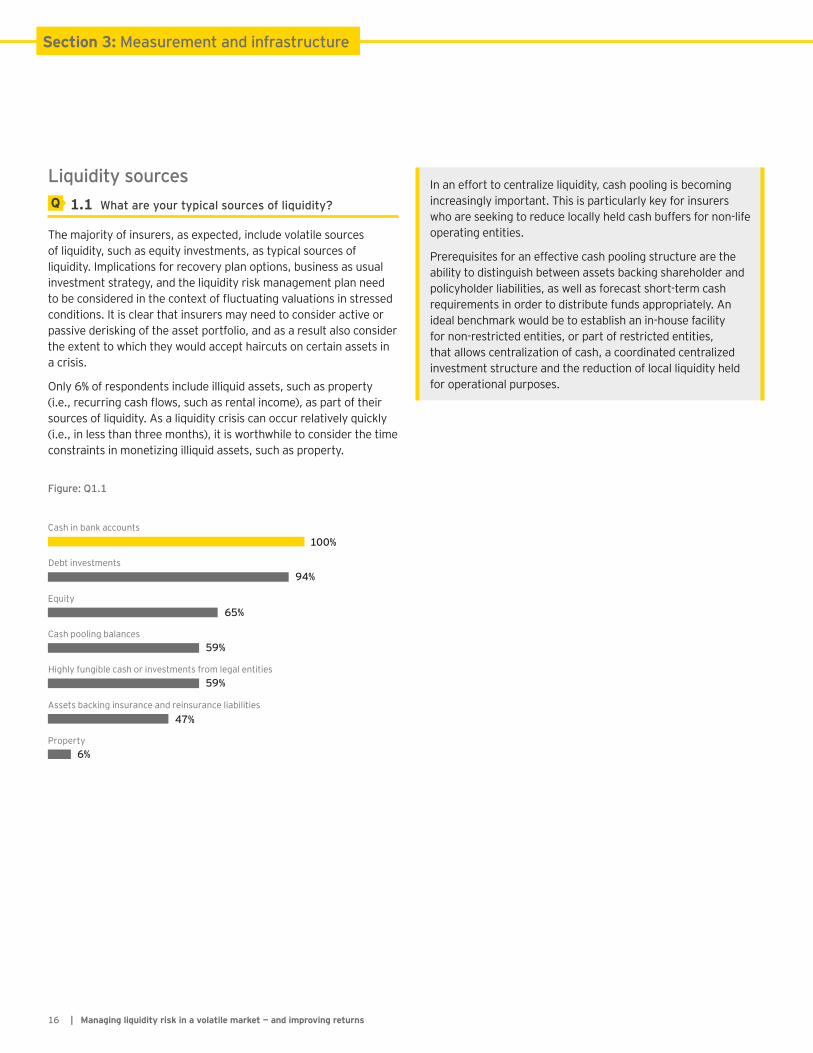
Liquidity sources 1.1 What are your typical sources of liquidity?
The majority of insurers, as expected, include volatile sources of liquidity, such as equity investments, as typical sources of liquidity. Implications for recovery plan options, business as usual investment strategy, and the liquidity risk management plan need to be considered in the context of fluctuating valuations in stressed conditions. It is clear that insurers may need to consider active or passive derisking of the asset portfolio, and as a result also consider the extent to which they would accept haircuts on certain assets in a crisis.
Only 6% of respondents include illiquid assets, such as property (i.e., recurring cash flows, such as rental income), as part of their sources of liquidity. As a liquidity crisis can occur relatively quickly (i.e., in less than three months), it is worthwhile to consider the time constraints in monetizing illiquid assets, such as property.
Figure: Q1.1
100%
94%
65%
59%
59%
47%
6%
Cash in bank accounts
Debt investments
Equity
Cash pooling balances
Highly fungible cash or investments from legal entities
Assets backing insurance and reinsurance liabilities
Property
In an effort to centralize liquidity, cash pooling is becoming increasingly important. This is particularly key for insurers who are seeking to reduce locally held cash buffers for non-life operating entities.
Prerequisites for an effective cash pooling structure are the ability to distinguish between assets backing shareholder and policyholder liabilities, as well as forecast short-term cash requirements in order to distribute funds appropriately. An ideal benchmark would be to establish an in-house facility for non-restricted entities, or part of restricted entities, that allows centralization of cash, a coordinated centralized investment structure and the reduction of local liquidity held for operational purposes.
17Managing liquidity risk in a volatile market — and improving returns |
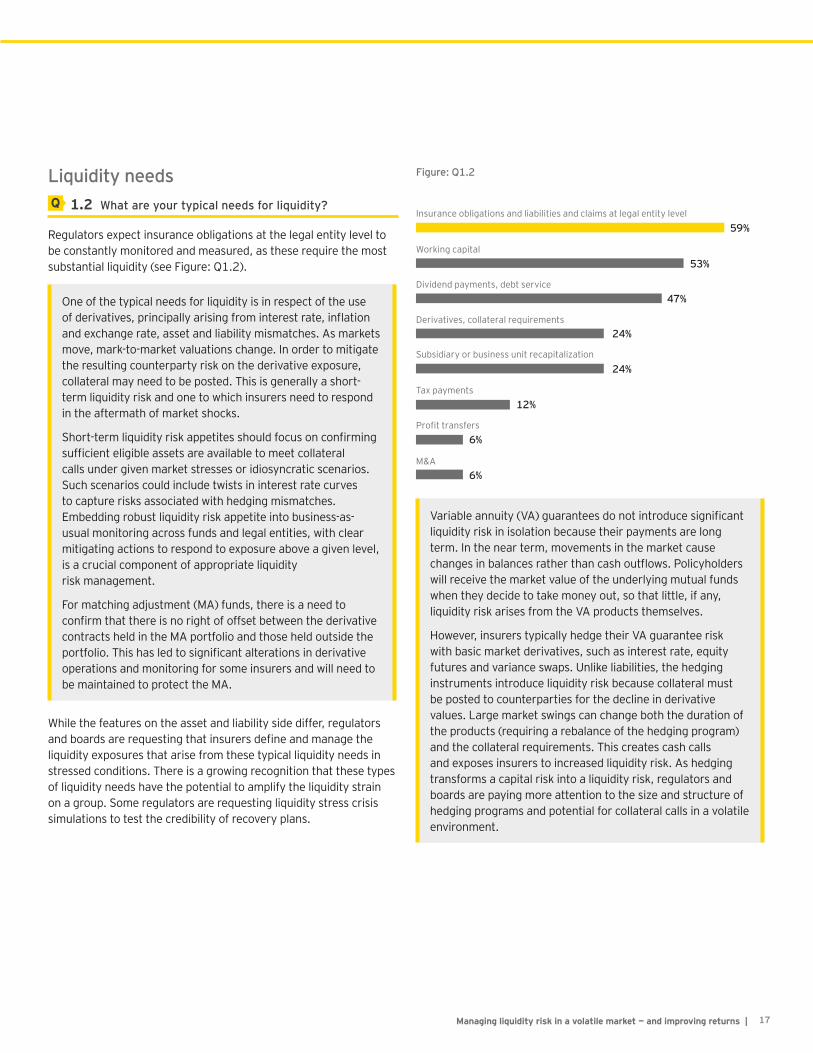
Liquidity needs 1.2 What are your typical needs for liquidity?
Regulators expect insurance obligations at the legal entity level to be constantly monitored and measured, as these require the most substantial liquidity (see Figure: Q1.2).
One of the typical needs for liquidity is in respect of the use of derivatives, principally arising from interest rate, inflation and exchange rate, asset and liability mismatches. As markets move, mark-to-market valuations change. In order to mitigate the resulting counterparty risk on the derivative exposure, collateral may need to be posted. This is generally a short-term liquidity risk and one to which insurers need to respond in the aftermath of market shocks.
Short-term liquidity risk appetites should focus on confirming sufficient eligible assets are available to meet collateral calls under given market stresses or idiosyncratic scenarios. Such scenarios could include twists in interest rate curves to capture risks associated with hedging mismatches. Embedding robust liquidity risk appetite into business-as-usual monitoring across funds and legal entities, with clear mitigating actions to respond to exposure above a given level, is a crucial component of appropriate liquidity risk management.
For matching adjustment (MA) funds, there is a need to confirm that there is no right of offset between the derivative contracts held in the MA portfolio and those held outside the portfolio. This has led to significant alterations in derivative operations and monitoring for some insurers and will need to be maintained to protect the MA.
While the features on the asset and liability side differ, regulators and boards are requesting that insurers define and manage the liquidity exposures that arise from these typical liquidity needs in stressed conditions. There is a growing recognition that these types of liquidity needs have the potential to amplify the liquidity strain on a group. Some regulators are requesting liquidity stress crisis simulations to test the credibility of recovery plans.
Figure: Q1.2
59%
53%
47%
24%
24%
12%
6%
6%
Insurance obligations and liabilities and claims at legal entity level
Working capital
Dividend payments, debt service
Derivatives, collateral requirements
Subsidiary or business unit recapitalization
Tax payments
Profit transfers
M&A
Variable annuity (VA) guarantees do not introduce significant liquidity risk in isolation because their payments are long term. In the near term, movements in the market cause changes in balances rather than cash outflows. Policyholders will receive the market value of the underlying mutual funds when they decide to take money out, so that little, if any, liquidity risk arises from the VA products themselves.
However, insurers typically hedge their VA guarantee risk with basic market derivatives, such as interest rate, equity futures and variance swaps. Unlike liabilities, the hedging instruments introduce liquidity risk because collateral must be posted to counterparties for the decline in derivative values. Large market swings can change both the duration of the products (requiring a rebalance of the hedging program) and the collateral requirements. This creates cash calls and exposes insurers to increased liquidity risk. As hedging transforms a capital risk into a liquidity risk, regulators and boards are paying more attention to the size and structure of hedging programs and potential for collateral calls in a volatile environment.
Section 3: Measurement and infrastructure
| Managing liquidity risk in a volatile market — and improving returns18
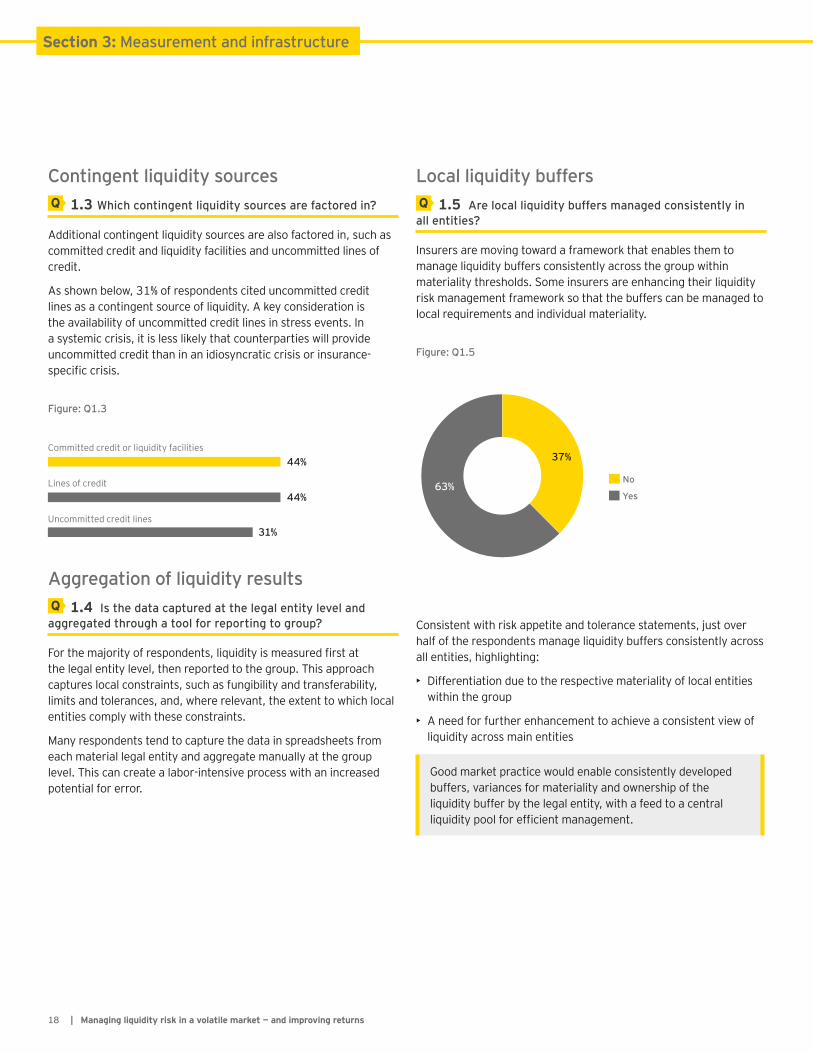
Contingent liquidity sources 1.3 Which contingent liquidity sources are factored in?
Additional contingent liquidity sources are also factored in, such as committed credit and liquidity facilities and uncommitted lines of credit.
As shown below, 31% of respondents cited uncommitted credit lines as a contingent source of liquidity. A key consideration is the availability of uncommitted credit lines in stress events. In a systemic crisis, it is less likely that counterparties will provide uncommitted credit than in an idiosyncratic crisis or insurance- specific crisis.
Figure: Q1.3
44%
44%
31%
Committed credit or liquidity facilities
Lines of credit
Uncommitted credit lines
Aggregation of liquidity results 1.4 Is the data captured at the legal entity level and
aggregated through a tool for reporting to group?
For the majority of respondents, liquidity is measured first at the legal entity level, then reported to the group. This approach captures local constraints, such as fungibility and transferability, limits and tolerances, and, where relevant, the extent to which local entities comply with these constraints.
Many respondents tend to capture the data in spreadsheets from each material legal entity and aggregate manually at the group level. This can create a labor-intensive process with an increased potential for error.
Local liquidity buffers 1.5 Are local liquidity buffers managed consistently in
all entities?
Insurers are moving toward a framework that enables them to manage liquidity buffers consistently across the group within materiality thresholds. Some insurers are enhancing their liquidity risk management framework so that the buffers can be managed to local requirements and individual materiality.
Figure: Q1.5
Yes
No
37%
63%
Consistent with risk appetite and tolerance statements, just over half of the respondents manage liquidity buffers consistently across all entities, highlighting:
• Differentiation due to the respective materiality of local entities within the group
• A need for further enhancement to achieve a consistent view of liquidity across main entities
Good market practice would enable consistently developed buffers, variances for materiality and ownership of the liquidity buffer by the legal entity, with a feed to a central liquidity pool for efficient management.

19Managing liquidity risk in a volatile market — and improving returns |
Lender of last resort 1.6 Does the parent act as lender of last resort for
subsidiaries?
For 76% of groups covered in the survey, the parent company acts as a lender of last resort. This is consistent with the view that the parent company can raise funds and/or issue debt more efficiently and effectively than a subsidiary.
As greater awareness of recovery and resolution planning develops within the insurance industry, groups are emphasizing that they are lenders but only of last resort. Therefore, subsidiaries are encouraged to develop de-risking and other mitigating actions to generate liquidity at the legal entity level before reaching to a parent in an emerging crisis. Whether the group or the legal entity undertakes the mitigating actions is a question of materiality and nature of the crisis.
For some of the largest insurers, a prudent assumption should be that under stressed conditions, liquidity is non-transferable across legal entities, unless the insurer is able to provide robust rationale for alternative assumptions, such as the existence of written and legally binding documents. The liquidity assessment should consider if and to what extent entities or subgroups of entities within the group are self-sufficient or dependent on liquidity support from other parts of the group (before and after any offsetting transactions). Complex group structures may require liquidity plans for both the group and its entities or subgroup of entities to allow a full understanding of the group’s liquidity risk.
Local entity cashflows 1.7 Is data from local entities received in detail (i.e.,
out of individual insurance models) or are proxies used to determine local liquidity requirements?
The majority of respondents have reported that they have sufficient and granular data across the group or main local entities. The data is primarily based on a combination of assets disclosure and projected cashflows. Few have models where legal entity requirements are centralized and validated by chief financial officers (CFOs).
However, it is apparent that, in some instances, board members are lacking confidence in the cashflow projections, as granular information is not readily available from legal entities under business-as-usual and stressed conditions.
Insurers are therefore embarking on projects to improve the reporting of stressed and unstressed cash flow at the legal entity level.
Figure: Q1.7
Partial/for main entities
Proxies are used to determine local liquidity requirements
Quarterly reporting based on asset and liability modeling results
Not applicable given the lack of aggregation
Is reported to group risk reporting; details unknown
Full and sufficient detail
53%23%
6%
6%
6%6%
Features of local liquidity with full and sufficient detail
Asset disclosures and cash flow projections at a local entity level are funneled up to the group.
Details are aggregated at the local entity level and funneled into the group’s treasury.
Data from local entities is received from local systems and models.
Cash needs are calculated locally using granular cashflow forecasting where available.
Features of local liquidity with partial detail
Legal entity requirements are modeled centrally, based on information provided by legal entities and validated with local CFOs. This process is maintained for a major legal entity only.
Section 3: Measurement and infrastructure
| Managing liquidity risk in a volatile market — and improving returns20
Liquidity gap analysis 1.8 Is a liquidity surplus or shortfall analysis calculated at
legal entity level? What is the frequency and process?
A number of factors are driving the frequency of liquidity gap analysis at the legal entity level:
• Materiality: Gap analysis is run with greater frequency for material legal entities than for other legal entities.
• Volatility: Market-sensitive products, including all assets and capital market liabilities, are analyzed and refreshed more frequently than for the material legal entities (e.g., monthly or weekly).
• Asset optimization: Some insurers who seek to optimize their asset yield monitor excess cash daily at each legal entity and excess cash is swept at the end of each day for most efficient investment.
The trend points toward monthly calculations for material entities, quarterly calculations for less material entities and monthly updates for market-sensitive data (investments, capital market liabilities). Furthermore, if thresholds are breached or if there is a crisis, the capability should be there to increase calculations to weekly, and in some cases, daily.
Liquidity coverage ratio (LCR) 1.9 Is LCR calculated at the group level?
1.10 Is LCR calculated at a legal entity level based on legal entity cash flows?
As noted earlier, 80% of respondents say that an LCR is included in the group liquidity policy. However, only 59% calculate the LCR at the group level. This may suggest that the LCR is used primarily at the legal entity level and that not all groups use the LCR to form a view on their exposure on an aggregate basis.
A significant portion of insurers do not capture the LCR at both group and local entity level. Yet, a number of insurers are embarking on programs to develop consistent LCR metrics for both.
Target range for LCR per legal entity 1.11 What is the target range for LCR per legal entity?
Limits and targets are specific to each group included in the survey. This is consistent with the view that the liquidity ratio should capture the specifics of each entity in terms of lines of business, asset allocation and wider considerations set out at the group level.
Broadly speaking, where the LCR is used, it ranges between 110% and 150%.
The range of responses indicates the lack of consistency in defining the LCR. While fundamentally all insurers interviewed assess their liquidity sources against the cumulative expected outflows, the threshold that they apply and the escalation process attached to breaches of these limits vary significantly.
Some respondents assign limits for different time horizons, distinguishing between short-term liquidity requirements and short-to mid-term requirements. For example, for several insurers, a lower LCR of 1.2 is required for a longer time horizon and a higher LCR of 1.5 is required in a shorter time horizon. Good practice is demonstrated by higher LCRs for short-term survival, e.g., 1.3 to 1.5, and lower LCRs for 12-month survival, e.g., 1.1 to 1.2.

21Managing liquidity risk in a volatile market — and improving returns |
Transferability of excess liquidity between legal entities
1.12 Under which assumptions is excess liquidity not transferable between legal entities?
There can be significant restrictions to transferring liquidity and funds, as shown in the survey findings. As a result, insurers are putting structures in place that enable them to improve the fungibility of the funds, for example, cash pooling and intercompany loans. The majority of the respondents assume that excess liquidity either is not transferable or restricted by regulation.
Some respondents pointed out that internal thresholds or restrictions are in place that only consider excess liquidity as transferable if the legal entity’s liquidity situation is not endangered. Ring-fencing and firewall restrictions between legal entities were also mentioned under regulatory restrictions.
Figure: Q1.12
44%
31%
25%
Restricted by regulation
Other
Not transferable
Technology infrastructure for liquidity risk
2.1 Describe the technological infrastructure utilized for liquidity risk
We see the current state as being fragmented and manual, based mostly around spreadsheets to overcome lack of automated systems or limitations in existing systems. Spreadsheets are presently the dominant liquidity risk management tool in the industry. A variety of manual processes and a fragmented, ad hoc user experience are the main takeaways from our research.
Two respondents have invested in automated infrastructure, including multiple data feeds from asset and liability systems with built-in calculation engines. Our understanding is that other insurers are considering building infrastructure to enhance their liquidity reporting.

Section 3: Measurement and infrastructure
| Managing liquidity risk in a volatile market — and improving returns22
Infrastructure built upon multiple spreadsheets and business units across many jurisdictions (with several handoffs) has a long lead time to produce the liquidity report. Multiple handoffs and lagging reporting also can impede effective escalation and agility in a crisis.
Measurement
57%29%
14%
Vendor
In-house build
Spreadsheets
Analysis
Vendor
In-house build
Spreadsheets
54%31%
15%
Monitoring
Vendor
In-house build
Spreadsheets
67%
20%
13%
Reporting
Vendor
In-house build
Spreadsheets
79%
14%
7%
Figure: Q2.1

23Managing liquidity risk in a volatile market — and improving returns |
Frequency of liquidity risk reporting 2.2 What is the frequency of liquidity risk reporting and
format (e.g., dashboards, spreadsheets, graphical solutions)?
The lack of a regulatory mandate for daily or weekly liquidity reporting, coupled with the fragmented, manual nature of the tools, leads to monthly or quarterly reporting. To increase the frequency to weekly or daily, automated processing and a better reporting platform than spreadsheets will need to be developed.
A pragmatic compromise between the two forms of reporting is where a company reports on a quarterly basis and refreshes monthly when volatility is greater. This hybrid approach enables the group to monitor its liquidity with sufficient frequency on a proportionate basis. Creating monthly summary spreadsheets is a practical approach to contain the workload while also providing appropriate visibility.
A number of different approaches have been observed, with the frequency usually linked to the volatility in the information reported. In case of a breach, the frequency would also escalate.
• Holding company monthly, business units quarterly
• Group summary monthly, a more detailed report for the entire group quarterly
• Quarterly, with monthly simplified refresh of the more volatile positions
• Daily for cash positions
Two-thirds of the respondents report using a variety of spreadsheets and graphs; some of the more advanced have structured dashboards.
Figure: Q2.2
16%
8%
32%
44% Quarterly
Daily
Weekly
Monthly
22%
39%
39%
Graphs
Dashboard
Spreadsheets

Section 3: Measurement and infrastructure
| Managing liquidity risk in a volatile market — and improving returns24
Review frequency of the infrastructure 2.3 What is the review frequency of the infrastructure
and its resulting reports — and who takes part?
Nearly half of respondents review their infrastructure and systems on an annual basis.
Typical of emerging practices, liquidity risk management is managed through a process of multiple handoffs between stakeholders across the first and second lines of defense. There is room for improvement to streamline process flows between stakeholders, as shown in the table below. Insurers deploy a number of different structures for review and approval of liquidity risk reporting.
Second and third lineExamples: internal audit and risk
Second lineExamples: group risk, capital and liquidity management team
First and second lineExamples: (group) treasury, management teams, risk, ALM, reporting service center, modeling teams, LWG, investment office
First lineExamples: management teams, board, ALCO
Measures to assess exposures 2.4 Which types of advance liquidity measures are used
to assess exposures?
We believe that the use of intercompany and intraday exposure monitoring would increase if there was a more robust liquidity risk management framework in place.
Figure: Q2.4
93%
73%
20%
7%
47%
60%
Multi-scenario stress testing
Varying survival horizons
Contingent liabilities
Intercompany exposures
Intraday exposures
Sensitivity reports
Legal entity liquidity reporting 2.5 How do legal entities report liquidity to group?
Legal entity reporting of liquidity is being developed by a number of insurers. Those that have a process have developed a risk-centric reporting structure where regional chief risk officers (and teams) are responsible for analyzing stress testing results in the region and submitting them to the central team (corporate treasury, ALM or risk) for review and consolidation. The insurers who are enhancing their approach currently submit spreadsheet templates from the legal entity to the group.
A more robust risk management framework would allow full group aggregation, daily reporting, central stress test planning and better tools to support this function.
Figure: Q2.5
8%
31%
61%
Graphs
Dashboard
Spreadsheets

25Managing liquidity risk in a volatile market — and improving returns |
2.6 Is the reporting process standardized across all legal entities?
One of the key findings in the survey has been the lack of consistency in legal entity reporting. As a result, board members have indicated in some groups that they do not feel that they have confidence over the cashflow projections at the legal entity level. Standardization across all legal entities would be achievable with a more robust risk management framework.
Connectivity between liquidity and other drivers of the business
2.7 Describe the connectivity between the liquidity and capital infrastructure with finance, capital, business strategy, investments and collateral management infrastructures .
Survey responses highlight that partial integration and connectivity between the liquidity and capital infrastructure with finance, capital, business strategy, investments and collateral management infrastructures has been achieved. As more robust tools and automated processes are built, we expect this connectivity to increase significantly.
Centralized liquidity reporting 2.8 Has the report generation been moved to a reporting
function or is it operated by the original creators?
Creating a centralized reporting function will adhere better to the principle of segregation of duties and will be enabled by more automated tools and processes. Nearly two-thirds of respondents prefer report generation by original creators.
Liquidity data 2.9 How is liquidity data sourced?
We note significant manual processes in data acquisition and aggregation and view this as a significant capability gap across the industry. The more advanced insurers have begun to use aggregation tools, which include in-house tools where entities are visible in a central system, while others have chosen market vendors. Typically, the aggregation is done using a program that applies specified requirements to the data pooled from the source data feeds. A set of automated tools will enable automatic, cleansed data acquisition, rules-based data aggregation and profiling, and a significant uplift in the quality of the data being used across the whole spectrum of risk.
When asked if a group aggregation tool is used for data aggregation, 75% of respondents said “yes.”
Figure: Q2.9
69%
15%
8%
Manually
Automated
Mix

Section 3: Measurement and infrastructure
| Managing liquidity risk in a volatile market — and improving returns26
Calculation engines for liquidity 2.10 Describe the main calculation engines at
legal entity level .
2.11 Describe the main calculation engines at group level .
The industry uses a combination of spreadsheet-based and other in-house proprietary calculation engines. However, a more centralized, industry-standard calculation function customized for each entity’s unique calculation needs, would enhance the efficiency and governance of a group’s liquidity risk management. At the legal entity level, more in-house systems are cited, which may indicate that vendor applications are installed at the parent level.
The lack of automated tools and central calculation functions precludes most of the industry from automating its calculations at the group level. This is a significant gap in the industry and a place where automating, centralizing, and controlling would add significant value.
Figure Q2.10
15%
40%
45%In-house build
Vendor
Spreadsheets
Figure: Q2.11
28%
28%
44%Vendor
In-house build
Spreadsheets
Liquidity risk management infrastructureThere are two alternative approaches for liquidity risk management and reporting infrastructures:
1. An in-house solution to centralize and aggregate data would be a useful short-term approach to mitigate gaps in the systems infrastructure. These tools could include spreadsheets and modeling add-ons, databases, reporting and data visualization tools, and cloud infrastructures to centralize the data manipulation, storing, modeling and reporting without a huge investment of time and money.
2. A longer term strategy focuses on an enterprise-wide liquidity risk management solution. This is where we see the industry heading in the next one to three years due to evolving regulatory pressures, cost efficiencies and the need for increased visibility.
Most companies will benefit immediately from the first approach. Planning for the second approach can begin in parallel.

27Managing liquidity risk in a volatile market — and improving returns |
4 Stress and scenario testing

Section 4: Stress and scenario testing
| Managing liquidity risk in a volatile market — and improving returns28
Liquidity model 1.1 What output does the liquidity model produce?
Baseline information is collected at the legal entity level, and most insurers collect results for the nominal assessment of liquidity. However, in order to improve visibility, regular measurement and monitoring should be extended to the LCR, providing insurers with more meaningful reporting and the capability to increase frequency of reporting in a crisis.
Other measures cited include surplus liquidity, liquidity gaps and mismatches over different periods, and measuring the impact on expected investment decisions during the planning period.
Figure: Q1.1
75%
50%
25%
31%
Projection of surplus liquidity for next X months
Simply a current surplus liquidity number
Liquidity ratios
Liquidity requirement or gap for different confidence levels
Combined scenarios 1.2 Do you stress combined scenarios?
Nearly three-quarters of respondents (73%) create combined scenarios for liquidity stress testing, which provides a more realistic view of the more severe liquidity scenarios that could impact insurers.
More than a quarter either do not create combined scenarios and only run single stresses for liquidity or do not create separate stresses for liquidity outside of the Own Risk and Solvency Assessment (ORSA). Insurers who rely on ORSA scenarios to assess stressed liquidity tend to run capital-led scenarios and assess the resulting liquidity impact.
Over time, we expect to see more insurers running liquidity-led combined scenarios. In particular, a few of the respondents noted that the liquidity-led scenarios enable them to test their liquidity buffers, which are key if they have an ambitious M&A strategy.
Risk drivers 1.3 What are the risk drivers?
The results show that most companies converge around using interest rates, equity, foreign exchange and credit spreads as risk drivers for liquidity stress and scenario testing. These align with some of the main Solvency II market shocks. Surprisingly, however, 20% do not use interest rates as a driver of liquidity risk despite the low interest rate environment.
Accurately capturing the threats to insurers’ liquidity from these sources will enable firms to conserve and make better use of their liquidity. Those companies that have detailed knowledge of when liquidity will be tighter are better able to use the illiquidity of their liabilities to capture an illiquidity premium on the asset side of the balance sheet.
Credit and counterparty risk are clearly seen as key risk drivers for liquidity. In both cases, the risk is that cash flow is interrupted by default from an obligor. A default of this type may interrupt cash flows far into the future rather than immediately. This may explain why these risks have been chosen less frequently as risk drivers than some of the market risk drivers.
One firm raised “collateral and margining requirements” as a risk driver for liquidity needs and a mitigation measure for credit risk. In extreme situations, liquidity and collateral requirements effectively become the same.
Insurance loss drivers converge around the usual themes in life and non-life business, and these also align with Solvency II approaches.
Typical risk drivers reported under scenario risk include:
• Eurozone sovereign debt crisis with stresses for premium and claims payment
• Global financial collapse combined with mass lapses and/or natural catastrophes
• Systemic global financial crisis with an industry-wide one-notch financial strength rating downgrade
• Severe market shock, including a life-specific shock and two-notch rating downgrades
Most insurers have found that they need combined stress events to test the breach of liquidity thresholds, which typically necessitate more severe calibration than market, credit or insurance loss events on their own.

29Managing liquidity risk in a volatile market — and improving returns |
88%
75%
38%
13%
56%
69%
Interest rates
Foreign exchange
Equity (listed, non-listed)
Credit spread
Property
Alternative investments or hedge funds
Market
82%
64%
9%
Credit risk (assets)
Counterparty risk
Collateral and margining requirement
Credit
80%
73%
47%
27%
53%
53%
Mass lapse
Catastrophe events
Mortality
Pandemics
Longevity
Weather
Insurance
63%
38%
13%
Global financial collapse
Eurozone collapse
Entity-specific scenarios
Scenarios
Liquidity model — factors, frequency 1.4 How many risk factors are included within the
liquidity model?
1.5 How frequently is the full liquidity model run?
The majority of liquidity models draw upon diverse liquidity risk factors, with five to 10 factors the most popular choice.
Figure: Q1.4
31%
31%
38%
More than 10
Less than fivefive to 10
The most frequent response was quarterly; however, insurers modify frequency based on materiality of entities, whereby material entities run the model monthly and non-material entities refresh calculations on an annual basis. One insurer re-calibrates the stress parameters annually. The trend is toward full model runs on a quarterly basis for the whole group, with a focus on increasing the frequency for material entities.
Figure: Q1.5
47%
18%
6%
11%
18%
Quarterly
Monthly
Annually
Ad hoc
Three times per year
Figure: Q1.3
Section 4: Stress and scenario testing
| Managing liquidity risk in a volatile market — and improving returns30
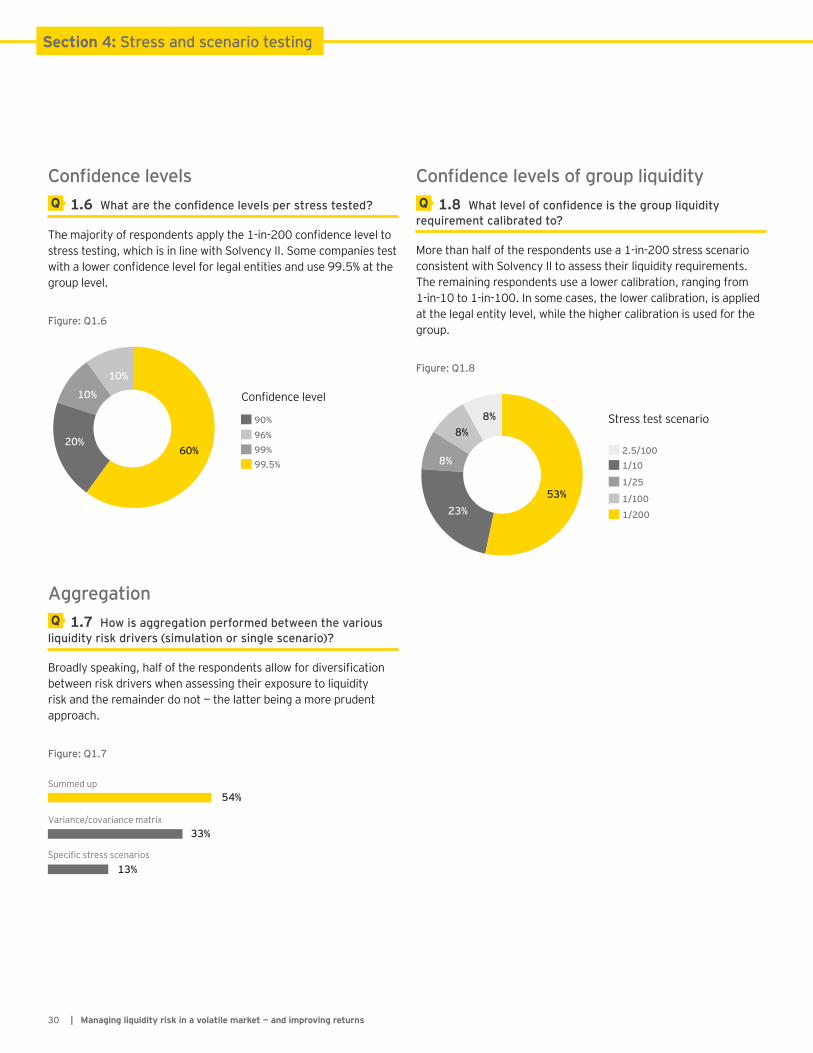
Confidence levels 1.6 What are the confidence levels per stress tested?
The majority of respondents apply the 1-in-200 confidence level to stress testing, which is in line with Solvency II. Some companies test with a lower confidence level for legal entities and use 99.5% at the group level.
Figure: Q1.6
10%
10%
20%60%
90%
99%96%
99 .5%
Aggregation 1.7 How is aggregation performed between the various
liquidity risk drivers (simulation or single scenario)?
Broadly speaking, half of the respondents allow for diversification between risk drivers when assessing their exposure to liquidity risk and the remainder do not — the latter being a more prudent approach.
Figure: Q1.7
Summed up
Variance/covariance matrix
Specific stress scenarios
54%
33%
13%
Confidence levels of group liquidity 1.8 What level of confidence is the group liquidity
requirement calibrated to?
More than half of the respondents use a 1-in-200 stress scenario consistent with Solvency II to assess their liquidity requirements. The remaining respondents use a lower calibration, ranging from 1-in-10 to 1-in-100. In some cases, the lower calibration, is applied at the legal entity level, while the higher calibration is used for the group.
Figure: Q1.8
1/10
1/25
1/100
2 .5/100
1/200
53%23%
8%
8%8%
Confidence level
Stress test scenario

31Managing liquidity risk in a volatile market — and improving returns |
Liquidity risk drivers used in scenarios 1.9 Which of the following IAIS components are included
in your scenarios?
International insurers have, to some degree, incorporated the principles of emerging guidance on liquidity risk.1 As local regulators focus on liquidity pressures in a crisis, and regulatory bodies become more vocal about increased liquidity exposure for insurers, it is likely that these principles will be translated into local requirements.
The figure below outlines potential drivers of liquidity risk, for non-traditional and non-insurance activities, in particular liquid liabilities and concentration in exposure in assets and certain counterparties.
Figure: Q1.9
100%
100%
85%
85%
77%
77%
Depth and liquidity of capital markets, including liquidity characteristics of the assets
Features of insurance policies and products
(Changes in) behavior of policyholders and other market participants, both gradual and sudden
Nature, frequency and severity of exposures to insurable events, including catastrophic events
Encumbrances on assets and rehypothecation of assets
Trigger clauses and other contingent obligations for cash or collateral
69%
62%
54%
46%
31%
8%
(Changes in) market conditions that will affect payment obligations
(Changes in) own creditworthiness, including rating downgrades, both gradual and sudden
Interaction (potential correlation) of liquidity sources and liquidity needs
The specific liquidity characteristics of any non-traditional or non-insurance activities
Concentration of exposure in certain assets and to certain counterparties
Risk of non-convertibility of currencies
Categorizing the quality of available liquidity
1.10 Does the model output categorize the quality (or asset class) of available liquidity?
Survey respondents overwhelmingly favor (73%) the quality of assets that back liquidity coverage in their modeling.
In the 2008 liquidity crisis, supposedly liquid instruments, such as corporate bonds, became very illiquid. Appropriate scoring of the “liquidity quality” of backing assets, which may differ in riskiness from a capital point of view, is an important building block to truly understand the liquidity of an insurance balance sheet.
Liquidity sources and needs stressed at legal entity and group level
1.11 Are the liquidity sources and needs stressed at legal entity and at group level?
The majority of respondents (81%) conduct stress and scenario testing at the group and legal entity level to some extent. Across multiple markets, boards and regulators are beginning to request liquidity stress testing not just at the group level but also group-wide, including material legal entities.
As an initial phase, some insurers focus on pilot material legal entities to apply stress testing parameters developed by the group, with a view to wider roll out to group material legal entities over the next 12 to 18 months.
Legal entities that apply the volatility adjustment are required to develop and submit liquidity risk management plans as part of Solvency II. Equally, we are seeing a number of insurers requesting that legal entities develop their own stresses based on their local situation.
“Belt and braces” is the answer; choosing either to stress liquidity at only group or legal entities is seen as inadequate as the focus on liquidity risk management increases.
1 For example, IAIS Guidance on Liquidity Management (October 2014); European Systemic Risk Board Report on systemic risks in the EU insurance sector focusing partly on liquidity risk (December 2015); Consultation on a Liquidity Risk-Management Standard published by board of Governors of the Federal Reserve System (June 2016).
Section 4: Stress and scenario testing
| Managing liquidity risk in a volatile market — and improving returns32
Separate scenarios per legal entity and group
1.12 Are there separate scenarios defined per legal entity and group?
In addition to group scenarios, 53% of respondents have separate scenarios defined for legal entities. In stark contrast, 47% apply only the same scenarios.
Implementing a robust liquidity risk framework involves developing scenarios at the group level and issuing instructions for calculating legal entity results within the group’s parameters. This is in addition to numerous scenarios developed by each of the material legal entities to address their specific risk profiles. Without specific scenarios for legal entities, an insurer is unable to measure its liquidity risk exposure adequately.
Moreover, only developing scenarios for the legal entities and not stressing group liquidity creates other issues. It ignores the exposures a group holding can face for non-payment of dividends or inability to service debt.
Impact of stresses on dividend up-streaming
1.13 Do you consider the stress scenario impact on dividends and potential resulting restrictions on dividend up-streaming?
As expected, three-quarters of respondents consider the stressed impact on dividends and potential restrictions on dividend up-streaming in stressed conditions. However, insurers who do not assess the stressed impact on dividends have less clarity on overall group liquidity in a crisis.
As regulators and boards focus more on solvency in a crisis, the impact of stressed conditions of group liquidity becomes more important. Even insurers who currently assess stress impacts on dividends are enhancing their stress tests, not only for survival in a crisis, but also to capitalize on the upside and determine the amount of available liquidity to optimize investments.
When defining asset allocation strategies, companies may wish to consider including corporate finance liabilities, such as dividends or interest payments. Although dividends are true liabilities only when declared, external investors and internal stakeholders will tend to expect dividends to be maintained. Asset allocation could reflect this as sufficient liquid assets, or cash flow could be built into the allocation in order to meet these dividend payments, even in times of liquidity stress.
33Managing liquidity risk in a volatile market — and improving returns |
Measures to restore liquidity 1.14 Do the legal entities have measures to restore
liquidity at the legal entity level without resorting to cash from their parent?
In the majority of instances (81%), legal entities are encouraged to explore their options to generate liquidity locally. Some of the available measures are listed below.
• Sale of assets: adjust asset portfolio composition
• Cancellation of planned purchases of assets
• Usage of committed bank lines
• Repurchase agreement
• Apply for cash pooling transfer of funds
• Contingent liquidity facility
• Debt or equity issuances
• Intercompany loans
• Short-term revolving loans
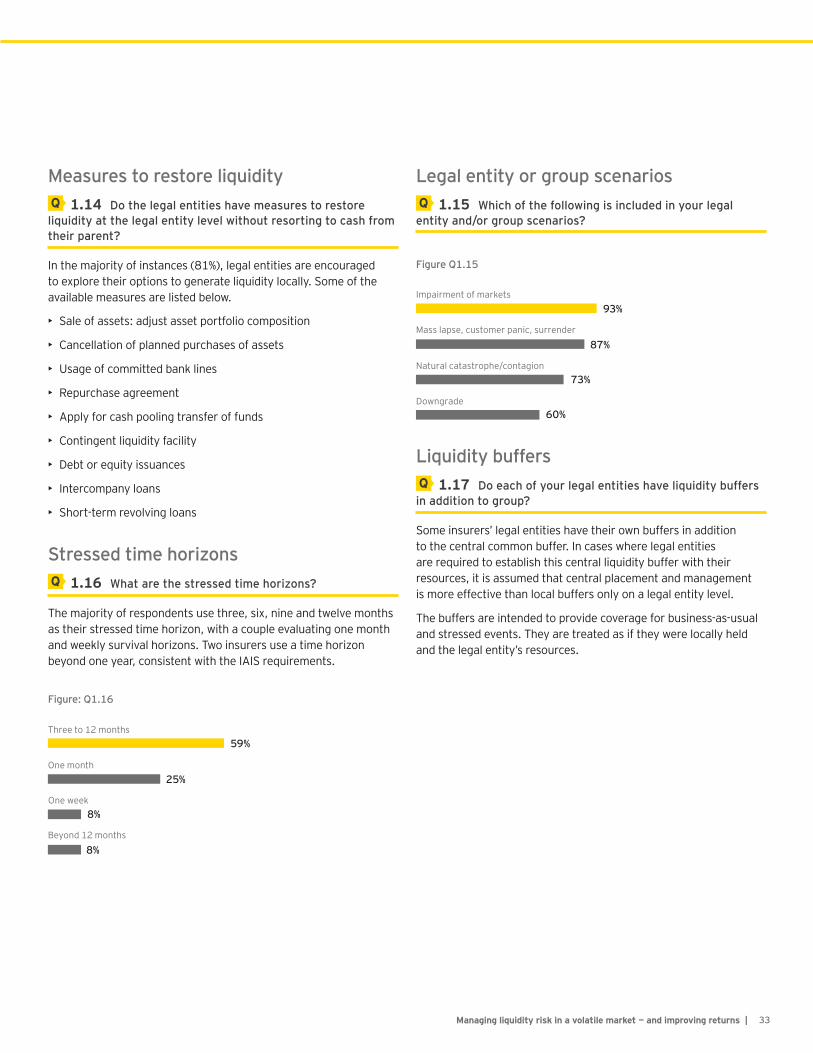
Stressed time horizons 1.16 What are the stressed time horizons?
The majority of respondents use three, six, nine and twelve months as their stressed time horizon, with a couple evaluating one month and weekly survival horizons. Two insurers use a time horizon beyond one year, consistent with the IAIS requirements.
Figure: Q1.16
Three to 12 months
One month
One week
Beyond 12 months
59%
25%
8%
8%
Legal entity or group scenarios 1.15 Which of the following is included in your legal
entity and/or group scenarios?
Figure Q1.15
Impairment of markets
Mass lapse, customer panic, surrender
Natural catastrophe/contagion
Downgrade
93%
87%
73%
60%
Liquidity buffers 1.17 Do each of your legal entities have liquidity buffers
in addition to group?
Some insurers’ legal entities have their own buffers in addition to the central common buffer. In cases where legal entities are required to establish this central liquidity buffer with their resources, it is assumed that central placement and management is more effective than local buffers only on a legal entity level.
The buffers are intended to provide coverage for business-as-usual and stressed events. They are treated as if they were locally held and the legal entity’s resources.

Section 4: Stress and scenario testing
| Managing liquidity risk in a volatile market — and improving returns34
Liquidity gap analysis 1.18 Is a regular liquidity gap analysis conducted
(liquidity surplus analysis)?
An overwhelming 88% of respondents replied “yes” to conducting a liquidity gap analysis, and when asked if the analysis was conducted at a group and legal entity level, 60% agreed that it was. The most common frequency for conducting a liquidity gap analysis is quarterly on a specified template, with an agreed-upon methodology.
1.20 Is the liquidity gap projected over time, current conditions and stressed scenarios (three, six, nine or twelve months, two or three years)?
The majority of respondents calculate liquidity gaps under current and stressed scenarios. The time horizons encompass a variety of responses, ranging from one month to up to five years, while the majority focus on an average of three-time buckets within the twelve–month period.
While regulators currently focus on a time horizon of up to one year, the expectation is clearly for the horizon to be extended out to three to five years.
Figure: Q1.20
Three to 12 months
Three months to three years
No
One to 12 months
38%
31%
23%
8%

Conclusion
Managing liquidity risk in a volatile market — and improving returns | 35
The evolution of liquidity risk management is likely to continue along its recent trajectory of balancing the needs of an insurer to survive a crisis with optimizing liquid assets for yield .
Those companies capable of enhancing their liquidity risk management framework will be best positioned to help their organizations manage and survive proliferating liquidity risks in a volatile market and optimize their liquid assets in business-as-usual . Their success will be underpinned by robust stress testing, transparent metrics and reporting, early escalations and overall strategic liquidity management .
The liquidity risk exposure of an insurer comprises the characteristics of the organization’s assets and liabilities, its internal structure, and market behavioral factors. Close management and careful fine-tuning of the liquidity risk framework are essential to help the firm survive in extreme stress and optimize assets without undue strain in less stressed conditions .
It is hardly surprising, therefore, that this survey reveals that insurers are considering what aspects of their firms’ liquidity risk management should be addressed to improve transparency and agility as boards and regulators require greater focus on strategic liquidity management .

How EY can help
Our firm has been working with seven out of nine G-SIIs and multiple international and domestic insurers to help them develop recovery, resolution and liquidity risk management plans. We have also supported multiple programs focusing on improved liquidity risk management.
| Managing liquidity risk in a volatile market — and improving returns36

Our globally connected teams can support insurers in the following ways:
• Conducting diagnostic assessments to benchmark current liquidity risk management against peers and leading practices
• Enhancing liquidity policies, metrics and contingency funding plans
• Developing recovery plans and liquidity risk management plans
• Supporting stress testing and development of liquidity models
• Supporting regulatory applications for matching adjustment approvals and volatility adjustment approvals
• Designing improved infrastructure and reporting for liquidity management
• Developing a liquidity risk framework to improve chances of survival in liquidity-led volatility
• Improving risk-adjusted return on capital by enhancing use of liquid assets
37Managing liquidity risk in a volatile market — and improving returns |

| Managing liquidity risk in a volatile market — and improving returns38
Subject matter advisorsLiquidity infrastructureDavid B Holtzman+1 215 841 [email protected]
Bob Candella+1 212 773 [email protected]
Yiannis Antoniou+1 212 773 [email protected]
Asset optimization Treasury and transactionsGareth Mee+44 20 7951 [email protected]
Gareth Sutcliffe+44 20 7951 [email protected]
Simon Woods+44 20 7980 [email protected]
G-SII liquidity risk managementKabari Bhattacharya+44 20 7951 [email protected]
Bouke Evers+31 88 407 [email protected]
Mark Gorman+44 20 7951 [email protected]
Insurance Liquidity Risk Management Region LeadsBonny FuEY Asia-Pacific+86 10 5815 [email protected]
Pierre PlanchonFrance+33 1 46 93 62 [email protected]
Bernd Michael FröhlerGermany+49 89 14331 [email protected]
Dario ZuppiItaly+39 [email protected]
Tom de KuijperNetherlands+31 88 40 [email protected]
Marcin [email protected]
Giselle LimSwitzerland+41 58 286 [email protected]
Wendy LucasSwitzerland+41 58 286 [email protected]
Kabari BhattacharyaUK+44 20 7951 [email protected]
Diego Jimenez-HuertaUK+44 20 7951 [email protected]
Rick MarxUS+1 212 773 [email protected]
Chad RuncheyUS+1 212 773 [email protected]
Central Global Liquidity Risk Management Leads
Martin Bradley+44 20 7951 [email protected]
Jeff Davies+44 20 7951 [email protected]
Kabari Bhattacharya+44 20 7951 [email protected]
Peter Marshall+1 212 773 [email protected]
Key contacts

39Managing liquidity risk in a volatile market — and improving returns |
Notes

EY | Assurance | Tax | Transactions | AdvisoryAbout EYEY is a global leader in assurance, tax, transaction and advisory services. The insights and quality services we deliver help build trust and confidence in the capital markets and in economies the world over. We develop outstanding leaders who team to deliver on our promises to all of our stakeholders. In so doing, we play a critical role in building a better working world for our people, for our clients and for our communities.
EY refers to the global organization, and may refer to one or more, of the member firms of Ernst & Young Global Limited, each of which is a separate legal entity. Ernst & Young Global Limited, a UK company limited by guarantee, does not provide services to clients. For more information about our organization, please visit ey.com.
Ernst & Young LLP is a client-serving member firm of Ernst & Young Global Limited operating in the US.
© 2016 Ernst & Young LLP. All Rights Reserved.
EYG no. 02130-164Gbl 1605-1932278 ED None
This material has been prepared for general informational purposes only and is not intended to be relied upon as accounting, tax or other professional advice. Please refer to your advisors for specific advice.
ey .com

41Managing liquidity risk in a volatile market — and improving returns |