managing legacy portfolios with concentrated positions · managing legacy portfolios with...
TRANSCRIPT

For Investment Professional Use Only
Managing Legacy Portfolios with Managing Legacy Portfolios with Concentrated PositionsConcentrated Positions
Sandy Warrick, CFASandy Warrick, CFANorthfield Research ConferenceNorthfield Research Conference
Squaw Valley CaliforniaSquaw Valley CaliforniaMarch 2008March 2008

For Investment Professional Use Only
2
The ProblemThe ProblemLegacy Portfolios are often poorly diversified with low cost basis.
• This makes it expensive to trade to a “better” portfolio that:
• More properly suits the investor’s risk and return preferences.
• Is more timely with regard to investment opportunities arising from active management.
Paying long term capital gains taxes to diversify the portfolio may be in the investor’s best interest
• But many investors are tax-phobic and place constraints on the maximum tax they are willing to pay.
How do we manage the portfolio with respect to the realization of capital gains, both short term long term resulting from very low cost basis concentrated positions?

For Investment Professional Use Only
3
Concentrated PortfoliosConcentrated PortfoliosOf the many reasons why investors have concentrated portfolios, two are typical:• A senior manager of a company accumulates a large single stock position
in their employer through options or stock grants.• For various contractual and career reasons, managers must continue to hold that
position during their employment.
• A bank trust department manages a trust portfolio for decades. • This portfolio creates income for the beneficiary but transfers to the remainder-
persons at a low cost basis.
• Typically these portfolios have 50 or less dividend paying “blue-chip” mega-cap stocks.
• The higher yield stocks allow for a high distribution to the beneficiary while still holding equities.
• The managers tend to favor very low turnover and a very low cost basis
• These portfolios have about 6-10% tracking error to S&P 500 or the Russell 1000.

For Investment Professional Use Only
4
Literature Prior to 1994Literature Prior to 1994Talmor, Eli. “Personal Tax Considerations in Portfolio Construction: Tilting the Optimal Portfolio Selection,” Quarterly Review of Economics and Business, 1985
Fedenia, M. and T. Grammatikos. “Portfolio Rebalancing and The Effective Taxation of Dividends and Capital Gains Following the Tax Reform Act of 1986,” Journal of Banking and Finance, 1991
Fisher, Dann, David O’Bryan, Tom Schmidt and James Parker. “Portfolio Optimization Subject to Tax Bracket Constraints: A Linear Programming Approach,” Journal of the American Taxation Association, 1992.
Arnott, Robert and Robert Jeffrey. “Is Your Alpha Big Enough to Cover its Taxes,” Journal of Portfolio Management, Spring 1993.
Dickson, Joel M. and John Shoven, “Ranking Mutual Funds on an After-Tax Basis,” Working Paper 4393, National Bureau of Economic Research, 1993
Dickson, Joel M. and John Shoven, “A Stock Index Mutual Fund without Net Capital Gains Realizations,” Working Paper 4717, National Bureau of Economic Research, 1994

For Investment Professional Use Only
5
Literature Between 1996 and 2000Literature Between 1996 and 2000
Apelfeld, Roberto, Gordon Fowler and James Gordon, “Tax Aware Equity Investing,” Journal of Portfolio Management, Winter 1996.
Apelfeld, Roberto, Michael Granito and Akis Psarris. “Active Management of Taxable Assets: A Dynamic Analysis of Manager Alpha," Journal of Financial Engineering, 1996
Garland, James, “The Advantages of Tax-Managed Index Funds," Journal of Investing, Spring 1997
Gulko, Les. “An After-Tax Equity Benchmark," General Re Working Paper, 1998
Stein, David, “Measuring and Evaluating Portfolio Performance After Taxes," Journal of Portfolio Management, 1998.
Wolfson, Neil, “Tax Managed Mutual Fund and the Taxable Investor," KPMG Working Paper, New York, 2000.
Dickson, Joel M. and John Shoven, “Tax Externalities of Equity Mutual Funds,”Working Paper 7669, National Bureau of Economic Research, 2000

For Investment Professional Use Only
6
Literature after 2000Literature after 2000
We now get entire books written about tax efficient investment management and concentrated wealth in particular.• Kochis, Tim, Managing Concentrated Stock Wealth, Bloomberg Press, 2005
• Rogers, Douglas, Tax Aware Investment Management, Bloomberg Press, 2006
• Wilcox, J., diBartolomeo, D. and Horvitz, J., Asset Management for Private Investors, CFA Institute, 2005
• Wilcox, Jarrod. “Harry Markowitz and the Discretionary Wealth Hypothesis,” Journal of Portfolio Management, 2003.
• Horvitz, Jeffrey and Jarrod Wilcox. “Know When to Hold ‘em and Know When to Fold ‘em,”Journal of Wealth Management, 2003.

For Investment Professional Use Only
7
Long Term vs. Short Term Capital GainsLong Term vs. Short Term Capital Gains
Avoiding net short term gains should be the key goal of tax-management of assets that are matched to lifetimespending goals.
We can calculate the expected value of compounding deferral of long-term capital gains for different horizons.• This allows the returns to compound at a higher rate than the
discounted taxes, increasing the NPV of the tax deferral.
The actual value of tax deferral is higher than the tax burden because it is the investor’s option as to when to realize long term capital gains based on current future tax considerations and changing preferences between investment and consumption.

For Investment Professional Use Only
8
The Optionality of Long Term Capital GainsThe Optionality of Long Term Capital GainsWith concentrated stock positions, you have the option of being able to avoid taxes on low cost basis assets by:• Selling them at a later time when you might be in a lower tax bracket. This is unlikely,
but possible, for high net worth investors.
• Putting them in an exchange fund and exchange liquidity for diversification.
• Collaring them to reduce the chance of a major melt-down severely reducing terminal wealth.
• Enron or any of the high-flying tech stocks like Sun Microsystems that crashed and have never come back.
• You can estimate the collar’s delta and use Northfield’s composite asset feature to estimate portfolio risk reduction as the stock price evolves.
• Having them step up in cost basis as part of your estate.
• Putting them in a trust that will continue for several more generations.
• Giving them to charity and avoiding taxes altogether.
• Making gifts to children, grandchildren or great-grandchildren can lower tax rates or postpone estate taxes for a century or more.

For Investment Professional Use Only
9
How Much Do You Intend to Spend?How Much Do You Intend to Spend?Jarrod Wilcox introduces the idea that one’s risk preferences are a function of both capital market expectations and the ratio of total to discretionary assets.
• Discretionary assets are those that you do not intend to match your planned lifetime spending (liabilities).
• Leverage is the ratio of your total assets to your total liabilities
• How do you estimate your liabilities?
• Hire Jarrod and he will do it for you.
• Tim Kochis (Managing Concentrated Stock Wealth) will, too.
• Many financial planners estimate your lifetime spending needs.
• Other financial advisors can provide you with an “optimal model portfolio” and you can use Wilcox’s utility equation to estimate your implied liabilities relative to your financial assets.

For Investment Professional Use Only
10
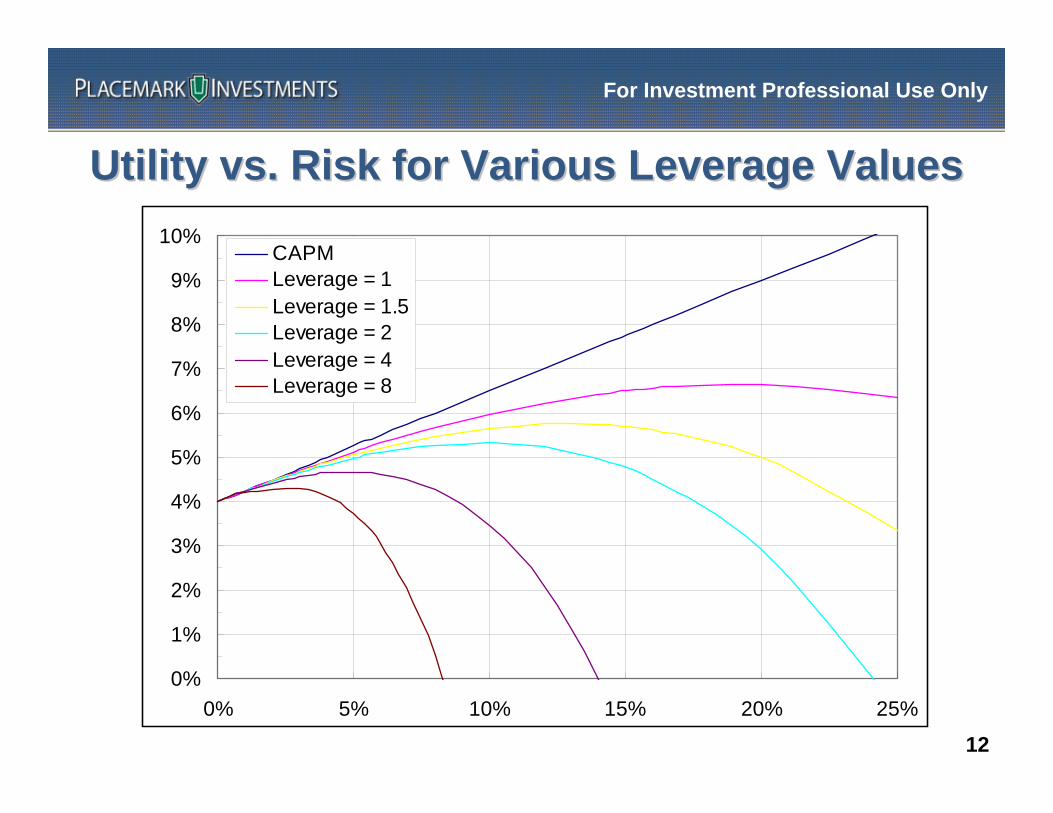
WilcoxWilcox’’s Equation for Utilitys Equation for UtilityUtility = L × E[r] – L2 × σ2/2 + L3 × Skew × σ3/3 – L4 × Kurtosis × σ4/4
where:E[r] = Expected returns, net of taxes
L = Leverage = Assets / (Discretionary Wealth)
Discretionary Wealth = Assets – Liabilities
Liabilities are the net present value of the expenses that must be met in order to meet the specified minimal acceptable living standard.
σ = portfolio standard deviation of the after tax returns.
Skew: Negative skew implies that large negative returns are more likely than predicted by a normal distribution.
Kurtosis: The kurtosis of a normal distribution is equal to 3, not zero.A distribution with a kurtosis that exceeds three implies that large negative and positive returns are more likely than predicted by a normal distribution.

For Investment Professional Use Only
11
Capital Market AssumptionsCapital Market Assumptions
Risk Free Rate = 4% -- this is irrelevant but makes the picture easier to understand.
The after tax market price of risk (slope of the CAPM line) is 0.25. In other words, for every additional 4% risk, we pick up 15 return.
Skew is -0.75
• This is consistent with historical returns for the past twenty years and a globally diversified stock and bond portfolio ranging from 75/25 to 25/75.
• This conservative estimate models many investors’ inherent sensitivity to unfavorable outcomes.
Kurtosis is 4.0
• This is also consistent with historical returns used to estimate skew.
For Investment Professional Use Only
12
Utility vs. Risk for Various Leverage ValuesUtility vs. Risk for Various Leverage Values
0%
1%
2%
3%
4%
5%
6%
7%
8%
9%
10%
0% 5% 10% 15% 20% 25%
CAPMLeverage = 1Leverage = 1.5Leverage = 2Leverage = 4Leverage = 8

For Investment Professional Use Only
13
Consider a client with a position in a single security with no expectations that this security will do any better or worse than the market. Assume this security has average stock specific risk.
This notional client would need to expect that their single security would outperform the market by 860 bps annually for the next 5 years to have the same 5% level of VAR.
Concentrated Positions and Consequent RiskConcentrated Positions and Consequent RiskThere is no greater illustration of the power of diversification than the
potential negative outcomes of holding a single security position.
Return Risk Return Risk 5% VAR 10% VARDiversified Portfolio 10.0% 15% 61% 34% 5.9% 18.1%Concentrated Stock 10.0% 35% 61% 78% -67.7% -39.2%Risk Equivalent Return 18.6% 35% 135% 78% 5.9% 34.3%
5 Year HorizonAnnualized
Source: Placemark Investments
But how much will taxes burden the portfolio if transitioned?For Illustrative Purposes Only

For Investment Professional Use Only
14
Approaches to Tax ManagementApproaches to Tax Management
Never sell anything. This is typical of bank trust departments, even today.
Use end-of-year loss harvesting. This requires a manager that has overcome the reluctance to realize losses.
Use tax aware optimization to balance tax costs vs. tracking error and expected return.
• Passive strategies use an index, such as the Russell 1000, to ensure that gains will not be realized if the security .
• Active Strategies:
• Use an overlay to a designated manager allocation. Optimization postpones or loss-matches client portfolios to avoid short term capital gains. Realized alpha requires effective manager selection.
• Directly input stock or factor alphas into portfolio optimization. Realized alpha requires sufficient IC to offset trading costs.

For Investment Professional Use Only
15
“Variety of Security Returns”Northfield High Net Worth Conference 2008
Experience suggests that asset managers are unable to parameterize portfolio construction problems so as to provide an optimal balance between capital growth, risk control and tax avoidance for taxable investors
Dan asserts that the key to correctly balancing tax avoidance with risk adjusted returns is understanding the economic value of the option to realize capital gains at a time of the investor’s choosing
The value of the “tax timing” option is directly related to the expected cross-sectional dispersion (“variety”) of asset returns within the investor’s portfolio
Dan diBartolomeo’s three assertions concerning the management of taxable portfolios:

For Investment Professional Use Only
16
$1,000,000
$ -
$75,000
$ -
($75,000)
$0
$1,000,000
$ -
$ -
$75,000
$ -
$11,250
Client
End of Year Value $2,000,000
Realized Gains and Losses
Short-term Loss $ -
Short-term Gain $75,000
Long-term Gain $75,000
Long-term Loss ($75,000)
Taxes Due $26,500
Manager A
End of Year Value
Realized Gains and Losses
Short-term Loss
Short-term Gain
Long-term Gain
Long-term Loss
Taxes Due
Manager B
End of Year Value
Realized Gains and Losses
Short-term Loss
Short-term Gain
Long-term Gain
Long-term Loss
Taxes Due
Form 1040
Schedule D
Tax Management Requires Integrated Realization of Gains
and Losses
A Sample ClientA Sample Client’’s Tax Liabilitys Tax Liability
Hypothetical Example For Illustrative Purposes Only

For Investment Professional Use Only
17
A Hypothetical SimulationA Hypothetical SimulationA portfolio in January 1998 contains about 40 stocks that combine:
The remainder portion of a trust managed by a large New York bank’s trust department.
A retail account that was created by “building positions” by a major wire-house.
A few very large positions with very low cost basis that resulted from employment in the computer industry.
Stock Portfolio Weight
Cost Basis /Price
Portfolio 100.0% 14.4% IBM 30.2% 1.7% Boeing 16.2% 22.5% Sun Micro Systems 10.9% 1.6% Coca-Cola 9.2% 9.0%

For Investment Professional Use Only
18
Compare Four StrategiesCompare Four StrategiesBuy and Hold
Active management but ignoring taxes by reducing tax rates to zero.
Optimally rebalanced with taxation modeled as a transaction cost.
We relax the long-only constraint to improve both:
• The strategy’s transfer coefficient (Clarke, de Silva and Thorley [2002])
• The strategy’s tax efficiency:
• At 130/30, the initial rebalancing allows 30% fresh long positions with current cost basis. These positions are available for loss harvesting and replacing with “new ideas.”
• We can loss harvest most of the stocks on the short side of the portfolio in a rising market, and replace them with new short opportunities.

For Investment Professional Use Only
19
A Few IdeasA Few Ideas
The benchmark is the Northfield Fundamental Model Estimation Universe.• This simulates a multi-manager portfolio with allocations to large cap, small/mid-cap
and international ADR managers.
This benchmark is essentially the union of:• The Russell 3000
• The largest ADRs in the Northfield fundamental universe, with new additions added annually but most existing companies retained. This grows from about 200 to about 400 over the ten-year period.
Alternatively (but not simulated) we could use a cash or reduced market exposure benchmark:• Max R. Arai, “Market Returns without Downside Risk: The Difference Between Beta and the
Equity Premium,” Northfield Conference at Key Largo, 2007
• Mike Knezevich, “The Beginner’s Guide to Taxable Portfolio Optimization,” Northfield High Net Worth Seminar, January 2008.
• “You can express both by mixing cash into the benchmark. If the client is twice as worried about absolute risk and return, make the benchmark 2/3 cash and 1/3 your regular benchmark index”

For Investment Professional Use Only
20
Ideas for Active ManagementIdeas for Active Management
Let’s assume that we believe that we can manage a wide range of securities using active strategies:• Internal research and rankings
• Stock rankings from Starmine, QSG, Ford, Columbine, etc.
• Factor alphas such as fundamental tilts that can be directly entered in the Northfield model file:*
• Value– Price/Earnings – 25%
– Price/Sales – 15%
– Price/ Book – 15%
– Dividends – 15%
• Growth– EPS Share Growth – 15%
– Momentum – 15%
We do not mean to imply that we have any faith that these tilts will succeed in the future.
These tilts did work in the past and we use them to simulate active management with at a reasonably high level of skill.
* If you do this at home: Make Sure you modify a copy of the Model file and not the one sent by Northfield!

For Investment Professional Use Only
21
The Performance of the The Performance of the ““Factor PortfolioFactor Portfolio””P e rfoma nce Compa rison Gra ph
Monthly Rebalancing
Date2007/122007/062006/122006/062005/122005/062004/122004/062003/122003/062002/122002/062001/122001/062000/122000/061999/121999/061998/121998/061997/12
Inde
x
136
134
132
130
128
126
124
122
120
118
116
114
112
110
108
106
104
102
100

For Investment Professional Use Only
22
Fund Name
S&P Citi Global Broad
Market Error*
Northfield Fundamental
Universe Error*
Russell 1000 Value 22.42 0.65 24.64 1.50 Russell 1000 Growth 23.93 0.58 36.43 1.33 Russell 2000 5.35 0.53 12.27 1.23 S&P/Citi Primary Growth World xU.S. 17.72 1.26 22.82 2.91 S&P/Citi Primary Value World xU.S. 14.94 1.44 0.00 3.34 S&P/Citi Emerging Markets 3.71 0.39 3.84 0.91 S&P/Citi Extended Markets World xU.S. 11.94 1.16 0.00 2.69
Tracking Error: 1.38 0.60
Comparing the Style Coefficients:Northfield Factor Model Estimation Universe
S&P Broad Market Global Index
What’s Missing in the NIS Universe:Non US Value StocksNon US Small Cap Stocks
What’s Missing in the S&P GBMI:½ Domestic Small Cap Stock Weight

For Investment Professional Use Only
23
NIS Fundamental Universe vs. World ProxyNIS Fundamental Universe vs. World Proxy
Fund Name Style Wt.% Error*
Northfield Fundamental Universe 66.50 1.30 S&P/Citi Primary Value World xU.S. 24.15 1.98 S&P/Citi Extended Market World xU.S. 9.35 1.80
Tracking Error: 1.05
Using S&P/Citi Indices
Using DFA Funds
Fund Name Style Wt.% Error*
Northfield Fundamental Universe 74.74 1.40 DFA Tax Managed International Value 19.87 2.19 DFA International Small Company 5.38 1.82
Tracking Error: 1.30
What Weights Do You Need in Complementary Fundsto best fit the S&P Broad Market Global Index?

For Investment Professional Use Only
24
Statistical Comparison of Management StrategiesStatistical Comparison of Management Strategies
Statistic Bench-mark
Buy &Hold
IgnoreTax
Long Only
130 / 30
Gross Return 8.78% 9.41% 14.87% 14.46% 17.34% Capital Gains Tax Drain: Trading 0.00% 0.00% 2.26% 0.29% 0.50% Capital Gains Tax Drain: Corporate Events 0.38% 0.38% 0.38% 0.38% 0.38% Dividend Tax Drain 0.34% 0.18% 0.27% 0.28% 0.23% Transaction Cost 0.00% 0.00% 0.50% 0.22% 0.55% Net Return 8.07% 8.86% 11.47% 13.30% 15.68%Volatility, Standard Deviation of Returns 15.70% 24.82% 19.02% 16.90% 17.13%Skew -0.76 -0.39 -0.65 -0.73 -0.60 Kurtosis 3.93 3.30 3.96 4.36 3.60 Leverage 1.50 1.50 1.50 1.50 1.50 Wilcox’s Utility 4.76% -1.33% 6.01% 9.16% 11.76%

For Investment Professional Use Only
25
Comparison of Tax Efficient StrategiesComparison of Tax Efficient Strategies
Buy & Hold
Ignore Tax
Long Only
130 / 30
Initial Optimization Tracking Error 18.50 8.24 6.41 6.61 Average Optimum Tracking Error 18.50 8.18 6.21 6.37 Realized Tracking Error 12.82 6.96 5.92 6.13 Factor / Total Variance 0.37 0.58 0.36 0.32 Average Pre-Optimization Ex-Ante Alpha -0.63 10.75 5.14 7.10 Average Post Optimization Ex-Ante Alpha -0.63 11.43 5.55 7.75 Realized Alpha 2.64 6.12 5.64 8.52 Factor / Total Alpha 132% 120% 91% 59% Annual Tax Drain 0.52% 2.26% -0.29% 0.25% Effective IC -1.37% 2.81% 2.85% 3.28% Annual Turnover 0.30 99.11 43.90 109.52

For Investment Professional Use Only
26
Comparison of Sector Exposures: 1998Comparison of Sector Exposures: 1998--20072007
Factor Bench-
markBuy &
HoldIgnore
TaxLongOnly
130 /30
Material 3.65 0.00 5.91 4.91 4.32Industrial 18.99 15.39 19.52 19.21 7.77Telecommunication 10.12 0.72 6.23 7.27 9.68Consumer Discretionary 10.52 10.53 9.74 11.92 12.84Consumer Staples 11.76 5.48 4.41 11.77 6.68Energy 8.51 1.32 7.09 8.97 7.94Financials 13.14 1.57 23.13 11.90 19.70Health Care 4.74 3.77 5.70 5.55 11.20Information Technology 12.44 61.20 12.01 13.66 15.99Utilities 6.14 0.00 6.26 4.84 3.88
Sector Exposures in Red Are More than 5% Active Weight to the Benchmark

For Investment Professional Use Only
27
Comparison of Fundamental Exposures: 1998Comparison of Fundamental Exposures: 1998--20072007
Factor Bench-mark
Buy &Hold
IgnoreTax
Long Only
130 / 30
Price/Earnings 23.58 28.26 10.50 14.35 12.31Price/Books 2.95 5.24 1.46 1.94 1.73Dividend Yield 1.68 0.89 1.34 1.40 1.15Trading Activity 0.09 0.13 0.13 0.11 0.11Relative Strength 1.13 1.15 1.23 1.24 1.27Market Cap 69,442 109,037 43,148 57,013 67,689Earnings Variability 0.43 0.45 0.34 0.41 0.32EPS Growth Rate 13.98 13.86 21.93 16.26 19.23Price/Revenue 1.49 1.70 0.59 0.78 0.75Debt/Equity 0.71 0.58 0.62 0.60 0.43Price Volatility 0.23 0.25 0.27 0.26 0.26
Factor Exposures in Red Are More than One Sigma from Benchmark

For Investment Professional Use Only
28
ConclusionsConclusionsTax efficient investing minimizes net short term capital gains while allowing the investor the option as to whether to realize long term capital gains:• Based on information not available at previous rebalancing opportunities.
• Maximizing utility as a function of benchmark tracking error, returns expectations and tax costs.
Tax efficient investing can be effectively implemented using a uniform managed account.• Overlay management derives alpha (IR > 0) from skill in manager selection.
A broad investment universe improves both breadth and variety (cross sectional dispersion) which in turn improves the ability to time loss and gain realization.• This can be accomplished in an multi-manager overlay by including managers with a
variety of style, market capitalization and geographic diversity.
Use of 1X0/X0 allocations allow a higher breadth and greater opportunity for loss harvesting, particularly when combined with a highly concentrated initial portfolio with a low cost basis.

For Investment Professional Use Only
29
Slide Summary for Review PurposesSlide Summary for Review Purposes
Slides 2-3: Background on who needs tax management
Slides 4-6: Literature summary
Slides 7-8: Long term vs. short term capital gains
Slides 9-12: Wilcox’s discretionary wealth hypothesis
Slide 13: The risks of a concentrated stock position
Slide 14-16: Approaches to tax-efficient management
Slide 17-19: A Hypothetical simulation
Slides 20-21: Benchmark, constraints, strategies, alphas
Slides 22-23: Compare Benchmark to global portfolio using returns based style analysis
Slides 24-25: Compare rebalancing strategies risk and return characteristics
Slides 26-27: Compare rebalancing strategies fundamental and sector exposures
Slide 28: Conclusions