managing growth – redesigning the ed experience through a
TRANSCRIPT
Emergency Services
Process Redesign Report Card
One Year Later….
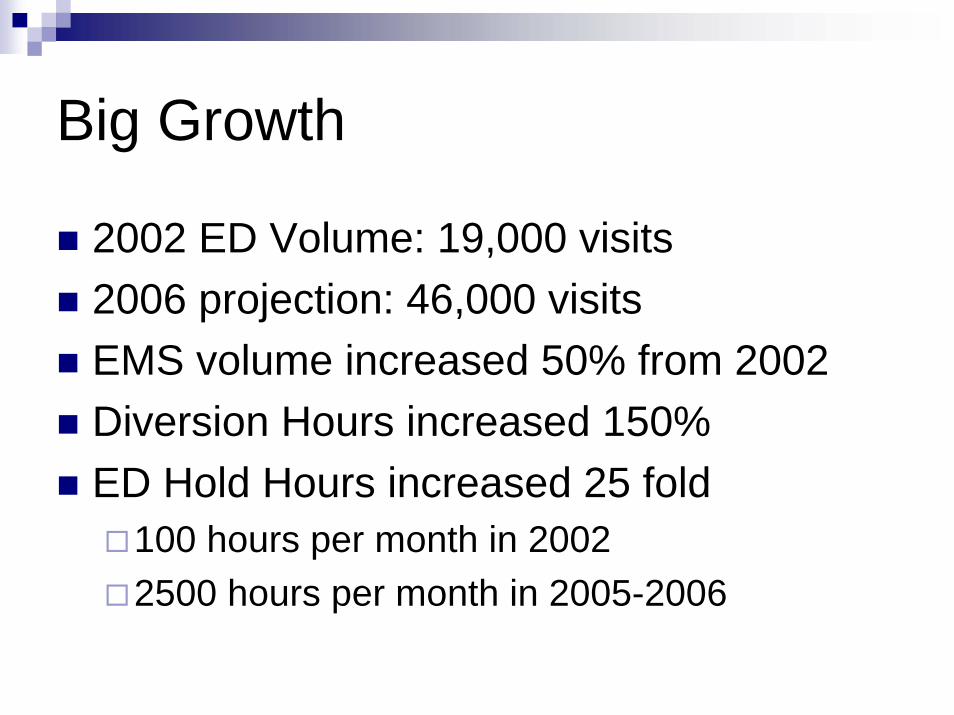
Big Growth
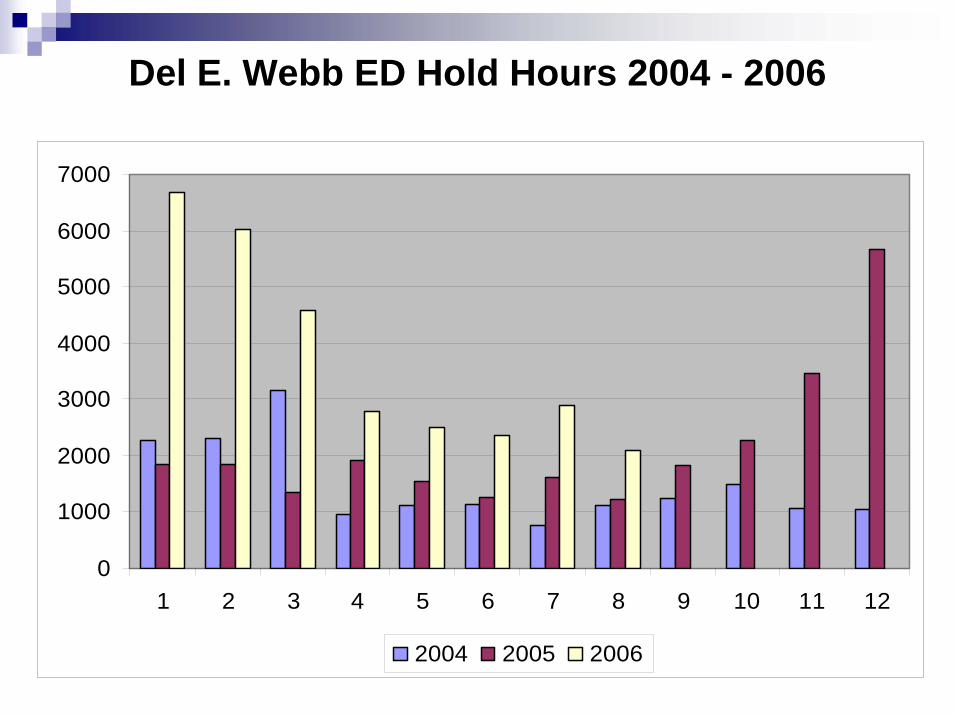
2002 ED Volume: 19,000 visits2006 projection: 46,000 visitsEMS volume increased 50% from 2002Diversion Hours increased 150%ED Hold Hours increased 25 fold
100 hours per month in 20022500 hours per month in 2005-2006
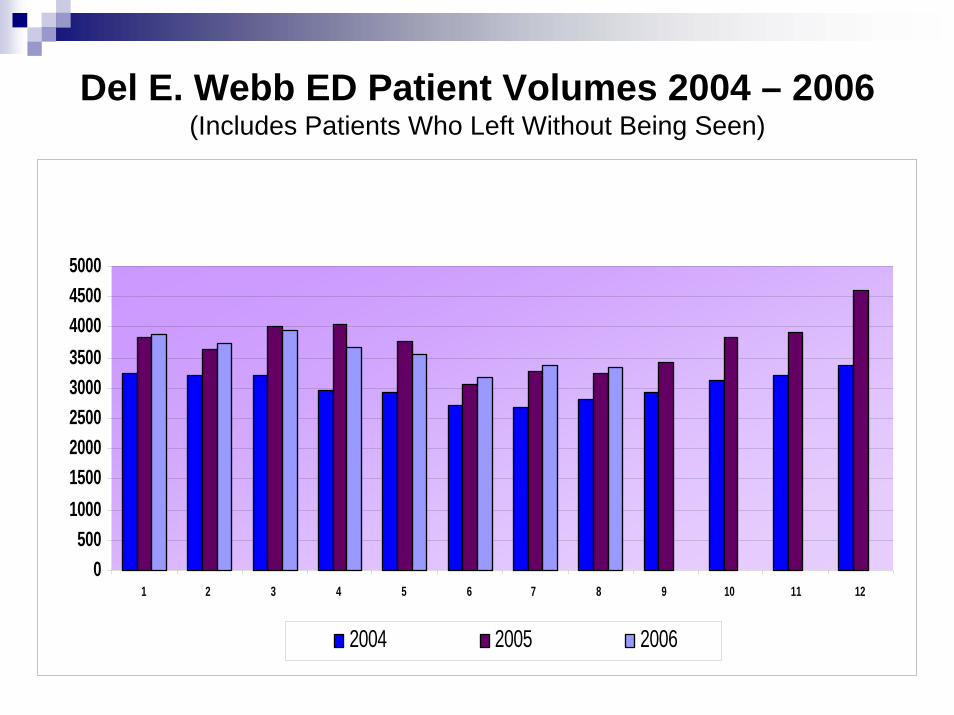
Del E. Webb ED Patient Volumes 2004 – 2006 (Includes Patients Who Left Without Being Seen)
0500
100015002000250030003500400045005000
1 2 3 4 5 6 7 8 9 10 11 12
2004 2005 2006

Del E. Webb ED EMS Volumes 2004 - 2006
0
100
200
300
400
500
600
700
800
900
1 2 3 4 5 6 7 8 9 10 11 122004 2005 2006
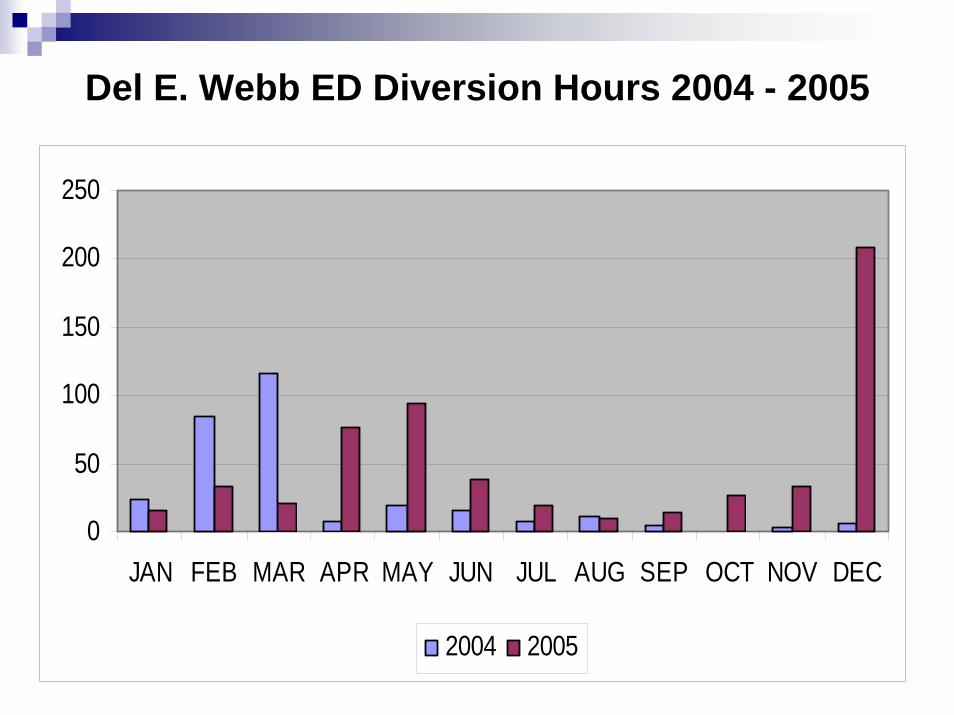
Del E. Webb ED Diversion Hours 2004 - 2005
0
50
100
150
200
250
JAN FEB MAR APR MAY JUN JUL AUG SEP OCT NOV DEC
2004 2005
0
1000
2000
3000
4000
5000
6000
7000
1 2 3 4 5 6 7 8 9 10 11 12
2004 2005 2006
Del E. Webb ED Hold Hours 2004 - 2006
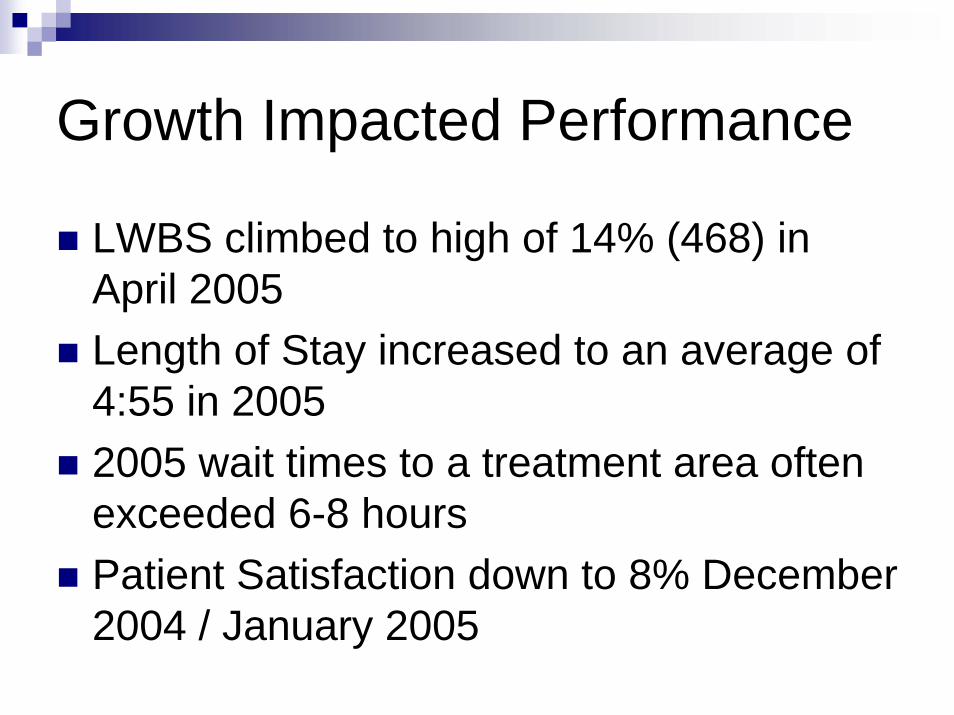
Growth Impacted Performance
LWBS climbed to high of 14% (468) in April 2005Length of Stay increased to an average of 4:55 in 20052005 wait times to a treatment area often exceeded 6-8 hoursPatient Satisfaction down to 8% December 2004 / January 2005
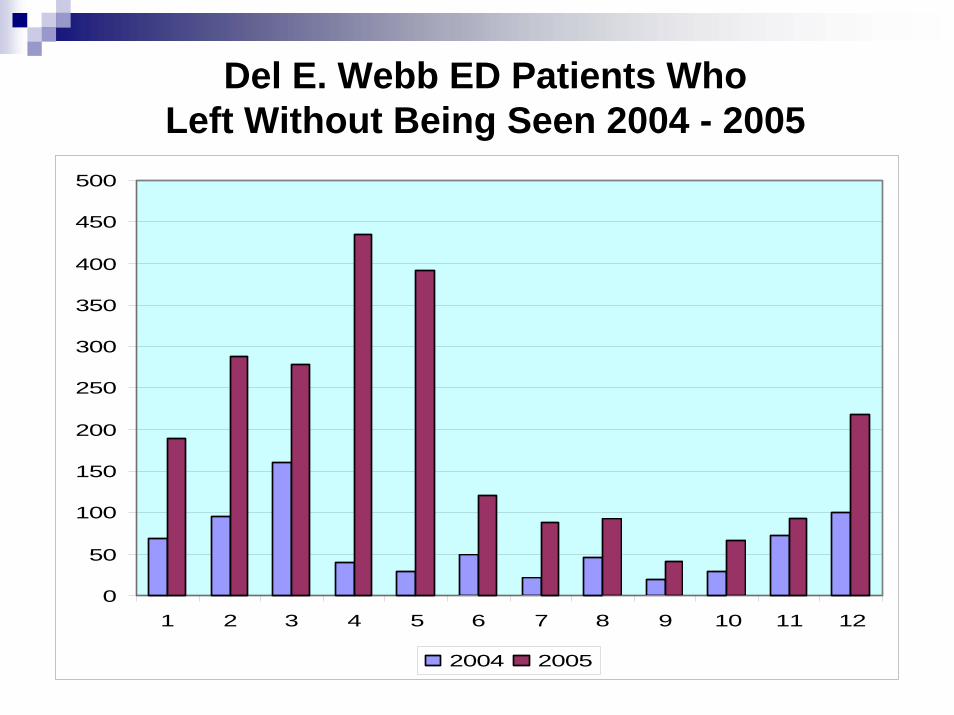
Del E. Webb ED Patients Who Left Without Being Seen 2004 - 2005
0
50
100
150
200
250
300
350
400
450
500
1 2 3 4 5 6 7 8 9 10 11 12
2004 2005
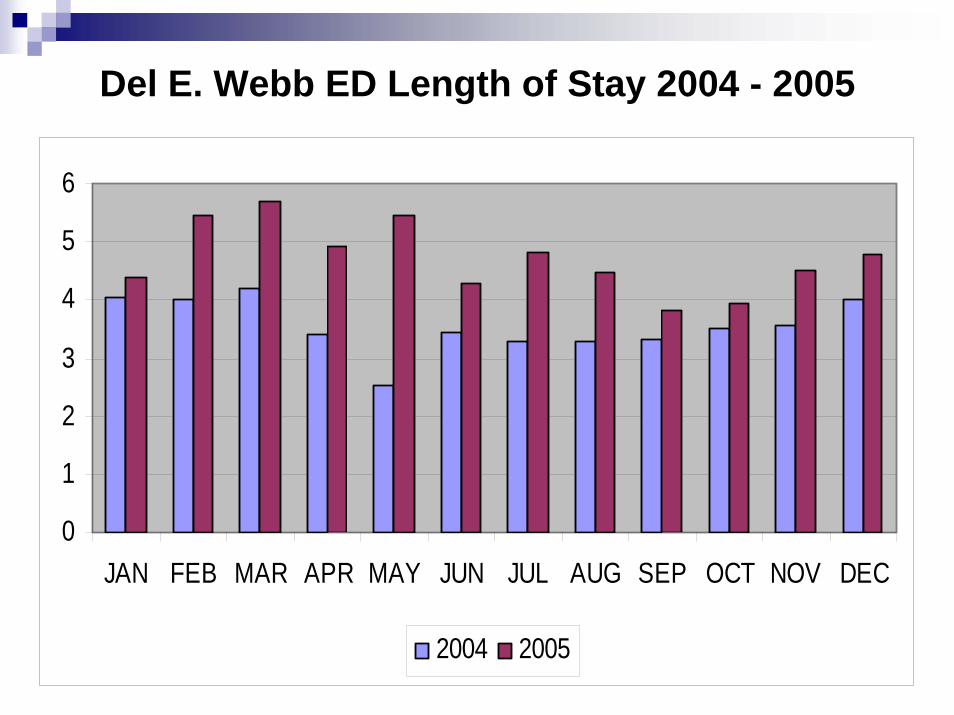
Del E. Webb ED Length of Stay 2004 - 2005
0
1
2
3
4
5
6
JAN FEB MAR APR MAY JUN JUL AUG SEP OCT NOV DEC
2004 2005
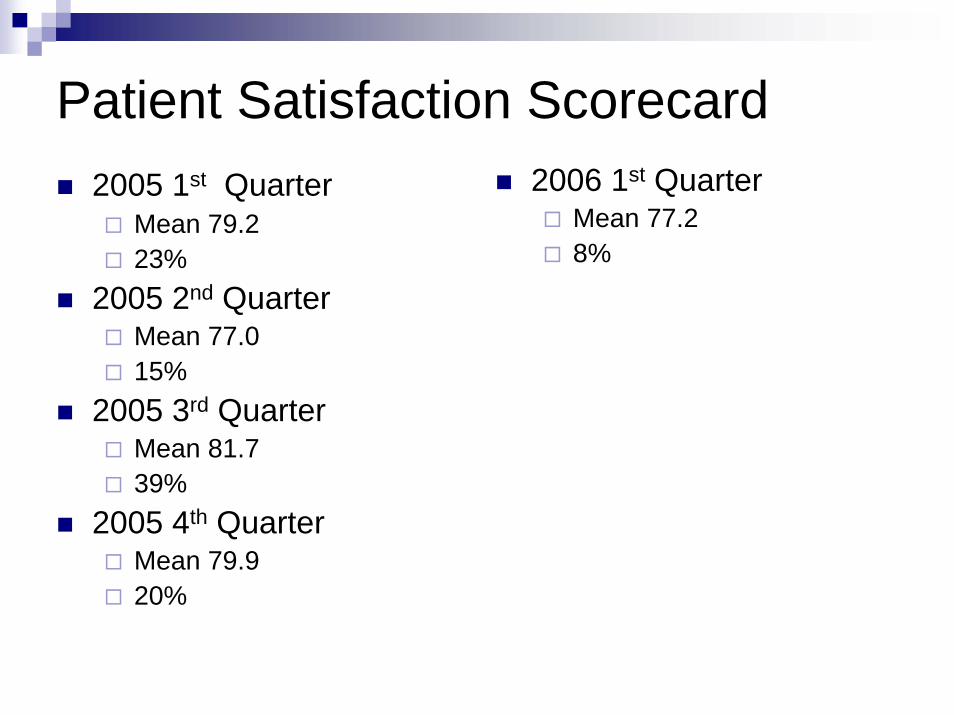
Patient Satisfaction Scorecard2005 1st Quarter
Mean 79.223%
2005 2nd QuarterMean 77.015%
2005 3rd QuarterMean 81.739%
2005 4th QuarterMean 79.920%
2006 1st QuarterMean 77.28%
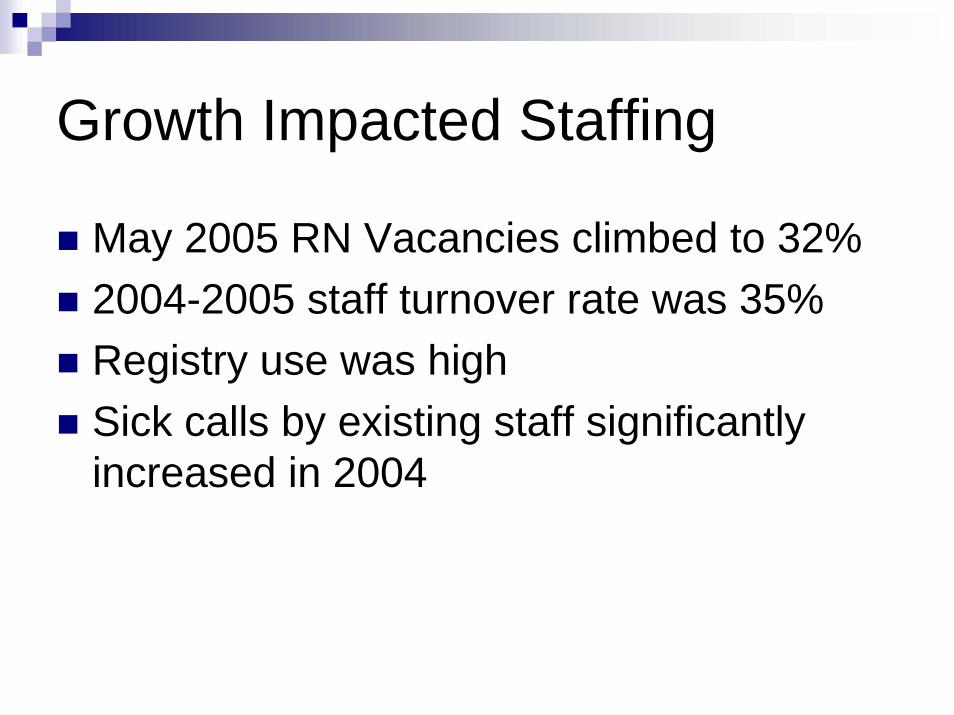
Growth Impacted Staffing
May 2005 RN Vacancies climbed to 32%2004-2005 staff turnover rate was 35%Registry use was highSick calls by existing staff significantly increased in 2004
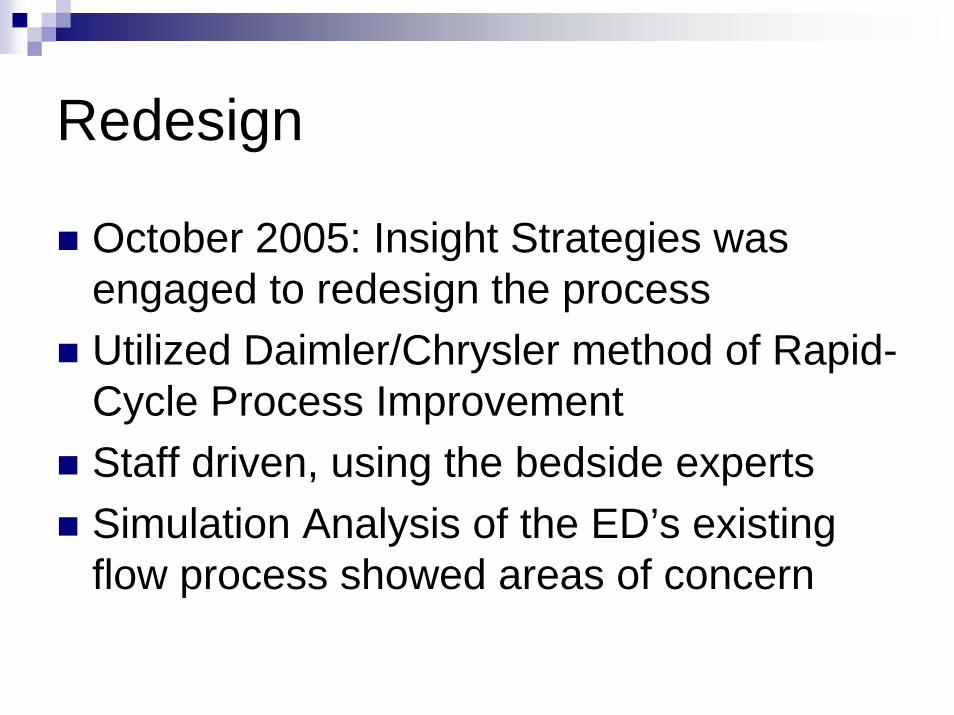
Redesign
October 2005: Insight Strategies was engaged to redesign the processUtilized Daimler/Chrysler method of Rapid-Cycle Process ImprovementStaff driven, using the bedside expertsSimulation Analysis of the ED’s existing flow process showed areas of concern
Process Redesign Assumptions
Patients come to ED for only one reason-to see a physicianTriage means there is already a delayNot every patient needs to own a bedGreatest risk to patients and hospital is a full lobby
New Process
Triage eliminatedIntake Process established where patients are immediately taken to exam room or bedPhysician sees patient within 15 minutes of arrivalPatient moves within ED depending upon condition and workupFlexible
Results
One Year Later…

Del E. Webb ED Diversion Hours 2004 - 2006
0
50
100
150
200
250
JAN FEB MAR APR MAY JUN JUL AUG SEP OCT NOV DEC
2004 2005 2006
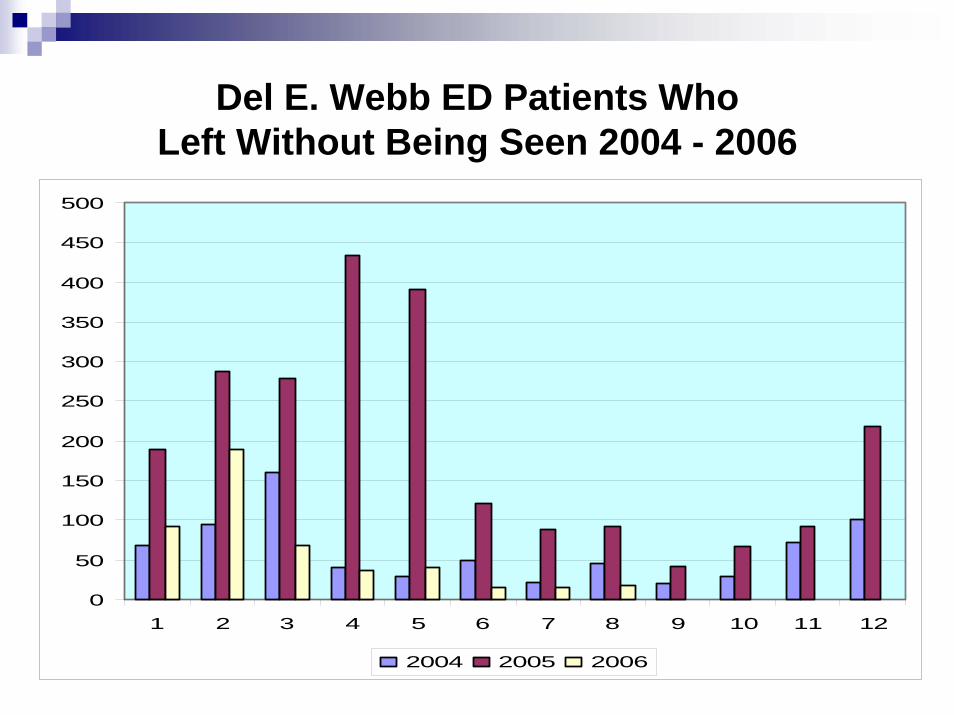
Del E. Webb ED Patients Who Left Without Being Seen 2004 - 2006
0
50
100
150
200
250
300
350
400
450
500
1 2 3 4 5 6 7 8 9 10 11 12
2004 2005 2006
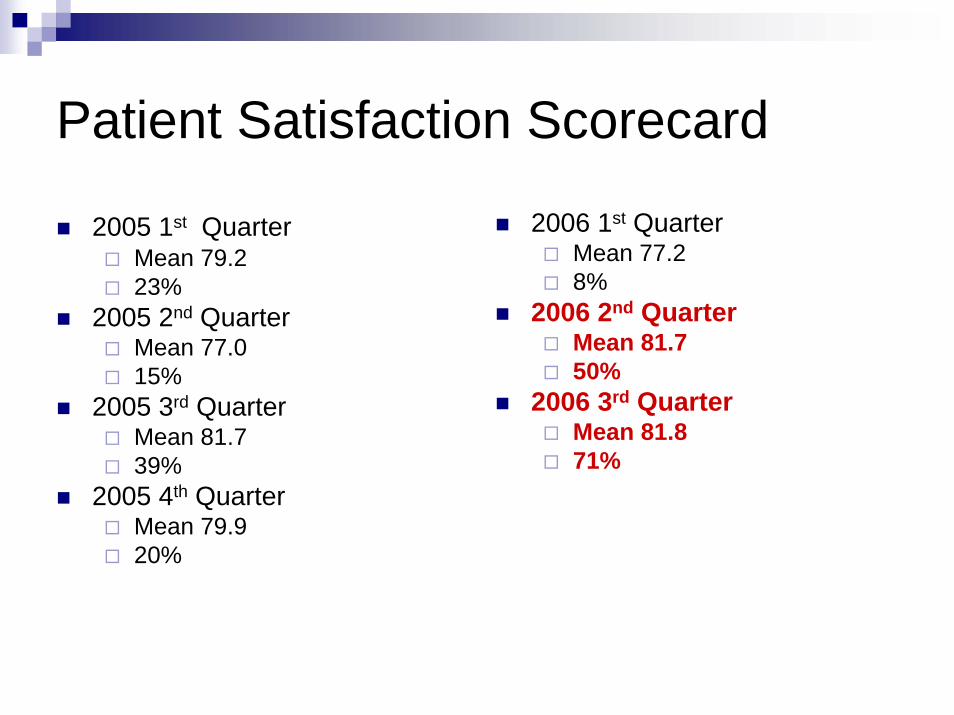
Patient Satisfaction Scorecard
2005 1st QuarterMean 79.223%
2005 2nd QuarterMean 77.015%
2005 3rd QuarterMean 81.739%
2005 4th QuarterMean 79.920%
2006 1st QuarterMean 77.28%
2006 2nd QuarterMean 81.750%
2006 3rd QuarterMean 81.871%
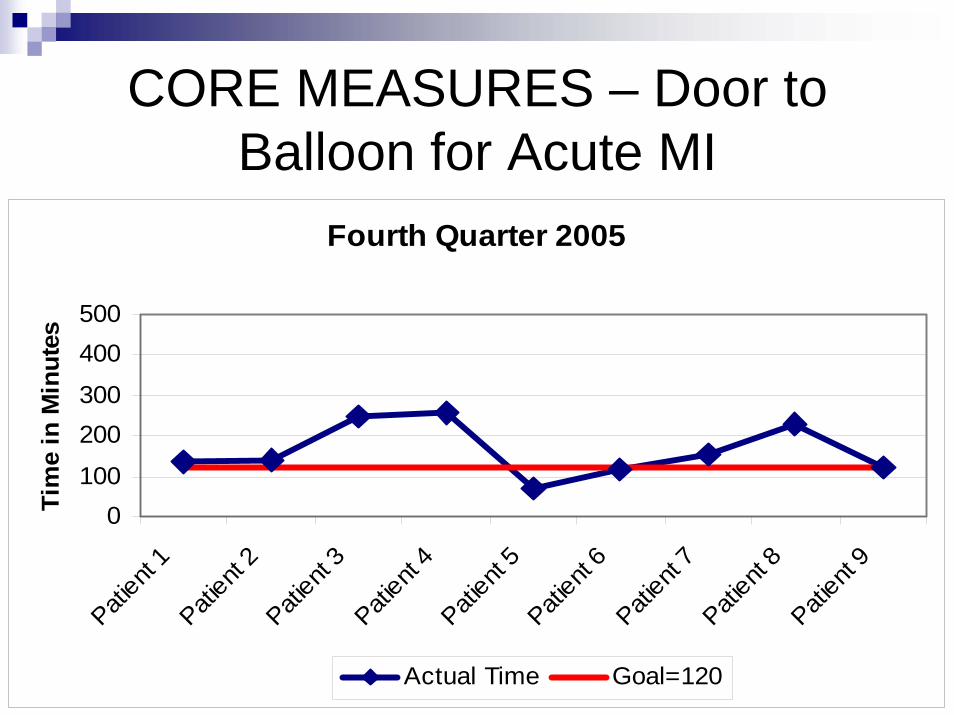
CORE MEASURES – Door to Balloon for Acute MI
Fourth Quarter 2005
0100
200300
400500
Patient
1Pati
ent 2
Patient
3Pati
ent 4
Patient
5Pati
ent 6
Patient
7Pati
ent 8
Patient
9Ti
me
in M
inut
es
Actual Time Goal=120
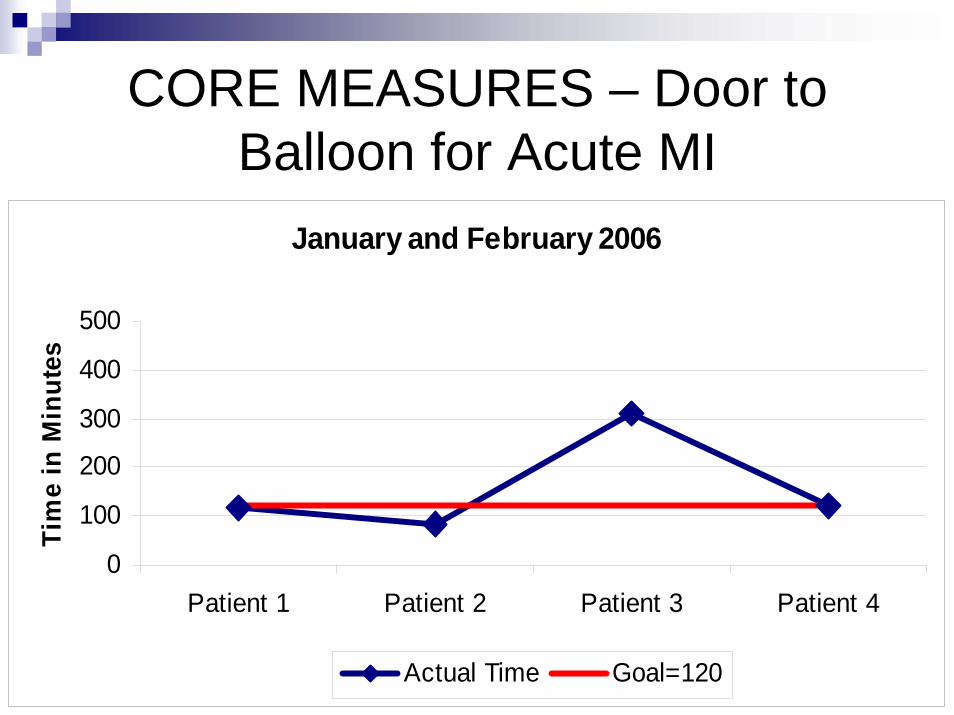
CORE MEASURES – Door to Balloon for Acute MI
January and February 2006
0
100
200
300
400
500
Patient 1 Patient 2 Patient 3 Patient 4
Tim
e in
Min
utes
Actual Time Goal=120
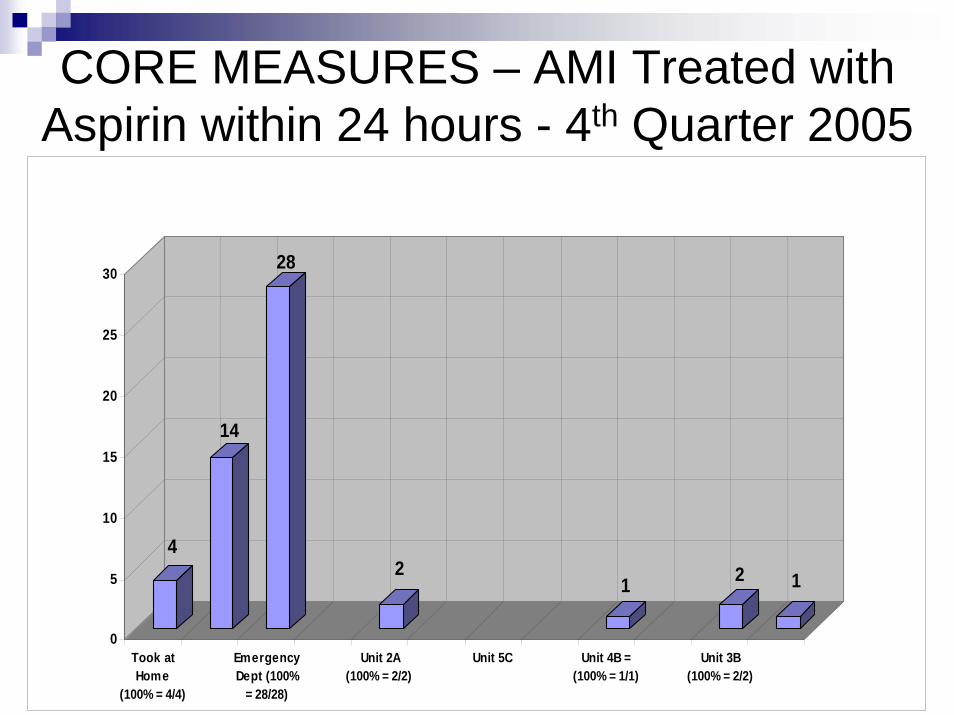
CORE MEASURES – AMI Treated with Aspirin within 24 hours - 4th Quarter 2005
4
14
28
21 2 1
0
5
10
15
20
25
30
Took atHome
(100% = 4/4)
EmergencyDept (100%
= 28/28)
Unit 2A(100% = 2/2)
Unit 5C Unit 4B =(100% = 1/1)
Unit 3B(100% = 2/2)
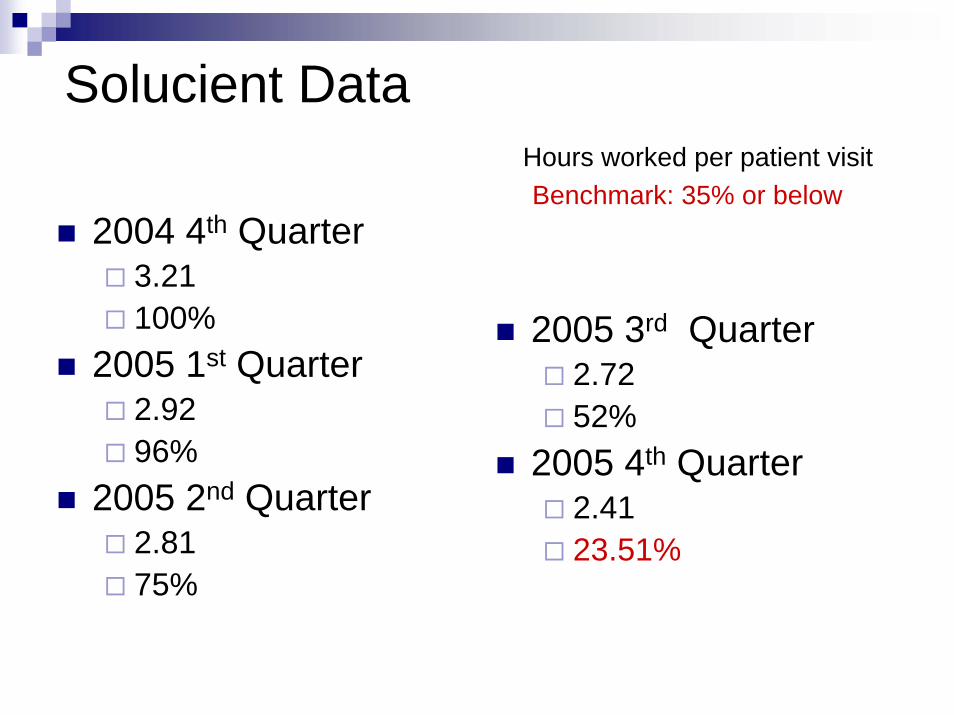
Solucient DataHours worked per patient visitBenchmark: 35% or below
2004 4th Quarter3.21100%
2005 1st Quarter2.9296%
2005 2nd Quarter2.8175%
2005 3rd Quarter2.7252%
2005 4th Quarter2.4123.51%
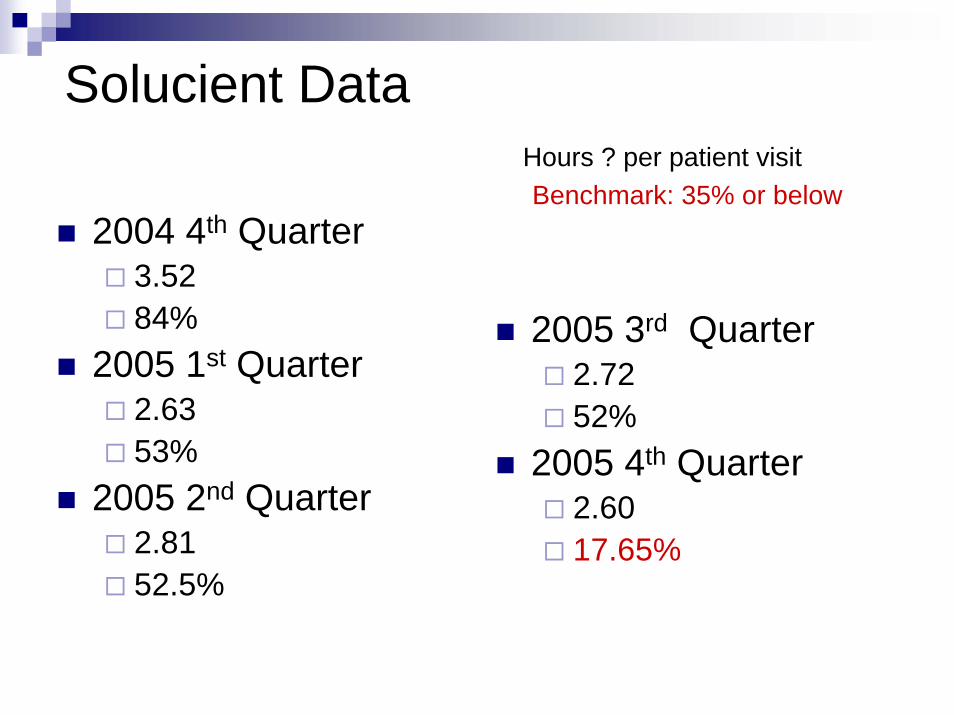
Solucient DataHours ? per patient visitBenchmark: 35% or below
2004 4th Quarter3.5284%
2005 1st Quarter2.6353%
2005 2nd Quarter2.8152.5%
2005 3rd Quarter2.7252%
2005 4th Quarter2.6017.65%
Results
100% filled positions Marked decrease in registry useStaff sick time has decreased from average of 96 to 8 hours per pay periodGreat relationships with local EMSWAITING ROOM IS EMPTY!!!
Unexpected Result:Staff Engagement
Shared leadership with active participation at every levelStaff engaged in creative problem solvingNo longer bound by staffing ratios—greater workload with greater job satisfaction!Staff passing the excitement onto other departments: “Build a Bridge” program

The Final Puzzle Piece
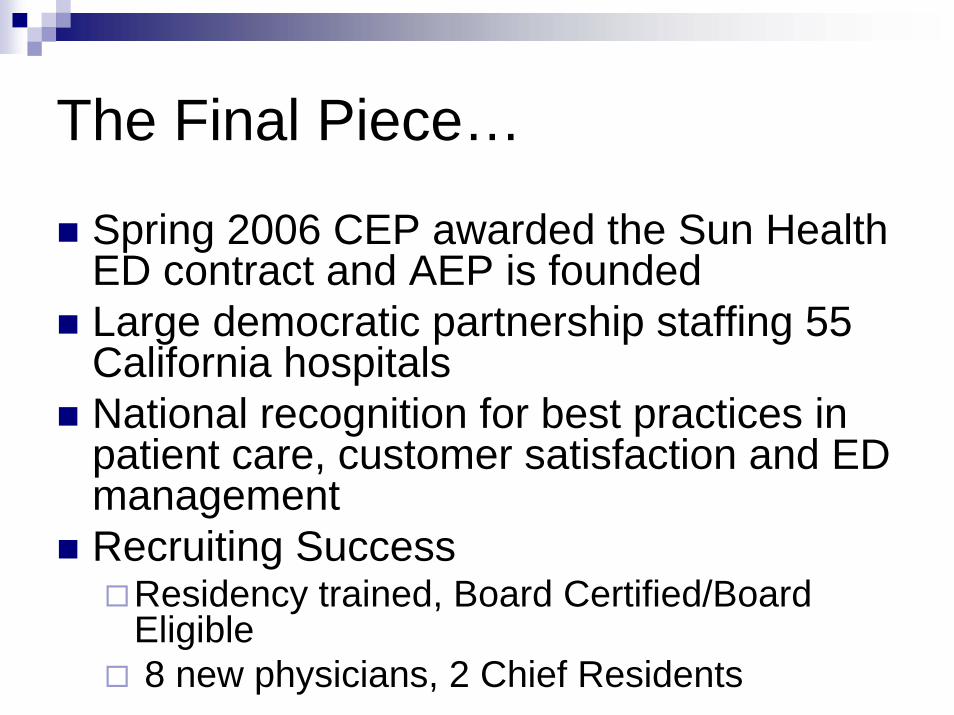
The Final Piece…
Spring 2006 CEP awarded the Sun Health ED contract and AEP is foundedLarge democratic partnership staffing 55 California hospitalsNational recognition for best practices in patient care, customer satisfaction and ED managementRecruiting Success
Residency trained, Board Certified/Board Eligible8 new physicians, 2 Chief Residents
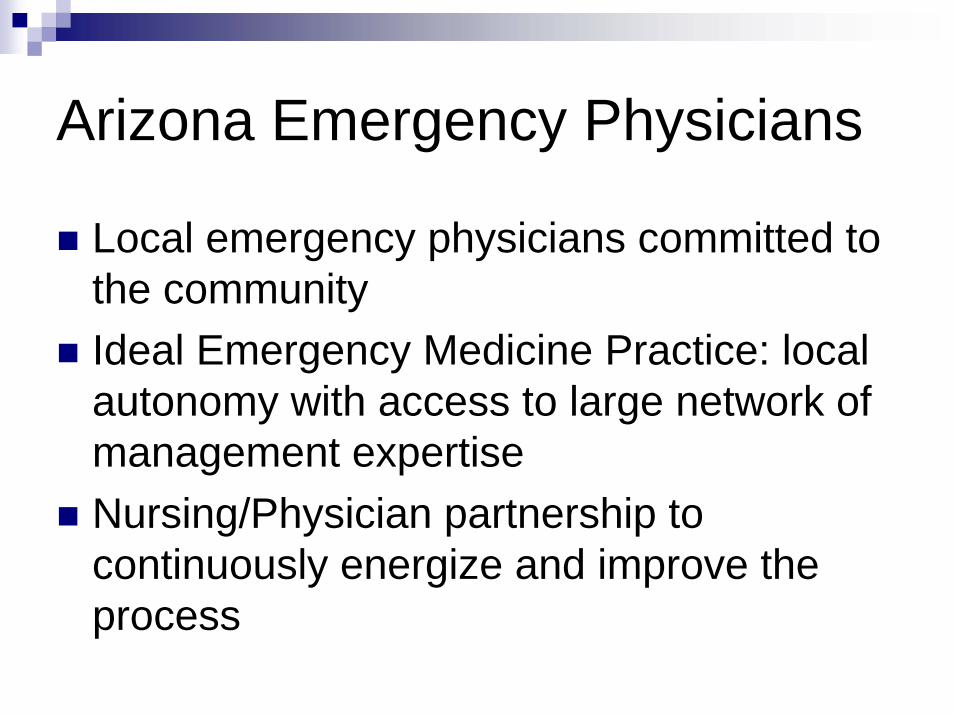
Arizona Emergency Physicians
Local emergency physicians committed to the communityIdeal Emergency Medicine Practice: local autonomy with access to large network of management expertiseNursing/Physician partnership to continuously energize and improve the process

Rising to Future Challenges
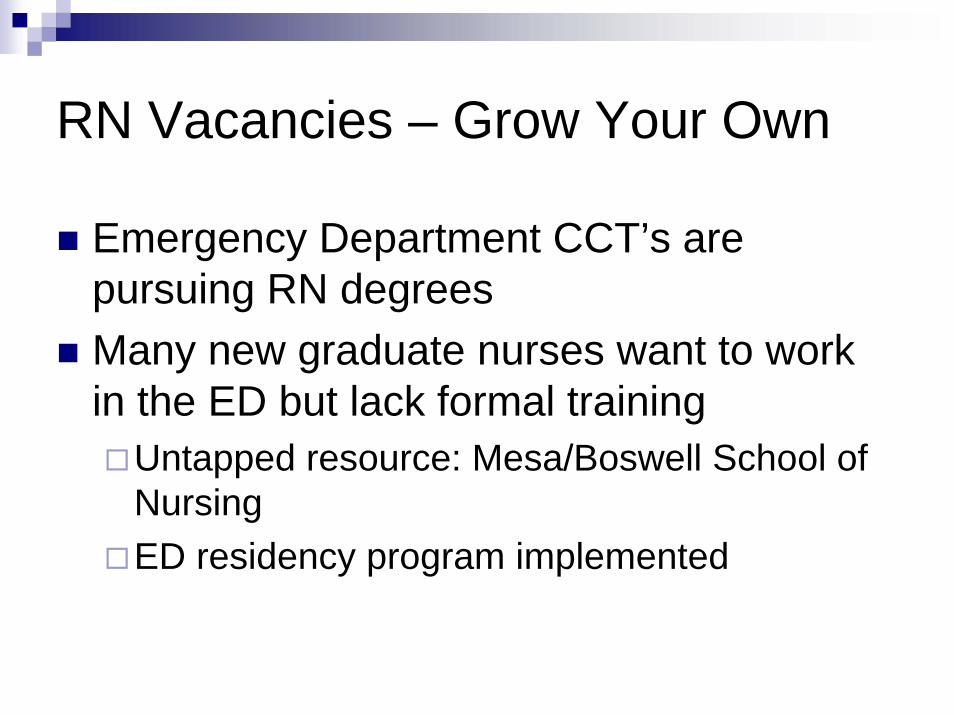
RN Vacancies – Grow Your Own
Emergency Department CCT’s are pursuing RN degreesMany new graduate nurses want to work in the ED but lack formal training
Untapped resource: Mesa/Boswell School of NursingED residency program implemented
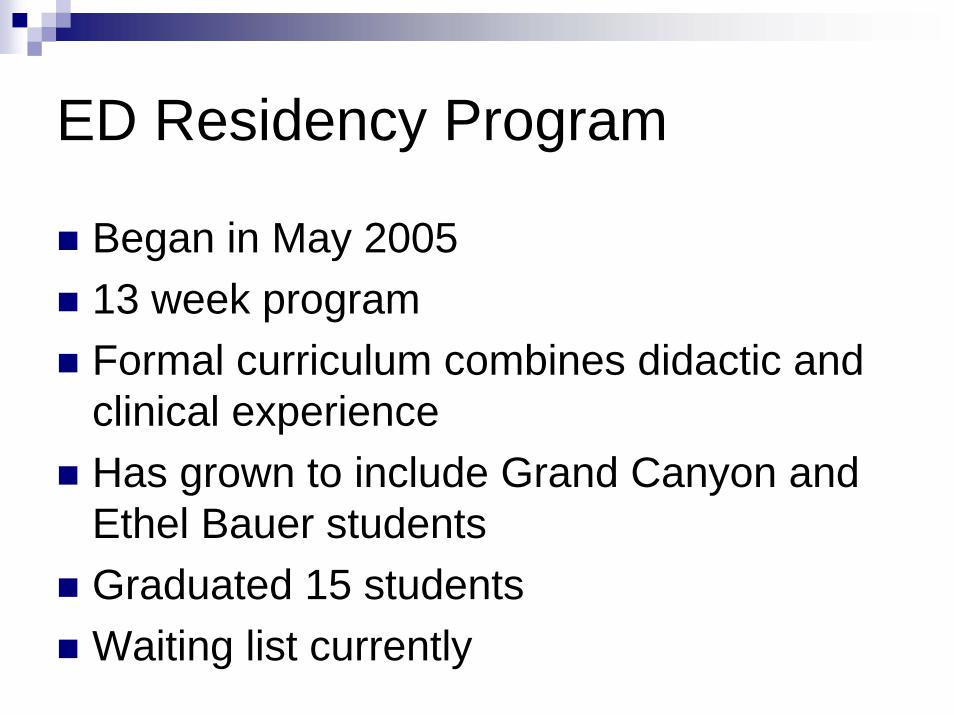
ED Residency Program
Began in May 200513 week programFormal curriculum combines didactic and clinical experienceHas grown to include Grand Canyon and Ethel Bauer students Graduated 15 studentsWaiting list currently

EMS Results
2 actual community disasters 2006Voluntary EMS response with several 7- man battalions
Multiple new Fire Stations planned5 additional stations in Surprise by 20083 new Fire Stations in Buckeye 2007
Cultivate Staff/EMS RelationsGreen Chile cook off, baseball games, EMS appreciation week - huge staff involvement

Regulatory Changes
2006 EMTALA Changes
Off-load of ambulances within “reasonable” time: 15 minutes in Phoenix areaDelays in off-loads can result in fines under the EMTALA umbrella
Response to EMTALA Changes
Staging concept based on disaster protocolsPhysicians go to staging area“Pit Crew” concept
Rising to Other Challenges …
No DiversionDisaster ManagementChest Pain CenterBed Placement Process – Right Patient, Right BedPICIS – IT project
Rising to Other Challenges…
Patient SatisfactionThank you cardsNurse CouncilSTEMI Project

Thank You for your support!
Any Questions?